Measuring the Dynamical State of the Internet: Large Scale Network Tomography via the ETOMIC Infrastructure
In this paper we show how to go beyond the study of the topological properties of the Internet, by measuring its dynamical state using special active probing techniques and the methods of network tomography. We demonstrate this approach by measuring …
Authors: Gabor Simon, Jozsef Steger, Peter Haga Istvan Csabai
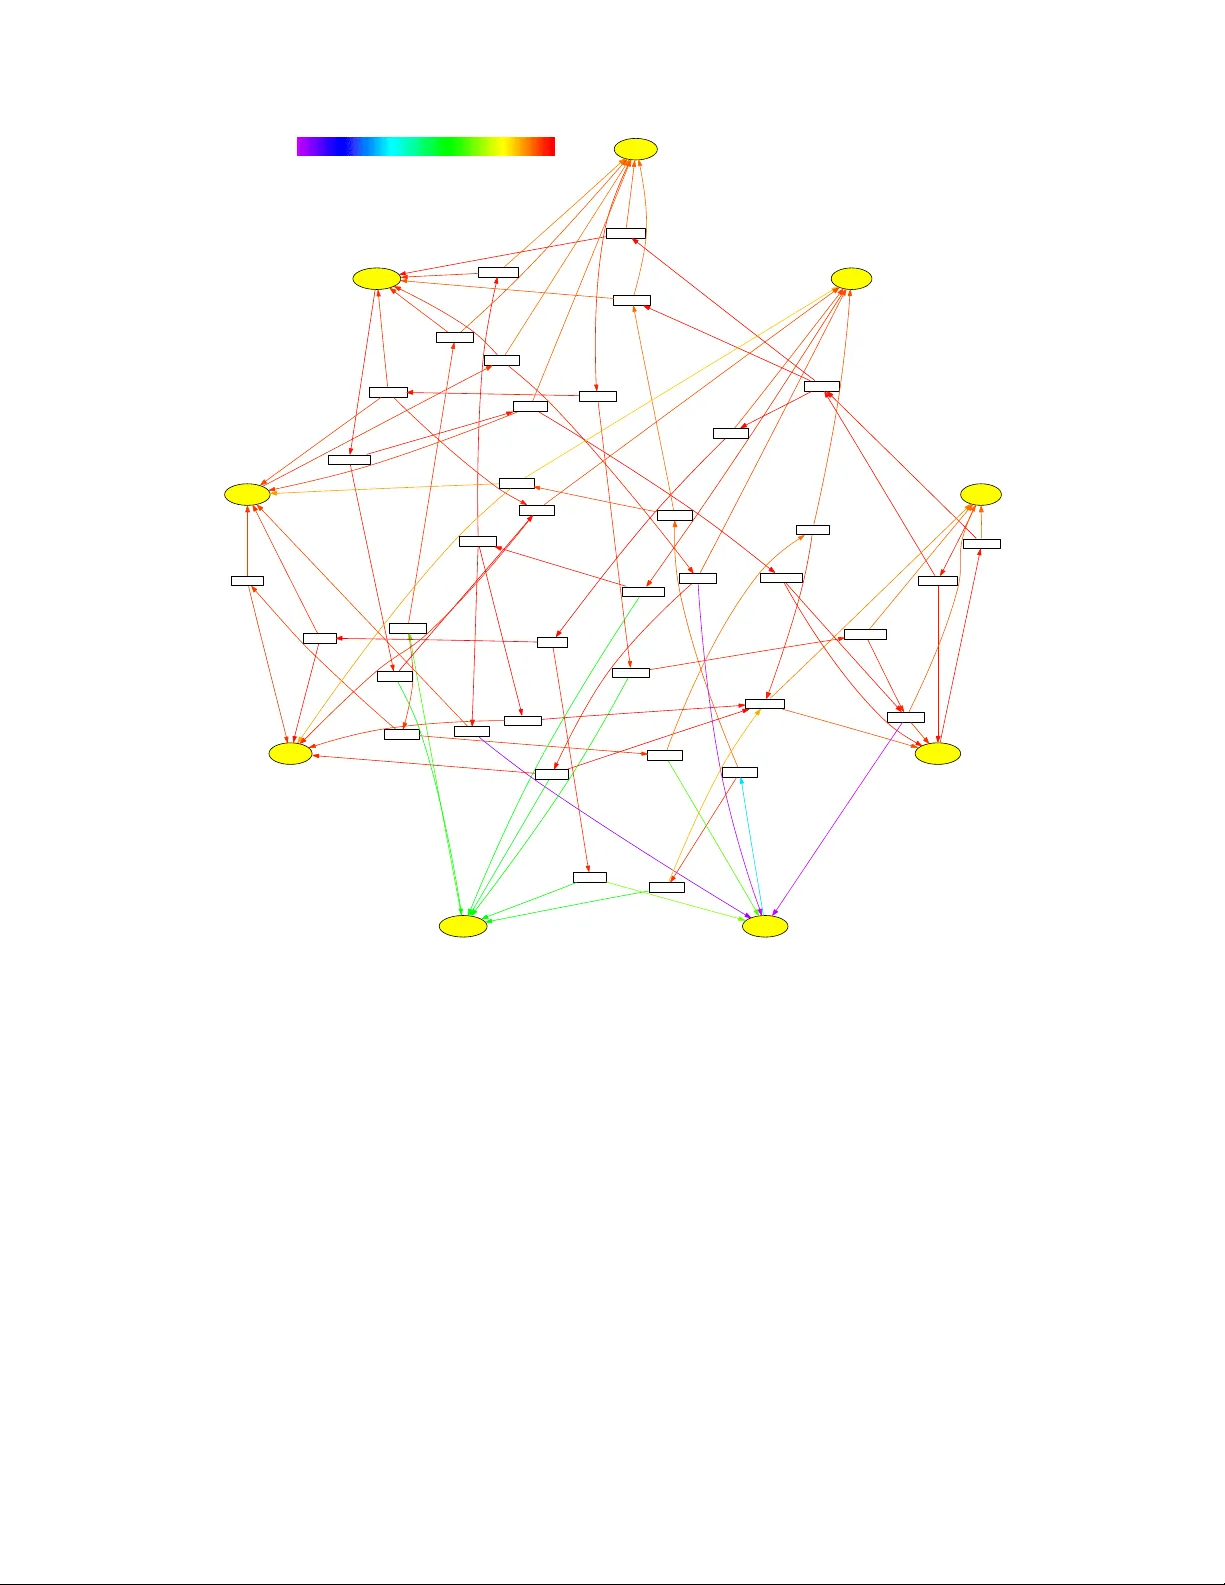
1 Measuring the Dynamical State of the Internet: Large Scale Net w ork Tomography via the E TOMIC Infrastructure Gábor Simon a,b József Stéger a,b Péter Hága a István Csabai a,b Gábor Vattay a,b a Department of Physics of Comple x Systems, Eötvös Loránd University , Budapest, Hungary; b Collegium Budapest Institut e for Ad vanced Study, Budapest, Hungary Short Title Measuring the Dynamical Stat e o f the Internet Key Words Complex networks, Internet, Network t omo graphy, Queueing de lay distri bu tions. Abstract In this paper we show how to g o bey ond t he study o f the topological properties of the Internet, by measuring its dynam ical state using special active probing techni ques and the methods of ne t wo rk tomography. We d emo ns trate this approach by me asuri ng the key state parameters of Inter ne t paths, the characteristics of q ueueing d elay, in a part of the European Internet. In the p aper w e d escribe in de tail the ETOMIC measurement p latform that w as used to conduct the experiments, a nd the applied method of queueing d elay tomography. Th e main results of the paper are maps showing various spatial structure in the characteristics of queueing delay c orresponding to the resolved part of the Europea n Internet. Th ese maps reveal th at the average qu eueing delay o f network segments spans more than t wo orders of magnitude, and that th e distribution of this quan tit y is very w ell fitted by the log-normal distribution. Corresponding Author Dr. Gábor Simon Department of Physics of Com plex Systems, Eötvös Loránd University H-1518 Budapest Pf.: 32, Hungary. Tel:+36 1 3722896, Fax: +36 1 3 7228 66 E-mail gaba@complex.elte.hu 2 Introduction Internet is a co mplex network of computers and rou ters conn ect ed b y direct wired or wireless links, where i nformation is tran smit ted in discrete sized p ackets. Since 1970 th e Internet evolved rapidly and in a d ecentralize d manner from a few interconnected local area networks into a highly h eterogenous glob al network spanning continents. The Internet provide s various services and applications tha t b ecame part o f ou r every-day activity in cluding web browsing, file tran sfer, multimedia, Internet-tel eph ony, and others. In the future it is expected that the reliance o f the popu lation on the firm functioning of th e In ternet and on the new e merging applications w ill increase dramatically, thus it is of utm os t importance t o study and to understand the p roperties of this hu ge network at var ious levels of abstra ction. By exploring the characteristics of the present-day I nterne t, and t he various ph enomena associated t o it s traffic it may b e possib le to extrapolate that knowledge to predict the p roperties o f the fu ture Internet and to foresee its pr ob lems. Traditionally the Intern et was studied by va rious engi ne ering approaches t hat concentrated mostly on practical aspects, howe ver r ecently with the accumulation of large d atasets, it was recognized that the Internet can also be s t ud ied f rom a complex systems perspective, w hich represents a d ifferent level of abstraction. Complex systems [1] are large networks of interacting agents, where the emphasis of the studies are on the global properties, characterizing th e system as a whole, b y ne gl ecting the fine details o f the interactions. It is believed that microscopicall y vastly d ifferent complex systems h ave some universal features that are independent of the details. For example collective ph enomena of con gestion bu ildup are present b oth in the Internet and h ig hw ay-traffic, show i n g ana logous d ynami cs on a global scale [2]. Also both of these systems are characterized by self-similarity [3,4], and 1/f no ise in the congested state [5-7]. Most of the ex isting wo rk so far addressed q uestions concerning th e topological p roperties of the Intern et [8,9] or r elate d topics like tolerance to attacks or failures [10]. These studie s established interesti n g characteristics like the p ower-law degree d istributions of the Internet connectivity graph on the au t ono mous system and rou ter level. Although a s th e network evolves this continues to be an open issue and a hot topic, nevertheless it is essential to extend the study of t he Internet beyond t h e d iscovery of t opo logi ca l pr operties towards t he characterization o f its dynamical state. Steps have already been taken in this direction; for instance in references [11,12] who revealed universal scaling in traffic intensity fluctuations. From the point of view of the current, m o st widely used data transfer p rotocols like the variants of TCP, t h e most relevant state va riables o f the network a re th e loss-rates and the delays encountered by da ta p ackets on a p ath, since these quantities control the transmission rate of the transfer p rotocol. There are two different techniques to measure loss-rate and delay over the Internet, these are active p robing and passive monitoring. Active probing involves injecting of probe packets into t h e network and analyz ing the properties of the received probe- stream. This technique is flexible, has wide ran ge o f applicability, however its e xtensive usage may impose un necessary load on the network. On the contrary p assive monitoring do es not impose any load, but it relies on the fact that the user must h ave an access to th e n etwork element under in vestigation, whic h is generally n ot the c ase. I n the past y ears several measurement platforms have been develo p ed for conducting active meas urements over the Internet (e.g. Surveyor, Felix, AMP [13]), ho wever these p latforms can provide on ly en d-to- end information between the p artici p ating n odes, where the measured characteristic ca n not be resolved on the parts o f the end -to-end path. Also most of the existing active probing tools rely on extra cooperation of the routers in the path to p rocess their p ackets. As the Internet continues to evolve towards more decentral ized and heterogenous administration, in the futu r e the cooperation o f the network elements can b e foreseen to b e limited to the bas i c process o f just storing and forwarding i n coming probe packets. 3 The solution to the se problems is provided b y network tomography, which is a special class of active-probing measuring techn iques, tha t is able to resolve the end-to-end delay statistics [14,15] and packet loss ra tes [16,17] to i nternal segments of the paths. I n general a tomography measur ement made fro m a single source to a set of r eceivers admits th e determination of the d elay statistics and loss-rates o n each segment of an underlying logical tree that is spanned by the source and r eceiver nodes, and the b ranching nodes (nodes where the path of probes d estined for different receivers diverge). B y increasi ng the number of sources and r eceivers involved in a tomography measurement, the po rtion of the network for which state information can be res o lved gr ows dramatically. Initially network tomog r aphy techniques were d eveloped for the use with multicast prob es [18-21], which requires the extra cooperation of the routers to support multicast functionality, however later these approaches were als o extended to t he case of using un icast probes [16,14,1 7], and performing the measurements from m u ltipl e sources [22,23], which makes un icast n etwork tomography the most general tool to measure s pa tially reso lved characte r istics o f an uncooperative Inter net. The ma in idea of unicast network tomography is to use back-to-back pac ket pairs, where each packet of a pa ir is des ti ned to d iffere nt receivers. As the packets o f a pair traverse their p aths, they exp erience the same network conditi on s on the common s egme nt from th e source to the branching node, which brings correlation into the time-series of the e nd -to-end characteristics. This inherent correlation p roperty of such probe stre ams is the key to resolve the inter na l characteristics from the end-to-end measurements. The de lay experienced by a packet over an Internet path sums up from two n on-negative components, a constant prop agation delay and a time-varying component du e to queueing in the bu ffers of rou ters. In this p aper we ar e concerned with large-scale inference of queue ing delay distri butions in the Internet b y performing e xten sive unicast netw or k tomography measurements. The large-scale stud y of queueing d elay dis tributions is mo tivated by the fact that th is observable carries vast amoun t of information about traffic properties and the state of congestion on the measured path. By resolving the qu eue ing delay d istributions from end-to- end measurements we can draw a map of congestion of the network segments, analyze sp atial structure, and identify highly con gested or faulty segmen ts. The r est of the paper is organized as follows. In the following section w e describe ET OMIC, the measurement p latform, where the e xperiments were conducted. Next we p roce ed with the presentation of the results of our pr eliminary large-scal e tomography measurement, while t h e detailed description of the queuei ng d elay tom ography method is given in the last section. The ETOMIC Measurement Pl atf orm To perform un icast queueing delay tomography in a real network environment poses several challenges. F irst in o rder t o be able to measure tr ue end -to-e nd delay, sourc e and r eceiver nodes need to be synchronized to a common clock-reference, and must stay in the synchronized state during the me as urements . Second , the me asuring in frastruct ure h as to be very pr ecise in order t o be able t o re solve the micr os econd-scale queueing d elay components associated to h igh-bandwi dth (multi-Gig ab it) links. The precision of co mmercial workstations are insufficient for th is task, thus to achieve sub-microsecond prec ision, a hardware so l u tion is inevitable. In the subproject of the European Union sponsored EVERGROW[24] I n tegrated Project, we are d eveloping a state of the art high-precision, synchronized measurement pla tform, the Evergrow Traffic Observatory Measurement I nfrastruCture (ETOMIC) [25]. Th is platform among others prov ides the ability to perform large-scale delay and loss tomography b ased on unicast p robing techniques, and will be generally available and open to the p ublic. Currently ETOMIC consists of 15 measuring node s d eployed at different locations in various European countries (See Table I., while in the future we p lan to exte nd this nu mber to 50 p articipati ng nodes. The measurement nodes and the network experiments with them are managed throu g h 4 a cen tral management system that is accessible to the resear chers through a web - b ased graphical user interface [26]. Table 1. The list of current ETOMIC nodes ABBREVIATION IP ADDRESS L OC ATION SICS 193.10.64.81 Stockholm, Sweden TELI 217.209.228.122 Stockholm, Sweden ERIC 192.71.20.150 Stockho lm, Swede n UNAV 130.206.163.165 Pamplona, Spain ASTN 134.151.158.18 Birmingham, England HUJI 132.65.240.105 Jerusalem, Israel OVGU 141.44.40.50 Magdeburg, Germany ROME 141.108.20.7 Rome, Italy UNIV 193.6.205.10 Budapest, Hungary COLB 193.6.20.240 Budapest, Hungary ELTE 157.181.172.74 Budapest, Hungary UPAR 193.55.15.203 Paris, F ranc e SALZ 212.183.10.184 Salzburg, Austria UBRU 193.190.247.240 Brussels, Belgi u m CRET 147.27.14.7 Chania, Greece The s chematics of a n ET O MIC measurement node is d isplaye d in fig. 1 . It is b ased on standard PC h ardware, but also in cludes an Endace DAG 3.6GE card as th e network monitoring interface, which is specifically designed for precise active and passive measurements [27]. These DAG c ar d s provide ve ry acc urate tim e-s tamping of the p robe packets, with a time-resolution of 6 0 ns, and also advanc ed capabilities for transmission. A burst composed of several packets can be transmitted with precise u ser-defined in ter p acket timings. The measuring nodes are synchronized by GPS (Garmin GPS 35 HVS), that provides a PPS (p ulse per second) reference signal d irectly to the DAG card. The accuracy of one-way delay measurements b etween two ETOMIC n odes is found to be ≈ 0.5 µs, which is mainly limited b y the performance of the GPS receivers. This result wa s obtained i n a lab exp eriment before t h e deployment o f the nodes, where we connected two ETOMIC no des by an empty link, and transferred a l ong stream of p robe packets b etween th em. Figure 2 shows th e histogram of the measure d de lay, where t h e bin size reflects the time r esolution of the DAG- cards. Fig . 1. The measuring node is a standard PC equipped with a DAG 3.6GE network interface card, connected to a GPS unit. Fig . 2 . One-way delay measurement between tw o gps-synchronized ETOMIC nodes over an empty link. The FWHM of the histogram indica tes that the attainable precision of end-to-end delay measurements within ETOMIC is a round 0.5µs. 0 1 2 3 4 5 6 7 8 9 0 0.5 1 1.5 2 N [x10000] Delay [ µ s] 5 ERIC 192.71.20.150 213.65.55.237 SICS 193.10.64.81 130.237.211.241 UNIV 193.6.205.10 195.111.99.161 ELTE 157.181.172.74 157.181.141.9 HUJI 132.65.240.105 62.40.103.69 UNAV 130.206.163.165 130.206.240.2 UPAR 193.55.15.203 193.51.179.41 ASTN 134.151.158.18 146.97.33.37 TELI 217.209.228.122 217.209.228.121 62.40.96.10 62.40.103.25 213.248.98.45 62.40.103.61 62.40.96.186 130.242.85.65 195.67.220.149 62.40.103.117 62.40.96.126 195.111.97.242 62.40.96.117 62.40.96.154 62.40.103.149 62.40.96.89 213.248.103.61 213.248.64.37 62.40.96.177 81.228.72.214 81.228.72.216 193.251.252.22 62.40.103.161 62.40.96.29 213.248.101.138 213.248.64.38 213.248.101.142 81.228.72.33 81.228.72.34 81.228.72.56 62.40.96.2 62.40.96.61 62.40.96.182 62.40.96.30 62.40.96.34 Fig. 3. The c onne ct ion topology b etween 9 ETOMIC measurement nodes. The ellip se s haped nodes on the edge are E TOMIC measurement nodes with abbreviations given in Tabl e I., while box-shaped nodes in the interior of the graph are b ranching nodes. The arrows indicate the direction of probe packet flow on a gi ven network segment. The boxes with an IP addres s of 62.40.X.X are nodes within GÉANT . Figure 3 d epicts the connection topo logy be tween 9 measuring nodes, obta ined by extensive traceroute me asurements, where we extracted from the d etailed traces the segments for wh ich characteristics can be resolved b y network tomogra ph y me asurements. This arrangement involves 104 network se gments and 42 branching nodes (among these 19 is situated in the GÉANT multi-Gigabit European academic network [28]) with link speeds ranging fro m 2 to 15 Gb/s. 3. Large-scale Queueing Delay Tomograph y Here we rep or t a large-scale tomography measurement th at involved 9 ETOMIC measurement nodes, and a connectivity graph consisting of 38 b ranchi n g nodes and 93 network segments. A mong these 9 ETOMIC nodes 8 were simultaneously sources of outgoing b ack-to-back p robe pairs, and receivers of the incoming probe p ackets, wh ile one of the n odes was only used as a receiver. Each of the source n odes sent p robe pairs c onsisting of small sized UDP packets to all th e po ssible pairs of receivers in a roun d-robin fashion with an inter-pair time of 1 ms, and repea ted this process many times. This pro cedure finally r esulted 6 in data sets, ea ch containing two time-series of end -t o-end delays with an approxim ate length of 10000 elements. ERIC 192.71.20.150 213.65.55.237 37.5 SICS 193.10.64.81 130.237.211.241 35.4 UNIV 193.6.205.10 195.111.99.161 12.1 ELTE 157.181.172.74 157.181.141.9 9.9 HUJI 132.65.240.105 62.40.103.69 537.7 UNAV 130.206.163.165 130.206.240.2 102.3 UPAR 193.55.15.203 ASTN 134.151.158.18 146.97.33.37 74.1 TELI 217.209.228.122 217.209.228.121 18.5 62.40.96.10 49.7 83.1 13.9 62.40.103.25 6.8 213.248.98.45 20.5 62.40.103.61 18.4 100.4 70.3 11.9 62.40.96.186 17.8 182.9 130.242.85.65 10.5 195.67.220.149 8 62.40.103.117 6.9 62.40.96.126 12.1 128.2 34 37.9 195.111.97.242 5.3 900.8 73.5 62.40.96.117 45.6 62.40.96.154 16.9 132 76.3 62.40.103.149 11.1 113.4 902.4 62.40.96.89 21.5 36.7 12.4 213.248.103.61 6.4 213.248.64.37 6.8 62.40.96.177 5 81.228.72.214 12.4 81.228.72.216 5.8 68.5 51.1 213.248.101.138 78.4 213.248.64.38 31.4 40.4 52.1 923 213.248.101.142 16 1.2 99.7 15.5 109.4 50.7 205.2 17 123.1 60.1 81.228.72.33 33 81.228.72.34 6.8 81.228.72.56 8.7 201.8 0 88.1 74.8 3.9 202.3 60.6 25.5 84.8 62.40.96.2 3.7 351.5 62.40.96.61 17.2 47.6 62.40.96.182 14.3 184.5 57 158.7 94.8 104.4 62.40.96.30 2.6 62.40.96.34 16.6 127 36.2 12.2 50.5 312.9 148.8 113.9 73.4 MEAN max 923.1 min 0.0001 Fif. 4. The c onn ect ivity gra ph colored and labeled by the mean queueing delay, gi ven in u nits of µ s, for ea ch network segment. These data sets co mprised the input to the tomography method described in sec. 4 tha t yielded as an output the qu eueing delay distr i bu tions resolv ed for each segment contained in the connectivity graph. Since a given segment can be a part of different end-to-end paths, this fact enabled to test t he c onsistenc y o f the r esults, as w ell a s the averaging o f the distri bu tions obtained from d ifferent data sets, but attributed for the same segment. Fo r b etter visu alizat ion of th e results we extracted the me an and t he sta ndard d eviation of the q ueueing delay distributions. These d y na mi ca l state par ameters are shown on top o f the connectivity graph in figs. 4 and 5. 7 ERIC 192.71.20.150 213.65.55.237 29.8 SICS 193.10.64.81 130.237.211.241 34.8 UNIV 193.6.205.10 195.111.99.161 18 ELTE 157.181.172.74 157.181.141.9 14.1 HUJI 132.65.240.105 62.40.103.69 670 UNAV 130.206.163.165 130.206.240.2 385.6 UPAR 193.55.15.203 ASTN 134.151.158.18 146.97.33.37 37.8 TELI 217.209.228.122 217.209.228.121 11.5 62.40.96.10 38.5 48.8 16.2 62.40.103.25 11.6 213.248.98.45 39.2 62.40.103.61 48.3 69.9 41.1 45.2 62.40.96.186 39.8 433.8 130.242.85.65 15.4 195.67.220.149 8.3 62.40.103.117 7.5 62.40.96.126 11.3 101.8 36.3 39.6 195.111.97.242 9.8 980.1 55.6 62.40.96.117 75.8 62.40.96.154 41.9 91.2 32 62.40.103.149 28.7 60.3 1005.2 62.40.96.89 19.7 80.6 14 213.248.103.61 7.3 213.248.64.37 7.2 62.40.96.177 6.6 81.228.72.214 39.9 81.228.72.216 15.2 105.1 66 213.248.101.138 89.3 213.248.64.38 31.4 76.3 37.3 1022.1 213.248.101.142 16.3 18.1 68.6 8.7 86.6 71.2 423 28.3 55.9 39 81.228.72.33 28.3 81.228.72.34 19.4 81.228.72.56 14.8 433.1 0 76.1 41.8 7 442.5 24.3 6.8 57.4 62.40.96.2 8.1 365.6 62.40.96.61 89 84.2 62.40.96.182 59.3 427.5 147.3 163.3 134.4 128.5 62.40.96.30 5.2 62.40.96.34 33.6 66.8 25.4 11.5 38.5 324.5 430.2 62.1 33.5 max min 0.0001 STDV 1022.1 Fig. 5. The c onnectivity grap h col ored and labeled b y the standard deviation of the que ueing dela ys, given in units of µs, for each network s egment. 3.1. Analysis of the results The results of figs. 4 and 5 revea l some interesting s tructure. First o f all the s tate variables of the segments spa n three o rd ers of magnitude, r anging from the error l imit of the delay measurements ( ≈ 0.5 µ s), to an ave rage queueing d elay of ≈ 1ms, that ch aracterizes a segment which connects GÉANT t o the He b rew Universi ty in Jerusalem. The results also reveal an interesting geographical feature, na mely that the segments or iginating or ending in ETOMIC nodes that are located on the south ( HUJI, UNAV), are characterized by the highest average and standard deviation of the queuei ng de lays. As a ge neral feature it can be observed that f or all end-nodes incoming segments are characterized b y higher v alues o f a verage queueing delays t h en outgoing segments. This result can be in terpreted by a r easoning th at the amount o f data d ownloaded fro m the Internet to an organization is usually higher, than the amount downloaded from the servers of the organization by clients situated elsewhere in the Internet. Looking a t the spatial a rrangement of the st ate variables, one can see that t he internal segm ents that are c onnections between branching nod es constitute a core which is characterized by the smallest v alues of the state variables. This is not surprising, since these a re ne tw o rk segments in the gi gabit backbone. 8 To analyze further the results in fig. 6(a) w e p lot the co mplementary c umulative d istribution function of the average queueing delays on t he different segments, that is closely fitted b y , 2 ln 1 2 1 ) ( − − = σ m x erf x g (1) where x is the average q ueueing delay of a ne twork segment in microseconds, while σ and m are the fitting parameters. The implication of the very good fit with σ ≈1.42 and m ≈ln(37.8µs) in fig. 6(a) is tha t the average qu eueing delay of the d ifferent se gment s follows a log-normal distribution. . 2 1 ) ( 2 2 2 ) (ln σ σ m x e x x P − − = (2) It is interesting that d espite the f ea t ures and spatial s tructures identified e arlier, the data follows a smooth continuous function without segregation of the average queueing delays into clearly visible groups. In fig. 6(b) we plot the standar d deviations as a function of the average values of the queueing delay. Th e figure indicates that th e majority of the segments, with a data po int near the d iagonal, are ch aracterize d by a queueing delay d istributi on that is c lose to being exponential, wh ile the segments with a large deviation above the diagonal may be characterized by a self-simil ar traffic-flow and h eavy- tailed d istrib utions. 4. Description of the Method for Queuei ng Delay Tom og raphy In th is section w e provide the detailed d escription of the queu eing delay tomo graphy method that was applied on the me asured end-to-end data in obtaining the results of the previous section. To achieve a un i que labeling o f the d iffere n t ne twork segments o f a measurement tree we use the arrangement illustrated in the example of fig. 7. The source node is situated on the top of the h ierarchy, labeled with “0”, while b ranching n odes are put on a given level a ccording to their “d istance” from the source. This distance is measured by the nu mber of branch ing nodes a probe pa cket must pa ss to reach the target. Different n odes o n the same hierarchical level are enumerate d in the incremental order from the l eft to r ight. Using t his scheme one can identify each node by a unique index, while the se gme n ts, indicated by arrows in f ig. 7 , can be identified b y th e indices of the ir target nodes. We deno te the one-way delay experienced Fig. 6. In (a) the complementary cumulative distribution of the a verage queueing delays are given b y filled boxes with error-bars , while the continuous line is a fit given by equat ion (1). In (b) the standard deviations as a function of the average queuein g delays are plotted with error-ba rs for all the resolved network segments of fig. 4. Here the c ontinuous line marks the diagonal. 0 0.2 0.4 0.6 0.8 1 0.1 1 10 100 1000 CCDF Average queueing delay [ µ s] 1 10 100 1000 1 10 100 1000 STDV of queueing delay [ µ s] Average queueing delay [ µ s] (a) (b) 9 by the n -th probe on the i -th segment by X i ( n ), and the corresponding end-to-end de lay f rom the source to the i -th receiver node b y Y i ( n ). The qu eueing d elays associat ed t o these quantities are denoted by X i ( n ) and Y i ( n ). B y dropping the n index we indicate th e time-series of the respective quantiti es . level 0 level 1 level 2 level 3 0 1 2 3 6 7 4 5 8 9 Fig. 7. The la beling of the different nodes and network segments of the measurement tree. 4. 1. Inference in the two-leaf tree Here we describe the method of queuing-delay d istri bution inference in the b asic ca se o f the two-leaf tree, wh ich is comprised of a source, two receivers, and a single branching nod e (see the p art o f fig. 7 un til level 1). The generalization to larger trees w ill b e tr eated in the nex t subsection. The known quantities a re the time s eries of end-to-end queueing delays Y 2 and Y 3 obtained by minimum filt erin g the Y 2 and Y 3 time-series ). ~ min( ) ( ~ ) ( ), ~ min( ) ( ~ ) ( 3 3 3 2 2 2 Y n Y n Y Y n Y n Y − = − = (3) These are measured by a big nu mber of p acket p airs, whe re the packets i n a pair are sent back-to-back from the sour ce, and are de stined to the two d istinct receivers. We coun t only those pairs where each of th e p ackets has reached its d estination, and assign the nu mber of successful pairs b y N . A bo ve we m ade the assumption t hat in every end-t o-end delay measurement at l east one probe will experience n o que ue ing, thus t he minimum can be identified with the propagation delay o n the given path, which can be subtracted to yield t he delay component due to queueing. Measurement studies of references [29,30], as well as our own experience shows that in the current Internet link u tiliz a tions are low enough, so that the above assum ption is justified. Using the labeling introduced i n the prev ious subsection we have the trivial relations ), ( ) ( ) ( ), ( ) ( ) ( 3 1 3 2 1 2 n X n X n Y n X n X n Y + ′ = + = (4) where X´ 1 ( n ) stands for the queueing delay on segment 1, experienced by th at particular probe in the n -th pair, wh ich was destined towards receiver no de (3). Fro m this point we w ill assume p erfect co rrelation of the delays expe rienced by the tw o packets in a pair on the common segment X 1 ( n ) = X´ 1 ( n ). In pr actice th is id eal situation is approached i f for all n , | X´ 1 ( n )− X 1 ( n )|<
Original Paper
Loading high-quality paper...
Comments & Academic Discussion
Loading comments...
Leave a Comment