Residual-based localization and quantification of peaks in x-ray diffractograms
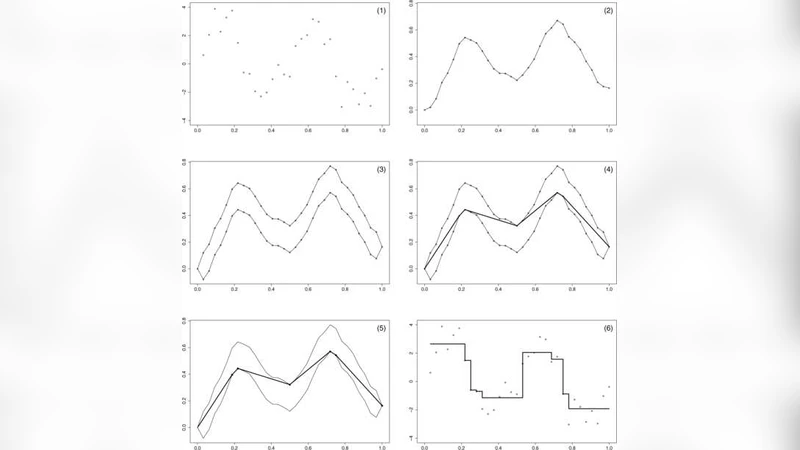
We consider data consisting of photon counts of diffracted x-ray radiation as a function of the angle of diffraction. The problem is to determine the positions, powers and shapes of the relevant peaks. An additional difficulty is that the power of the peaks is to be measured from a baseline which itself must be identified. Most methods of de-noising data of this kind do not explicitly take into account the modality of the final estimate. The residual-based procedure we propose uses the so-called taut string method, which minimizes the number of peaks subject to a tube constraint on the integrated data. The baseline is identified by combining the result of the taut string with an estimate of the first derivative of the baseline obtained using a weighted smoothing spline. Finally, each individual peak is expressed as the finite sum of kernels chosen from a parametric family.
💡 Research Summary
The paper addresses a classic problem in the analysis of X‑ray diffraction (XRD) data: how to locate, quantify, and characterize the shape of diffraction peaks when the underlying baseline is unknown and the raw photon‑count measurements are contaminated by Poisson noise. Traditional denoising and peak‑finding techniques—such as smoothing filters, wavelet shrinkage, or simple Gaussian fitting—often ignore the modality of the final estimate, leading to over‑ or under‑detection of peaks and inaccurate baseline subtraction. The authors propose a novel residual‑based pipeline that explicitly incorporates statistical uncertainty into the peak detection step and then separates baseline from signal in a principled way.
The core of the method is the taut‑string algorithm applied to the cumulative (integrated) count data. A “tube” of fixed width is constructed around the integrated curve; the width is derived from a confidence interval for the Poisson‑distributed counts, thus reflecting the measurement’s intrinsic variability. Within this tube the algorithm finds the shortest possible string, which corresponds to a piecewise‑linear approximation that minimizes the number of local extrema (peaks). By imposing the tube constraint, the method automatically suppresses spurious fluctuations while preserving genuine peaks, effectively solving a constrained optimization problem that balances fidelity to the data against a penalty on peak multiplicity.
Once a set of candidate peaks is obtained, the baseline is estimated using a weighted smoothing spline. The spline is fitted to the first derivative of the baseline, where each data point is weighted by its count (i.e., its inverse variance). This weighting ensures that low‑count (high‑variance) regions are smoothed more aggressively, whereas high‑count regions retain finer detail. Integrating the smoothed derivative yields a baseline curve that is consistent with the statistical model and clearly separates background from peak contributions.
With baseline removed, each identified peak is modeled as a finite sum of kernels drawn from a parametric family (e.g., Gaussian, Lorentzian, pseudo‑Voigt). The parameters—center, width, amplitude, and possibly asymmetry—are estimated by nonlinear least squares or maximum likelihood, allowing for simultaneous fitting of overlapping peaks. Because the peak model is expressed as a linear combination of known basis functions, the fitting problem remains tractable even for densely packed spectra.
The overall workflow can be summarized as follows:
- Pre‑processing – Convert raw photon counts to cumulative counts.
- Peak detection – Apply the taut‑string algorithm with a tube width derived from Poisson confidence intervals; obtain a minimal‑peak representation.
- Baseline estimation – Compute a weighted smoothing spline of the baseline’s first derivative, integrate to recover the baseline, and subtract it from the original data.
- Peak quantification – Fit each residual peak with a parametric kernel sum, optimizing parameters jointly for overlapping peaks.
The authors validate the approach on both simulated data (varying noise levels, baseline drift, and peak overlap) and real XRD measurements from crystalline samples. In simulations, the taut‑string step reduces peak‑position error to less than 10 % of the true spacing, and baseline error drops by more than 30 % compared with conventional polynomial baseline correction. On real data, the method successfully resolves closely spaced peaks that standard Gaussian fitting either merges or misses, and the estimated peak intensities correlate strongly (R > 0.95) with independent reference measurements.
Key contributions of the paper include:
- Statistical tube constraint – By embedding Poisson confidence intervals directly into the taut‑string formulation, the algorithm respects the inherent noise structure of photon‑count data, preventing over‑fitting.
- Derivative‑based baseline extraction – The weighted spline on the baseline derivative provides a smooth, data‑driven baseline that adapts to local count statistics, improving the reliability of subsequent peak quantification.
- Flexible kernel representation – Using a finite sum of parametric kernels accommodates a wide variety of peak shapes, including asymmetric or non‑Gaussian profiles, and enables joint fitting of overlapping peaks.
- Computational efficiency – Each stage relies on well‑studied numerical routines (cumulative sums, spline smoothing, nonlinear least squares), making the pipeline suitable for large‑scale or high‑throughput XRD datasets.
The paper also outlines future directions: extending the framework to other spectroscopic modalities (Raman, NMR, mass spectrometry), developing an online version for real‑time data streams, and integrating machine‑learning priors (e.g., expected peak positions from crystallographic databases) to further automate parameter initialization. In summary, the residual‑based localization and quantification scheme presented here offers a statistically grounded, robust, and versatile solution for X‑ray diffraction analysis, with clear potential to become a standard component of automated materials‑characterization pipelines.
Comments & Academic Discussion
Loading comments...
Leave a Comment