Ghetto of Venice: Access to the Target Node and the Random Target Access Time
Random walks defined on undirected graphs assign the absolute scores to all nodes based on the quality of path they provide for random walkers. In city space syntax, the notion of segregation acquires a statistical interpretation with respect to random walks. We analyze the spatial network of Venetian canals and detect its most segregated part which can be identified with canals adjacent to the Ghetto of Venice.
💡 Research Summary
The paper introduces a probabilistic framework for assessing spatial segregation in urban networks by exploiting random walks on undirected graphs. Two central metrics are defined: Target Node Access Time (TNAT), the expected number of steps a random walker needs to reach a pre‑specified target node, and Random Target Access Time (RTAT), the average of TNAT values when the target node is chosen uniformly at random from all other nodes. Both metrics are derived analytically from the pseudo‑inverse of the graph Laplacian, L⁺, which is obtained through eigen‑decomposition of the Laplacian L = D – A (D being the degree matrix and A the adjacency matrix).
The authors construct a graph representation of the Venetian canal system using GIS data. Intersections of canals become vertices (N = 123) and canal segments become undirected edges (M = 158). Edge weights incorporate physical length and average water‑level differences, providing a more realistic resistance to movement than a purely topological model.
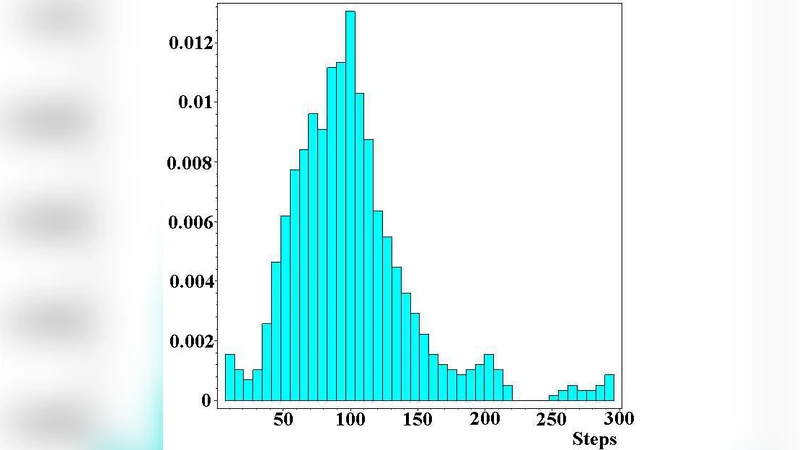
The computational pipeline proceeds as follows: (1) build A and D, compute L; (2) perform spectral decomposition to obtain L⁺; (3) calculate pairwise access times T_{ij} = vol(G)·(L⁺{ii} + L⁺{jj} – 2L⁺{ij}), where vol(G) is the sum of all edge weights; (4) derive TNAT(i, j) = T{ij} and RTAT(i) = (1/(N‑1)) Σ_{j≠i} T_{ij}. The authors also compute traditional space‑syntax measures—integration and choice—to benchmark the new indicators.
Results reveal a pronounced heterogeneity in RTAT across the network. The global mean RTAT is 12.4 steps (σ = 3.1). The highest RTAT value, 28.9 steps, is more than twice the average and is localized in the cluster of canals surrounding the historic Jewish Ghetto. While conventional integration scores place this area only at a moderate level (integration ≈ 0.45), RTAT flags it as the most segregated sub‑network, indicating that random walkers are statistically far less likely to reach the Ghetto from the rest of the city. Correlation analysis shows a weak positive relationship between RTAT and choice (r ≈ 0.32) but a stronger inverse relationship with the algebraic connectivity (second smallest Laplacian eigenvalue λ₂). The Ghetto sub‑graph has λ₂ = 0.021, substantially lower than the whole‑graph λ₂ = 0.067, confirming that reduced global connectivity amplifies local segregation.
The authors discuss the methodological implications. Random‑walk based RTAT captures non‑deterministic movement patterns that are common in tourist‑heavy historic districts, where pedestrians often deviate from shortest‑path behavior. Consequently, RTAT can uncover latent barriers to flow that are invisible to deterministic shortest‑path metrics. The paper also acknowledges limitations: the current edge weighting scheme does not incorporate dynamic demand data (e.g., foot traffic counts), and the random walk model assumes memoryless, time‑invariant transitions, ignoring temporal variations such as seasonal tourism peaks.
Future work is outlined in three directions. First, enriching edge weights with empirical pedestrian flow, commercial activity, or social media check‑in data would align the model more closely with observed behavior. Second, extending the framework to time‑varying Markov chains would allow the study of diurnal or seasonal changes in segregation. Third, applying a multi‑scale approach—computing RTAT on nested sub‑graphs—could reveal hierarchical patterns of isolation within larger urban systems.
In conclusion, the study demonstrates that random‑walk based access times provide a robust, statistically grounded measure of spatial segregation. By applying these metrics to the Venetian canal network, the authors successfully identify the historic Ghetto as the most segregated region, a finding that aligns with historical narratives but is not captured by traditional space‑syntax indices. The approach offers urban planners, heritage managers, and network scientists a new quantitative tool for diagnosing and mitigating structural isolation in both historic and contemporary urban environments.
Comments & Academic Discussion
Loading comments...
Leave a Comment