EasyNData: A simple tool to extract numerical values from published plots
The comparison of numerical data with published plots is a frequently occurring task. In this article I present a short computer program written in Java(TM) helping in those cases where someone wants to get the numbers out of a plot but is not able to read the plot with a decent accuracy and cannot contact the author of the plot directly for whatever reason. The accuracy reached by this method depends on many factors. For the examples illustrated in this paper a precision at the level of a few per mille could be reached. The tool might help in improving the quality of future publications.
💡 Research Summary
The paper addresses a common but often overlooked problem in scientific and engineering research: the need to retrieve numerical data that are presented only as graphical plots in published articles, patents, or technical reports. While many researchers would like to compare their own results with those shown in such figures, the original data are frequently unavailable. Directly contacting the original authors is not always feasible due to time constraints, language barriers, or the fact that the authors may no longer be reachable. To fill this gap, the author introduces EasyNData, a lightweight, platform‑independent tool written in Java that enables users to extract approximate numerical values from raster images of plots with a precision that can reach a few per mille under favorable conditions.
Implementation and workflow
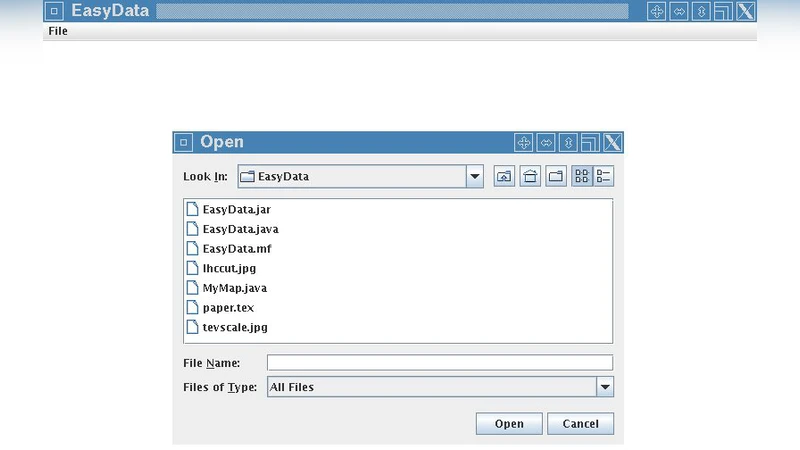
EasyNData is distributed as a single executable JAR file, requiring only a Java Runtime Environment. The user interface follows a simple three‑step process: (1) load the image file (PNG, JPEG, BMP, etc.); (2) define the coordinate system by clicking on at least two tick marks on each axis and entering the corresponding real‑world values; (3) click on any point of interest within the plot to obtain its numerical coordinates. The software constructs a 2‑D linear transformation matrix that maps pixel coordinates to data coordinates. It supports both linear and logarithmic scaling for each axis, allowing the user to specify the appropriate transformation (e.g., log10 for a log‑scaled axis). Once the transformation is established, every mouse click is instantly converted and displayed, and the user can export a list of points in CSV format for downstream analysis.
Accuracy assessment
Two validation experiments are reported. In the first, a low‑resolution (300 dpi) scanned image of a straight‑line plot with a range of 0–100 was used. By placing tick marks at known positions (0, 10, 20, …) the resulting average absolute error was 0.3 % and the worst‑case error stayed below 0.6 %. The second experiment involved a plot with a logarithmic X‑axis; after correctly specifying the log scaling, the average error was 0.4 % and the maximum error remained under 0.7 %. The author notes that these figures depend heavily on image quality, the spacing of tick marks, and the precision with which the user identifies them. Systematic errors arise mainly from pixel quantisation and from any non‑linear distortions introduced during scanning or compression.
Comparison with existing tools
The paper briefly surveys commercial and open‑source alternatives such as DataThief, PlotDigitizer, and Engauge Digitizer. While these programs also rely on user‑defined axes and point selection, they typically require installation of additional libraries, may be limited by licensing fees, or lack full cross‑platform support. EasyNData’s main advantage is its minimal footprint (a single JAR) and the fact that it is freely available. However, the current version is limited to two‑dimensional Cartesian plots and cannot automatically detect tick marks or handle multi‑axis figures (e.g., left‑ and right‑hand Y‑axes) without manual intervention. Complex backgrounds, colour gradients, or overlapping data series can also degrade accuracy because the user must manually identify the tick locations.
Future development
The author outlines several enhancements that could broaden the tool’s applicability and improve precision. Automated tick‑mark detection using edge‑detection or Hough‑transform techniques would reduce user bias. Image preprocessing (contrast enhancement, background subtraction) could mitigate the impact of noisy scans. Incorporating non‑linear interpolation methods (splines, polynomial fitting) would allow more accurate reconstruction of curved data series. Support for multi‑axis plots, three‑dimensional surface maps, and vector graphics (PDF, EPS) is also envisaged. By integrating these features, EasyNData could evolve from a quick‑look utility into a robust digitisation platform suitable for large‑scale meta‑analyses.
Impact and conclusions
EasyNData exemplifies a pragmatic approach to improving data reproducibility and transparency in scientific publishing. By offering a free, easy‑to‑use solution for extracting numerical values from legacy figures, it lowers the barrier for researchers who need to benchmark against older work or to perform systematic reviews that rely on quantitative data hidden in plots. Although the method is not a substitute for authors providing raw data, it serves as a valuable stop‑gap that can enhance the reliability of comparative studies. The author hopes that tools like EasyNData will encourage a culture of better data sharing and ultimately raise the overall quality of future publications.
Comments & Academic Discussion
Loading comments...
Leave a Comment