Using data network metrics, graphics, and topology to explore network characteristics
Yehuda Vardi introduced the term network tomography and was the first to propose and study how statistical inverse methods could be adapted to attack important network problems (Vardi, 1996). More recently, in one of his final papers, Vardi proposed notions of metrics on networks to define and measure distances between a network’s links, its paths, and also between different networks (Vardi, 2004). In this paper, we apply Vardi’s general approach for network metrics to a real data network by using data obtained from special data network tools and testing procedures presented here. We illustrate how the metrics help explicate interesting features of the traffic characteristics on the network. We also adapt the metrics in order to condition on traffic passing through a portion of the network, such as a router or pair of routers, and show further how this approach helps to discover and explain interesting network characteristics.
💡 Research Summary
This paper takes Yehuda Vardi’s theoretical framework for network tomography and his later work on network metrics and puts it into practice on a real‑world data network. Vardi’s original contribution (1996) was to show that many network problems—such as estimating internal link loads from end‑to‑end measurements—could be cast as statistical inverse problems. In 2004 he extended the idea by defining quantitative “distances” between links, between paths, and even between whole networks, thereby providing a language for comparing network structures.
The authors begin by describing the measurement infrastructure they deployed. Specialized probing tools (packet‑level counters, NetFlow/sFlow collectors, and router‑level SNMP queries) were installed at several strategic points in an operational corporate backbone. Over a period of several weeks the tools captured per‑interface packet counts, latency, loss, and flow‑level 5‑tuple records. Raw data were cleaned, time‑synchronised, and aggregated into flow clusters that could be mapped to the underlying physical links.
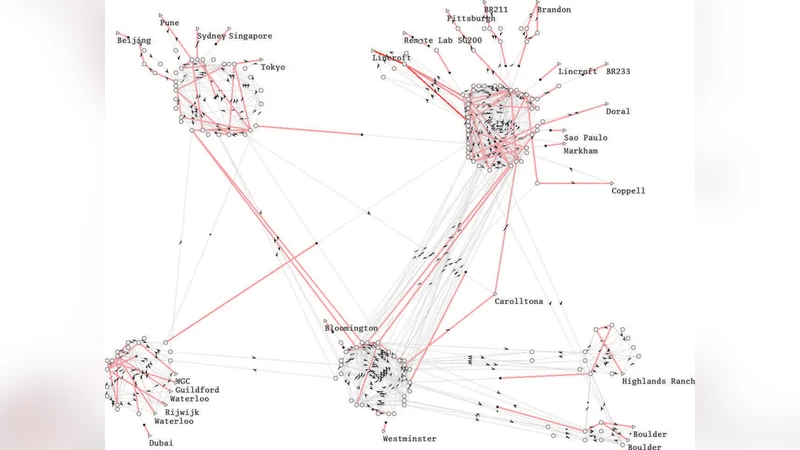
With a clean dataset in hand, the paper implements Vardi’s metric definitions. The distance between two links (i) and (j) is taken as a Jaccard‑type measure: the size of the set of paths that traverse both links divided by the size of the union of their path sets. Path‑to‑path distances are then computed as the weighted average of the constituent link distances. To obtain a global picture, the authors embed the high‑dimensional distance matrix into a low‑dimensional space using multidimensional scaling (MDS) and t‑SNE, producing a visual map where clusters correspond to groups of links or paths that share similar traffic patterns.
A key methodological innovation is the notion of “conditional metrics.” By filtering the flow records to retain only those that pass through a particular router (R) (or a pair of routers ((R_1,R_2))), the same distance calculations are repeated on this sub‑traffic. This conditional analysis reveals how the network’s geometry changes when attention is focused on a specific node or segment. The authors show that, for a heavily used core router, the conditional link‑distance distribution widens dramatically, indicating that the router acts as a hub that connects otherwise distant parts of the network. Conversely, when conditioning on a peripheral router, the distances contract, reflecting a more localized traffic pattern.
The visualizations generated from the metric space expose relationships that traditional time‑series traffic graphs miss. Physically adjacent routers sometimes appear far apart in metric space, signalling that they carry distinct service classes (e.g., production vs. backup traffic). Conversely, routers that are geographically distant can be close in metric space, revealing that they share the same high‑capacity backbone routes. These insights enable network engineers to identify hidden bottlenecks, verify load‑balancing policies, and spot anomalies such as sudden shifts in the metric distances that may correspond to congestion, equipment failure, or malicious activity.
Beyond analysis, the paper proposes a “distance‑based alerting” system. By continuously recomputing the metric matrix and monitoring for abrupt changes in link or path distances, operators can receive early warnings of abnormal conditions. The authors illustrate this with a case study where a DDoS surge caused a rapid increase in distances associated with the target router’s upstream links, prompting a swift mitigation response.
In summary, the study demonstrates that Vardi’s abstract metric framework is not only mathematically elegant but also practically valuable. Applying the metrics to real traffic data yields quantitative characterisations of link importance, path similarity, and network‑wide topology changes. The conditional metric extension adds a powerful lens for focusing on sub‑networks, making the approach useful for capacity planning, fault isolation, and security monitoring. The authors conclude by suggesting future work that integrates these metrics with machine‑learning classifiers to automate anomaly detection and to predict traffic evolution, thereby turning a descriptive tool into a proactive network‑management engine.
Comments & Academic Discussion
Loading comments...
Leave a Comment