Understanding the Characteristics of Internet Short Video Sharing: YouTube as a Case Study
Established in 2005, YouTube has become the most successful Internet site providing a new generation of short video sharing service. Today, YouTube alone comprises approximately 20% of all HTTP traffic, or nearly 10% of all traffic on the Internet. U…
Authors: ** - **Xu Cheng** – School of Computing Science, Simon Fraser University, Burnaby
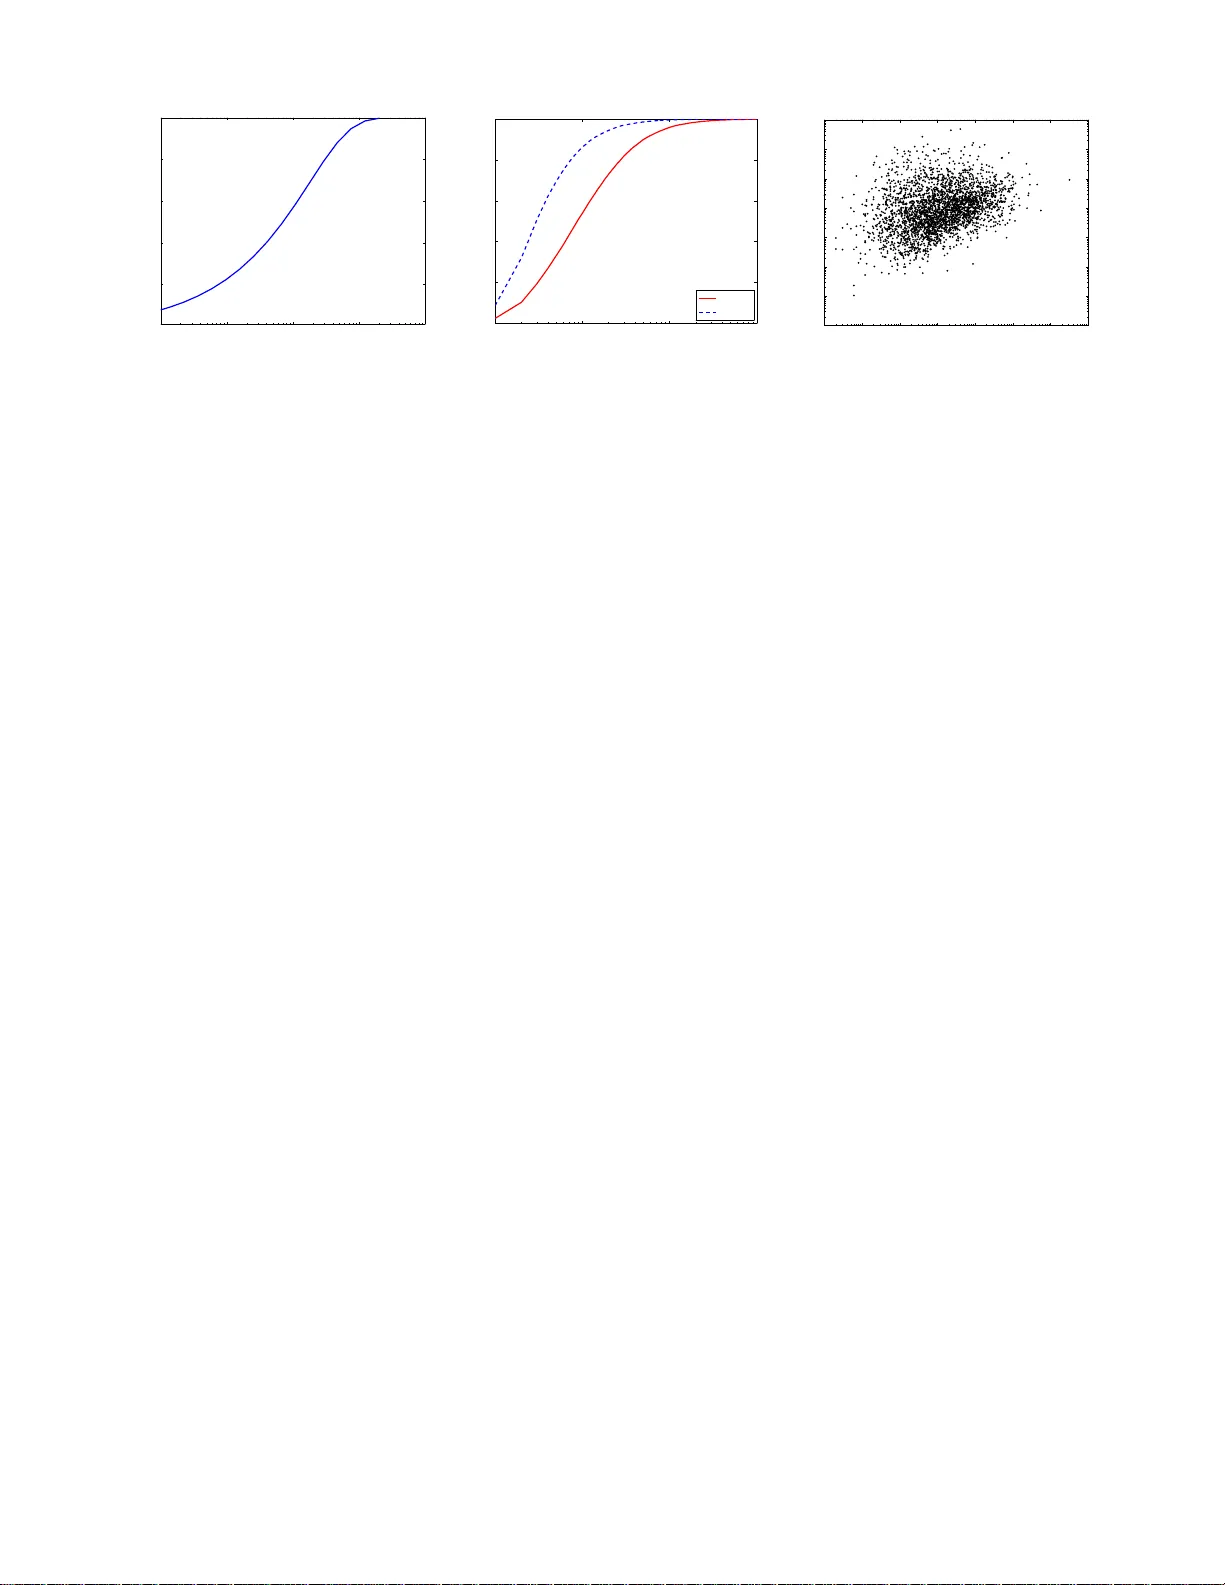
Understanding the Characteri stics of Internet Short V ideo Sharing: Y ouT ube as a Case Study Xu Cheng School of Computing Science Simon Fraser Univ ersity Burnaby , BC, Can ada Email: xuc@cs.sfu.ca Cameron Dale School o f Com puting Science Simon Fraser Univ ersity Burnaby , BC, Can ada Email: camerond@cs.sfu. ca Jiangchu an Liu School of Computing Science Simon Fraser Un iv ersity Burnaby , BC, Can ada Email: jcliu@cs.sfu.ca Abstract —Established in 2005, Y ouT ube has become the most successful Internet site pr oviding a new generation of short video sharing service. T oday , Y ouT ube alone comprises approximately 20% of all HTTP traffic, or nearly 10% of all traffic on the Internet. Understanding th e features of Y ouT ub e and similar video sharing sites is thus crucial to their sustainable dev elopment and to network traffic engineering. In this paper , using traces cra wled in a 3-month period, we present an in-dep th and systematic measurement study on the characteristics of Y ouT ube videos. W e fi nd that Y ouT u be videos ha ve noticeably d i fferent statistics compared to tradi tional streaming videos, ranging from length and access pattern, to their activ e life span, ratings, and comments. The series of datasets also allows us to identify th e gr owth trend of this f ast ev olving Internet site in various aspects, which h as seldom been explored befor e. W e also look closely at the social n etworking aspect of Y ouT ub e, as this is a key driving for ce toward its success. In particular , we find th at the links to related videos generated by uploaders’ choices for m a small-world network. Th is suggests that the videos hav e strong correlations with each other , and creates opportunities f or d ev eloping nove l caching or peer -to-p eer distribution schemes to efficiently deliver vid eos to end users. I . I N T RO D U C T I O N The recent two yea rs have witnessed an explosion of net- worked video sharing as a new killer Intern et application. The most successful site, Y ouT ub e, n ow f eatures over 40 million vid eos and en joys 20 millio n visitors e ach mon th [1]. The success of similar sites like GoogleV id eo, Y ahooV ideo, MySpace, ClipShack, and VSo cial, and the r ecent expensive acquisition of Y ouT ub e by Google, furth er con firm the mass market in terest. T heir gr eat ach iev ement lies in the combi- nation of the con tent-rich videos and, equally or even mor e importan tly , the establish ment of a social network. These sites have created a video village on the web, where anyon e can be a star , fro m lip-synch ing teen age girls to skateb oarding dogs. W ith no do ubt, they are changing the content distrib ution landscape and even the pop ular cu lture [2]. Established in 2005 , Y ouTube is one of the fastest-growing websites, and ha s become the 4th most accessed site in the Internet. It has a sign ificant impact on the In ternet traffic distribution, and itself is suffering fro m severe scalability constraints. Understanding the features of Y ouT u be and similar video sharing sites is cru cial to network traffi c engineering and to sustainable dev elopmen t of this new gen eration of service. In this paper , we pr esent an in- depth a nd systematic mea- surement study o n the characteristics of Y o uT ube videos. W e h av e crawled th e Y ouT ube site for a 3-month period in early 2 007, and h av e obtain ed 27 d atasets totalin g 2,6 76,38 8 videos. This constitutes a significant portion of th e entire Y ouT ub e video repository , and becau se m ost o f th ese v ideos are acc essible f rom the Y ouT ube hom epage in less than 10 clicks, they are gen erally active and thus represen tati ve for measuring the repo sitory . Usin g this co llection of datasets, we find that Y ouT ube videos have no ticeably different statistics from traditional streaming videos, in aspects from video length and access patter n, to life span. There are also new features that hav e not been examined by previous measurement studies, for example, the ratin gs and comm ents. In addition, the series of datasets also a llows us to identify the growth trend of this fast e volving Internet site in various aspects, which has seldom been explored befo re. W e also loo k clo sely at the social network ing aspect o f Y ouT ub e, as th is is a key d riving f orce tow ard the success of Y ouT ub e and similar sites. I n p articular, we find that the links to related video s g enerated by uploader ’ s ch oices form a small-world network. This s uggests that the video s ha ve strong correlation s with each other, and creates oppo rtunities for developing novel caching or p eer-to-peer distribution sche mes to efficiently deliv er video s to en d u sers. The rest of the pape r is organized as f ollows. Section II presents some bac kgrou nd information and other re lated work. Section III describ es our meth od of gathering information about Y ouTube video s, which is analyzed generally in Section IV, while the social networking aspects are analyzed separately in Section V. Section VI discusses the implication s of th e results, a nd suggests ways that the Y ouTube servic e co uld be improved. Finally , Section VI I co ncludes th e paper . I I . B AC K G RO U N D A N D R E L AT E D W O R K A. In ternet V ide o Sharing Online videos existed long before Y ouT ube entered the scene. Howev er , uploading video s, managing , sharing and watching them was very cu mbersom e due to a lack of an easy-to-use integrated platfo rm. Mo re im portantly , th e videos distributed by trad itional media servers an d peer-to-peer file downloads like BitT orren t were stan dalone units of co ntent. 2 Each single video was n ot co nnected to other related video clips, f or example other episode s of a show that the u ser h ad just watched. Also, ther e was very little in the way of co ntent revie ws or ratings. The new generation of video shar ing sites, Y ouT ube and its competitor s, overcame th ese problems. T hey allow co ntent suppliers to uplo ad video effortlessly , automatically con verting from m any different fo rmats, and to tag uploaded videos w ith keywords. Users can easily share v ideos by mailing lin ks to them, o r emb edding the m on web p ages o r in blogs. User s ca n also rate and com ment on videos, b ringing new social aspects to the viewing o f v ideos. Consequ ently , pop ular video s can rise to the to p in a very organic fashion. The social network existing in Y ouT ube fur ther enables commun ities and grou ps. V id eos are no longer independ ent from each other, and n either are users. This h as substantially contributed to the success of Y ouT ub e and similar sites. B. W orklo ad Measur ement of T raditional Media Servers There h as bee n a significant research effort in to u nderstand - ing th e workloads of traditional media servers, loo king at, for example, the video popularity an d access locality [3]–[ 6]. The different aspects o f m edia and web ob jects, an d those of li ve and stored vide o strea ms have also bee n compa red [7 ], [8]. W e have foun d th at, while sh aring similar fe atures, many of th e vid eo statistics of these tr aditional med ia servers are quite different from Y ouT u be; for example, the video le ngth distribution and life span . More imp ortantly , these traditio nal studies lack a so cial network amo ng the vid eos. The mo st similar work to ours is the very re cent study by Huang et. al. [ 9]. They analyz ed a 9-mo nth trace o f MSN V ideo , Microsoft’ s V oD service, examining th e user b ehavior and po pularity distribution of video s. This analysis led to a peer-assisted V oD design for reducing the server’ s bandwidth costs. The difference to our work is that MSN V ide o is a more tradition al video serv ice, with much fewer vid eos, mo st of which are longer tha n all Y ouT ube video s. MSN V id eo a lso has no listings of related v ideos o r user inform ation, and th us no social networking aspect. I I I . M E T H O D O L O G Y O F M E A S U R E M E N T In th is p aper, we focus o n th e access patterns and social networks present in Y ouTube. T o this end, we ha ve crawled the Y ouT ub e site for a 3-mon th period and ob tained infor mation on its videos thro ugh a combination of the Y ouT ub e API and scrapes of Y ouTube video web pag es. The results offer a series of repre sentativ e par tial snapshots of the Y ouT u be video repository a s well as its chan ging trends. A. V ideo F ormat and Meta-data Y ouT ub e’ s video playback technology is based on Macro- media’ s Flash Player and uses the Sorenson Spark H.263 video codec with p ixel d imensions of 3 20 by 24 0 an d 25 f rames per second. This technolog y allows Y ouT u be to display vid eos with q uality comp arable to m ore established video p layback technolog ies (such as Wi ndows Media Player, Realplayer o r ID 2A Y A Y2T Lves Uploader GrimSanto Added Date May 19, 2007 Category Gadgets & Games Vi deo Length 268 seconds Number of Views 185,615 Number of Ratings 546 Number of Comments 588 Related Videos aUXoek eDIW8, Sog2k6s7xVQ, . . . T ABLE I M E TA - DATA O F A Y O U T U B E V I D E O Apple’ s Quicktime Player). Y ouT ube accep ts u ploaded vid eos in WMV , A VI , MOV and MPEG for mats, which are c on verted into .FL V (Ad obe Flash V id eo) format after u ploadin g [ 10]. It has been re cognized that the use of a uniform easily-play able format has been a key in the succ ess o f Y ouTube. There are many ways that Y ouTube’ s service differs from a traditional m edia server . Y ouT ube’ s FL V vid eos ar e not streamed to the user , b ut are instead downloaded o ver a no rmal HTTP conn ection. They are also not rate contro lled to the playback r ate of the vid eo but are sent a t the ma ximum rate that the server and user can acco mplish, and there is no user interactivity fr om the server’ s point of view (except fo r possibly stopping the download). In order to fast for ward the user must wait for th at part of the video to download, and pausing the playback do es not p ause the download. Y ouT ub e randomly assigns each video a distinct 64 -bit number, which is repr esented in base 64 by an 11-digit I D composed of 0-9, a-z, A- Z, -, and . Each video contains the following intuitive me ta-data: user wh o uploaded it, date when it was uploaded, category , leng th, numb er of views, number of ratin gs, numb er o f comm ents, an d a list o f “related videos”. The related vid eos are links to o ther vide os that h av e a similar title, description , or tags, all of which are chosen by the u ploader . A vid eo can have hund reds of re lated v ideos, but the webpag e only shows at m ost 20 at onc e, so we limit our scr ape to these top 20 related vide os. A typical example of the meta-data is shown in T able I. B. Y ou T ube Crawler W e con sider all the Y ouT u be v ideos to form a d irected graph, wher e each video is a no de in the gr aph. If video b is in the related vid eo list (first 20 on ly) of video a , then there is a directed edge from a to b . Our crawler u ses a breadth- first search to find v ideos in the gra ph. W e d efine the initial set of 0-depth video IDs, which th e crawler reads in to a qu eue at the b eginning o f the crawl. When processing each video, it checks the list o f re lated video s and a dds any n ew o nes to the queue. The cr awler is single-thr eaded to av oid bein g suspected of a network attack. Giv en a video ID, the crawler first extracts informatio n from the Y ouT ub e API, which contains all the meta-d ata e xcept date added, categor y , a nd related videos. The cr awler the n scr apes the v ideo’ s webpage to obtain the r emaining informatio n. 3 Our first crawl w as on February 22nd, 2007, and started with the initial set of v ideos from th e list o f “Recently Featu red”, “Most V ie wed”, “T op Rated” a nd “Most Discussed”, for “T od ay”, “This W eek”, “This Mon th” and ”All T ime”, which totalled 189 u nique vide os on that day . The crawl went to more than four depths (the fifth was not completed), finding approx imately 750 thousand videos in about five days. In th e following weeks we ran th e the crawler ev ery two to three day s, each time defining the initial set of vid eos from th e list of “Most V iewed”, “T op Rated”, and “Most Discussed”, for “T oday” and “ This W eek”, which is abou t 20 0 to 300 videos. On av erage, the crawl finds 8 0 thou sand video s each time in less th an 10 h ours. T o study the growth trend of the vid eo p opular ity , we also use the crawler to u pdate the statistics of some pr eviously found videos. For this cr awl we o nly retriev e th e number of views for relativ ely n ew videos (upload ed after Febru ary 15 th, 2007) . This crawl is performed o nce a week fr om March 5th to April 16th 2007, which results in seven datasets. W e also separately crawled the file size and bit-rate infor- mation. T o get the file size, the crawler retrieves the r esponse informa tion from th e server when req uesting to download the video file and extracts the inf ormation on the size of the download. Some videos also have the bit- rate embedd ed in the FL V vid eo meta-data, wh ich the crawler extracts after downloading the beginning of the vid eo file. Finally , we hav e also collecte d some information about Y ouT ub e users. The crawler retrieves info rmation on the number of uploaded videos and f riends of ea ch user from the Y ouT ub e API, for a total of m ore than 1 million users. I V . C H A R AC T E R I S T I C S O F Y O U T U B E V I D E O From the first cr awling on Febr uary 22nd, 2007, to the end of April, 2007 , we have ob tained 27 d atasets to taling 2,676 ,388 v ideos. Th is con stitutes a significant po rtion of the entire Y ouT ube video repo sitory (there are a n estimated 42.5 million vid eos o n Y ouT u be [11]) . Also, because most of these videos can be accessed from the Y ouT ube homepag e in less than 10 clicks, they are genera lly active and thus representative for measuring characteristics of th e rep ository . In the measuremen ts, some char acteristics are static and can be measured once from the entire dataset: e.g. cate gory , length, and date a dded. Some characteristics are dynamic and c an change from da taset to dataset: e.g. number of views, ra tings, and commen ts. W e con sider this dy namic in formatio n to be static over a single crawl. Later , the updated number of views informa tion will be used to measure th e growth trend and lif e span of v ideos. A. V ideo Category One o f 1 2 categories is selected b y th e user when u ploading the video. T ab le II lists the numb er an d percentage of all the categories, wh ich is also shown graphically in Figur e 1. In our entire d ataset we can see th at the distribution is highly ske wed: the most p opular category is Music, at about 22.9%; Category Count Per centage Autos & V ehic les 66878 2.5% Comedy 323814 1 2.1% Entertai nment 475821 1 7.8% Film & Animation 225817 8.4% Gadgets & Games 196026 7.3% Ho wto & DIY 53291 2.0% Music 613754 22.9% Ne ws & Politics 116153 4.3% People & Blogs 199014 7.4% Pets & Animals 50092 1.9% Sports 258375 9.7% Tra vel & Places 5 8678 2.2% Unav ailable 24068 0.9% Remov ed 14607 0.5% T ABLE II L I S T O F Y O U T U B E V I D E O C ATE G O R I E S 0 5 10 15 20 25 Music Entertainment Comedy Sports Film & Animation People & Blogs Gadgets & Games News & Politics Autos & Vehicles Travel & Places Howto & DIY Pets & Animals Unavailable Removed Category Percentage (%) Fig. 1. Distributio n of Y ouTube V ideos’ Categori es the second is En tertainment, at about 17.8 %; and the third is Comedy , at about 12 .1%. In the table, we also list two oth er categories. “Un av ailab le” are vid eos set to priv ate, or videos that have been flagge d as inappro priate video , wh ich the crawler ca n only get inform a- tion for from the Y ouT u be API. “Removed” ar e videos th at have been d eleted by the u ploader, or by a Y ouT ub e moderator (due to the violation of the terms of use), but still a re linked to b y other videos. B. V ideo Length The length of Y ouTube videos is th e biggest d ifference from traditional media content servers. Whe reas most traditional servers contain a small to m edium n umber of long vide os, typically 0 .5-2 ho ur movies (e. g. HPLab s Media Server [3]) , Y ouT ub e is mostly comprised of v ideos that are sho rt clip s. In our entire dataset, 97.8% of the videos’ lengths are within 600 seconds, and 99.1% are within 700 seconds. This is mainly due to the lim it o f 1 0 m inutes im posed b y Y ouT ube on r egular users u ploads. W e d o fin d video s longer than this lim it th ough , as the limit was on ly established in March, 20 06, and also the Y ouT ub e Director Pro gram allows a small grou p of au thorized users to u pload videos lo nger than 1 0 minutes [ 12]. Figure 2 shows the histogram of Y ouT u be videos’ lengths 4 0 100 200 300 400 500 600 0 0.5 1 1.5 2 2.5 x 10 5 Video Length (sec) Number of Videos Fig. 2. Distrib ution of V ideo Length 0 200 400 600 0 2 4 6 x 10 4 Music 0 200 400 600 0 2 4 6 x 10 4 Entertainment 0 200 400 600 0 2 4 6 x 10 4 Comedy 0 200 400 600 0 2 4 6 x 10 4 Sports Fig. 3. V ideo Length for the 4 Most Popular Cate gories 100 200 300 400 0 2000 4000 6000 8000 10000 12000 Bit−rate (kbps) Number of Videos Fig. 4. V ideo Bit-rate Parame ter Peak 1 Peak 2 Peak 3 The Rest µ 16 208 583 295 σ 62 58 16 172 r 48.6% 26.2% 2.7% 22.5% T ABLE III P A R A M E T E R S F O R T H E A G G R E G AT E D N O R M A L D I S T R I B U T I O N within 700 seconds, which exhibits th ree peaks. The first peak is with in one m inute, and con tains mor e than 20% of the videos, which shows that Y ouT ube is primarily a site for very short videos. The secon d peak is between 3 and 4 min utes, and contain s abo ut 16.7% of the vide os. Th is peak is m ainly caused by the large numb er of videos in the “Music” ca tegory . Music is the m ost pop ular category for Y ouT ube, a nd the typical leng th o f a music vid eo is often within th is rang e, as shown in Figur e 3. Th e th ird peak is near the maximum of 10 minutes, and is caused by the limit on th e length of uploade d video s. This enco urages some u sers to circum vent the length restriction by dividing long videos into se veral parts, each being near the limit of 10 minutes. W e find that the the length histogram can be fit by an aggregate of fo ur norm al distributions, whose p arameters are shown in T able III. Th e location parameter µ deter mines the mean, the scale parameter σ determines the width, and the ratio r shows the weight of the four curves in the aggregated distribution. T he first thr ee column s in the ta ble corresp ond to th e three p eaks of the distribution, while the last column represents the rest o f th e data. Figure 3 shows the vide o len gth h istograms for th e top four most p opular categor ies. W e can see “Music” video s have a very large p eak between three and fo ur minutes, and “Entertainmen t” v ideos h av e a similar (thou gh smaller) peak. In comparison, “Comedy” and “Spo rts” video s h av e more videos with in two minutes, pr obably correspo nding to “highligh t” typ e clip s. W e also u sed an agg regated no rmal distribution to get the fits for th e four len gth distributions. C. File Size and Bit-rate Using the vid eo IDs fro m th e n ormal crawl on Ap ril 10th 2007 (ab out 20 0 th ousand v ideos), we retrieved the file size o f nearly 1 90 th ousand videos. In o ur c rawled da ta, 98 .8% of th e videos ar e less than 30MB. No t sur prisingly , we find th at the distribution of video sizes is very similar to the d istribution of video leng ths. W e calcu late an average vid eo file size to be about 8.4 MBytes. Considering th ere are over 42.5 million Y ouT ub e video s, the to tal disk space required to store all the videos is more than 357 terabytes! Smart storag e man agemen t is thus q uite deman ding for such a u ltra-huge and still gr owing site, which we will discu ss in m ore de tail in Section VI. W e found that 87.6 % of the vid eos we crawled contain ed FL V me ta-data specifying the video’ s bit-r ate in the beginn ing of the file, ind icating th at they are Constant-Bit-Rate ( CBR). For the rest of the v ideos that do n ot contain this m eta-data (prob ably V ariable-Bit-Rate, o r VBR, v ideos), we calculate a n av erage bit- rate f rom th e file size an d its length. In Fig ure 4, the v ideos’ bit- rate h as three clear peaks. Most videos h av e a b it-rate aro und 330 kbps, with two other peaks at aro und 285 kbps and 200 k bps. This implies that Y ouT ub e videos have a moderate bit-r ate that balanc es the quality an d the b andwidth . D. Date Added – Gr owth T rend o f Uploading During ou r crawl we record the d ate th at each video was uploade d, so we can study the growth tre nd of Y ouT ub e. Figure 5 shows the n umber of new videos added every two weeks in o ur entire crawled dataset. February 15th , 2005 is the d ay that Y ouT ub e was estab - lished. Ou r first crawl was on Februar y 22nd , 2007, th us we can get the early videos only if they are still very popular videos or are linked to by other video s we crawled. W e can see there is a slow start, th e earliest v ideo we crawled was uploaded on Apr il 27th, 2005. After 6 m onths fro m Y ouT ub e’ s establishme nt, th e n umber of uploade d videos increases steeply . W e use a power law curve to fit this trend . In the data set we collected , the number of u ploaded videos decreases linearly an d steeply starting in March, 2007. How- ev er , this doe s not im ply that the u ploading rate of Y ouT ube videos h as suddenly d ecreased. The reason is that ma ny recently uploa ded v ideos hav e not been so p opular, and are probab ly not listed in other vid eos related videos’ list. Since few videos have linked to those new videos, th ey are not likely 5 05/02 05/05 05/08 05/11 06/02 06/05 06/08 06/11 07/02 07/05 0 0.2 0.4 0.6 0.8 1 1.2 1.4 1.6 1.8 2 x 10 5 Date Added (yy/mm) Number of Videos (in two weeks) All Crawled Data 02/22 Data Power−Law (power=1.91) Fig. 5. Date Added 10 0 10 1 10 2 10 3 10 4 10 5 10 0 10 2 10 4 10 6 Rank Number of Views Measured Views Weibull (k=0.51, λ =6700) Gamma (k=0.44, θ =23300) Zipf (a=0.54) Fig. 6. Rank of V iews 10 0 10 1 10 2 10 3 10 4 10 5 10 0 10 1 10 2 10 3 10 4 10 5 Rank Number of Ratings and Comments Ratings Comments Fig. 7. Rank of Ratings and Comments to be f ound by our crawler . Ne vertheless, as th ose videos become popu lar or get linked to by oth ers, our crawler may find them an d get their info rmation. Comparing the entir e dataset to the first and largest d ataset, which was crawled on February 22nd, we also see the same trend . E. V iews, Ratings – User Acc e ss P attern The num ber o f views a video h as had is th e most impo rtant characteristic we measur ed, as it reflects th e popularity and access pa tterns of the videos. Because this pro perty is chan g- ing over time, we canno t use the entire d ataset that combines all the d ata together . Therefor e we use a single dataset from April 3r d, 20 07, contain ing more tha n 100 thousan d videos, which is co nsidered to be r elati vely static. Figure 6 shows the number o f views as a f unction of the rank of the video by its number of views. Tho ugh the plot has a lon g tail on the linear scale, it do es NOT follow a Zip f distribution, which should b e a straight line o n a log- log scale. This is co nsistent with some p revious observations [3]– [6] that also fo und that video acc esses o n a media server does no t follow Zip f ’ s law . W e can see in the figur e, th e beginning o f the curve is linear on a log -log scale, but the tail (a fter the 2 × 10 3 video) d ecreases tre mendou sly , ind icating there are not so many less popu lar videos as Zipf ’ s law p redicts. Th is result seems consistent with som e results [6] , but differs f rom others [3]–[5 ] in wh ich the cur ve is ske wed from linear fro m beginning to en d. Their r esults indica te that th e popu lar videos are also not as popu lar as Zip f ’ s law p redicts, wh ich is not the case in our exper iment. T o fit the skewed curve, some use a g eneralized Zip f- like distribution [3], while o thers use a concatenation of two Zipf-like distributions [ 5]. Because our curve is different, we attempted to use three different d istributions: W eibull, Gamm a and Zipf. W e find that W eibull and Gam ma distributions b oth fit better th an Zipf, du e to the dro p-off in th e tail (in log -log scale) that th ey have. Figure 7 plo ts the num ber of r atings a gainst th e ran k of the video b y the nu mber of ratings, and sim ilarly for the nu mber of comments. The two both have the same distribution, and are very similar to the plo t of th e number of views in Figure 6, y et the tails of the two do not drop so q uickly co mpared to that of number of v iews. F . Gr owth T r end of Number of V iews and Active Life S pan Comparing the popu larity of Y ouT ube video s, we find that some are very popular (their number of vie w s grows very fast), while o thers a re n ot. Also, af ter a c ertain per iod of time, some videos are a lmost never watched . Starting on March 5th, 2 007, we updated the number of vie ws statistic of relati vely new video s (u ploaded after February 1 5th, 20 07) every wee k f or seven weeks. T o be sure the gr owth tren d will be properly mo delled, we eliminate any v ideos that hav e b een removed an d so do not have the full sev en data points, resultin g in a dataset size totaling approx imately 43 thousand v ideos. W e have f ound that the g rowth tren d can be mod eled better by a power law than a linear fit. Therefo re, a v ideo’ s growth trend c an be increasing (if the power is grea ter than 1), growing relatively constan tly (power near 1) , or slowing in growth (po wer less than 1). The trend depends on the exponent factor used in the power law , which we c all the gr owth trend factor p . W e define th e v iews count after x we eks as v ( x ) = v 0 × ( x + µ ) p µ p (1) where µ is th e numb er of we eks befor e March 5 th that the video has been uploaded , x in dicates the week o f the cr awled data (from 0 to 6), and v 0 is the nu mber of v ie ws the video had on March 5th. W e m odelled the 43 thousand v ideos using equation 1 to get the distribution of g rowth trend factors p , which is shown in Figure 8. Over 70% of the videos have a growth tren d factor th at is less th an 1, indicating that most videos grow in popular ity more slowly as time passes. Since Y ouT ube has no po licy on removin g videos afte r a period o f time or wh en th eir popu larity declines, the life span of a Y ouT ube vid eo is almo st infinite. However , wh en the video’ s popularity grows more and mo re slowly , the p opularity growth curve will b ecome h orizontal. Since it will almost stop growing after som e time, we will define th at as the v ideo’ s activ e life span. From this active life span, we ca n extract some characteristics o f the temporal lo cality o f v ideos. If a video’ s numb er of views increases by a factor less than t from the previous week , we d efine the vid eo’ s active lif e span to be over . W e p refer this relativ e comparison to an absolu te 6 0 0.5 1 1.5 2 2.5 3 0 100 200 300 400 500 Growth Trend Factor Frequency Fig. 8. Growth Trend Factor 10 0 10 1 10 2 10 3 10 4 10 5 10 0 10 1 10 2 10 3 10 4 Active Life Span (weeks) Frequency Active Life Span Pareto (k=1.06) Fig. 9. Es timated Acti ve L ife Span (t=10%) 10 0 10 2 10 4 10 6 10 0 10 1 10 2 10 3 10 4 10 5 Rank Number of Friends Measured Friends Weibull (k=0.32, λ =32500) Gamma (k=0.25, θ =37900) Zipf (a=0.79) Fig. 10. Rank of User Friends compariso n, since we a re only conc erned with the sh ape of the curve instead of the scale. For ea ch v ideo th at has a growth trend factor p less than 1, we can compute its a cti ve life span l fr om v ( l ) v ( l − 1) − 1 = t which can b e solved for the active life spa n l = 1 p √ 1 + t − 1 + 1 − µ (2) Thus w e see that the active life span is depende nt o n the growth tr end factor p and the n umber o f weeks th e video h as been on Y ouT ube, but does not depend on the number of views the video had a t the start of the experimen t. Figure 9 shows the pro bability den sity fu nction (PDF) for the acti ve life span of the approx imately 30 thou sand video s (with p less than 1) , for a life span factor of t = 10% . Th e solid line is the Pareto distribution fit to the data, wh ich fits very well, and results in a par ameter k of 1.06 . From lo oking at multiple fits with various values o f t , we find that they all result in the same parameter k , th e o nly d ifference is the location of the line . Since we do no t have the server logs of Y ouTube, we cann ot accurately measure the characteristic of tempor al locality , which would sh ow whether recently acce ssed videos ar e likely to be accessed in the ne ar futur e. However , the a cti ve life span g iv es us another way to v iew the te mporal lo cality of Y ouT ub e videos. Figure 9 implies that most videos have a short activ e life span, which means the videos have been watched frequen tly in a short span of time. Then, after t he video’ s acti ve life span is complete, fewer and fewer peop le will access them. This c haracteristic has good imp lications fo r web caching and server stora ge. W e can de sign a p redictor to predict the activ e life span u sing o ur active life span mo del f rom equ ation 2. The predicto r can help a prox y or server to make mor e intelligent decisions, such as when to drop a video from the cache. W e will discuss this in more detail in Section VI. V . T H E S O C I A L N E T W O R K I N Y O U T U B E Y ouT ub e is a prom inent so cial media app lication: th ere are commun ities and group s in Y ouT u be, th ere are statistics a nd awards for v ideos and personal ch annels. V id eos are no lo nger indepen dent fr om each other, and neither are the users. It is therefor e impor tant to understand the social ne twork ch arac- teristics of Y ouT ube. W e n ext examin e the social n etwork among Y ouT ube users and v ideos, which is a very u nique and in teresting aspec t of this k ind o f video sharing sites, as compare d to traditional media serv ices. A. User F riend s an d Upload W e hav e exam ined th e relations amo ng the Y ouT ube user s. From the crawl of user information we performed on May 28th 2007, we can extrac t two ch aracteristics o f Y ouTube users: the number o f f riends and th e numb er of uploa ded vid eos. W e did this for the more than 1 million users fou nd by our crawler in all the cr awls per formed b efore th is one. Figure 10 shows the number of fr iends each u ser has, compare d with the rank of th e user by the number of f riends. Compared with p revious p lots, it is much closer to linear on a log-log scale, though we still use the same three distributions to g et the b est fit. Inter estingly , in over 1 million users’ data, we found that 58% of th e user’ s have no fr iends. W e believe that th is is pa rtially becau se Y ouT ube is still qu ite yo ung, with more co nnection s to be established between its users. W e also plotted the numb er o f upload ed videos each user has, comp ared with the rank of th e user by n umber of u ploads. It is very similar to th e pr evious p lots o f th e nu mber of views and friends, a nd so we o mit it fo r b revity . B. S m a ll-W orld Networks Small-world network phenomen on is pr obably the most interesting charac teristic for social networks. It h as been foun d in various real-world situations: URL links in the W eb [13] , Gnutella’ s sear ch overlay to polog y [14], and Freenet’ s file distribution network [ 15]. The concept of a small-world was first intr oduced by Milgram [16 ] to refer to the the principle th at people are linked to all others b y short chain s of acquaintan ces (popularly known as six degr ees o f separation ). This fo rmulation was used by W atts and Strogatz to describe networks that are neither comp letely rand om, nor comp letely regular , b u t possess characteristics of bo th [17]. They introduce a measure of one of these characteristics, the cliquishne ss o f a typical neighbo rhood , as the clustering coefficient of the graph. They 7 02/22 03/08 03/22 04/05 04/19 05/03 10 2 10 3 10 4 10 5 10 6 10 7 Crawl Date (mm/dd) Number of Nodes All Crawled Nodes LCC Random Graph Fig. 11. Dataset Size 10 2 10 3 10 4 10 5 10 6 10 7 0 0.1 0.2 0.3 0.4 0.5 0.6 0.7 0.8 Dataset Size Average Clustering Coefficient All Crawled Nodes LCC Random Graph Fig. 12. Clustering Coef ficient 10 2 10 3 10 4 10 5 10 6 10 7 0 5 10 15 20 25 30 35 40 Dataset Size Characteristic Path Length LCC Random Graph Fig. 13. Characteri stic Path Length define a small- world graph as o ne in which the clustering coefficient is still large, a s in regular graphs, but the me asure of the average distanc e betwee n n odes (the cha racteristic path length ) is small, as in rand om g raphs. Giv en the network a s a gr aph G = ( V , E ) , the clustering coefficient C i of a node i ∈ V is th e pro portion of all th e possible edg es b etween neigh bors o f the nod e that actually exist in the graph. The clustering coef ficient of the graph C ( G ) is th en the average of the clu stering coe fficients of all n odes in the grap h. T he c haracteristic path leng th d i of a no de i ∈ V is the average o f the minim um numb er o f hops it takes to reach all other nod es in V from nod e i . The characteristic path length of the graph D ( G ) is then the av erage of the characteristic path lengths of all n odes in the gr aph. C. Th e S mall-W orld in Y ouT ube W e measured the g raph top ology for all the Y ouT ube data gathered , b y using th e related links in Y ouT u be pages to for m directed edg es in a video graph for each data set. V ideos that have n o outgoin g o r no in coming links are removed from the analysis. In addition, a combined dataset consisting o f all the crawled data integrated into on e set is also cre ated. Since not all of Y ouT ube is crawled, the resultin g g raphs are not strongly connected, making it d ifficult to calculate the characteristic path len gth. Therefor e, we also use the Largest strongly Connected Compo nent (LCC) of each g raph for the measuremen ts. Every crawled d ataset ther efore r esults in 2 graphs, plus 2 m ore graphs fo r the combined da taset. For compar ison, we also g enerate rand om graph s that are strongly conn ected. Each of the random grap hs h as the same number of nod es and average n ode degree of the strongly connected compon ent of the crawled data set, and is also limited to a maximu m node out-d egree of 20, similar to the crawled d atasets. The o nly exception is the comb ined d ataset of all the crawled d ata, which was too large to gen erate a compara ble random graph for . Some graphs use th e dataset size for th e x -axis v alues, so that we can see tre nds as the dataset size in creases. T his is very info rmative, as we are n ot m apping th e entire Y ouT ube website, but only a por tion of it. Theref ore, some extrapolation as the dataset size incre ases will be needed to draw insights into the graph formed b y all o f th e Y ouT ub e videos. Figure 1 1 shows the dataset sizes a nd the date th ey were created on. It also has the strong ly connec ted co mponen t size and the rando m graph size, bo th of wh ich ar e very close to the total dataset size for the larger d atasets. The com bined d ataset is also shown, and is given the most recent date. By far the largest crawled d ataset is th e first one, crawled on Feb 22. Figure 1 2 shows the av erage clustering coefficient for the entire g raph, as a function of the size o f the data set. The clustering co efficient is quite high in most c ases, especially in compariso n to the random graphs. There is a noticeable drop in the clustering coefficient for th e largest datasets, sh owing that th ere is some inverse dependenc e on the size of th e gr aph, which is co mmon for some small- world networks [18]. Figure 13 shows the character istic path leng th f or each of the datasets’ graphs. T here are two factors influencing the shape of the graph. As the dataset size increases, the maximum possible diameter incr eases, wh ich is seen in the smallest datasets. Once the dataset reach es a size of a few th ousand nodes, the diameter starts to decrease as the small-w orld nature of the g raph becomes evident. For the largest da tasets, the av erage diam eter is only slightly larger than the diameter of a random g raph, which is qu ite go od co nsidering the still large clustering c oefficient of these datasets. The ne twork form ed by Y ouTube’ s related v ideos list has definite small-world characteristics. Th e clu stering co efficient is very large compared to a similar sized rando m graph , while the char acteristic path length of the larger datasets are approa ching th e shor t path lengths m easured in the r andom graphs. This find ing is expected, du e to the user-genera ted nature of the tags, title and description of the vid eos that is used by Y ouTube to find related o nes. These results are similar to othe r real-world user-generated graphs that exist, yet their parameters can b e q uite d ifferent. For examp le, the graph for med b y URL links in the world wide web exhib its a much longer ch aracteristic p ath len gth of 18.59 [13]. This could po ssibly b e due to the larger number of nodes ( 8 × 10 8 in the web), but it may also ind icate that the Y ouTube network of v ideos is a mu ch closer gr oup. V I . F U RT H E R D I S C U S S I O N S A very re cent study shows that Y ouT ube alone has com- prised ap proxim ately 20% o f a ll HTTP traffic, or nearly 1 0% 8 10 1 10 2 10 3 10 4 10 5 0.2 0.4 0.6 0.8 1 Cache Size (MByte, Prefix size is 200 KBytes) Hit−Ratio Fig. 14. Cac he Size to Hit-ratio 10 0 10 1 10 2 10 3 0 20 40 60 80 100 Update Threshold (weeks) Accuracy % t=10% t=50% Fig. 15. Accurac y to Update Threshold 10 0 10 1 10 2 10 3 10 4 10 5 10 6 10 7 10 0 10 1 10 2 10 3 10 4 10 5 10 6 10 7 Node Number of Views Average Neighbor Number of Views Fig. 16. V iews to Neighbor V iews Correla tion of all traffic o n the Intern et, with a nearly 2 0% growth rate per month [19], [20 ]. Assuming the network traffic co st is $10/Mbp s, the estimated Y ouT ube transit expenses is cur rently more than $ 2 m illion per m onth. This high a nd rising expense for network traffic is pr obably one o f the reasons Y ouTube was sold to Goog le. According to Alexa [21], th e curr ent speed of Y ouT ube has beco me “V ery Slow” an d is co nsidered slower than 81 % of the surveyed sites. This situation is only g etting worse. Scalability is n o d oubt the big gest challenge that Y ouT ube faces, par ticularly conside ring that websites such as Y ouT ube survive by attracting more users. I n th is section , we briefly discuss the implications of ou r measurem ent results toward improving the scalability of Y ouT u be. A. Imp lications o n P r oxy Caching and Storage Man agement Caching frequen tly used data at proxies clo se to clients is an effectiv e way to save backbon e ba ndwidth and prevent users from experienc ing excessiv e access dela ys. Numerou s algorithm s have b een developed for caching web objects or streaming videos. While we believe th at Y ou T u be will benefit from prox y caching [22 ], three distinct featu res call for novel cache design s. First, the nu mber o f Y ouT ub e videos (42.5 million [3]) is orders of magnitude higher than that of traditional video strea ms (e.g. HPC: 2999, HPL: 412 [11]) . Th e size of Y ouT ub e video s is also muc h smaller than a traditional video (98. 8% ar e less than 30M B in Y ouT u be versu s a typical MPEG-1 m ovie of 700MB). Finally , the view frequen cies of Y ouT ub e vid eos do not well fit a Zip f distribution, which has importan t implication s on web caching [23]. Considering these facto rs, fu ll-object cachin g for web or segment caching for s treaming video are not practical solutions for Y ouTube. Prefix cachin g [24 ] is p robab ly the b est cho ice. Assume f or each video , the proxy will cache a 5 second initial clip, i. e. ab out 2 00KB o f the vid eo. Given the G amma distribution of vie w frequ ency suggested by o ur measurements, we plot the hit-r atio as a function of the cache size in Figure 14, assuming that the cache space is d ev o ted only to the most popular v ideos. T o achieve a 6 0% hit-ratio, the prox y would require about 1 GByte of disk space for the cur rent Y ouT u be video r epository , and nearly 8 GByte for a 9 5% h it-ratio. Such demand on d isk space is acceptable for today ’ s p roxy ser vers. Giv en the co nstant evolution of Y ouTube’ s video rep ository , a remain ing critical issue is wh en to release th e space f or a cached prefix. W e found in Section IV -F that the active life span of Y ouT u be video s follows a P areto distribution, implying that m ost video s are popular du ring a relativ ely short span o f time. The refore, a predictor can be developed to fo recast the activ e life span of a video. W ith the predicto r , the p roxy can decide wh ich vid eos have already passed their lif e span , and replace it if the cach e spac e is in sufficient. The life span pre dictor can also facilitate disk space managem ent on the Y ouT ube server . Curren tly , vide os on a Y ouT ub e server will no t be removed by the op erator u nless they violate the terms o f service. W ith a d aily 65,000 new videos introd uced, the server storage will soon become a problem . A hierarchica l storage structure can be built w ith videos passing their acti ve life span being moved to slower and cheaper stora ge med ia. From our 30 thousand v ideos da taset (Section IV -F), we calcu late the pred ictor accu racy f rom the number o f videos th at h av e an active life span (a ccording to equation 2) less th an an upda te threshold divided by the total number of videos, which is plotted in Figu re 1 5. This result facilitates the d etermination o f an update thre shold for the predictor with a given accuracy . The cache ef ficiency can be f urther improved by exploring the small-world characteristic of the r elated video links (see Section V -C). That is, if a group of video s ha ve a tight relation , then a user is likely to watch ano ther video in the gr oup after finishin g th e first one. T his expectatio n is co nfirmed by Figure 16, wh ich shows a clear corr elation between th e number of views an d the a verage of th e neig hbors’ numbe r o f views. Once a vid eo is played and cached, the prefixes o f its directly related video s can also be prefe tched an d cached, if the cache space allows. W e h av e evaluated the effectiv eness of this prefetching strategy , which shows that the resultant hit-ratio is almost th e same a s that of always caching the most po pular v ideos, and yet its com munication overhead is significantly lo wer b ecause it does not hav e to keep track of the m ost popular videos list. B. Can P eer -to-P ee r Save Y o uT ube? Short v ideo sharing and p eer-to-peer streaming have been widely cited as two key driving for ces to Internet v ideo 9 distribution, yet their dev elopment remains largely separ ated. The p eer-to-peer technolo gy has been qu ite successfu l in sup- porting large-scale li ve video streaming (e.g. TV progra ms like PPLi ve an d CoolStreaming ) and ev en on -deman d streaming (e.g. Grid Media). Since each p eer co ntributes its band width to serve oth ers, a p eer-to-peer overlay scales extremely well with larger user b ases. Y ouTube and similar sites still use the traditional client- server architecture, restricting their scalabil- ity . Unfortu nately , o ur Y ouT ube measuremen t results sugg est that usin g peer-to-peer deliv ery fo r Y ouT ube co uld be q uite challengin g. In particular, the length of a Y ouTube video is quite short (m any are shorter th an th e typical co nnection time in a peer-to-peer overlay), and a user often quick ly loads another v ideo when finishing a previous one, so the overlay will suffer from an extremely h igh ch urn ra te. Mo reover , there are a hug e n umber of vide os, so the peer-to-peer overlays will appear very small. 1 Our social n etwork fin ding again could be e xploited by considerin g a group of related video s as a single large video, with each v ideo in the grou p being a p ortion o f the large o ne. Therefo re the overlay would b e much larger and more stable. Although a u ser may on ly watch one vide o from the group , it can download the other portion s of the large vide o from the server when there is enoug h ba ndwidth and space, a nd upload those downloaded portions to other clien ts wh o are interested in them. This b ehavior can significantly reduce the bandwidth consump tion from the server an d greatly increase the scalability of th e system. Finally , note that a nother bene fit of using a peer-to-peer model is to av oid sing le-point of failures and e nhance data av ailab ility . While this is in gener al attracti ve, it is worth noting that timely rem oving of video s that vio late the te rms of use (e.g., co pyright-pr otected o r illegal conten t, referred to by the “Removed” category in Sectio n IV -A) have constantly been o ne of the m ost ann oying issues fo r Y ouTube and similar sites. Peer-to-peer deliv ery will clearly make the situation even worse, which m ust be well-addressed b efore we shift such sites to the peer-to-peer commun ication parad igm. V I I . C O N C L U S I O N This p aper h as presented a detailed investigation of the characteristics of Y ouT ube , the mo st pop ular Inte rnet short video sharing site to date. Throu gh examining the massive amounts of da ta co llected in a 3-month perio d, we have demonstra ted that, while sharing certain similar features with traditional vid eo rep ositories, Y ouT u be exhibits many un ique characteristics, especially in leng th distrib ution, access pattern , and growth trend. Th ese characteristics intro duce novel chal- lenges and op portun ities for optimizing th e p erforma nce o f short video sharing serv ices. W e have also in vestigated the social n etwork among Y ouT ub e video s, which is probably its most uniqu e and 1 A very recent study on MSN V ideo [9] has sugge sted a peer-assisted V oD . W e notic e howe ve r that the statist ics for MSN V ideo are quite diffe rent from Y ouTu be, and the techniq ue has yet to be substantiall y re vised for Y ouT ube. interesting aspect, and h as substantially contributed to the success of this new g eneration of serv ice. W e have f ound that the networks of related video s, which are ch osen based o n user-generated conte nt, ha ve both small-world ch aracteristics of a sho rt character istic path length linking any two videos, a nd a large clustering co efficient indicating the gro uping of videos. W e have su ggested that these featu res can be exploited to facilitate th e de sign o f n ovel caching o r p eer-to-peer strategies for short video shar ing. R E F E R E N C E S [1] Y ouT ube serves up 100 mill ion videos a day online. [Online]. A vaila ble: http:/ /www .usatoday .com/tech/ news/2006- 07- 16 - you tube- views x.htm [2] Y ouT ube video-sha ring site is chang- ing popular culture. [Onl ine]. A v ail able: http:/ /www .kcrw .com/news/pro grams/ww/ww061122youtube video- sharin [3] W . T ang, Y . Fu, L . Cherkaso v a, and A. V ahdat , “Long-term Streaming Media Serve r W orkload Analysis and Modeling, ” HP Labs, T ech. Rep., 2003. [4] J. M. Almeida , J. Kruege r , D. L. Eager , and M. K. V ernon, “Analysis of Educati onal Media Server W orkloads, ” in Pr oc. NOSSDA V’01 . [5] S. Acharya , B. Smith, and P . Parn es, “Characteri zing Us er Access T o V ideos On The W orld Wi de W eb, ” in Proc. SPIE’00 . [6] H. Y u, D. Zheng, B. Y . Zhao, and W . Zheng, “Understanding User Beha vior in Large-Scale V ideo-on-Demand Systems, ” in E ur oSys’06 . [7] M. Che sire, A. W olman, G. M. V oelk er , and H. M. Le vy , “Measurement and Analysis of a S treaming -Media W orkload, ” in Proc . USITS’01 . [8] E . V eloso, V . Almeida, W . Meira, A. Bestavro s, and S. Jin, “A Hierar - chica l Characte rizat ion of a L i ve Strea ming Media W orkload, ” in Pr oc. SIGCOMM’02 . [9] C. Huang, J. Li, and K. W . Ross, “Can Internet V ideo-on-Demand be Profitable ?” in SIGCOMM’07 , 2007. [10] Y ouT ube: V ideo Format (from Wi kipedi a). [Online]. A v aila ble: http:/ /en.wikip edia.or g/wiki/Y outube#V ideo format [11] Google frames a video search engine. [Online]. A v ail able: http:/ /google system.blogspot .com/2007/06/google- videos- new- frame.html [12] Y ouT ube Blog. [Online]. A va ilabl e: http: //yout ube.com/blo g [13] R. Alber t, H. Jeong, and A. Barabasi, “The Diameter of the W orld Wi de W eb, ” Natur e , vol. 401, pp. 130–131, 1999. [14] G. Liu, M. Hu, B. Fang , and H. Zhang, “Measurement and Model ing of Large-Sc ale Peer -to-Peer Storage System, ” Lecture Notes in Computer Scienc e , pp. 270–277, 2004. [15] T . Hong, “Performance, ” in P eer-to-P eer: Harnessing the P ower of Disruptive T echnolo gies , A. Oram, E d. Sebastopol, CA, USA: O’Reilly & Ass ociat es, Inc., 2001, ch. 14, pp. 203–241. [16] S. Milgram, “The Small W orld Problem, ” P sychol ogy T oday , vol. 2, no. 1, pp. 60–67, 1967. [17] D. W atts and S. Strogatz, “Collect i ve Dynamics of ‘Small-W orld’ Networ ks, ” Nature , vol. 393, no. 6684, pp. 409–10, 1998. [18] E. Rava sz and A. -L. Barab ´ asi, “Hierarchic al organiza tion in complex netw orks, ” Physical Revie w E , vol. 67, no. 2, p. 026112, F eb 2003. [19] Ellacoya data shows web traf fic ov ertak es Peer -to-Pee r (P2P) as larg est perce ntage of bandwi dth on the netwo rk. [Online ]. A vai lable: http:/ /www .ellaco ya.com/ne ws/pdf/2007/NXTcommEllacoyaMed iaAlert.pdf [20] C. Corbett, P eering of V ideo , 2006. [21] Alexa. [Online]. A vail able: http: //www .alexa .com [22] J. Liu and J. Xu, “Proxy Cac hing for Media Streamin g over the Inte rnet, ” IEEE Communications Magazine , vol . 42, no. 8, pp. 88–94, 2004. [23] L. Breslau, P . Cao, L . Fan, G. Phillips, and S. Shenker , “W eb Caching and Zipf-lik e Distributions: Evidence and Implicatio ns, ” in INFO- COM’99 . [24] S. Sen, J. Re xford, and D. F . T owsle y , “Proxy Prefix Cachi ng for Multimedi a Streams, ” in INFOCOM’99 .
Original Paper
Loading high-quality paper...
Comments & Academic Discussion
Loading comments...
Leave a Comment