Dependable Exploitation of High-Dimensional Unlabeled Data in an Assumption-Lean Framework
Semi-supervised learning has attracted significant attention due to the proliferation of applications featuring limited labeled data but abundant unlabeled data. In this paper, we examine the statistical inference problem in an assumption-lean fram…
Authors: Chao Ying, Siyi Deng, Yang Ning
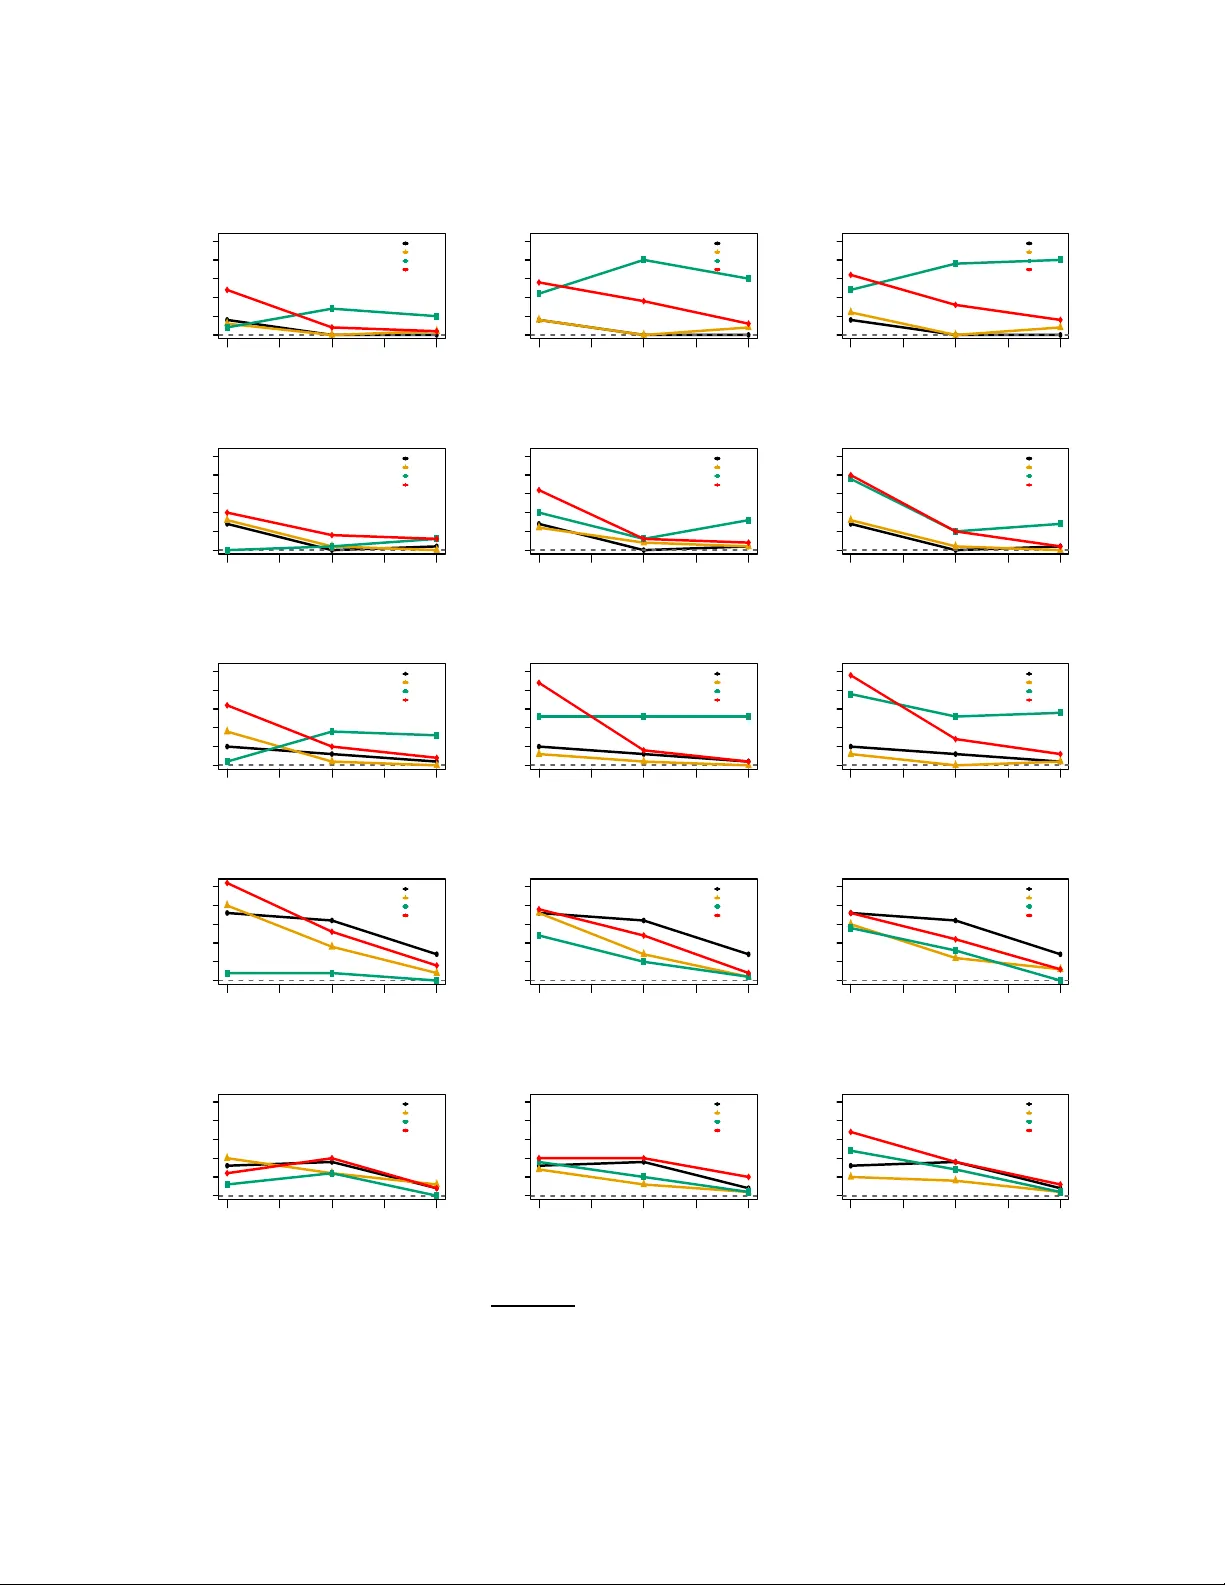
Dep endable Exploitation of High-Dimensional Unlab eled Data in an Assumption-Lean F ramew ork Chao Ying ∗ a , Siyi Deng b , Y ang Ning b , Jiwei Zhao a , and H eping Z hang c a Universit y of Wiscon si n-Madison b Cornel l University c Y ale Universit y Marc h 31, 202 6 Abstract Semi-sup er v ised learning has attracted significan t atten tion due to the proliferation of applications f eaturing limited lab eled d ata bu t abund an t u nlab eled data. In this pap er, w e examine the statisti cal inference problem in an assumption-lean framew ork whic h in vo lve s a high-dimensional regression parameter, defined b y m inimizing the least squares, within the con text of semi-sup ervised learning. W e inv estiga te when and ho w un lab eled d ata can enh ance th e estimation efficiency of a regression parameter functional. First, we demonstrate that a straigh tforw ard debiased estimator can only b e more efficien t than its sup er v ised counterpart if the unkno wn cond itional mean function can b e consistently estimate d at an a pp ropriate rate . Otherwise, incorp orat- ing un lab eled data can actually b e counterpro ductiv e. T o addr ess this vulnerabilit y , w e prop ose a n o v el estimator guarante ed to b e at least as efficien t as the sup ervised ∗ This w ork w as completed while the first author was affiliated with the Universit y of Wisco nsin-Madison. baseline, ev en w hen the conditional mean fu nction is missp ecified. This ensu res th e dep end able use of unlab eled data for statistical inference. Finally , we extend our ap- proac h to the general M-estimation f ramew ork, and demonstrate the effectiv eness of our me tho d ology through comprehens iv e simulatio n studies and a real d ata applicatio n. Key W or ds: Semi-sup ervised learning, model miss p ecification, high-dimensional inference, assumption-lean framework, efficiency gain, semiparametric efficiency . 2 1 In tro duction 1.1 Motiv ation: abun dan t high-dimensional unlab eled data Unlab eled da ta are typic ally more a bundant than lab eled data, as collecting r a w informat io n is often far easier a nd less costly than man ual annot a tion. In many real- w orld settings, data are contin uously generated thro ugh sensors, transactions, medical records, and user in teractions, while lab eling requires h uman exp ertise, t ime, and resources. F or example , in healthcare, v ast amounts of electronic health records (EHRs) are generated da ily , but annotating them for sp ecific diseases or conditions requires exp ert clinicians. Similarly , in computer vision, millions of images and videos are uploaded online, ye t la b eling them with precise ob ject categories demands significan t manu al effort. Unlab eled data are o ften high-dimensional b ecause they a re collected f r om complex real- w orld sources that capture a v ast array of features w ithout prior filtering or a nno t ation. F or instance, in EHRs, a single patien t’s history can include n umerous la b results, diagnoses, pre- scriptions, and phys iological measuremen ts, eac h con tributing to a high-dimensional feature space. In computer vision, images and videos consist of millions of pixels, each repres en ting a separate dimension. Lik ewise, in natural lang ua ge pro cessing, ra w text data encompass ex- tensiv e v o cabulary and con textual dep endencies, making them inheren tly high- dimensional. 1.2 Our approac h: dep endable exploitation in an assumption-lean framew ork Throughout, supp o se w e observ e n indep enden t and iden tically distributed (i.i.d.) samples p X 1 , Y 1 q , ¨ ¨ ¨ , p X n , Y n q „ p X , Y q f r o m the lab eled data, and N i.i.d. samples, X n ` 1 , ¨ ¨ ¨ , X N ` n „ X , from the unlab eled data . F or notation simplicit y , we denote by X “ p X 1 , ¨ ¨ ¨ , X n q T P R n ˆ p , Y “ p Y 1 , ¨ ¨ ¨ , Y n q T P R n , and r X “ p X 1 , ¨ ¨ ¨ , X N ` n q T P R p N ` n qˆ p . Note that p can b e m uc h la rger than n , and there is no requiremen t b et w een N and n . Due to the complex and heterogeneous nature of abundan t unlab eled data, estimation 1 problems can b e casted in the general assumption-lean framew ork (Buja et al. 2 019, Berk et al. 2021), where the parameter of in terest θ ˚ is defined via minimizing a loss function suc h as the least squares, while the true conditional mean might be hard or ev en infeasible to b e consisten tly estimated under high- dimensionalit y . T o b e more sp ecific, w e consider Y “ f p X q ` ǫ, (1) where f p X q is the conditional mean function E p Y | X q , ǫ is indep endent of X P R p with E p ǫ q “ 0, E p ǫ 2 q “ σ 2 , and σ 2 is an unkno wn parameter. F or simplicit y , w e ass ume E p X q “ 0 and E t f p X qu “ 0. Additionally , we consider linear regression as the w orking mo del whic h leads to the in tercept term as 0. Since E tp Y ´ X T θ q 2 u “ E rt f p X q ´ X T θ u 2 s ` σ 2 , the regression co efficien ts in a linear model correspond to the L 2 p P q pro jection of f p X q on to the linear space spanned b y X , i.e., θ ˚ “ arg min θ P R p E rt f p X q ´ X T θ u 2 s P R p , whic h describ es the linear dep endence betw een Y and X . Our goal is to construct an a symptotically normal estimator of the line ar functional of θ ˚ that, no matter whether the linear model is correctly sp ecified or f p X q is consisten tly estimated, is guaranteed to b e no less efficien t than the sup ervised estimator ( the one that uses lab eled data only; e.g., debiased lasso estimator). As no t ed a b o ve , the parameter θ ˚ admits a clear in terpretation under missp ecification of mo del (1 ). The prop osed metho d nat ur a lly extends t o mor e sophisticated settings suc h as the M-estimation; we defer details to Section 4. 1.3 Our no v el con tributions Adopting the assumption-lean framew ork, D eng et al. (2024) prop osed estimators of θ ˚ that can hav e a faster con v ergence rate t han the sup ervised estimators and can a c hiev e the optimal rate under certain conditions, but they did not study the asymptotic v ariance of the prop osed estimator. Indeed, the limiting distribution of their prop osed estimators a r e in tractable due to the regularization. 2 In this pap er, distinct from Deng et al. (20 24), our ultimate goal is to answe r the question: How to pr op ose an estimator of the li n e ar functional of θ ˚ , that is asymptotic al ly norma l , and is guar an te e d to b e no less efficien t than the sup ervise d estimator, no matter whether the line ar mo del is c orr e ctly sp e ci fi e d or the c o nditional me an function is c onsis tently estimate d? T o answ er this question, a natura l c hoice is t he debiased estimator; e.g., o ne can construct a one-step debiased estimator p θ d , using p θ S D prop osed in Deng et al. ( 2 024) as the initial (details are given in Section 2.2 ) . Indeed, one can sho w that the corresp onding estimator v T p θ d , with an y v P R p , is asymptotically normal and can attain the semiparametric efficiency b ound under certain conditio ns. Ho w ev er, its p erformance dep ends on the consistency of the estimate of f p X q . If f p X q cannot b e consisten tly estimated, v T p θ d is not guaran teed to b e more efficien t than the sup ervised debiased lasso estimator. Therefore, this debiased approac h do es not answ er the question ab ov e w ell. In this pap er, w e pro p ose a dep endable semi-sup ervised estimator whic h do es not require the estimate of f p X q . The main idea is to construct a set of un biased estimating f unctions and decorrelate the score function to reduce the v a riabilit y . I n Theorem 1 b elow, we sho w that the prop osed estimator v T p θ d S,ψ is a symptotically normal, where ψ is a tuning par a meter. When the linear mo del is missp ecified and lim n Ñ8 n n ` N “ ρ for some 0 ď ρ ă 1, the estimator v T p θ d S,ψ with 0 ă ψ ă 2 is strictly more efficien t tha n the debiased lasso, leading to mo r e p o we rful hy p othesis tes ts and shorter confidence interv als. W e attain the maxim um v ar ia nce reduction b y c ho o sing ψ “ 1. In addition, if either the linear mo del is correctly sp ecified f p X q “ X T θ ˚ or t he size of the unlab eled data is small in that lim n Ñ8 n n ` N “ 1 (i.e., N ! n ), the estimator v T p θ d S,ψ is asymptotically equiv alent to the debiased lasso estimator. In summary , the estimator v T p θ d S,ψ pro vides a dep endable use of the unlab eled data , since it is a lw a ys no worse than the sup ervised estimators, no matter whether the linear mo del is correctly sp ecified or the conditional mean function is consisten tly estimated. 3 1.4 Relev an t literat ure The b enefits of using a bundan t unlab eled da ta ha v e b een p opularly in v estigated b y b oth computer scien tists and statisticians. In problems with discrete lab els, res earch ers ha v e pro- p osed a v ariety of classification algo r it hms under common assumptions suc h as manifold assumption and cluster assumption; see, e.g., Rigollet (200 7), W ang et al. ( 2022) and com- prehensiv e surv ey articles (Zh u 20 05, Chap elle et al. 20 09). In nonparametric regression, W asserman & Laffert y ( 2 007) dev elop ed a n estimator that can improv e the r a te of the mean squared error under the semi-sup ervised smo othness ass umption; also see Kostop oulos et al. (2018) for an extensiv e review of semi-sup ervised regression. In recen t y ears, significant progress has b een made o n utilizing unlab eled data f o r param- eter estimation or empirical risk minimization (Y uv al & Rosset 2022 ) . How ev er, the question w e p o sed in Section 1.3, along with the goal w e a im to achie ve in this pa p er, has no t b een thoroughly a ddressed in the literature. The relev ant studies review ed in this section either imp ose restrictiv e conditions o r yield limited results. In the lo w and fixed dimensionalit y setting, for parameter estimation, Chakrab ortty & Cai (2018) and Azriel et al. (2022) prop osed estimators that are more efficien t than the least square estimator that uses lab eled da t a only , for eac h comp onent of θ ˚ . How eve r, t he efficiency impro v emen t has no guarantee for the linear com bination o f θ ˚ suc h as θ ˚ 1 ` θ ˚ 2 . Allo wing t he dimensionalit y to grow with n , the sample size of the la b eled data, Zhang et al. (201 9) prop osed a general s emi-sup ervised inference framew ork to improv e the estima- tion o f the p opulation mean E p Y q without sp ecific distributional assumptions relating the outcome Y and the cov ar ia te X . How ev er, Zha ng et al. (20 1 9) can only allo w the dimen- sionalit y to gro w with a no faster than n 1 { 2 rate. Similar conclusions could also b e found under the general M-estimation framew ork (So ng et al. 202 4). With high-dimensional data, Zhang & Bradic (2022) prop osed semi-sup ervised estima- tors of p opulation mean and v ariance and established their asymptotic distributions; how - ev er, they required lim n Ñ8 n n ` N ă 1 { 2 to g ua r an tee the dep endable inference on E p Y q (i.e., 4 more efficien t than the sample mean of Y in the lab eled data). In the high dimensional regime, Cai & G uo (2020) considered how to estimate the explained v a riance θ ˚ T Σ θ ˚ in the semi-sup ervised setting. T heir estimator a c hiev ed the optimal rate of con v ergence and w as asymptotically normal; ho w ev er, their results w ere established under the a ssumption that the w orking linear mo del is correctly sp ecified, whic h differed fr o m the assumption-lean framew ork. In a high dimensional linear regression setting, the parameter o f interes t studied in Chen & Zhang (2023) is the regr ession co efficien t asso ciated with one particular co v a r ia te, and this par ticular cov a riate play s the critical role in defining the discrepancy b et w een the distributions of the lab eled and unlab eled data. Chen & Zhang (20 23) studied the b enefits of the unlab eled data in terms of enhancing efficiency and robustness, but their pr o p osed metho ds hea vily rely on the mo del among the co v ariates under different sparse or dense structures. Additionally , Chakrab ortt y et al. (2022) concen trated on quan tile estimation under high dimensionality , adopting the similar idea as Song et a l. (2024). In the absence of sparsity , Livne et al. (202 2) studied the problem o f estimating the conditional v ariance of X giv en Y in a linear regression mo del. W hile Hou et al. (2023) prop osed a notable approac h termed surrog ate assisted semi-sup ervised inference, their estimator r emained vul- nerable b ecause its consistency dep ended en tirely on a correctly sp ecified imputation mo del. Also, their framew ork lac k ed guarantee s for the dep endable use of unlab eled data. Our w ork is related to a grow ing literature that strengthens statistical inference b y lev eraging AI/ML predictions (W ang et al. 2020, Mot w ani & Witten 2023). F or exam- ple, prediction-p ow ered inferenc e (PPI ), introduced by Angelop oulos, Bates , F annjiang, Jor- dan & Zrnic (2 023), is a semi-supervised framew ork tha t uses predictions from an AI/ML mo del to enable v alid statistical inference; ho w ev er, PPI can b e less efficien t than the naiv e lab eled-only estimator so may fail to reliably lev erage unlab eled data. In resp onse, sev eral metho ds w ere prop osed ov er the pa st three y ears to address this efficiency gap. F or scalar parameters, Ang elop oulos, D uc hi & Zrnic (2 023) prop osed a simple tuning pro cedure that guaran tees efficiency gain ev en under prediction-mo del missp ecification. More broadly , Miao 5 et al. (20 2 5) dev elop ed a p ost-prediction adaptive inference approac h that guarantees v alid inference without assumptions on the qualit y of the ML predictions; Gronsb ell et al. (2025) studied inference under squared-error loss; and Shan et al. (20 25) extended these ideas to settings with m ultiple sets of predictions. D espite these adv ances, this line of w ork t ypically defines the tar get parameter in a standar d low-dimens ional setting. In con trast, in this pa- p er, we study how to reliably exploit unlab eled data in a n assumption-lean, high-dimensional regime, where the parameter of interes t is defined through the high-dimensional co efficien t v ector in a linear working mo del. This setting is particularly relev a n t when the go a l is to c haracterize the a sso ciation b et w een the response and a high-dimensional co v ariate (or a functional thereof ). T o attain efficiency dominance, o ur prop osed estimator do es not require estimating f p X q ; it is t herefore prediction-free and agnostic to t he outcome mean mo del. In addition, accoun ting for high dimensionalit y is cen tral to our theoretical a na lysis and in tro duces additional tec hnical c hallenges. 1.5 Structure of the pap er and notation Structure In what follo ws, Section 2 pro vides preliminary materials, with Section 2.2 reviewing the straigh tforward debiased estimator whic h relies on a consiste nt estimate of f p X q . In Section 3, w e prop ose a nov el dep endable pro cedure whic h do es not rely on the estimation of f p X q and is gua ran teed to b e no worse than the one using the lab eled data only . Our prop osal can b e naturally extended to more sophisticated settings suc h a s the M-estimation, with details in Section 4. Numerical exp erimen ts and a real data application are in Sec tions 5 and 6, respective ly . The pap er is concluded with a discussion in Section 7. All the tec hnical pro ofs are contained in the Supplemen t. Notation F or v “ p v p 1 q , ¨ ¨ ¨ , v p p q q T P R p , and 1 ď q ď 8 , w e define k v k q “ p ř p i “ 1 | v p i q | q q 1 { q , k v k 0 “ |t i : v p i q ‰ 0 u| , where | A | is the cardinalit y of a set A . D enote k v k 8 “ max 1 ď i ď p | v p i q | and v b 2 “ v v T . F or a matrix M “ r M ij s , define k M k max “ max ij | M ij | , k M k 1 “ max j ř i | M ij | , 6 k M k 8 “ max i ř j | M ij | . F o r S Ď t 1 , ¨ ¨ ¨ , p u , let v S “ t v p k q : k P S u and S c b e the comple- men t of S . F or mat r ix X P R n ˆ p and index set L Ď t 1 , ¨ ¨ ¨ , n u , X L “ t X i ¨ : i P L u T P R | L |ˆ p . F or tw o p ositive sequenc es a n and b n , w e write a n — b n if C ď a n { b n ď C 1 for some C , C 1 ą 0. Similarly , w e use a À b to denote a ď C b for some constan t C ą 0. 2 Preliminaries 2.1 Review of estimation and inference with lab eled data only In sup ervised learning t ha t only uses the la b eled data , there are a larg e n um b er of p enalized metho ds fo r estimating θ ˚ , suc h as lasso (Tibshirani 19 96) and Da n tzig selector ( Candes & T ao 2007). The sup ervised D an tzig selector is defined as p θ D “ arg min } θ } 1 , s.t. › › › 1 n n ÿ i “ 1 p Y i ´ X T i θ q X i › › › 8 ď λ D , (2) where λ D is a tuning para meter. Similarly , the sup ervised lasso estimator is defined as p θ L “ arg min θ P R p ř n i “ 1 p Y i ´ X T i θ q 2 {p 2 n q ` λ L k θ k 1 . The Da ntzig selector and la sso are the- oretically equiv alen t (Tsybak ov et al. 2009). F or statistical inference, there has b een some recen t researc h on debiased lasso estimators for h yp othesis tests and confidence interv als, for example, Zhang & Zhang (2014), V an de Geer et a l. (2014), Jav anmard & Montanari (2014), Cai & Guo (20 17), Ning & Liu (20 1 7), Neyk o v et al. (2018), a list tha t is far from ex- haustiv e. Under certain regularity conditions suc h as s log p { ? n “ o p 1 q , follow ing the pro of in B ¨ uhlmann & V an de G eer (201 5), one can show that, the debiased lasso estimator for v T θ ˚ is ? n -consisten t and the corresp onding asymptotic v ariance equals v T Ω K Ω v , where Ω “ Σ ´ 1 is the precision matrix and K “ E p T b 2 i 1 q ; see Remark 2 in Section 3.3. While considerable progress has b een made tow ar ds understanding estimation and infer- ence in the fully sup ervised setting, researc h in the semi-supervised setting remains limited. Notably , under mo del (1), where linear regres sion se rve s as the w orking mo del, the co v aria t e 7 X no longer functions as an ancillary statistic for the regression parameter θ ˚ . Therefore, the informat io n of X in the unlab eled data may impro v e the estimation and inference of θ ˚ . 2.2 Straigh tforw ard debiased estimato r In an earlier w ork, D eng et al. (20 24) prop osed a semi-sup ervised estimator p θ S D in their Section 3 . As long as the conditional mean function is consisten tly estimated by p f p¨q a nd some regularit y conditions ar e satisfied, Theorem 3.2 in Deng et al. (2024) sho w ed that p θ S D is minimax optimal. T o b e more sp ecific, p θ S D “ arg min } θ } 1 , s.t. } p Σ n ` N θ ´ p ξ } 8 ď λ S D , (3) where the cross-fitting tec hnique (with details pro vided in Algorithm 1) is used to compute p ξ ; i.e., p ξ “ p p ξ 1 ` p ξ 2 q{ 2, p ξ j “ 1 n j ř i P D ˚ j X i Y i ´ 1 n j ř i P D ˚ j X i p f ´ j p X i q ` 1 n j ` N j ř i P D j X i p f ´ j p X i q . Motiv ated by the form ulation of the regularized estimator p θ S D in (3), one can view h p r X , Y ; θ q “ p Σ n ` N θ ´ p ξ as an estimating function f or θ . Borrow ing the idea from the classical one-step estimator a nd the debiased lasso, one can easily construct p θ d “ p θ S D ´ p Ω h p r X , Y ; p θ S D q “ p θ S D ` p Ω p p ξ ´ p Σ n ` N p θ S D q , (4) where p Ω is an estimator of Ω “ Σ ´ 1 with details provided in Supplemen t S.3.2. In Supplemen t S.3.1 , w e detail the theoretical prop erties of the debiased estimator p θ d . More sp ecifically , under some assumptions and certain regularit y conditions, the debiased estimator v T p θ d is ? n -consisten t, and the corresp onding asymptotic v aria nce is v T p σ 2 Ω ` n n ` N Γ q v , where Γ “ E r W b 2 t f p X q ´ X T θ ˚ u 2 s and W “ ΩX . Moreov er, one can show that n 1 { 2 v T p p θ d ´ θ ˚ q{t v T p p σ 2 p Ω ` n n ` N p Γ q v u 1 { 2 d Ý Ñ N p 0 , 1 q , where the sp ecific form of the estimators p σ 2 , p Ω and p Γ are pro vided in Supplemen t S.3.2. Ho w ev er, the debiased estimator has a serious drawbac k. The consistency and asymptotic normalit y of p θ d relies on the consisten t estimation of the conditional mean function f p X q , 8 sa y , p f p X q . If, unfo rtunately , f p X q cannot b e consisten tly estimated, the estimator v T p θ d is not guaranteed to b e mor e efficien t tha n the sup ervised debiased lasso estimators (V an de Geer et al. 2 014). This is not an ideal phenomenon. The main go a l of this pap er, with the no v el metho d presen ted b elo w in Section 3, is to prop ose an estimator tha t is g uaran teed to b e alw a ys more efficien t than the sup ervised debiased lasso estimators, thus pro vides the dep endable use of the unlab eled data. 3 Prop osed Es t imator to w ards De p endable Semi-Sup ervis e d Infere n ce T o exploit high-dimensional unlab eled data, the most difficult step is to estimate the con- ditional mean function f p X q correctly . In this section w e prop ose a nov el dep endable semi- sup ervised inference approac h, whic h do es not rely on the estimation of the conditional mean function but guaran tees t he efficienc y gain compared to the su p ervised approac h, thus pro vides the dep endable use of the unlab eled dat a. 3.1 Motiv ation Giv en any p -dimensional function m p X q : R p Ñ R , defi ne µ “ E t X m p X qu , then X m p X q ´ µ is an un biased estimating function fo r zero. While it do es not directly inv olve the unkno wn parameter θ ˚ , it do es pla y a n imp or t a n t role in the dep endable semi-sup ervised inference approac h. Using X m p X q ´ µ as the cov ariate, w e p ostulate a p -v ariate w orking regression mo del with resp onse v ar ia ble X p Y ´ X T θ ˚ q ; i.e., X p Y ´ X T θ ˚ q “ B T t X m p X q ´ µ u ` E , (5) where E P R p is the error ve ctor and the co efficien t matrix B P R p ˆ p is B “ p E rt X m p X q ´ µ u b 2 sq ´ 1 E t X b 2 m p X qp Y ´ X T θ ˚ qu . Since (5) is only a w orking mo del, the error E and the 9 co v ar ia te X m p X q ´ µ are no t necess arily indep enden t. Recall t hat the resp onse v ariable X p Y ´ X T θ ˚ q correspo nds to the score function of θ ˚ in t he line ar regression mo del, and can b e rewritten as X t ǫ ` η p X qu , where ǫ “ Y ´ f p X q and η p X q “ f p X q ´ X T θ ˚ is the nonlinear effect. Since ǫ and X m p X q ´ µ a r e independen t, the goal of mo del (5) is to explain the nonlinear effect X η p X q b y the co v ariate X m p X q ´ µ . Indeed, w e sho w in Remark 3 that the optimal choice of m p X q is η p X q and in this case the nonlinear effect X η p X q can be perfectly explained b y X m p X q ´ µ . Giv en X m p X q ´ µ and the co efficien t matrix B , we define a class of un biased estimating functions for θ ˚ as h ψ p X , Y ; θ q “ X p Y ´ X T θ q ´ ψ B T t X m p X q ´ µ u “ ¯ ξ ψ ´ XX T θ , where ¯ ξ ψ “ X Y ´ ψ B T t X m p X q ´ µ u , (6) with ψ P R b eing a tuning parameter that balances t w o unbiased functions X m p X q ´ µ and X p Y ´ X T θ ˚ q . In particular, w e ha v e E t h ψ p X , Y ; θ ˚ qu “ 0 for any ψ . Indeed, w e sho w in Remark 2 that the optimal c hoice of ψ is ψ “ 1, whic h implies h ψ p X , Y ; θ ˚ q “ E in view of (5). Th us, from a geometric p ersp ectiv e, h ψ p X , Y ; θ q is t he residual by pro jecting the score function X p Y ´ X T θ q o n to the set of unbiased estimating functions X m p X q ´ µ in the L 2 p P q norm. F ollow ing the insigh t from the ab o v e geometric in terpretation, w e now prop ose the dep endable semi-sup ervised inference approa c h. 3.2 Dep endable semi-sup ervised inference T o formulate the inference pro cedure, we first consider how to estimate the co efficien t matrix B . In view of (5) and the follow up discussion, to estimate B , w e can either pre-sp ecify a nonlinear function m p X q o r p erhaps use a mo r e flexible appro a c h to estimate m p X q from the data. T o see t his, w e can define m p X q “ a rg min g P G E t Y ´ g p X qu 2 , where G is a pre- sp ecified class of functions of X ; e.g., class o f linear functions, additive functions, functions corresp ond to interaction mo del (Zhao & Leng 2016), single-index mo del (Radch enk o 2015, 10 Y ang, Bala subramanian & Liu 2017, Eftekhari et al. 2 0 21) or m ulti-index mo del (Y ang, Balasubramanian, W ang & Liu 2017). Conside r a concrete example where the c hoice of G “ t ř p j “ 1 α j X j ` ř 1 ď k ă ℓ ď p β k ℓ X ℓ X k : α j , β k ℓ P R u corresp onds to the class of functions with main effects and the second-order in teractions. By fitting a p enalized in teraction mo del (Zhao & Leng 20 1 6), w e can c onstruct an estimator p m p X q . In the rest of the pap er, w e assume an estimator p m p X q of m p X q is av a ila ble. The detailed tec hnical conditions on p m p X q are s hown in Assumption 1 and Theorem 1. More discussions ab out other c hoices of class G can b e found in the Supplemen t S.5.2. W e a pply a cross-fitting approach to estimate B . Giv en the estimator p m ´ j p¨q obta ined fr o m the lab eled data D ˚ z D ˚ j for j “ 1 , 2, w e can estimate the k th column o f B b y p B j ¨ k “ arg min β P R p 1 n j ÿ i P D ˚ j ” X ik p Y i ´ X T i p θ D q ´ β T t X i p m ´ j p X i q ´ p µ j u ı 2 ` r λ k k β k 1 , (7) where p θ D is the sup ervised D an tzig estimator in (2 ), p µ j “ 1 n j ř i P D ˚ j p m ´ j p X i q X i , λ D and r λ k are t wo tuning para meters. W e note that it is p ossible t o estimate µ “ E t X m p X qu b y using b oth lab eled and unlab eled data D j . How eve r, t he rate of the estimator p B j ¨ k remains the same. The final estimator of B ¨ k is p B ¨ k “ p p B 1 ¨ k ` p B 2 ¨ k q{ 2, and this leads t o p B “ p p B ¨ 1 , ..., p B ¨ p q . Motiv ated by the form of ¯ ξ ψ in (6), w e construct the following estimate of ξ “ E p X Y q , p ξ S,ψ “ ř n i “ 1 X i Y i n ´ ψ 2 p B T 2 ÿ j “ 1 # ř i P D ˚ j X i p m ´ j p X i q n j ´ ř i P D j X i p m ´ j p X i q n j ` N j + , (8) where w e apply the cross-fitting tec hnique again. W e note that differen t from the estimator p µ j used in p B j ¨ k , w e estimate µ b y 1 n j ` N j ř i P D j X i p m ´ j p X i q in (8), whic h incorp orates the information from the unlab eled data. Similar to p θ d in (4), w e prop ose the followin g dep endable semi-sup ervised estimator p θ d S,ψ “ p θ D ` p Ω p p ξ S,ψ ´ p Σ n p θ D q , (9) 11 where p θ D is the sup ervised Dan tzig estimator in (2), p ξ S,ψ is defined in (8), p Σ n “ 1 n ř n i “ 1 X b 2 i and p Ω is the no de-wise lasso estimator in (S.11). It is worth while to note tha t we estimate Σ by p Σ n in (9) , whereas w e use p Σ n ` N “ 1 n ` N ř n ` N i “ 1 X b 2 i in the estimator p θ d . Indeed, this is a critical difference as replacing p Σ n with p Σ n ` N in (9) corresp o nds to an estimating function differen t fr o m h ψ p X , Y ; θ q and therefore no longer leads to a more efficien t estimator. 3.3 Theory T o show the theoretical prop erties of p θ d S,ψ , w e require t he follow ing a ssumptions. Assumption 1. (E1) Th e smal lest eige n value of E rt X m p X q ´ µ u b 2 s is lower b ounde d by a p ositive c onstant. The 2nd moment of E j in (5) is less than C and | m p X i q| ď C , for so m e c onstant C . The estimator p m ´ j p¨q satisfie s k p m ´ j ´ m k 2 “ O p p c n q for a deterministic se quenc e c n . We r e quir e s B K 2 1 ´ c n ` b log p n ¯ “ o p 1 q and b s l og p n “ O p 1 q . (E2) T he c olumns of the matrix B ar e sp arse with max 1 ď k ď p k B ¨ k k 0 “ s B and max 1 ď k ď p k B ¨ k k 1 ď L B for some L B that may gr ow wi th n . (E3) k Ω k 8 ď L Ω and p K 1 L Ω q 2 s Ω a log p {p n ` N q “ o p 1 q , wh e r e s Ω is the ma x i m um r owwise sp a rs ity o f Ω define d in Assumption S.2 (pr esente d in Suppleme nt S.3. 1 ). (E4) E | ǫ | 2 ` δ “ O p 1 q and E | η | 2 ` δ “ O p 1 q , wher e ǫ “ Y ´ f p X q and η “ f p X q ´ X T θ ˚ . Assumption (E1) guara n tees that the restricted eigen v alue (R E) condition holds for the estimation of B ¨ k in (7). Ass umption (E2) is the sparsit y assumption of B ¨ k . F or example, in the ideal case that w e choo se m p X q “ f p X q ´ X T θ ˚ and then B “ I p is sparse. W e note that there are o t her practical s ettings that the sparsit y assumption of B ¨ k is reas onable (e.g., X is blo c kwise indep enden t). W e defer the detailed discuss ion to Supplemen t S.5.1. In Assump tion (E2), we further require that the matrix L 8 norm of B is b ounded by L B , whic h is used to establish the rate o f p B . Assumption (E3) and (A2) in Assumption S.1 (presen ted in Supplemen t S.3.1) together imply the strong b oundedness condition a nd 12 max 1 ď i ď n ` N max 1 ď k ď p | X T i, ´ k γ k | “ O p K q in V an de Geer et al. (2014) which further guar- an tees the rate of p Ω in the matrix L 8 norm. In particular, t o con trol t he remainder term in the asymptotic expansion o f p θ d S,ψ , w e need k Ω k 8 ď L Ω . T og ether with the b ounded- ness assumption } X i } 8 ď K 1 in Assumption S.1 (presen ted in Supplemen t S.3.1 ), it implies } ΩX i } 8 ď k Ω k 8 } X i } 8 ď K 1 L Ω . Not e that (E3) is equiv alen t to Assumption S.2 (presen ted in Supplemen t S.3 .1 ) b y replacing K 1 L Ω with K . Assumption (E4) a ssumes that ǫ a nd η ha v e b ounded p 2 ` δ q momen t, which is used to simplify the Ly apuno v condition. Denote Γ ψ “ E p T b 2 i 1 q ´ N p 2 ψ ´ ψ 2 q n ` N t E p T i 2 T T i 1 qu T t E p T b 2 i 2 qu ´ 1 E p T i 2 T T i 1 q , (10) where T i 1 “ X i p Y i ´ X T i θ ˚ q and T i 2 “ X i m p X i q ´ µ . Theorem 1. Supp ose Assumptions 1 and S. 1 (pr esente d in Supplement S.3.1) hold. We cho ose λ D — K 1 b p σ 2 ` Φ 2 q log p n in (2), λ k — K b log p n ` N in (S.9) and r λ k “ r λ opt in (7), wher e r λ opt is define d in Pr op osition S.2. Then for any v ‰ 0 P R p , v T p p θ d S,ψ ´ θ ˚ q e quals v T Ω « X T p Y ´ X θ ˚ q n ´ ψ B T # ř n i “ 1 X i m p X i q n ´ ř n ` N i “ 1 X i m p X i q n ` N +ff ` O p p ¯ δ n q , (11) wher e ¯ δ n “ } v } 1 L Ω K 2 1 b log p n ! L B s Ω b log p n ` N ` s 1 { 2 B L B ´ b log p n ` c n ¯ ` K 1 p s _ s B q b log p n ) with c n define d in Assumption 1 (E1) and E rt f p X q ´ X T θ ˚ u 2 s ď Φ 2 . In addition, if v T ΩΓ ψ Ω v ě C } v } 2 2 for s o me c on stant C , ¯ δ n {} v } 2 “ o p n ´ 1 { 2 q an d ´ } v } 1 L Ω K 1 } v } 2 ¯ 2 ` δ 1 n δ { 2 ´ 1 ` L 2 ` δ B N n ` N ¯ “ o p 1 q , (12) then n 1 { 2 v T p p θ d S,ψ ´ θ ˚ q{p v T ΩΓ ψ Ω v q 1 { 2 d Ý Ñ N p 0 , 1 q . W e now elab orate on the tec hnical conditions used in Theorem 1. In (11), the remainder term ¯ δ n c haracterizes t he effect of the plug-in estimators p Ω , p B and p θ D . T o establish the asymptotic normalit y of v T p p θ d S,ψ ´ θ ˚ q , w e further need to assume tha t δ n is sufficie ntly 13 small and the Ly apuno v condition (12) holds so tha t one can apply the cen tral limit t heorem to the leading terms in (11). T o further simplify the conditions in Theorem 1, one can assume } v } 1 {} v } 2 , K 1 , L Ω , L B are all of order O p 1 q . As a result, (12 ) alw ays holds and the condition ¯ δ n {} v } 2 “ o p n ´ 1 { 2 q is implied by s Ω log p ? n ` N ` p s _ s B q log p ? n ` s 1 { 2 B c n a log p “ o p 1 q . (13) Note that the condition s p log p { ? n q “ o p 1 q implied b y (13) is actually sligh tly stronger than the condition (S.8) required b y the debiased estimator v T p θ d , with details presen ted in Theorem S.1 in Supplemen t S.3.1. This is b ecause p θ D is not only used as an initial estimator when constructing the one-step estimator p θ d S,ψ but also used as a plug-in estimator to estimate B in (7 ). The error of p θ D accum ulates in t he asymptotic e xpansion of v T p p θ d S,ψ ´ θ ˚ q , leading to the slow order s p log p { ? n q in ( 1 3). In terms of the rat e of p m ´ j in the L 2 p P q norm, (13) requires c n “ o tp s B log p q ´ 1 { 2 u , sligh tly stronger than the condition for p f ´ j in (S.8). Notably , the condition } v } 1 {} v } 2 “ O p 1 q is not alw ay s satisfied; in this case, (13) b ecomes } v } 1 } v } 2 " s Ω log p ? n ` N ` p s _ s B q log p ? n ` s 1 { 2 B c n a log p ` n ´ δ 2 p 2 ` δ q * “ o p 1 q . (14) Remark 1. The b ound in (14) r e quir es that the r atio } v } 1 {} v } 2 not b e to o lar ge, which excludes c ases wher e v c ontains many lar g e entries (e.g., v “ p 1 , 1 , ..., 1 q T ). This obse rv a tion is c on sistent with Cai & Guo (2017 ) , w h ich shows that the debiase d estimator do es not yield optimal c onfidenc e intervals f o r v T p θ d S,ψ when v is dense . T o i l lustr ate situations wher e o ur r esults apply, first note that if v “ e j , the j th b asis ve c tor in R p , then v T p θ d S,ψ “ p θ d S,ψ ,j r e duc e s to the estimator of θ d S,ψ ,j . In this c ase, c o ndition (14) r e duc es to (13) . Sim i l a r observations apply w hen v T θ ˚ is a line ar c ombina tion of θ ˚ with } v } 0 fixe d. Mor e gene r al ly, the set of ve ctors v in R p satisfying ( 1 4) forms a c one ! } v } 1 } v } 2 ď t n r s Ω log p ? n ` N ` p s _ s B q log p ? n ` s 1 { 2 B c n ? log p ` n ´ δ 2 p 2 ` δ q s ´ 1 ) for so me t n “ o p 1 q . Comp ar e d with Cai & Guo (20 1 7), which c onsider e d the debiase d e stimator for v T θ ˚ with sp arse v , 14 c on dition (14 ) may stil l hold when v is appr oximately sp arse, i.e., whe n it c ontains ma ny smal l but nonzer o entries. Our r esults ther efor e r emain a p plic able in such settings. Remark 2 (Efficiency improv emen t and optimality) . When the line ar mo del is c orr e ctly sp e c- ifie d, i. e ., f p X q “ X T θ ˚ , we ha ve E p T i 2 T T i 1 q “ 0 and Γ ψ “ σ 2 Σ . T hus, the asymptotic vari- anc e of v T p θ d S,ψ r e duc e s to σ 2 v T Ω v , which agr e es with that of the sup ervise d debiase d estima- tor. I n the fol lowing, we ass ume E p T i 2 T T i 1 q “ E t X b 2 m p X q η u is of ful l r ank. Sinc e E p T b 2 i 2 q is strictly p ositive defin i te by Assumption (E1), it implies that t E p T i 2 T T i 1 qu T t E p T b 2 i 2 qu ´ 1 E p T i 2 T T i 1 q is strictly p ositive de fi nite. We c onsider the fol lowing two c ases. (1) lim n Ñ8 n n ` N “ 1 . R e c al l that the asymptotic varianc e of the sup ervise d debia s e d esti- mator is v T Ω K Ω v , whe r e K “ E p T b 2 i 1 q with T i 1 “ X i p Y i ´ X T i θ ˚ q ; se e B ¨ uhlmann & V an de Ge er (2015). In this c ase, the asymptotic varianc e of v T p θ d S,ψ is identic al to v T Ω K Ω v . T h us ther e is no effici e n cy imp r ovem ent wh en n " N . (2) lim n Ñ8 n n ` N “ ρ for som e 0 ď ρ ă 1 . In this c ase, the asymptotic v a rianc e v T ΩΓ ψ Ω v is strictly smal ler than v T Ω K Ω v if and only if 2 ψ ´ ψ 2 ą 0 , i.e. 0 ă ψ ă 2 . Thus, our estimator v T p θ d S,ψ with 0 ă ψ ă 2 is mor e efficie nt than the sup ervise d estimator. Inter estingly, the asymptotic varianc e v T ΩΓ ψ Ω v is minim ize d wh en taking ψ “ 1 . Thus, the estimator v T p θ d S,ψ “ 1 is optimal within the fol lowing c l a ss of estimators t v T p θ d S,ψ : ψ P R u in term s of asymptotic effi ciency. In view o f the form of Γ ψ , the varianc e r e duction b e c om e s m o r e evident as ρ go es to 0 (i.e., N incr e ases ) . In the inter est of sp ac e, we defer mor e detaile d discussions r e gar ding the efficiency gain in Supplement S.5.3. Remark 3 (Comparison with the estimator p θ d ) . T o se e the c onne ction of the two estimators p θ d and p θ d S,ψ in (4) and (9), c on sider the ide al c ase w ith m p X q “ f p X q ´ X T θ ˚ . F r om (10), we c an sho w that with ψ “ 1 , Γ ψ “ σ 2 Σ ` E p X b 2 η 2 q ´ N n ` N E p X b 2 η 2 q “ σ 2 Σ ` n n ` N E p X b 2 η 2 q , wher e η “ f p X q ´ X T θ ˚ . The asymptotic varianc es of v T p θ d and v T p θ d S,ψ ar e identic al, sinc e v T ΩΓ ψ Ω v “ v T p σ 2 Ω ` n n ` N Γ q v , wher e Γ “ Ω E p X b 2 η 2 q Ω . Thus, in the id e al c ase 15 when f p X q is known, using p θ d S,ψ with m p X q “ f p X q ´ X T θ ˚ would not suffer efficiency loss c omp ar e d to p θ d and b oth estimators impr ove the efficiency of the debiase d estimator (and attains the s e mi-p ar ametric e ffi c iency b ound under c ertain c onditions); se e R emark 2 ab o ve and R em a rk S.2 (pr esente d in Supplement S.3.1). However, if ther e is no sufficien t information for us to estimate f p X q c onsistently, the estima tor v T p θ d may not impr ove the efficiency of the debiase d estimator, wher e as v T p θ d S,ψ do e s not r ely on the estimation of f p X q and guar an te es the efficiency impr ovement for any m p X q that sa tisfi e s the c o n ditions in The or em 1. We n o te that the amount of effic i e ncy impr ovement of v T p θ d S,ψ dep ends on the choic e of m p X q . Unless w e cho ose m p X q “ f p X q ´ X T θ ˚ , the estimator v T p θ d S,ψ in gener al would not attain the sem i-p ar ametric e fficiency b ound. F rom Remarks 2 and 3, w e can see that the estimator v T p θ d S,ψ pro vides a dep endable use of the unlab eled data, since it is no w orse than the supervised approach, no mat t er whether the linear mo del is correctly sp ecified or the conditional mean f unction is consisten tly estimated. As men tioned in the in tro duction, when the dimension p is fixed, Azriel et a l. (2022) and Chakrab ortty & Cai (2 0 18) in v estigated how to incorp o rate the unlab eled data to improv e the estimation efficiency for θ ˚ j . In addition to the technic al c hallenges arise from t he high dimensionalit y , the w a y w e construct our estimator p θ d S,ψ is differen t from theirs. Unlik e p θ d S,ψ , their estimators cannot guarantee the efficiency impro ve men t if the pa rameter of interes t is the linear comb ination of θ ˚ (e.g., θ ˚ 1 ` θ ˚ 2 ). W e refer to Supplemen t S.5.5 for mor e details. 3.4 V ariance estimation W e now consider ho w to estimate the asymptotic v ariance of v T p θ d S,ψ . T o estimate Γ ψ in (10), we note that p B T is an estimate of E p T i 2 T T i 1 q T t E p T b 2 i 2 qu ´ 1 . W e can further estimate M 1 “ E p T b 2 i 1 q and M 2 “ E p T i 2 T T i 1 q b y p M 1 “ 1 n ř n i “ 1 p Y i ´ X T i p θ D q 2 X b 2 i and p M 2 “ p p M 1 2 ` p M 2 2 q{ 2, where p M j 2 “ 1 n j ř i P D ˚ j p Y i ´ X T i p θ D q p m ´ j p X i q X b 2 i . Giv en these estimates, a n estimator of Γ ψ is defined as p Γ ψ “ p M 1 ´ N p 2 ψ ´ ψ 2 q n ` N p B T p M 2 . 16 Prop osition 1. Assume c onditions in The or em 1, E p ǫ 4 q “ O p 1 q , E p η 4 q “ O p 1 q an d R em “ o p 1 q , wher e Rem “ K 1 p s B ` s 1 { 2 B L B q ´ b log p n ` c n ¯ ` K 2 1 b ss B log p n ` K 1 L B b s log p n . Then, ˇ ˇ ˇ v T p Ω p Γ ψ p Ω v ´ v T ΩΓ ψ Ω v ˇ ˇ ˇ “ O p ! } v } 2 1 p R 1 ` R 2 ` R 3 q ) , (15) wher e R 1 “ K 1 L 2 Ω s Ω b log p n ` N } Γ ψ } max , R 2 “ K 3 1 L 2 Ω b s l og p n , R 3 “ N K 2 1 L 2 Ω n ` N Rem . Thus, if } v } 2 1 p R 1 ` R 2 ` R 3 q{} v } 2 2 “ o p 1 q , we have n 1 { 2 v T p p θ d S,ψ ´ θ ˚ q{p v T p Ω p Γ ψ p Ω v q 1 { 2 d Ý Ñ N p 0 , 1 q . (16) W e note that the three terms R 1 , R 2 and R 3 in (15) stem from the estimation errors of p Ω , p θ D and p B , resp ectiv ely . T o further simplify the conditions in Prop osition 1, let us consider the case that } v } 1 {} v } 2 , K 1 , L Ω , L B and } Γ ψ } max are all of order O p 1 q . Then, the asymptotic normalit y in ( 1 6) is v alid pro vided p s _ s B q b log p n “ o p 1 q , s Ω b log p n ` N “ o p 1 q and s B c n “ o p 1 q . Algorithm 1 The algorithm to compute the estimators p θ S D , p θ d and p θ d S,ψ via cross-fitting. Input: D ˚ “ tp X i , Y i q : i “ 1 , ¨ ¨ ¨ , n u from the lab el data, U “ t X i : i “ n ` 1 , ¨ ¨ ¨ , n ` N u from the unlab el data. Let D “ D ˚ Y U , D ˚ “ D ˚ 1 Y D ˚ 2 , U “ U 1 Y U 2 , D 1 “ D ˚ 1 Y U 1 and D 2 “ D ˚ 2 Y U 2 , with | D ˚ j | “ n j and | U j | “ N j , j “ 1 , 2. Output: Estimators p θ S D , p θ d and p θ d S,ψ . 1: Estimate p f ´ j p¨q and p m ´ j p¨q using data D ˚ z D ˚ j for j “ t 1 , 2 u , resp ectiv ely; 2: Compute the estimator p θ S D prop osed in D eng et al. (2024) via equation (3). 3: Compute the straightforw ard debiased estimator p θ d via equation ( 4), a nd obtain the confiden t interv a ls via equation (S.14). Note that the details of the estimator p θ d are presen ted in Supplemen t S.3.1. 4: Compute the prop osed estimator p θ d S,ψ via equation (9), and obtain the confiden t interv a ls via equation (17). Lastly , from (16), w e can construct the p 1 ´ α q confidence in terv a l fo r v T θ ˚ as r v T p θ d S,ψ ´ z 1 ´ α { 2 n ´ 1 { 2 p sd, v T p θ d S,ψ ` z 1 ´ α { 2 n ´ 1 { 2 p sd s , (17) where z 1 ´ α { 2 is the 1 ´ α { 2 quantile of a standard normal distribution a nd p sd “ p v T p Ω p Γ ψ p Ω v q 1 { 2 . 17 Similarly , if the interest is in testing the hy p o thesis H 0 : v T θ ˚ “ 0, w e can construct the test statistic n 1 { 2 v T p θ d S,ψ {p v T p Ω p Γ ψ p Ω v q 1 { 2 based on (16). 3.5 Algorithm F or clarit y , w e summarize the algorithm to compute the estimators p θ S D , p θ d and p θ d S,ψ via cross-fitting in Algorit hm 1. 4 Extensio n So far , w e hav e only considered the situation tha t the parameter of interes t θ ˚ is defined as θ ˚ “ arg min θ P R p E tp Y ´ X T θ q 2 u . In this section, we extend our prop o sed metho dology to the more general M-estimation fr a mew ork; i.e., θ ˚ “ ar g min θ P R p E t L p X , Y ; θ qu , with L p X , Y ; θ q t wice con tin uously differentiable in θ , E t ∇ θθ T L p X , Y ; θ ˚ qu p ositiv e definite, and that E t ∇ θθ T L p X , Y ; θ qu b eing nonsingular for all θ in a neighborho o d of θ ˚ . Clearly , the previously defined θ ˚ corresp onds to the situation that ∇ θ L p X , Y ; θ q “ X p Y ´ X T θ q , and the parameter of in terest β studied in Hou et al. (2 023) corresp onds to the situation that ∇ θ L p X , Y ; θ q “ X t Y ´ g p β T X qu with a kno wn function g p¨q . In this general M-estimation f ramew ork, the sup ervised Dan tzig selector is defined as p θ M ,D “ arg min θ } θ } 1 s.t. › › › 1 n ř n i “ 1 ∇ θ L p X i , Y i ; θ q › › › 8 ď λ M ,D with λ M ,D a t uning parameter. In our prop osed metho dology , w e pro ject the gradien t ∇ θ L p X , Y ; θ q as ∇ θ L p X , Y ; θ q “ B T t m p X q ´ µ u ` E , where m p x q “ t m 1 p x q , . . . , m p p x qu T , µ “ E t m p X qu , and the pro jection co efficien t is B “ r E t m p X q ´ µ u b 2 s ´ 1 E “ t m p X q ´ µ u ∇ T θ L p X , Y ; θ q ‰ . Next, w e define the estimating function h ψ p X , Y ; θ q “ ∇ θ L p X , Y ; θ q ´ ψ B T t m p X q ´ µ u whic h has mean zero for an y ψ P R . Analogous to p θ d S,ψ in (9), w e define the pr o p osed estimator here as p θ d M ,S,ψ “ p θ M ,D ´ ! 1 n ř n i “ 1 ∇ θθ T L p X i , Y i ; p θ M ,D q ) ´ 1 ! 1 n ř n i “ 1 h ψ p X i , Y i ; p θ M ,D q ) , where the last term can b e writ- ten as 1 n ř n i “ 1 ∇ θ L p X i , Y i ; p θ M ,D q ´ ψ p B T ř 2 j “ 1 ! 1 n j ř i P D ˚ j p m ´ j p X i q ´ 1 n j ` N j ř i P D j p m ´ j p X i q ) . 18 Similarly defining T i 1 “ ∇ θ L p X i , Y i ; θ ˚ q , T i 2 “ m p X i q ´ µ and Ω “ t E ∇ θθ T L p X , Y ; θ ˚ qu ´ 1 , one can easily deve lop t he analog ous result as Theorem 1. In the in terest of space, we only pro vide a heuristic description of the extension here without presen ting the full details. 5 Sim ulation Studie s 5.1 Data generating mo dels and pr actical implemen tation W e first generate a p -dimensional multiv ar ia te normal random v ector U „ N p 0 , Σ q with Σ j k “ 0 . 3 | j ´ k | . W e set the cov aria t e X “ p X 1 , ..., X p q T to b e X 1 “ | U 1 | and X j “ U j for 1 ă j ď p . The reason we ta ke X 1 “ | U 1 | is that this transformation implies E p X k 1 X j q “ 0 for j ‰ 1 but the parameter θ ˚ 1 for cen tered X 1 is nonzero. W e first consider a non-additiv e mo del a nd call it Mo del 1 , that Y “ 0 . 6 p X 1 ` X 2 q 2 ` 0 . 4 X 3 4 ´ X 5 ` 2 X 6 ` ǫ , where ǫ „ N p 0 , 1 q . T o calculate the corr esp o nding regression para meter θ ˚ under the w orking linear mo del, w e first center Y and X 1 so that their means are 0. By Prop osition 4 in B ¨ uhlmann & V an de Geer (2015), the supp o rt of θ ˚ is S “ t 1 , 2 , 4 , 5 , 6 u a nd the corresp onding regression parameter θ ˚ is p 1 . 48 , 1 . 04 , 0 , 1 . 2 , ´ 1 , 2 , 0 , ..., 0 q T . Before we pro ceed to illustrate the results, we discuss sev eral pr a ctical implemen tation issues for the prop o sed metho ds. T o compute our o ptima l semi-supervised estimator p θ S D in (3), w e apply the g r oup lasso with spline basis to estimate a sparse additiv e regression function p f (Huang et al. 2010). T o b e sp ecific, w e use the cubic spline basis with degree of freedom d f “ 5. T o select the p enalt y para meter in group lasso and mak e computation easier, the BIC criterion is used; see Section 4 in Huang et al. (20 1 0) for the definition. After w e derive the estimator p f and subsequen tly p ξ , w e mo dify the source co de in the fla re pack ag e to compute the D a n tzig t yp e estimator p θ S D , where the tuning para meter λ S D is selec ted by 5 fold cross-v a lidation. Giv en the es timator p θ S D , w e can compute the one-step es timator p θ d in (4) for inference, where p Ω is obtained by the no de-wise lasso using the glmnet pack age with tuning parameter selected b y 5 fold cross-v alidat io n. 19 T o implemen t t he dep endable semi-sup ervised metho d, w e c ho ose p m p¨q “ p f p¨q t he esti- mated sparse additive function obtained previously . W e estimate each column of the co effi- cien t matrix B by (7 ) using lasso with tuning par a meters sele cted by cross-v alidation. With the optimal c hoice ψ “ 1 (see Remark 2), we can compute t he dep endable semi-sup ervised estimator p θ d S,ψ “ 1 in (9), where p Ω is o btained previously and the Dantzig selector p θ D is com- puted using the flare pac k age. T o compare the inference results, we consider t w o vers ions of debiased lasso estimators, p θ d 1 “ p θ lasso ` ¯ Ω ´ 1 n n ÿ i “ 1 X i Y i ´ p Σ n p θ lasso ¯ , p θ d 2 “ p θ lasso ` p Ω ´ 1 n n ÿ i “ 1 X i Y i ´ p Σ n p θ lasso ¯ , (1 8 ) where p θ lasso and ¯ Ω are the standar d lasso and no de-wise lasso estimator applied to the lab eled data. The only difference b et w een p θ d 1 and p θ d 2 is the wa y o f estimating the precision matrix Ω . The t w o es timators p θ d 1 , p θ d 2 and the asso ciated confidence in terv als can b e computed using the hdi pack age with Robust option. 5.2 Numerical results With sample size n P t 100 , 3 00 , 500 u , the ratio N { n P t 1 , 4 , 8 u a nd the dimension p P t 200 , 500 u , w e compare the p erformance of the four metho ds: p θ d 1 (D-Lasso1, that only uses lab eled data with sample size n ), p θ d 2 (D-Lasso2), b oth defined in (18), the straightforw ard debiased estimator D-SSL p θ d defined in ( 4 ), and the prop osed dep endable semi-supervised estimator S-SSL p θ d S,ψ “ 1 defined in (9). F or the p “ 200 case, w e rep ort the empirical bias (Bias), standard deviation ( SD), ro ot mean squared error (RMSE) and the half length of 95% confidence in terv al (len/2) f o r eac h of the single parameters θ 1 , θ 2 , θ 4 , θ 5 and θ 6 in T able 1, and plo t the a bsolute difference b et w een the empirical 95% cov erage probability and the nominal lev el 0.95 in F igure 1. In the interes t of space, the corr espo nding results for the p “ 500 case are placed in T able S.1 and Fig ure S.1 in the Supplemen t. These results are based on 100 sim ulation replications. 20 In T able 2 , w e also rep ort the computation time (in seconds) of one sim ulation replication of these four metho ds for b ot h p “ 200 and p “ 500. F rom these results, in the ma jor ity of the scenarios w e consider, the prop osed metho d S-SSL ha s the smallest SD and RMSE, compared to the metho ds D -Lasso1 and D -Lasso2. This show s, ev en with a missp ecified conditional mean function mo deling strategy , S-SSL can still achie ve efficiency gain, indicating the dep endable use of the unlab eled data . The co v erage rate of the metho d S-SSL is close to the nominal leve l, esp ecially when the sample size increases to n “ 500. Ho we v er, the metho d D-SSL has a lo w cov erag e rat e in some cases. This r esults from a p o o r estimation of conditional mean as the t r ue mo del is no longer additive. Computing t he pro p osed metho d S-SSL ta kes a slightly longer time than all o t her metho ds, due to its sophisticated nature. An in teresting phenomenon we observ e in this comparison is that computation tak es longer when n is approxim ately equal to p , but decreases once n b ecomes la rger tha n p . In practice, es timation of the conditional mean function can b e difficult esp ecially under hig h-dimensionalit y , therefore we recommend S- SSL as it provides a dependable use of unlab eled data even if the imp osed conditional me an mo del is incorrect. W e also conduct similar n umerical inv estigations when the data g enerating mo del is ad- ditiv e and we call it Mo del 2 . In the interes t o f space, w e defer the detailed results to Supplemen t S.6. Besides t he parallel results in T able S.2, T able S.3 and T able S.4, w e also conduct differen t sensitivit y analyses with differen t condition mean function estima- tion methods, differen t tuning parameter selection metho ds, and differen t estimands ; see T able S.5, T able S.6, T a ble S.7 and T able S.8 in the Supplemen t fo r details. 6 Real Data A p plication In this section, w e apply o ur prop osed metho d to a real-w orld dataset from the Medical Infor- mation Mar t for In tensiv e Care II I (MIMIC-I I I) database (Jo hnson et al. 2016). MIMIC-I I I 21 T able 1: Sim ulation results for Mo del 1 with p “ 200 : Bias, SD and RMSE stand for em- pirical bias, standard deviation, and ro ot mean squared error, respective ly , len represen ts the length of 95 % confide nce in terv a l. The es timator s D-Lasso1 (that only uses lab eled da t a with sample size n ) and D-Lasso2 are p θ d 1 and p θ d 2 , defined in (24). The straightforw ard debi- ased estimator D-SSL is defined in (5). The pro p osed dep endable semi-supervised estimator S-SSL is defined in (1 4 ). The b est p erfo rmance is b olded during the comparison. n “ 100 n “ 300 n “ 500 N Bias SD RMSE len/2 Bias SD RMSE len/2 Bias SD RMSE len/2 θ 1 D-Lasso1 0.017 1.0 76 1.071 1.437 -0.056 0.2 57 0.262 0 .542 -0.014 0 .215 0.214 0.426 n D-Lasso2 -0.057 0.514 0.515 0.94 4 -0.057 0.25 9 0.264 0.5 41 -0.011 0.215 0.214 0.4 25 D-SSL -0.162 0.465 0.490 1.112 -0.098 0.237 0.256 0.417 -0.041 0.202 0.206 0.306 S-SSL -0.180 0.449 0.482 0.812 - 0.102 0.228 0.249 0.463 -0 .0 45 0.177 0.182 0.370 4 n D-Lasso2 -0.055 0.506 0.506 0.94 4 -0.054 0.260 0.265 0.543 -0.013 0.217 0.216 0 .426 D-SSL -0.166 0.479 0.505 0.807 -0.114 0.248 0.272 0.353 -0.050 0.199 0.204 0.266 S-SSL -0.217 0.414 0.465 0.727 - 0.126 0.205 0.240 0.405 -0 .0 63 0.168 0.178 0.325 8 n D-Lasso2 -0.065 0.514 0.516 0.93 2 -0.054 0.262 0.267 0.543 -0.013 0.216 0.216 0 .424 D-SSL -0.173 0.492 0.519 0.717 -0.118 0.242 0.268 0.334 -0.056 0.197 0.204 0.254 S-SSL -0.250 0.399 0.469 0.700 - 0.134 0.197 0.237 0.386 -0 .0 66 0.160 0.172 0.309 θ 2 D-Lasso1 -0.102 0.708 0.712 0.85 6 0.011 0.167 0.1 6 6 0.327 0.016 0 .1 25 0.126 0.260 n D-Lasso2 -0.045 0.317 0.319 0.560 0.011 0.166 0 .165 0.327 0.013 0.125 0.125 0.260 D-SSL -0.109 0.302 0.320 0.667 -0.008 0.138 0.137 0.257 -0 .004 0.113 0.112 0.190 S-SSL -0.094 0.273 0.288 0.498 -0.002 0.158 0.15 7 0.289 -0.001 0.108 0.107 0 .231 4 n D-Lasso2 -0.052 0.314 0.317 0.565 0.010 0.168 0 .167 0.329 0.011 0.127 0.127 0.260 D-SSL -0.138 0.292 0.322 0.491 -0.012 0.130 0.130 0.222 -0.006 0.104 0.103 0.168 S-SSL -0.138 0.258 0.291 0.444 -0.009 0.145 0.14 5 0.262 -0.009 0.104 0.103 0.210 8 n D-Lasso2 -0.052 0.319 0.321 0.560 0.010 0.166 0.166 0 .3 30 0.011 0.126 0.126 0.260 D-SSL -0.141 0.289 0.320 0.442 -0.014 0.126 0.126 0.211 -0.007 0.101 0.101 0.161 S-SSL -0.154 0.256 0.297 0.426 - 0.014 0.144 0.1 44 0.254 -0.012 0.102 0.102 0.203 θ 4 D-Lasso1 -0.171 0.495 0.521 0.78 6 -0.0 50 0.189 0.194 0.382 - 0.024 0.137 0.139 0.280 n D-Lasso2 -0.103 0.328 0.342 0.653 -0.040 0.186 0.190 0.383 -0.017 0.1 36 0.137 0.280 D-SSL -0.186 0.314 0.364 0.706 -0.060 0.169 0.179 0.270 -0.020 0.124 0.125 0.198 S-SSL -0.191 0.293 0.349 0.548 -0.07 8 0.151 0.169 0.321 -0.035 0.122 0.127 0.238 4 n D-Lasso2 -0.073 0.322 0.328 0.665 -0.027 0.188 0.189 0.385 -0.010 0.1 34 0.134 0.282 D-SSL -0.200 0.312 0.369 0.513 -0.070 0.157 0.171 0.233 -0.021 0.123 0.125 0.175 S-SSL -0.225 0.275 0.354 0.476 -0.08 8 0.127 0.154 0.270 -0.038 0.106 0.112 0 .207 8 n D-Lasso2 -0.068 0.322 0.328 0.655 -0.020 0.189 0.189 0.385 -0.006 0.1 36 0.136 0.281 D-SSL -0.196 0.310 0.366 0.460 -0.070 0.154 0.169 0.220 -0.022 0.123 0.124 0.167 S-SSL -0.228 0.271 0.353 0.450 -0.08 8 0.124 0.151 0.253 -0.035 0.107 0.112 0 .196 θ 5 D-Lasso1 0.219 0.894 0.916 0.65 1 0.147 0.131 0.1 9 6 0.248 0.069 0.0 93 0.116 0.188 n D-Lasso2 0.267 0.280 0.38 6 0.452 0.116 0 .1 24 0.170 0 .250 0.050 0.091 0.103 0.189 D-SSL 0.27 1 0.250 0.368 0.643 0.086 0.117 0.145 0.2 60 0.034 0.087 0.093 0.191 S-SSL 0.295 0.244 0.382 0.413 0.124 0.127 0.1 77 0.233 0.057 0.089 0.106 0.176 4 n D-Lasso2 0.204 0.289 0.353 0.46 1 0.089 0.126 0.1 5 4 0.253 0.032 0.0 91 0.096 0.190 D-SSL 0.23 2 0.256 0.344 0.502 0.081 0.108 0.135 0.227 0.028 0.084 0.088 0.172 S-SSL 0.234 0.241 0.335 0.390 0.103 0.126 0.163 0.217 0.038 0.083 0.091 0.166 8 n D-Lasso2 0.161 0.284 0.326 0.45 6 0.074 0 .1 28 0.148 0 .254 0.021 0.094 0.096 0.190 D-SSL 0.22 0 0.257 0.337 0.455 0.077 0.112 0.135 0.218 0.022 0.086 0.088 0.166 S-SSL 0.215 0.233 0.316 0.379 0.089 0.121 0.149 0.214 0.031 0.083 0.088 0.163 θ 6 D-Lasso1 -0.169 0.311 0.353 0.57 8 -0.0 96 0.126 0.158 0.245 - 0.055 0.090 0.105 0.187 n D-Lasso2 -0.138 0.232 0.269 0.465 -0 .080 0.125 0.14 8 0.247 -0.042 0.088 0.097 0.1 8 9 D-SSL -0.216 0.227 0.313 0.677 -0.073 0.127 0.146 0.265 -0.039 0.0 84 0.092 0 .194 S-SSL -0.181 0.199 0.268 0.434 - 0.092 0.119 0.150 0.229 -0 .046 0.080 0.092 0.173 4 n D-Lasso2 -0.112 0.235 0.259 0.477 -0.065 0.130 0.145 0.251 -0.033 0.0 88 0.093 0.190 D-SSL -0.219 0.239 0.323 0.509 -0.071 0.125 0.143 0.230 -0.033 0.079 0.086 0.173 S-SSL -0.179 0.221 0.283 0.404 -0.07 7 0.117 0.139 0.215 -0 .040 0.078 0.087 0.163 8 n D-Lasso2 -0.106 0.238 0.259 0.475 -0.059 0.131 0.143 0.253 -0.027 0.0 88 0.091 0.191 D-SSL -0.219 0.246 0.328 0.459 -0.069 0.132 0.148 0.218 - 0 .030 0.084 0.089 0.166 S-SSL -0.174 0.221 0.281 0.393 -0.07 2 0.117 0.137 0.211 -0 .034 0.077 0.084 0.160 22 100 200 300 400 500 0.00 0.10 0.20 n D−Lasso1 D−Lasso2 D−SSL S−SSL θ 1 N=n 100 200 300 400 500 0.00 0.10 0.20 n D−Lasso1 D−Lasso2 D−SSL S−SSL N=4n 100 200 300 400 500 0.00 0.10 0.20 n D−Lasso1 D−Lasso2 D−SSL S−SSL N=8n 100 200 300 400 500 0.00 0.10 0.20 n D−Lasso1 D−Lasso2 D−SSL S−SSL θ 2 100 200 300 400 500 0.00 0.10 0.20 n D−Lasso1 D−Lasso2 D−SSL S−SSL 100 200 300 400 500 0.00 0.10 0.20 n D−Lasso1 D−Lasso2 D−SSL S−SSL 100 200 300 400 500 0.00 0.10 0.20 n D−Lasso1 D−Lasso2 D−SSL S−SSL θ 4 100 200 300 400 500 0.00 0.10 0.20 n D−Lasso1 D−Lasso2 D−SSL S−SSL 100 200 300 400 500 0.00 0.10 0.20 n D−Lasso1 D−Lasso2 D−SSL S−SSL 100 200 300 400 500 0.00 0.10 0.20 n D−Lasso1 D−Lasso2 D−SSL S−SSL θ 5 100 200 300 400 500 0.00 0.10 0.20 n D−Lasso1 D−Lasso2 D−SSL S−SSL 100 200 300 400 500 0.00 0.10 0.20 n D−Lasso1 D−Lasso2 D−SSL S−SSL 100 200 300 400 500 0.00 0.10 0.20 n D−Lasso1 D−Lasso2 D−SSL S−SSL θ 6 100 200 300 400 500 0.00 0.10 0.20 n D−Lasso1 D−Lasso2 D−SSL S−SSL 100 200 300 400 500 0.00 0.10 0.20 n D−Lasso1 D−Lasso2 D−SSL S−SSL Figure 1: Sim ulation r esults for Mo del 1 with p “ 200: absolute difference b et w een t he empirical 95% co verage probabilit y and the nominal lev el 0.95. In all panels, r ows r epresen t differen t parameters, columns represen t differen t N { n ratios, and eac h panel plots the trend o v er the sample size n . 23 T able 2 : Simulation results for Mo del 1: computational time (in seconds) o f one sim ulation replication. The estimates of B a nd Ω are implemen ted in para llel, with eac h utilizing 11 cores. p “ 200 p “ 500 n “ 10 0 n “ 300 n “ 500 n “ 100 n “ 3 0 0 n “ 500 D-Lasso1 3.914 6.527 5.198 10.336 29.015 65.451 N n D-Lasso2 8.095 5.205 5.636 19.0 83 138.068 57.66 7 D-SSL 8.024 5.191 5.841 18.3 56 137.662 57.51 2 S-SSL 9.405 14.3 68 9.163 21.995 147.84 6 8 9 .433 4 n D-Lasso2 5.367 6.522 8.253 65.6 45 63.110 10 5.88 D-SSL 5.352 6.743 8.972 65.1 82 63.507 107.35 9 S-SSL 6.691 15.8 02 12.103 68.588 73.173 13 8.447 8 n D-Lasso2 5.611 8.660 12.9 59 58.896 115.24 3 204.1 05 D-SSL 5.687 9.356 14.8 63 58.809 117.12 6 208.9 26 S-SSL 6.969 18.2 49 17.670 61.927 12 6.081 2 38.811 is an op enly a v ailable electronic health records system dev elop ed b y the MIT Lab for Compu- tational Phy siology . It comprises deiden tified health-related data asso ciated with in tensiv e care unit patien ts with rich informatio n including demographics, vital signs, lab oratory test, medications, a nd so on. Our initial mo t iv ation for this data analysis is the ass o ciation study for the albumin lev el in the blo o d sample, a v ery indicativ e biomarke r correlated with the phenot yp es of diff erent ty p es of diseases (Phillips et al. 1989) . W e fo cus on a subset with 4784 patien ts of the whole databa se t ha t the albumin leve l is av aila ble. Some data cleaning strategy is inevitable for handling electronic health records da t abase. In our situation, around 54 % cov ariates contain missing v alues. Among these cov a r iates with missing v alues, the miss ingness prop ortions a re 9.4% on a v erage and the range is from 0.2% to 30.8 %. F or those missing v alues, w e simply impute them using the mean of observ ed samples, the so-called mean imputatio n. F or man y clinical markers with contin uous scale, the database collects the minim um, the maxim um, as well as the mean, v alues across a certain perio d of time. T o alleviate the p oten tial collinearit y among thes e v a r ia bles but also to maintain as m uc h info r mation as p ossible, w e decide to only include the maxim um and the mean v alues in our analysis. Additionally , we con v ert the categorical v aria bles, suc h as gender 24 and marital status, to dumm y v ariables. The num b er of featur es a f ter da t a pre-pro cessing is p “ 162. W e randomly sample 450 0 observ at io ns out of 4784 patien ts a nd divide them into n “ 500 lab eled da ta and N “ 4000 unlab eled data, whe re the v alue of the outcome v ar ia ble albumin is remov ed for the 4000 unlab eled dat a . F rom the set o f 50 0 lab eled instances, a subset of 100 is c hosen as the o bserv ed lab eled dat a . W e then construct unlab eled sample sets b y selecting the top 1,000, 2,000, and 3,000 instances from the unlabeled p o ol, in order to study the effects o f v arying t he unlab eled da t a size. Firstly , following the sim ulation setup, w e use the hdi pac k age with the robust option to obtain the debiased La sso estimator (D-Lasso1) from the lab eled data. Due to mu ltiple testing, the p- v alue for eac h cov a r ia te is corrected using the de fault holm approac h. W e then implemen ted the pr o p osed D-SSL and S-SSL pro cedures using the same config ura tion as in the simulation design a nd computed the Holm-adjusted p -v alues. F o r reference, w e also obtained a sup ervised debiased Lasso estimator based on all en tire dat aset, whic h is called “Oracle” and also computed the Holm-adj usted p - v alues. W e f o cused on four clinically a nd biologically relev an t biomarkers, T otal Calci um (TC), F r e e Calcium (FC ), Ir o n Binding Cap acity (IBC) and R e d Cel l Distribution Width (RDW), and ev aluated three sample-size configurations, p n, N q P tp 100 , 1000 q , p 10 0 , 2000 q , p 100 , 3000 qu . Figure 2 summarizes the results. All three prop osed metho ds consisten tly identifie d TC, a w ell-established bio c hemical marke r reflecting ov erall calcium status (Pa yne et al. 1973) . F or FC, D-SSL and S-SSL correctly recov ered the signal, whereas D-L a sso1 failed to detect it. F ree calcium represen ts the ionized, ph ysiologically active comp onent of serum calcium and therefore carries strong biological relev ance (Baird 201 1 ). IBC w as selected only by S-SSL; this mark er reflects transferrin-mediated iro n transp ort and is cen tral to assessing iron metab olism (Camasc hella 201 5). Finally , RDW, whic h quan tifies the heterogeneit y of red blo o d cell size (Salv a g no et al. 2015, P atel et al. 2009), may not b e detected b y D- SSL at smaller sample sizes but w as reco v ered once more unlab eled data b ecame a v ailable. All three metho ds ultimately selected RDW as N increased. Notably , S-SSL consisten tly ide ntified a ll 25 four v aria bles across settings, demonstrating sup erior detection p ow er. The confidence in terv als exhibit a clear efficiency pattern. F or v aria bles selected by S- SSL, their in terv als are uniformly shorter than those of D-Lasso1, indicating substan tial efficiency gains from incorp orating unlab eled data. By contrast, the p erformance of D-SSL v aries across co v ariates: its interv a ls can b e shorter, comparable, or wider; reflecting the fact that its efficiency impro ve men t dep ends on corr ect sp ecification of the w orking conditional mean mo del f p¨q and is not guaranteed under misspecification. 0.0 0.3 0.6 0.9 Oracle D−Lasso1 D−SSL(1000) D−SSL(2000) D−SSL(3000) S−SSL(1000) S−SSL(2000) S−SSL(3000) T otal Calcium −0.5 0.0 0.5 1.0 Oracle D−Lasso1 D−SSL(1000) D−SSL(2000) D−SSL(3000) S−SSL(1000) S−SSL(2000) S−SSL(3000) Iron Binding Capacity −0.6 −0.4 −0.2 0.0 Oracle D−Lasso1 D−SSL(1000) D−SSL(2000) D−SSL(3000) S−SSL(1000) S−SSL(2000) S−SSL(3000) Free Calcium −1.0 −0.5 0.0 Oracle D−Lasso1 D−SSL(1000) D−SSL(2000) D−SSL(3000) S−SSL(1000) S−SSL(2000) S−SSL(3000) Red Cell Distribution Width Figure 2 : R eal Data Application R esults: the p oint estimates and the corresp onding con- fidence in terv a ls of the metho ds, Oracle, D-Lasso1, D- SSL, and S-SSL, with sample size n “ 100 and N P t 1000 , 200 0 , 3000 u . 26 7 Discuss ion In this pap er, w e prop ose the semi-sup ervised estimator v T p θ d S,ψ for v T θ ˚ with a pr e- sp ecified v P R p . This allows fo r the dev elopmen t of inference pr o cedures for the general estimand v T θ ˚ , suc h as constructing confidence in terv als and conducting h yp othesis tests. A ke y adv antage of the pro p osed estimator is that it guarantees p erfo rmance no worse than the sup ervised approac h, ensuring the dep endable use of high-dimensional unlab eled data, while av oiding the need t o estimate the true conditio na l mean function f p X q . Our fr amew ork is more suitable when the goa l is to understand the relationship b et w een Y and X without kno wledge o f the true regression f unction, suc h as when in v estigating the asso ciation b et w een a phenot yp e and genome-wide SNPs in a genome-wide asso ciation study . In recen t literature, there has b een a surge of work defining mo del-a gnostic measures to quan tify the imp ortance of co v aria t es for prediction and studying their theoretical prop erties; these are commonly referred to a s v ariable or feature imp or t ance measures (Williamson et a l. 2021, 2023, V erdinelli & W asserman 2 024 b , a ). Bey ond regression settings, these ideas ha v e also b een extended to surviv al a nalysis (W olo ck et al. 2025) and causal inference (Hines et al. 2025). Our pro p osal shares a similar spirit with the v ariable imp ortance literature in that b oth aim to understand the role of co v a r iates in a mo del-agnostic fra mew ork. Ho w ev er, the t w o approa ches are fundamen tally differen t. Due to space limitations, w e defer a detailed discussion of their similarities and differences to Supplemen t S.5.6. Finally , in some applications, lab eled and unlab eled data are collected under differen t conditions or from distinct populatio ns. In suc h cases , assuming that t he marginal distribu- tion of X differs b etw een la b eled and unlab eled data ( K aw akita & Kanamo r i 20 13) is more appropriate. Ho w ev er, how suc h distributional differences impact the utilit y of unlab eled data for estimation and inference remains an o p en question. W e plan to explore this issue in future researc h. 27 References Angelop oulos, A. N., Bates, S., F annjiang, C ., Jordan, M. I. & Zr nic, T. (2023), ‘Prediction- p o we red inference’, Scienc e 382 (6671), 669–67 4. Angelop oulos, A. N., Duc hi, J. C. & Zrnic, T. (2023), ‘Ppi++: Efficien t prediction-p o w ered inference’, arXiv pr eprint arXiv:2 311.01453 . Azriel, D., Bro wn, L. D., Sklar, M., Berk, R., Buja, A. & Zhao, L. (20 22), ‘Semi-supervised linear regression’, Journal of the Americ an Statistic al Asso ciation 117 (540), 2238 –2251. Baird, G. S. (2 011), ‘Ionized calcium’, Cl i n ic a chi mic a acta 412 (9-10 ), 696–701. Berk, R ., Buja, A., Brow n, L., George, E., Kuc hibhotla, A. K., Su, W. & Zhao, L. (2021 ) , ‘Assumption lean regression’, The A meric an Statistician 75 (1), 7 6–84. Bhlmann, P . & V an de Geer, S. (2011), Statistics for High-Dimension a l Data: Metho ds, The ory and Applic ations , 1st edn, Springer Publishing Company , Incorp or a ted. B ¨ uhlmann, P . & V a n de G eer, S. (2015), ‘High-dimensional inference in missp ecified linear mo dels’, Ele ctr onic Jo urnal of Statistics 9 (1), 14 4 9–1473. Buja, A., Brown, L., Berk, R., George, E., Pitkin, E., T raskin, M., Z hang, K. & Zha o , L. (2019), ‘Mo dels as approximations i: consequences illustrated with linear regression’, Statistic al Scien c e 34 (4 ) , 52 3–544. Cai, T. & Guo, Z. (2020 ), ‘Semisup ervised inference for explained v ariance in high dimen- sional linear regression and its applications’, Jo urnal of the R oyal Statistic al S o ci e ty: Series B (Statistic al Metho d olo g y) 82 (2), 391–419. Cai, T. T. & G uo, Z. (2017), ‘Confidence interv als for high-dimensional linear regression: Minimax rates and adaptivity’, The A nnals of statistics 45 (2), 615 –646. 28 Camasc hella, C. (2015), ‘Iron-deficiency anemia’, New England journal of me dicine 372 (19), 1832–1 843. Candes, E. & T ao, T. (2007) , ‘The dan tzig selector: Statistical estimation when p is m uc h larger than n’, The Annals of Statistics 35 (6), 2313 –2351. Chakrab ortty , A. & Cai, T . (2018 ), ‘Efficien t and ada ptiv e linear regression in semi- sup ervised settings’, The Annals of Statistics 46 (4), 15 4 1–1572. Chakrab ortty , A., Dai, G. & Carro ll, R . J. (2022), ‘Semi-supervised quan tile estimation: Ro- bust and efficien t inference in high dimensional settings’, arXiv pr eprint . Chap elle, O ., Sc holk opf, B. & Zien, A. (2009), ‘Semi-sup ervised learning’, IEEE T r ansactions on Neur al Networks 20 (3), 542– 542. Chen, K. & Zhang, Y. (2023 ) , ‘Enhancing efficiency and robustness in high-dimensional linear regression with a dditional unlab eled dat a ’, arXiv pr eprint arXiv:2311.17685 . Chernozh uk o v, V., Chetv erik o v, D., Demirer, M., Duflo, E., Hansen, C., New ey , W. & Robins, J. (201 8), ‘Double/debiased mach ine learning for treatmen t a nd structural pa- rameters’, The Ec onometrics Journal 21 (1), C1–C68. Deng, S., Ning, Y., Z hao, J. & Zhang, H. (2024), ‘Optima l and safe estimation for high- dimensional semi-sup ervised learning’, Journal of the Americ an Statistic al Asso ciation 119 (548), 2748–275 9 . Eftekhari, H., Banerjee, M. & Rit ov, Y. (2021 ), ‘Inference in high-dimensional single-index mo dels under symmetric designs’, Journal of Machine L e arning R ese ar ch 22 (27), 1–63 . Gronsb ell, J., Gao, J., Shi, Y., McCa w, Z. R. & Cheng, D. (2025), ‘Another lo ok at inference after prediction’, arXiv pr ep rint arXiv:24 11.19908 . 29 Hines, O. J., D iaz-Ordaz, K. & V ansteelandt, S. (202 5 ), ‘V ariable imp or t ance measures for heterogeneous treatmen t effects’, Biometrics 81 (4), ujaf 1 40. Hou, J., Guo, Z. & Cai, T. (2 023), ‘Surro gate assisted semi-sup ervised inference for high dimensional risk prediction’, Journal of Machine L e arnin g R ese ar ch 24 (265), 1–58. Huang, J., Horo witz, J. L. & W ei, F. (2010), ‘V aria ble selection in no nparametric additiv e mo dels’, The Annals of s tatistics 38 (4), 2282– 2 313. Ja v a nmard, A. & Mon tanari, A. (2014), ‘Confidence in terv als and hy p o thesis testing for high-dimensional regression’, Journal of Machine L e arn i n g R ese ar ch 15 (1), 28 6 9–2909. Johnson, A. E., Pollard, T. J., Shen, L., Liw ei, H. L., F eng, M., Ghassemi, M., Mo o dy , B., Szolo vits, P ., Celi, L. A. & Mark, R. G. (2016), ‘Mimic-iii, a freely accessible critical care database’, Scientific Data 3 (1) , 1– 9. Ka w akita, M. & K a namori, T. (2013), ‘Semi-sup ervised learning with densit y-ratio estima- tion’, Machine le arning 91 (2), 189–209. Koltc hinskii, V. & Y uan, M. (2010), ‘Sparsit y in multiple kernel leaerning’, Th e Annals of Statistics pp. 3660–36 95. Kostop oulos, G., Karlos, S., Kotsian tis, S. & Ragos, O. (2018), ‘Semi-supervised regression: A recen t review’, Journal of Intel li g e nt & F uzzy Systems 35 (2 ), 1483–150 0 . Livne, I., Azriel, D. & Goldb erg, Y. (2022), ‘Impro v ed estimators for semi-supervised high- dimensional regression mo del’, Ele ctr onic Journal of Statistics 16 (2), 5437–5 487. Meinshausen, N. & B ¨ uhlmann, P . (200 6 ), ‘High- dimensional graphs and v ariable selection with the lasso’, The Annals of Statistics 34 (3), 143 6–1462. Miao, J., Miao, X., W u, Y., Zhao, J. & Lu, Q. (2025 ) , ‘Assumption-lean and data- adaptiv e p ost-prediction inference’, Journa l of Machine L e arning R ese ar ch 26 (179), 1–31. 30 Mot w ani, K. & Witten, D . (2023), ‘Revisiting inference a f ter prediction’, Journal of Machine L e arning R ese ar ch 24 (394), 1–18. Neyk o v, M., Ning, Y., Liu, J. S. & Liu, H. (20 1 8), ‘A unified theory o f confidence regio ns and testing for high-dimensional es timating equations’, Statistic al Scienc e 33 (3), 4 27–443. Ning, Y. & L iu, H. (2017 ) , ‘A general theory o f h yp othesis tests and confidence regions for sparse high dimensional mo dels’, The Annals of Statistics 45 (1), 158–195 . P atel, K. V., F errucci, L., Ershler, W. B., Longo, D. L. & Guralnik, J. M. (2009), ‘Red blo o d cell distribution width and the r isk of death in middle-aged and older adults’, Ar chives of internal me dicine 169 (5), 515–523. P a yne, R., Little, A., Williams, R. & Milner, J. (1973 ) , ‘In terpretation o f serum calcium in patien ts with abnormal serum proteins’, Br Me d J 4 (589 3), 643–646. Phillips, A., Shap er, A. G. & Whincup, P . (1989), ‘Asso ciation b et w een serum albu- min and mor t alit y from cardio v a scular disease , cancer, and other causes’, The L anc et 334 (8677), 1434–14 3 6. Radc henk o, P . (20 15), ‘High dimensional single index mo dels’, Journal of Multivariate A nal- ysis 139 , 266–28 2. Rigollet, P . (20 0 7), ‘Generalization error b ounds in semi-sup ervised classification under the cluster assumption.’, Journal of Machine L e arning R ese ar ch 8 (49), 136 9–1392. Rudelson, M . & Zhou, S. (20 12), Reconstruction from anisotropic random measuremen ts, in S. Mannor, N. Srebro & R. C. Williamson, eds, ‘Pro ceedings of the 25 th Ann ual Confer- ence on Learning Theory’, V ol. 23 of Pr o c e e dings of Machine L e arning R ese ar ch , PMLR, Edin burgh, Scotla nd, pp. 10.1– 1 0.24. 31 Salv agno , G. L., Sanchis -G omar, F., Picanza, A. & Lippi, G. (2015), ‘Red blo o d cell distri- bution width: a simple parameter with mu ltiple clinical applications’, Critic a l r eviews in clinic al lab or atory scien c es 52 (2), 86–1 05. Shan, J., Chen, Z., Dong, Y., W a ng , Y. & Zhao, J. (202 5), ‘Sa da: Safe and adaptive aggregation of m ultiple black -b o x predictions in semi-supervised learning’, arXiv pr eprint arXiv:2509.21707 . Song, S., Lin, Y. & Zhou, Y. (2024) , ‘A general m-estimation theory in semi-supervised framew ork’, Journal of the Americ an Statistic al Asso ciation 119 (546), 1065–10 75. Tibshirani, R. (1996), ‘Regr ession shrink age and selection via t he lasso’, Jo urnal of the R oyal Statistic al So ciety: Series B (Metho dol o gic al) 58 (1), 267–288. Tsybak o v, A. B. (2009), Intr o duction to Nonp ar ametric Estimation , 1st edn, Springer Pub- lishing Compan y , Incorp orated. Tsybak o v, A., Bick el, P . & Rit ov, Y. (2009), ‘Sim ultaneous analysis of lasso and dan tzig selector’, The Annals of Statistics 37 (4 ), 1705–173 2. V an de Geer, S., B ¨ uhlmann, P ., R ito v, Y. & Dezeure, R. (2014), ‘On asymptotically opti- mal confidence regions and tests for high-dimensional mo dels’, The Annals of Statistics 42 (3), 1166–12 02. V erdinelli, I. & W asserman, L. (2024 a ), ‘Decorrelated v ariable imp ort a nce’, Journal of Ma- chine L e arning R ese ar ch 25 (7), 1–27. V erdinelli, I. & W asserman, L. (20 24 b ), ‘F eature imp ortance: A closer lo ok at shapley v alues and lo co’, Statistic al Sc ienc e 39 (4), 623–636. W ain wright, M. J. (2019) , High-d i m ensional s tatistics: A non-asymptotic viewp oint , V ol. 48, Cam bridge univ ersit y press. 32 W ang, S., McCormic k, T. H. & Leek, J. T. (2020), ‘Metho ds for corr ecting inference ba sed on outcomes predicted b y mac hine learning’, Pr o c e e dings of the National A c ademy of Sc i e nc e s 117 (48), 30266– 30275. W ang, Y., Chen, H., F an, Y., Sun, W., T ao, R., Hou, W., W ang, R., Y ang, L., Zhou, Z., G uo, L.-Z. et al. (2022), ‘Usb: A unified semi-supervised learning b enc hmark for classification’, A dvanc es in Neur al Information Pr o c essing Systems 35 , 3 938–3961 . W asserman, L. & Lafferty , J. D . (2007 ), Statistical analysis of semi-sup ervised regression, in J. C. Platt, D. Koller, Y. Singer & S. T. R o w eis, eds, ‘Adv a nces in Neural Informat io n Pro cessing Systems 20’, Curran Asso ciates, Inc., pp. 801–80 8 . Williamson, B. D., Gilb ert, P . B., Carone, M. & Simon, N. (2021), ‘Nonparametric v ariable imp ortance assessmen t using machin e learning techn iques’, Biometrics 77 (1 ) , 9– 22. Williamson, B. D., Gilb ert, P . B., Simon, N. R. & Carone, M. (2023), ‘A general frame- w ork for inference on alg orithm-agnostic v ariable imp orta nce’, Journal of the Americ an Statistic al Asso ciation 118 (543), 1645 –1658. W olo ck, C. J., Gilb ert, P . B., Simon, N. & Carone, M. (2025 ), ‘Assessing v ariable imp ort ance in surviv al analysis using mach ine learning’, Bio metrika 112 (2), asae061. Y ang, Z., Balasubramanian, K. & Liu, H. (2017) , High-dimensional non-gaussian single index mo dels via thresholded score function estimation, in ‘In ternational Conference on Mac hine Learning’, PMLR, pp. 3 851–3860 . Y ang, Z., Balasubramania n, K., W ang, Z. & Liu, H. (2017), ‘L ear ning non- gaussian m ulti- index mo del via s econd-order stein’s metho d’, A dvanc es in Neur al Information Pr o c essing Systems 30 , 6097–6106 . Y uv a l, O. & Rosset, S. (2022), ‘Semi-sup ervised empirical risk minimization: Using unlab eled data to impro v e prediction’, Ele ctr o n ic Journa l of Statistics 16 (1), 1434–14 60. 33 Zhang, A., Brow n, L. D. & Cai, T. T. (2019 ), ‘Semi-sup ervised inference: General theory and estimation of means’, The Annals of Statistics 47 (5), 25 38–2566. Zhang, C. & Zhang , S. S. (2014), ‘Confidence interv als fo r low dimensional parameters in high dimensional linear mo dels’, Journal of the R oyal Statistic al So ciety: Series B (Statistic a l Metho dolo gy) 76 (1), 217–2 4 2. Zhang, Y. & Bradic, J. (20 22), ‘High-dimensional semi-sup ervised learning: in searc h of optimal inference of the mean’, Biometrika 109 (2), 3 87–403. Zhao, J. & Leng, C. (2016), ‘An analysis o f p enalized in teraction mo dels’, Bernoul li 22 (3), 1937–19 61. Zh u, X. J. (2005), Semi-sup ervised learning literature surv ey , T ech nical rep ort, Univ ersit y of Wisconsin-Madison Departmen t of Computer Sciences. 34 SUPPLEMENT S.1 Preliminary Definition T o c haracterize the tail b ehavior of random v ariables, w e in tro duce the follo wing definition. Definition S.1 (Sub-Ga ussian v ariable and v ector) . A r andom variable X is c al le d sub- Gaussian if ther e exists some p ositive c on s tant K 2 such that P p| X | ą t q ď exp p 1 ´ t 2 { K 2 2 q for al l t ě 0 . The sub-Gaussian norm of X is define d as } X } ψ 2 “ sup q ě 1 q ´ 1 { 2 p E | X | q q 1 { q . A v e ctor X P R p is a sub-Gaussian ve ctor if the one- d imensional mar ginals v T X ar e s ub- Gaussian for al l v P R p , and its sub-Gaussian norm is defi ne d as } X } ψ 2 “ sup } v } 2 “ 1 } v T X } ψ 2 . S.2 Preliminary Lemmas W e start with sev eral basic lemmas that w e will apply in o ur pro ofs. Lemma S.1 (Lemma B.1 in Chernozh uk o v et al. (2018)) . L et t X n u , t Y n u b e se quenc es of r and om variables. If for any c ą 0 , P p| X n | ą c | Y n q “ o p p 1 q . Then X n “ o p p 1 q . Lemma S.2 (Nemiro vski momen t inequality , Lemma 14.24 in Bhlmann & V an de G eer (2011)) . F or m ě 1 and p ą e m ´ 1 , we have E ˜ max 1 ď k ď p ˇ ˇ ˇ ˇ ˇ n ÿ i “ 1 r γ k p Z i q ´ E t γ k p Z i qus ˇ ˇ ˇ ˇ ˇ m ¸ ď p 8 log 2 p q m 2 E » – # max 1 ď k ď p n ÿ i “ 1 γ 2 k p Z i q + m { 2 fi fl (S.1) Lemma S.3 (Theorem 3.1 in R udelson & Zhou (2012 )) . Assume that X P R n ˆ p has ze r o me an and c ovarianc e Σ . F urthermor e, assume that the r ows of X Σ ´ 1 { 2 P R n ˆ p ar e inde- p en dent sub-gaussi a n r an d om ve ctor w i th a b ounde d s ub-g aussian c onstant and Λ min p Σ q ą C min ą 0 , max 1 ď j ď p Σ j j “ O p 1 q . Set 0 ă δ ă 1 , 0 ă s 0 ă p , and L ą 0 . Define the fol lowing event, B δ p n, s 0 , L q “ " X P R n ˆ p : p 1 ´ δ q a C min ď k X v k 2 ? n k v k 2 , @ v P C p s 0 , L q s.t. v ‰ 0 * . (S.2) S1 and C p s 0 , L q “ t θ P R p : D S Ď t 1 , ..., p u , | S | “ s 0 , k θ S c k 1 ď L k θ S k 1 u . Then , ther e exists a c on stant c 1 “ c p L, δ q such that, fo r sam ple size n ě c 1 s 0 log p p { s 0 q , we have P t B δ p n, s 0 , L qu ě 1 ´ e ´ δ 2 n . (S.3) S.3 Theoretical Prop erties of the Debiased Estimator This section is divided in to four parts: Section S.3.1 pr esen ts the cen tral limit theorem for the Debiased Estimator. Section S.3.2 discusses the v ariance estimation of the D ebiased Estimator. Section S.3.3 prov ides the pr o of of the central limit theorem for the estimator, and Section S.3.4 examines the con v ergence rate of the v ar ia nce estimate fo r the D ebiased Estimator. S.3.1 Asymptot ic Prop ert ies of Debiased Estimator T o sho w the asymptotic distribution of the prop osed estimator v T p θ d , w e require the follow ing assumptions. Assumption S.1. (A1) Σ ´ 1 { 2 X is a zer o me an sub-gaussian ve ctor with b ounde d sub-gaussian norm and Cov p X q “ Σ has smal les t eigenv alue Λ min p Σ q ě C min ą 0 for some p ositive c on stant C min . Mor e over, max 1 ď j ď p Σ j j “ O p 1 q . (A2) max 1 ď i ď n ` N k X i k 8 ď K 1 wher e we a l low K 1 to diver ge with p n, N , p q . (A3) E p ǫ 2 q “ σ 2 and E rt f p X q ´ X T θ ˚ u 2 s ď Φ 2 . (A4) θ ˚ is s -sp arse with k θ ˚ k 0 “ s , a nd s log p n ` N “ O p 1 q . Assumption S.2. Assume max 1 ď i ď n ` N k ΩX i k 8 ď K 2 , an d max 1 ď k ď p k Ω k ¨ k 0 ď s Ω satisfies K 2 s Ω a log p {p n ` N q “ o p 1 q , wher e K “ K 1 _ K 2 with K 1 define d in Assumption S.1. Note that Assumption S.1 is the same a s the Assumption 3.1 in Deng et al. (2 0 24). As- sumption S.2 a nd (A2) in Assump tion S.1 together imply the strong b oundedness condition S2 and max 1 ď i ď n ` N max 1 ď k ď p | X T i, ´ k γ k | “ O p K q in V an de G eer et al. (2014) whic h further guaran tees the rate of p Ω in the matrix L 8 norm. While it is p ossible to relax the sparsit y assumption max 1 ď k ď p k Ω k ¨ k 0 ď s Ω (Ja v a nmard & Montanari 2014), we mak e this a ssump- tion in order to sho w the prop osed estimator is regular and asymptotically linear, whic h facilitates t he comparison with other comp eting estimators in terms o f a symptotic efficiency . Finally , w e note that Assumptions S.1 and S.2 do not impose or imply an y upp er b ound on Λ max p Σ q . F or example, w e a llo w Σ to b e an equicorrelation matrix, whose largest eigen v a lue is prop ortional to the dimension p . Giv en these assumptions, the follow ing theorem sho ws that v T p θ d is asymptotically normal for a linear functional v T θ ˚ . Theorem S.1. Supp ose Assumptions S.1 and S.2 hold. By cho osing λ S D — K 1 p Φ b log p n ` N ` σ b log p n ` b n b log p n q and λ k — K b log p n ` N uniformly over k , we obtain that for an y v ‰ m 0 P R p , v T p p θ d ´ θ ˚ q “ 1 n n ÿ i “ 1 v T W i t Y i ´ f p X i qu ` 1 n ` N n ` N ÿ i “ 1 v T W i t f p X i q ´ X T i θ ˚ u ` O p p δ n q , (S.4) wher e W i “ ΩX i and δ n “ } v } 1 p R 1 ` R 2 q with R 1 “ K 1 K p s _ s Ω q # Φ log p n ` N ` p σ ` b n q log p a n p n ` N q + , R 2 “ K 2 b n c log p n , and b n is a de term i n istic se quenc e that satisfies } p f ´ j ´ f } “ O p p b n q for j “ 1 , 2 . In addition, if n 1 { 2 δ n v T p σ 2 Ω ` n n ` N Γ q v ( 1 { 2 “ o p 1 q (S.5) with Γ “ E r W b 2 i t f p X i q ´ X T i θ ˚ u 2 s , ǫ and η p X q “ f p X q ´ X T θ ˚ satisfy } v } 2 ` δ 1 K 2 ` δ 2 " E | ǫ | 2 ` δ n δ { 2 p σ 2 v T Ω v q 1 ` δ { 2 ` E | η p X q| 2 ` δ p n ` N q δ { 2 p v T Γ v q 1 ` δ { 2 * “ o p 1 q , (S.6) S3 for some δ ą 0 , then n 1 { 2 v T p p θ d ´ θ ˚ q v T p σ 2 Ω ` n n ` N Γ q v ( 1 { 2 d Ý Ñ N p 0 , 1 q . (S.7) The asymptotic expansion of v T p p θ d ´ θ ˚ q is presen ted in (S.4), where the remainder term δ n consists of t w o comp o nen ts R 1 and R 2 , whic h come from the cross pro duct of t he estimation errors o f p Ω and p θ S D in Theorem 3.2 of Deng et al. (20 24) and the plug-in error of p f ´ j in p ξ , resp ectiv ely . T o establish the asymptotic normalit y of v T p p θ d ´ θ ˚ q , w e f urther need to assume that δ n is sufficien tly small and the Ly apunov condition ho lds so that one can apply the cen tral limit t heorem to the leading terms in ( S.4). These tw o conditions are rigorously formu lated in (S.5) and (S.6). T o f ur t her simplify (S.5) and (S.6), assume tha t σ 2 v T Ω v ě C } v } 2 2 and v T Γ v ě C } v } 2 2 for some constan t C , E | ǫ | 2 ` δ , E | η p X q| 2 ` δ , K are all O p 1 q and b n “ o p 1 q . Under these mild conditions, (S.5) a nd (S.6) are implied b y } v } 1 } v } 2 " p s _ s Ω q log p ? n ` N ` b n a log p ` n ´ δ 2 p 2 ` δ q * “ o p 1 q . (S.8) Remark S.1. (1) The b ound (S.8 ) r e quir es the r atio } v } 1 {} v } 2 c an not b e to o lar ge which excludes the c ase that v has m any lar ge en tries (e.g., v “ p 1 , 1 , ..., 1 q T ). This observation agr e es with the the or e tic al r esults in Cai & Guo (2017) , as the debiase d estimator do es not yield optimal c onfidenc e in terva l s for v T θ ˚ when v is a d ense ve ctor. T o se e some c on cr ete e xamples that our r esults ar e ap p lic a b le, we first no te that if v “ e j the j th b asi s ve c tor in R p , then v T p θ d “ p θ d j r e duc e s to the estimate of θ j . O ur c ondition (S . 8 ) b e c omes p s _ s Ω q log p “ o p ? n ` N q and b n “ o p 1 { ? log p q . The former is a standar d c ond ition for debiase d infer enc e a d apte d to the semi-s up ervise d setting and the latter is slightly str onger than the c onsistency of p f ´ j r e quir e d in T he o r em 3.2 of Deng et a l . (2024); se e R emark 3.3 for de tails. The same c o m ments ar e app l i c able if the p ar am e ter of inter est v T θ ˚ is a line ar c om bination of θ ˚ with } v } 0 fixe d. Inde e d, the set of ve ctor v in R p satisfying (S.8) fo rms a c on e r } v } 1 } v } 2 ď t n t p s _ s Ω q log p ? n ` N ` S4 b n ? log p ` n ´ δ 2 p 2 ` δ q u ´ 1 s fo r some t n “ o p 1 q . Comp ar e d to C a i & Guo (2017) who pr op o se d the debi a se d estimator for v T θ ˚ with sp arse v , the c o ne c ondition (S.8) m ay stil l hold if v is appr oximately sp arse with many smal l but nonz e r o entries. Our r esults ar e stil l a p plic able in this c ase. (2) Assuming } v } 1 {} v } 2 is a c onstant and N " n , we c an se e fr om (S.8) that in the semi-sup ervise d setting we ne e d p s _ s Ω q log p “ o p ? n ` N q , which is much we aker than the similar c ondition p s _ s Ω q log p “ o p ? n q fo r the sup ervise d es tima tors ( up to some lo garithmic factors). Thus, with a lar ge amount of unlab ele d data, our infer enc e r esults may stil l hold for mo dels with la r ge s . Remark S.2 (Efficiency impro v emen t and semi-parametric e fficiency bound) . We first n o te that, when the line ar m o d e l is c orr e ctly sp e cifie d i.e. f p X q “ X T θ ˚ , we have Γ “ 0 and the asymptotic v a rianc e of v T p θ d r e duc e s to σ 2 v T Ω v , which agr e es with the asymptotic varianc e of the debiase d estimator in ful ly sup ervise d se tting and also matches the semi-p ar ametric efficiency b ound. In this c ase, the information of X c ontaine d in the unlab ele d data is ancil- lary and do es not c ontribute to the in f e r enc e on θ ; se e also Azrie l et al. (2022), Chakr ab ortty & Cai (2018) . In the fol low i n g, we assume Γ is strictly p ositive definite. R e c al l that our asymptotic analysis r e quir es n, p Ñ 8 an d al lows N to b e either fixe d or gr ow w i th n . In the fol lowin g , we discuss the as ymp totic varian c e of v T p θ d in (S.8) ac c o r ding to the magnitude of N . (1) lim n Ñ8 n n ` N “ 1 . Denote K “ E X b 2 p Y ´ X T θ ˚ q 2 ( . I t is se en that K “ σ 2 Σ ` ΣΓΣ . In this c ase, the asymptotic varianc e of v T p θ d r e duc e s to v T p σ 2 Ω ` Γ q v “ v T Ω K Ω v , which is the asymptotic varian c e of the debiase d estimator in the ful ly sup ervise d set- ting; se e B¨ uhlmann & V an de Ge e r (20 15), Ning & Liu (2017). As exp e cte d , when N ! n , the amo unt of unlab ele d data is not sufficiently lar ge to impr ove the asymptotic efficiency of the estimator. (2) lim n Ñ8 n n ` N “ ρ for s o me 0 ă ρ ă 1 . In this c ase, the asymptotic v a rianc e v T p σ 2 Ω ` S5 ρ Γ q v is strictly smal ler than v T Ω K Ω v “ v T p σ 2 Ω ` Γ q v . Thus, the unlab ele d data c an b e use d to impr ove the asymptotic effi ciency for i n fer en c e. (3) lim n Ñ8 n n ` N “ 0 . In the c ase, the a s ymptotic varianc e b e c omes σ 2 v T Ω v . Inde e d, if the distribution of X is known , the semi-p ar ametric efficiency b ound for es timating v T θ ˚ is exactly σ 2 v T Ω v as wel l; s e e Chak r ab ortty & Cai (201 8 ) and the r efer enc e ther ein. Thus, when N " n , our estimator attains the semi-p ar ametric efficiency b ound. S.3.2 V ariance Est imation In the following, w e consider ho w to estimate the a symptotic v ariance of v T p θ d . F or estimating Ω , one can consider the f ollo wing no de-wise lasso estimator (Meinshausen & B ¨ uhlmann 200 6) based on b oth lab eled and unlab eled data r X . F or k P r p s , define the v ector p γ k “ t p γ k ,j : j P r p s and j ‰ k u as p γ k “ arg min γ P R p " 1 n ` N || X ¨ k ´ r X ¨´ k γ || 2 2 ` 2 λ k k γ k 1 * . (S.9) Denote b y p C “ » — — — — — — — – 1 ´ p γ 1 , 2 . . . ´ p γ 1 ,p ´ p γ 2 , 1 1 . . . ´ p γ 2 ,p . . . . . . . . . . . . ´ p γ p, 1 ´ p γ p, 2 . . . 1 fi ffi ffi ffi ffi ffi ffi ffi fl and let p T 2 “ diag p p τ 2 1 , ..., p τ 2 p q , where p τ 2 k “ 1 n ` N p r X ¨ k ´ r X ¨´ k p γ k q T r X ¨ k . (S.10) Then the no de-wise lasso estimator is defined as p Ω “ p T ´ 2 p C . (S.11) S6 T o estimate σ 2 , w e apply the cross-fitting techniq ue. Specifically , for j “ t 1 , 2 u , define p σ 2 j “ 1 n j ÿ i P D ˚ j ! Y i ´ p f ´ j p X i q ) 2 . W e estimate σ 2 b y p σ 2 “ p p σ 2 1 ` p σ 2 2 q{ 2. Similarly , define p Γ j “ 1 n j ` N j ÿ i P D j p p η ´ j i q 2 p ΩX i X T i p Ω , where p η ´ j i “ p f ´ j p X i q ´ p θ T S D X i and p Ω is defined in (S.11). W e then estimate Γ b y p Γ “ p p Γ 1 ` p Γ 2 q{ 2. The following Prop osition sho ws that the asymptotic v a r ia nce of v T p θ d can b e consisten tly estimated b y the plug-in estimator v T p p σ 2 p Ω ` n n ` N p Γ q v . Prop osition S.1. S upp ose Assumptions S .1 and S.2 hold. T o sim plify the pr esentation, we further assume E p ǫ 4 q “ O p 1 q , E t η 4 p X qu “ O p 1 q a n d K b s log p n ` N “ o p 1 q . The n ˇ ˇ ˇ ˇ v T ˆ p σ 2 p Ω ` n n ` N p Γ ˙ v ´ v T ˆ σ 2 Ω ` n n ` N Γ ˙ v ˇ ˇ ˇ ˇ “ O p " } v } 2 2 ˆ 1 ? n ` b 2 n ˙ ` R em N * , (S.12) wher e R em N “ n n ` N K 2 } v } 2 1 b n ` K 3 } v } 2 1 p s _ s Ω q c log p n ` N . (S.13) Under the addition a l as s umptions σ 2 v T Ω v ě C } v } 2 2 and R em N {} v } 2 2 “ o p 1 q , we have n 1 { 2 v T p p θ d ´ θ ˚ q ! v T p p σ 2 p Ω ` n n ` N p Γ q v ) 1 { 2 d Ý Ñ N p 0 , 1 q . (S.14) T o b etter understand the conv ergence rate of the estimated asymptotic v ariance, w e decomp ose the error in (S.12) into tw o terms, } v } 2 2 ´ 1 ? n ` b 2 n ¯ and Rem N . The for mer is due to the estimation error of p σ 2 and the latter comes from the error of p Γ and p Ω . It is of in terest to note that, if N " n , the erro r term Rem N ma y v anish to 0 fast enough, so that the conv erg ence ra t e of the estimated asymptotic v ariance in (S.1 2 ) is dominated b y S7 } v } 2 2 ´ 1 ? n ` b 2 n ¯ . In addition, for many practical estimators p f ´ j , suc h as the group lasso estimator for sparse additiv e mo dels in Remark 3.3 of D eng et al. (2024), its con v ergence rate in L 2 p P q nor m is no slo w er than n ´ 1 { 4 , that is b n “ o p n ´ 1 { 4 q . In this case, the r ate in (S.12) fur t her reduces to } v } 2 2 { ? n , whic h is the b est p o ssible rate for estimating the v ariance ev en if Ω , Γ and f p X q are known. Th us, the unla b eled dat a lead to a more accurate estimate of the asymptotic v ariance. Finally , from (S.14) w e can construct the p 1 ´ α q confidence interv al f or v T θ ˚ as r v T p θ d ´ z 1 ´ α { 2 n ´ 1 { 2 sd, v T p θ d ` z 1 ´ α { 2 n ´ 1 { 2 sd s , where z 1 ´ α { 2 is the 1 ´ α { 2 quan tile of a standard normal distribution and sd “ ! v T p p σ 2 p Ω ` n n ` N p Γ q v ) 1 { 2 . Similarly , if one is in terested in testing the h y- p othesis H 0 : v T θ ˚ “ 0, w e can construct the test statistic n 1 { 2 v T p θ d { ! v T p p σ 2 p Ω ` n n ` N p Γ q v ) 1 { 2 based on (S.14). S.3.3 P r o of of Theorem S.1 Pr o of. W e will first deriv e some preliminary probability b ounds that will b e used later in the pro of. With ( A1 )-(A5) in Assumptions (S.1) and (S.2), w e can v erify the assumptions (B1)-(B4) for strongly bounded case in Theorem 2.4 of V an de G eer et al. (20 1 4) holds with K “ K 1 _ K 2 . In particular, w e hav e |t X p´ k q u T γ k | “ |t X p´ k q u T Σ ´ 1 ´ k , ´ k Σ ´ k ,k | “ |t X p´ k q u T Ω ´ k ,k || Ω ´ 1 k k | “ |t X p´ k q u T Ω ´ k ,k |p Σ k k ´ Σ k , ´ k Σ ´ 1 ´ k , ´ k Σ ´ k ,k q “ O p K 2 q , uniformly o ve r 1 ď k ď p . Under the t he strongly b ounded case with s Ω “ o ´ n ` N log p ¯ , and max k Σ k ,k “ O p 1 q , we can apply Theorem 2.4 and Lemma 5.3 in V an de Geer et al. (2014) and claim that the no dewise lasso estimator satisfies p Ω ´ Ω 8 “ O p ˜ K s Ω c log p n ` N ¸ , I p ´ p Ω p Σ n ` N max “ O p ˜ K c log p n ` N ¸ . (S.15) S8 The first probabilit y b ound in (S.15) is directly from Theorem 2 .4 of V an de Geer et al. (2014). T o see the second probability b o und, with the formulation of p Ω and notation from no dewise Lasso (S.10 ) , we kno w for each ro w of p Ω , p Σ n ` N Ω T k ¨ ´ e k 8 ď λ k { p τ 2 k , where e k is the unit v ector. F urthermore, in v oking Lemma 5.3 in V an de G eer et al. (2 0 14), w e kno w when w e c ho ose a suitable tuning para meter λ k — K b log p n ` N uniformly o v er k , we ha v e max k 1 { p τ 2 k “ O p p 1 q . Hence , I p ´ p Ω p Σ n ` N max ď max k p λ k { p τ 2 k q “ O p ´ K b log p n ` N ¯ . In addition, recalling from the deriv ation of (S.17) in Deng et al. (2024 ) , w e hav e X T p Y ´ b n q n ` r X T p b n ` N ´ r X θ ˚ q n ` N 8 “ O p ˜ K 1 σ c log p n ` K 1 Φ c log p n ` N ¸ , (S.16) where b n “ t f p X 1 q , . . . , f p X n qu T and b n ` N is defined similarly . Giv en the ab ov e preliminary results , w e fo cus on deriving the limiting distribution of v T p p θ d ´ θ ˚ q . Recall that w e use the following notation p b ´ j D ˚ j “ t p f ´ j p X i q : i P D ˚ j u , p b ´ j D j “ t p f ´ j p X i q : i P D j u , and b D ˚ j and b D j are defined similarly . W e decomp o se the term v T p p θ d ´ θ ˚ q as v T p p θ d ´ θ ˚ q “ v T » – p I p ´ p Ω p Σ n ` N qp p θ S D ´ θ ˚ q ` p Ω 2 ÿ j “ 1 $ & % X T D ˚ j p Y D ˚ j ´ p b ´ j D ˚ j q 2 n j ` r X T D j p p b ´ j D j ´ r X D j θ ˚ q 2 n j ` 2 N j , . - fi fl “ v T « p I p ´ p Ω p Σ n ` N qp p θ S D ´ θ ˚ q ` p p Ω ´ Ω q # X T p Y ´ b n q n ` r X T p b n ` N ´ r X θ ˚ q n ` N + ` Ω # X T p Y ´ b n q n ` r X T p b n ` N ´ r X θ ˚ q n ` N + ´ Ω 2 ÿ j “ 1 $ & % X T D ˚ j p p b ´ j D ˚ j ´ b D ˚ j q 2 n j ` r X T D j p b D j ´ p b ´ j D j q 2 n j ` 2 N j , . - `p Ω ´ p Ω q 2 ÿ j “ 1 $ & % X T D ˚ j p p b ´ j D ˚ j ´ b D ˚ j q 2 n j ` r X T D j p b D j ´ p b ´ j D j q 2 n j ` 2 N j , . - fi fl . (S.17) S9 Therefore, with the preliminary results ab o v e in hand, w e can sho w that p I p ´ p Ω p Σ n ` N qp p θ S D ´ θ ˚ q 8 ď I p ´ p Ω p Σ n ` N max p θ S D ´ θ ˚ 1 “ O p « K 1 K s # Φ log p n ` N ` σ log p a n p n ` N q ` b n log p a n p n ` N q +ff , from (S.15) and Theorem 3.2 of Deng et al. (2024). Similarly , p p Ω ´ Ω q # X T p Y ´ b n q n ` r X T p b n ` N ´ r X θ ˚ q n ` N + 8 ď p Ω ´ Ω 8 X T p Y ´ b n q n ` r X T p b n ` N ´ r X θ ˚ q n ` N 8 “ O p « K 1 K s Ω # Φ log p n ` N ` σ log p a n p n ` N q +ff , from (S.16) and (S.15 ). F ollowing the similar ar g umen t in the a nalysis of I 1 in (S.14) of Deng et al. (2 0 24) together with the assumption that k W k 8 “ k Ω X k 8 ď K 2 , w e obtain Ω 2 ÿ j “ 1 $ & % X T D ˚ j p p b ´ j D ˚ j ´ b D ˚ j q 2 n j ` r X T D j p b D j ´ p b ´ j D j q 2 n j ` 2 N j , . - 8 “ O p ˜ K 2 b n c log p n ¸ . Similarly , w e ha v e p Ω ´ p Ω q 2 ÿ j “ 1 $ & % X T D ˚ j p p b ´ j D ˚ j ´ b D ˚ j q 2 n j ` r X T D j p b D j ´ p b ´ j D j q 2 n j ` 2 N j , . - 8 ď Ω ´ p Ω 8 2 ÿ j “ 1 $ & % X T D ˚ j p p b ´ j D ˚ j ´ b D ˚ j q 2 n j ` r X T D j p b D j ´ p b ´ j D j q 2 n j ` 2 N j , . - 8 “ O p # K 1 K b n s Ω log p a n p n ` N q + . S10 Collecting the ab o v e probability b ounds and plug g ing in to (S.17 ) , we obtain v T p p θ d ´ θ ˚ q “ v T Ω # X T p Y ´ b n q n ` r X T p b n ` N ´ r X θ ˚ q n ` N + ` O p p δ n q “ 1 n n ÿ i “ 1 v T W i t Y i ´ f p X i qu ` 1 n ` N n ` N ÿ i “ 1 v T W i t f p X i q ´ X T i θ ˚ u ` O p p δ n q “ n ` N ÿ i “ 1 ξ i ` O p p δ n q . (S.18) where ξ i “ $ ’ ’ & ’ ’ % 1 n v T W i “ Y i ´ f p X i q ` n n ` N t f p X i q ´ X T i θ ˚ u ‰ for 1 ď i ď n, 1 n ` N v T W i t f p X i q ´ X T i θ ˚ u for n ` 1 ď i ď n ` N and δ n “ } v } 1 « K 1 K p s _ s Ω q # Φ log p n ` N ` σ log p a n p n ` N q ` b n log p a n p n ` N q + ` K 2 b n c log p n ff . In the following, w e will apply the Lindeb erg-F eller Ce ntral Limit Theorem to (S.18). First, w e note that E r W i t Y i ´ f p X i qus “ 0 and E r W i t f p X i q ´ X T i θ ˚ us “ 0 . Denote η i “ f p X i q ´ X T i θ ˚ . W e ha v e n ` N ÿ i “ 1 E p ξ 2 i q “ n ÿ i “ 1 1 n 2 E " v T W i ˆ ǫ i ` n n ` N η i ˙* 2 ` n ` N ÿ i “ n ` 1 1 p n ` N q 2 E p v T W i η i q 2 “ 1 n v T ˆ σ 2 Ω ` n n ` N Γ ˙ v : “ t 2 n , S11 where Γ “ Cov r W t f p X q ´ X T θ ˚ us . The Ly apuno v condition holds a s follow s ř n ` N i “ 1 E | ξ i | 2 ` δ t 2 ` δ n ď } v } 2 ` δ 1 K 2 ` δ 2 t ř n i “ 1 E p ǫ i ` n n ` N η i q 2 ` δ { n 2 ` δ ` ř n ` N i “ n ` 1 E η 2 ` δ i {p n ` N q 2 ` δ u t 2 ` δ n ď } v } 2 ` δ 1 K 2 ` δ 2 r 2 1 ` δ t E ǫ 2 ` δ i ` p n n ` N q 2 ` δ E η 2 ` δ i u{ n 1 ` δ ` E η 2 ` δ i N {p n ` N q 2 ` δ s t 2 ` δ n ď 2 1 ` δ } v } 2 ` δ 1 K 2 ` δ 2 E ǫ 2 ` δ i n δ { 2 p σ 2 v T Ω v q 1 ` δ { 2 ` } v } 2 ` δ 1 K 2 ` δ 2 p 2 1 ` δ n ` N q E η 2 ` δ i p n ` N q 1 ` δ { 2 p v T Γ v q 1 ` δ { 2 Ñ 0 , where the first ineq uality follo ws from k W k 8 “ k Ω X k 8 ď K 2 and the second one is due to the conv exity of the function x 2 ` δ for x ą 0. Therefore, the Lindeb erg- F eller Cen tral Limit Theorem leads to n ` N ÿ i “ 1 ξ i { t n d Ý Ñ N p 0 , 1 q . F rom (S.18) we obtain v T p p θ d ´ θ ˚ q t n “ n ` N ÿ i “ 1 ξ i { t n ` O p p δ n { t n q d Ý Ñ N p 0 , 1 q , as δ n { t n “ o p 1 q . This complete s the pro of. S.3.4 P r o of of Pr op osition S.1 Lemma S.4. Under the sa m e c onditions in Pr op osition S.1 , we have | p σ 2 ´ σ 2 | “ O p p n ´ 1 { 2 ` b 2 n q , (S.19) and ˇ ˇ ˇ v T p p Γ ´ Γ q v ˇ ˇ ˇ “ O p # K 2 } v } 2 1 ˜ b n ` K c s log p n ` K 2 s log p n ` K s Ω c log p n ` N ¸+ . (S.20) S12 Pr o of of L emma S.4. T o sho w ( S.1 9), it suffices to upp er b ound p σ 2 j ´ σ 2 , that is p σ 2 j ´ σ 2 “ 1 n j ÿ i P D ˚ j ! Y i ´ f p X i q ` f p X i q ´ p f ´ j p X i q ) 2 ´ σ 2 “ 1 n j ÿ i P D ˚ j p ǫ 2 i ´ σ 2 q ` 2 n j ÿ i P D ˚ j ǫ i ! f p X i q ´ p f ´ j p X i q ) ` 1 n j ÿ i P D ˚ j ! f p X i q ´ p f ´ j p X i q ) 2 . (S.21) Cheb yshev ’s inequality together w ith the assumption E p ǫ 4 q ď C implies 1 n j ř i P D ˚ j p ǫ 2 i ´ σ 2 q “ O p p n ´ 1 { 2 q . As in the deriv a tion of (S.16) in Deng et al. ( 2 024) w e hav e P » – 1 n j ÿ i P D ˚ j ǫ i ! f p X i q ´ p f ´ j p X i q ) ą cσ b n { n 1 { 2 j | D ˚ j fi fl ď } p f ´ j ´ f } 2 2 c 2 b 2 n ^ 1 . As a result, w e ha ve 1 n j ÿ i P D ˚ j ǫ i ! f p X i q ´ p f ´ j p X i q ) “ O p ˆ b n n 1 { 2 ˙ . Similarly , 1 n j ř i P D ˚ j t f p X i q ´ p f ´ j p X i qu 2 À } p f ´ j ´ f } 2 2 “ O p p b 2 n q . Plugging into (S.21), w e ha v e | p σ 2 j ´ σ 2 | “ O p p n ´ 1 { 2 ` b 2 n q , whic h further implies (S.19). T o show (S.20), w e decomp ose v T p p Γ j ´ Γ q v as follows v T p p Γ j ´ Γ q v “ v T p Ω 1 n i ` N j ř i P D j X i X T i tp p η ´ j i q 2 ´ η 2 i u p Ω v T 1 ` v T p Ω 1 n i ` N j ř i P D j t X i X T i η 2 i ´ E p X i X T i η 2 i qu p Ω v T 2 ` v T p p Ω ´ Ω q E p X i X T i η 2 i q p Ω v T 3 ` v T Ω E p X i X T i η 2 i qp p Ω ´ Ω q v T 3 (S.22) S13 Let us first consider T 1 , whic h can b e rewritten as T 1 “ 1 n i ` N j ÿ i P D j p v T p ΩX i q 2 t p η ´ j i ´ η i u 2 ` 2 n i ` N j ÿ i P D j p v T p ΩX i q 2 η i t p η ´ j i ´ η i u . W e kno w that | v T p ΩX i | ď } v } 1 } p ΩX i } 8 ď } v } 1 p} ΩX i } 8 ` } p Ω ´ Ω } 8 } X i } 8 q À K } v } 1 , since K s Ω t log p {p n ` N qu 1 { 2 “ o p 1 q . In addition, p p η ´ j i ´ η i q 2 ď 2 t p f ´ j p X i q ´ f p X i qu 2 ` 2 t X T i p p θ S D ´ θ ˚ qu 2 . Com bining these results, Theorem 3.2 o f D eng et al. (2024) and b n “ o p 1 q , w e deriv e ˇ ˇ ˇ 1 n i ` N j ÿ i P D j p v T p ΩX i q 2 p p η ´ j i ´ η i q 2 ˇ ˇ ˇ “ O p " K 2 } v } 2 1 ˆ b 2 n ` K 2 1 s log p n ˙* and ˇ ˇ ˇ 1 n i ` N j ÿ i P D j p v T p ΩX i q 2 η i p p η ´ j i ´ η i q ˇ ˇ ˇ ď ˇ ˇ ˇ 1 n i ` N j ÿ i P D j p v T p ΩX i q 2 η 2 i ˇ ˇ ˇ 1 { 2 ˇ ˇ ˇ 1 n i ` N j ÿ i P D j p v T p ΩX i q 2 p p η ´ j i ´ η i q 2 ˇ ˇ ˇ 1 { 2 “ O p # K 2 } v } 2 1 ˜ b n ` K c s log p n ¸+ , where the first step holds b y Cauc h y–Sc h w arz inequalit y . This implies the fo llowing ra t e for T 1 : | T 1 | “ O p # K 2 } v } 2 1 ˜ b n ` K c s log p n ` K 2 s log p n ¸+ . F or T 2 , w e can sho w that T 2 “ v T p p Ω ´ Ω q Z n p p Ω ´ Ω q v ` 2 v T p p Ω ´ Ω q Z n Ω v ` v T ΩZ n Ω v where Z n “ 1 n i ` N j ř i P D j t X i X T i η 2 i ´ E p X i X T i η 2 i qu . W e can b ound t he three terms in the righ t S14 hand side of the ab ov e equation separately . As an illustrat io n, w e hav e v T p p Ω ´ Ω q Z n p p Ω ´ Ω q v ď } v } 2 1 } p Ω ´ Ω } 2 8 } Z n } max “ O p ˜ } v } 2 1 K 2 s 2 Ω log p n ` N K 2 c log p n ` N ¸ , where in the last step holds w e plugin the rate of p Ω in (S.15) and apply Lemma S.2 to upp er b ound } Z n } max (as X i is uniformly b ounded by K 1 ď K and E p η 2 i q is b ounded as we ll). Using a similar a r gumen t, one can derive | v T p p Ω ´ Ω q Z n Ω v | ď } v } 1 } p Ω ´ Ω } 8 } Z n Ω v } 8 “ O p ˜ } v } 2 1 K s Ω c log p n ` N K 2 c log p n ` N ¸ , and v T ΩZ n Ω v “ O p ˜ } v } 2 1 K 2 c log p n ` N ¸ . Under the additional assumption that K s Ω t log p {p n ` N qu 1 { 2 “ o p 1 q , we can simplify the rate of T 2 as | T 2 | “ O p ˜ } v } 2 1 K 2 c log p n ` N ¸ . Finally , let us consider T 3 and T 4 . F or T 3 , w e hav e T 3 “ v T p p Ω ´ Ω q E p X i X T i η 2 i Ω v q ` v T p p Ω ´ Ω q E p X i X T i η 2 i qp p Ω ´ Ω q v , where the first term is iden tical to T 4 and therefore it suffices to only consider the rate o f T 3 . Since } E p X i X T i η 2 i Ω v q} 8 ď } v } 1 K 2 E p η 2 i q À } v } 1 K 2 and } E p X i X T i η 2 i q} max À K 2 , w e ha v e | T 3 | À } v } 1 K s Ω c log p n ` N } v } 1 K 2 ` } v } 2 1 K 2 s 2 Ω log p n ` N K 2 “ O p ˜ } v } 2 1 K 3 s Ω c log p n ` N ¸ . Collecting the upp er b ounds for T 1 , . . . , T 4 , from (S.22) we obtain the rate in (S.20). Pr o of of Pr op osition S.1 . Note that v T Ω v ď } v } 2 2 λ max p Ω q À } v } 2 2 since λ max p Ω q “ 1 { λ min p Σ q ď S15 1 { C . F rom L emma S.4, w e can sho w that v T p σ 2 p Ω v ´ v T σ 2 Ω v “ p p σ 2 ´ σ 2 q v T Ω v ` p p σ 2 ´ σ 2 q v T p p Ω ´ Ω q v ` σ 2 v T p p Ω ´ Ω q v À } v } 2 2 p n ´ 1 { 2 ` b 2 n q ` p n ´ 1 { 2 ` b 2 n q} v } 1 } v } 8 K s Ω c log p n ` N ` } v } 1 } v } 8 K s Ω c log p n ` N “ O p # } v } 2 2 p n ´ 1 { 2 ` b 2 n q ` } v } 1 } v } 8 K s Ω c log p n ` N + . This implies ˇ ˇ ˇ ˇ v T ˆ p σ 2 p Ω ` n n ` N p Γ ˙ v ´ v T ˆ σ 2 Ω ` n n ` N Γ ˙ v ˇ ˇ ˇ ˇ “ O p # } v } 2 2 p n ´ 1 { 2 ` b 2 n q ` } v } 1 } v } 8 K s Ω c log p n ` N ` K 2 } v } 2 1 ˜ nb n n ` N ` K c n n ` N c s log p n ` N ` K 2 s log p n ` N ` K s Ω c log p n ` N n n ` N ¸+ . By applying the condition K t s log p {p n ` N qu 1 { 2 “ o p 1 q and n {p n ` N q ď 1, w e can further simplify the ab ov e rate and deriv e (S.12). Note that v T p σ 2 Ω ` n n ` N Γ q v ě C } v } 2 2 whic h together with (S.12) leads to ˇ ˇ ˇ ˇ v T ˆ p σ 2 p Ω ` n n ` N p Γ ˙ v { v T ˆ σ 2 Ω ` n n ` N Γ ˙ v ´ 1 ˇ ˇ ˇ ˇ “ O p p n ´ 1 { 2 ` b 2 n ` R em N {} v } 2 2 q . Finally , (S.14) ho lds by Theorem S.1 and the Slutsky Theorem. This completes the pro of. S.4 Pro of of Theorem 1 W e first state sev eral prop o sitions and lemmas whic h are used in the pro of. Lemma S.5. Assume that Assumption S.1 holds. Consider the D antzig sele ctor p θ D in (2 ) S16 with λ D — K 1 b p σ 2 ` Φ 2 q log p n . We have p θ D ´ θ ˚ 1 “ O p p sλ D q , and 1 n n ÿ i “ 1 t X T i p p θ D ´ θ ˚ qu 2 “ O p p sλ 2 D q . (S.23) Mor e over, we have } p Σ n p p θ D ´ θ ˚ q} 8 “ O p p λ D q , wher e p Σ n “ 1 n ř n i “ 1 X b 2 i . Pr o of. The pro o f o f the conv ergence ra t e of p θ D in (S.23 ) is similar to Theorem 7.1 in Tsy- bak o v et al. (2009 ) . The k ey step is to deriv e 1 n n ÿ i “ 1 X i p Y i ´ X T i θ ˚ q 8 À K 1 p σ 2 ` Φ 2 q 1 { 2 c log p n , whic h is implied b y Lemma S.2 together with E p Y i ´ X T i θ ˚ q 2 “ σ 2 ` Φ 2 and } X i } 8 ď K 1 . The rest of the pro o f is o mitted. T o show the r a te of } p Σ n p p θ D ´ θ ˚ q} 8 , w e note that, with λ D “ C K 1 b p σ 2 ` Φ 2 q log p n for some sufficien tly large C , we ha v e } p Σ n p p θ D ´ θ ˚ q} 8 ď › › › › › 1 n n ÿ i “ 1 X i p Y i ´ X T i p θ D q › › › › › 8 ` › › › › › 1 n n ÿ i “ 1 X i p Y i ´ X T i θ ˚ q › › › › › 8 ď 2 ¯ λ, where w e inv oke the KKT condition of p θ D in the last step. Prop osition S.2. Under the same c onditions in The or em 1, for any r λ k “ r λ ě C K 1 p c n ` a log p { n q , we o b tain that p B ¨ k ´ B ¨ k 1 À s B r λ ` r λ ´ 1 # K 1 L B ˜ c n ` c log p n ¸ ` K 2 1 c s p σ 2 ` Φ 2 q log p n + 2 . S17 Define r λ opt “ arg min r λ ě C K 1 p c n ` ? log p { n q s B r λ ` r λ ´ 1 # K 1 L B ˜ c n ` c log p n ¸ ` K 2 1 c s p σ 2 ` Φ 2 q log p n + 2 . By cho osing r λ k “ r λ opt , we obtain p B ¨ k ´ B ¨ k 1 À K 1 p s B ` s 1 { 2 B L B q ˜ c log p n ` c n ¸ ` K 2 1 c ss B p σ 2 ` Φ 2 q log p n , which holds uniformly ov er 1 ď k ď p Pr o of. The pr o of is deferred to the Supplemen t S.4.2. No w we are ready to pro v e Theorem 1. F or notatio na l simplicit y , w e use p θ d S for p θ d S,ψ , p ξ S for p ξ S,ψ and p θ fo r p θ D . W e can rewrite v T p p θ d S ´ θ ˚ q “ v T t p θ ´ θ ˚ ´ p Ω p Σ n p p θ ´ θ ˚ q ` p Ω p p ξ S ´ p Σ n θ ˚ qu “ v T ! p I p ´ p Ω p Σ n qp p θ ´ θ ˚ q ` J ) “ v T ! p I p ´ Ω p Σ n qp p θ ´ θ ˚ q ` p Ω ´ p Ω q p Σ n p p θ ´ θ ˚ q ` J ) , (S.24) where J “ p Ω « X T p Y ´ X θ ˚ q n ´ ψ 2 p B T 2 ÿ j “ 1 # ř i P D ˚ j X i p m ´ j p X i q n j ´ ř i P D j X i p m ´ j p X i q n j ` N j +ff . W e notice that } ΩX i } 8 ď } Ω } 8 } X i } 8 ď L Ω K 1 , applying Ho effding inequalit y , I p ´ Ω p Σ n max “ O p ´ K 2 1 L Ω b log p n ¯ . Hence, p I p ´ Ω p Σ n qp p θ ´ θ ˚ q 8 ď I p ´ Ω p Σ n max p θ ´ θ ˚ 1 À K 3 1 L Ω p σ 2 ` Φ 2 q 1 { 2 s log p n , (S.25) S18 where w e use t he con v ergence rate of p θ in Lemma S.5. Moreov er, w e kno w p Ω ´ p Ω q p Σ n p p θ ´ θ ˚ q 8 ď Ω ´ p Ω 8 p Σ n p p θ ´ θ ˚ q 8 À K 2 1 L Ω s Ω p σ 2 ` Φ 2 q 1 { 2 log p a p n ` N q n , (S.26) follo w ed by (S.15) (we replace K with K 1 L Ω ) and again L emma S.5. No w, w e fo cus on the term J . W e rewrite J as J “ Ω « X T p Y ´ X θ ˚ q n ´ ψ B T # ř n i “ 1 X i m p X i q n ´ ř n ` N i “ 1 X i m p X i q n ` N +ff ` p p Ω ´ Ω q ” X T p Y ´ X θ ˚ q n ´ ψ B T ! ř n i “ 1 X i m p X i q n ´ ř n ` N i “ 1 X i m p X i q n ` N )ı J 1 ` p p Ω ´ Ω qp p ξ S ´ ξ 0 q J 2 ` Ω p p ξ S ´ ξ 0 q J 3 , where ξ 0 “ X T Y n ´ ψ B T # ř n i “ 1 X i m p X i q n ´ ř n ` N i “ 1 X i m p X i q n ` N + . In the follow ing, we will show that the three terms } J k } 8 for k “ 1 , 2 , 3 are sufficien tly s mall. W e first recall tha t 1 n n ÿ i “ 1 X i m p X i q ´ µ 8 À K 1 c log p n , 1 n n ÿ i “ 1 X i p Y i ´ X T i θ ˚ q 8 À K 1 p σ 2 ` Φ 2 q 1 { 2 c log p n , S19 b y Ho effding inequalit y and Lemma S.2. F or J 1 , it holds t ha t } J 1 } 8 ď p Ω ´ Ω 8 X T p Y ´ X θ ˚ q n ´ ψ B T # ř n i “ 1 X i m p X i q n ´ ř n ` N i “ 1 X i m p X i q n ` N + 8 ď p Ω ´ Ω 8 # 1 n n ÿ i “ 1 X i p Y i ´ X T i θ ˚ q 8 ` | ψ | L B 1 n n ÿ i “ 1 X i m p X i q ´ µ 8 `| ψ | L B 1 n ` N n ` N ÿ i “ 1 X i m p X i q ´ µ 8 + À K 2 1 L Ω p σ 2 ` Φ 2 q 1 { 2 ` L B ( s Ω log p a p n ` N q n . (S.27) T o upp er b ound the supnorm of J 2 and J 3 , w e need t he follow ing b ounds. Fir st, b y Prop o- sition S.2, we ha v e p p B ´ B q T # ř n i “ 1 X i m p X i q n ´ ř n ` N i “ 1 X i m p X i q n ` N + 8 ď max k p B k ´ B k 1 # 1 n n ÿ i “ 1 X i m p X i q ´ µ 8 ` 1 n ` N n ` N ÿ i “ 1 X i m p X i q ´ µ 8 + À K 2 1 p s B ` s 1 { 2 B L B q ˜ log p n ` c n c log p n ¸ ` K 3 1 a ss B p σ 2 ` Φ 2 q log p n . F urthermore, using a similar argument in the pro o f of Theorem 3.2 of Deng et a l. (2024), w e ha v e B T 1 2 2 ÿ j “ 1 « ř i P D ˚ j X i t p m ´ j p X i q ´ m p X i qu n j ´ ř i P D j X i t p m ´ j p X i q ´ m p X i qu n j ` N j ff 8 ď L B max j “ 1 , 2 ř i P D ˚ j X i t p m ´ j p X i q ´ m p X i qu n j ´ ř i P D j X i t p m ´ j p X i q ´ m p X i qu n j ` N j 8 À K 1 L B c n c log p n . Under the condition s B K 2 1 ´ c n ` b log p n ¯ “ o p 1 q , one can easily ve rify that S20 max k p B k ´ B k 1 À L B ` K 2 1 b ss B p σ 2 ` Φ 2 q log p n , and therefore, p p B ´ B q T 1 2 2 ÿ j “ 1 « ř i P D ˚ j X i t p m ´ j p X i q ´ m p X i qu n j ´ ř i P D j X i t p m ´ j p X i q ´ m p X i qu n j ` N j ff 8 À K 1 L B c n c log p n ` c n K 3 1 a ss B p σ 2 ` Φ 2 q log p n , whic h is of smaller order than the previous t w o terms. Giv en these b ounds, we can decomp ose and b ound ξ 0 ´ p ξ S 8 as ξ 0 ´ p ξ S 8 “| ψ | 1 2 p B T 2 ÿ j “ 1 # ř i P D ˚ j X i p m ´ j p X i q n j ´ ř i P D j X i p m ´ j p X i q n j ` N j + ´ B T # ř n i “ 1 X i m p X i q n ´ ř n ` N i “ 1 X i m p X i q n ` N + 8 ď p p B ´ B q T # ř n i “ 1 X i m p X i q n ´ ř n ` N k “ 1 X i m p X i q n ` N + 8 ` p p B ´ B q T 1 2 2 ÿ j “ 1 « ř i P D ˚ j X i p m ´ j p X i q ´ m p X i q ( n j ´ ř i P D j X i p m ´ j p X i q ´ m p X i q ( n j ` N j ff 8 ` B T 1 2 2 ÿ j “ 1 « ř i P D ˚ j X i p m ´ j p X i q ´ m p X i q ( n j ´ ř i P D j X i p m ´ j p X i q ´ m p X i q ( n j ` N j ff 8 À K 2 1 p s B ` s 1 { 2 B L B q ˜ log p n ` c n c log p n ¸ ` K 3 1 a ss B p σ 2 ` Φ 2 q log p n . Th us, for J 2 and J 3 w e hav e } J 3 } 8 À L Ω # K 2 1 p s B ` s 1 { 2 B L B q ˜ log p n ` c n c log p n ¸ ` K 3 1 a ss B p σ 2 ` Φ 2 q log p n + . (S.28) Since we hav e K 1 L Ω s Ω b log p n ` N “ o p 1 q , } J 2 } 8 is of smaller order than that of } J 3 } 8 . Th us, from (S.27) and (S.28 ) , w e hav e J “ Ω « X T p Y ´ X θ ˚ q n ´ ψ B T # ř n i “ 1 X i m p X i q n ´ ř n ` N i “ 1 X i m p X i q n ` N +ff ` R em, S21 where } Rem } 8 À L Ω K 2 1 « tp σ 2 ` Φ 2 q 1 { 2 ` L B u s Ω log p a p n ` N q n `p s B ` s 1 { 2 B L B q ˜ log p n ` c n c log p n ¸ ` K 1 a ss B p σ 2 ` Φ 2 q log p n ff . Finally , combining with (S.25) and (S.2 6 ), w e obtain fro m (S.24) that v T p θ d S ´ θ ˚ q “ v T Ω « X T p Y ´ X θ ˚ q n ´ ψ B T # ř n i “ 1 X i m p X i q n ´ ř n ` N i “ 1 X i m p X i q n ` N +ff ` O p p ¯ δ n q , (S.29) where ¯ δ n “ } v } 1 L Ω K 2 1 « p σ 2 ` Φ 2 q 1 { 2 ` L B ( s Ω log p a p n ` N q n `p s B ` s 1 { 2 B L B q ˜ log p n ` c n c log p n ¸ ` K 1 p s _ s B q a p σ 2 ` Φ 2 q log p n ff . T o show the asymptotic normalit y of v T p θ d S ´ θ ˚ q , w e denote ξ i “ $ ’ ’ & ’ ’ % 1 n v T Ω p T i 1 ´ N ψ n ` N B T T i 2 q for 1 ď i ď n, ψ n ` N v T Ω B T T i 2 for n ` 1 ď i ď n ` N , where T i 1 “ X i p Y i ´ X T i θ ˚ q and T i 2 “ X i m p X i q ´ µ . One can rewrite (S.29) as v T p θ d S ´ θ ˚ q “ n ` N ÿ i “ 1 ξ i ` O p p ¯ δ n q . T o apply the Lindeb erg-F eller Central Limit Theorem, w e first note that E p ξ i q “ 0. F urther- S22 more, n ` N ÿ i “ 1 E p ξ 2 i q “ 1 n v T Ω " E p T b 2 i 1 q ´ 2 N ψ n ` N B T E p T i 2 T T i 1 q ` N 2 ψ 2 p n ` N q 2 B T E p T b 2 i 2 q B * Ω v ` ψ 2 N p n ` N q 2 v T Ω B T E p T b 2 i 2 q B Ω v “ 1 n v T Ω " E p T b 2 i 1 q ´ 2 N ψ n ` N B T E p T i 2 T T i 1 q ` N ψ 2 n ` N B T E p T b 2 i 2 q B * Ω v . Recall that B “ t E p T b 2 i 2 qu ´ 1 E p T i 2 T T i 1 q . Thus , w e ha v e n ` N ÿ i “ 1 E p ξ 2 i q “ 1 n v T Ω „ E p T b 2 i 1 q ´ N p 2 ψ ´ ψ 2 q n ` N E p T i 2 T T i 1 q T t E p T b 2 i 2 qu ´ 1 E p T i 2 T T i 1 q Ω v : “ t 2 n . Note that E } T i 1 } 2 ` δ 8 ď K 2 ` δ 1 E | ǫ i ` η i | 2 ` δ À K 2 ` δ 1 and E } T i 2 } 2 ` δ 8 À K 2 ` δ 1 . In addition, our assumption implies t 2 ` δ n ě C } v } 2 ` δ 2 { n 1 ` δ { 2 . Finally , w e can verify that the Ly apuno v condition holds ř n ` N i “ 1 E | ξ i | 2 ` δ t 2 ` δ n ď } v } 2 ` δ 1 L 2 ` δ Ω t 2 ` δ n # 1 n 1 ` δ E › › › › T i 1 ´ N ψ n ` N B T T i 2 › › › › 2 ` δ 8 ` ψ 2 ` δ N p n ` N q 2 ` δ E › › B T T i 2 › › 2 ` δ 8 + À ˆ } v } 1 L Ω K 1 } v } 2 ˙ 2 ` δ 1 n δ { 2 ˆ 1 ` L 2 ` δ B N n ` N ˙ Ñ 0 . Therefore, w e obtain the desired res ult b y applying the Lindeberg-F eller Central Limit The- orem and Slutsky Theorem. This completes the pro o f. S.4.1 P r o of of Pr op osition 1 Pr o of. W e first establish t he rate of p M 1 and p M 2 in the elemen tw ise supnorm. Define M 1 “ E tp Y i ´ X T i θ ˚ q 2 X b 2 i u . W e note that } p M 1 ´ M 1 } max ď › › › 1 n n ÿ i “ 1 p Y i ´ X T i θ ˚ q 2 X b 2 i ´ M 1 › › › max ` › › › 2 n n ÿ i “ 1 p Y i ´ X T i θ ˚ qt X T i p p θ D ´ θ ˚ qu X b 2 i › › › max ` › › › 1 n n ÿ i “ 1 t X T i p p θ D ´ θ ˚ qu 2 X b 2 i › › › max À K 3 1 c s log p n , S23 where w e use the momen t inequalit y in Lemma S.2 and Lemma S.5. Similarly , define M 2 “ E p T i 2 T T i 1 q . Since p M 2 is constructed by sample splitting, it suffices to deriv e the rate of p M j 2 ´ M 2 . F ollow ing the same t yp e o f a rgumen t, we can sho w that } p M j 2 ´ M 2 } max ď › › › 1 n j ÿ i P D ˚ j p Y i ´ X T i p θ D qt p m ´ j p X i q ´ m p X i qu X b 2 i › › › max ` › › › 1 n j ÿ i P D ˚ j X T i p p θ D ´ θ ˚ q m p X i q X b 2 i › › › max ` › › › 1 n j ÿ i P D ˚ j p Y i ´ X T i θ ˚ q m p X i q X b 2 i ´ M 2 › › › max À K 2 1 c n ` K 3 1 c s log p n . T ogether with Prop osition S.2, we ha v e } p B T p M 2 ´ B T M 2 } max ď } p B ´ B } 8 } p M 2 ´ M 2 } max ` } p B ´ B } 8 } M 2 } max ` } B } 8 } p M 2 ´ M 2 } max À K 2 1 Rem, where Rem “ K 1 p s B ` s 1 { 2 B L B q ˜ c log p n ` c n ¸ ` K 2 1 c ss B log p n ` K 1 L B c s log p n As a result, } p Γ ψ ´ Γ ψ } max À K 3 1 c s log p n ` N K 2 1 n ` N Rem. One can easily show that } Γ ψ } max À K 2 1 ` N n ` N L B K 2 1 , whic h implies } p Γ ψ } max ď } Γ ψ } max ` } p Γ ψ ´ Γ ψ } max À K 2 1 ` N n ` N L B K 2 1 S24 under the assumption that Rem “ o p 1 q and K 1 b s log p n “ o p 1 q . Similarly , } p Ω } 8 À L Ω since } p Ω ´ Ω } 8 “ o p 1 q . Finally , we can establish the rate of con v ergence of the estimated v a riance | v T p Ω p Γ ψ p Ω v ´ v T ΩΓ ψ Ω v | ď | v T p p Ω ´ Ω q p Γ ψ p Ω v | ` | v T Ω p Γ ψ p p Ω ´ Ω q v | ` | v T Ω p p Γ ψ ´ Γ ψ q Ω v | À } v } 2 1 p L Ω } p Ω ´ Ω } 8 } p Γ ψ } max ` L 2 Ω } p Γ ψ ´ Γ ψ } max q À } v } 2 1 ˜ K 1 L 2 Ω s Ω c log p n ` N } Γ ψ } max ` K 3 1 L 2 Ω c s log p n ` N K 2 1 L 2 Ω n ` N Rem ¸ , whic h prov es (15). The pro o f of (16) is immediate by the Slutsky Theorem. S.4.2 P r o of of Pr op osition S.2 Pr o of. T o show Prop osition S.2, it suffices to sho w that the same rat e of conv ergence holds for p B j ¨ k . F or simplicit y of presen ta tion, w e use the nota tion p θ D “ p θ , p B ¨ k “ p β , B ¨ k “ β , p ∆ “ p β ´ β a nd λ “ r λ k , p Z i “ X i p m ´ j p X i q ´ p µ j and Z i “ X i m p X i q ´ µ , p F “ 1 n j ř i P D ˚ j p Z i p Z T i W e start f r om the inequalit y 1 n j ÿ i P D ˚ j ” X ik p Y i ´ X T i p θ q ´ p β T X i p m ´ j p X i q ´ p µ j ( ı 2 ` λ p β 1 ď 1 n j ÿ i P D ˚ j ” X ik p Y i ´ X T i p θ q ´ β T X i p m ´ j p X i q ´ p µ j ( ı 2 ` λ k β k 1 . F ollowing t he standard argument in the analysis of Lasso (e.g., the pro of of Theorem 7.1 in Tsybak o v et al. (20 09)), the ab ov e inequality reduces to p ∆ T p F p ∆ ď λ k β k 1 ´ λ p β 1 ` 2 n j ÿ i P D ˚ j ! X ik p Y i ´ X T i p θ q ´ β T p Z i ) p Z T i p ∆ (S.30) “ λ k β k 1 ´ λ p β 1 ` I 1 ` I 2 ` I 3 ` I 4 , S25 where I 1 “ 2 n j ÿ i P D ˚ j X ik p Y i ´ X T i θ ˚ q ´ β T Z i ( Z T i p ∆ , I 2 “ 2 n j ÿ i P D ˚ j X ik p Y i ´ X T i θ ˚ q ´ β T Z i ( p p Z i ´ Z i q T p ∆ , I 3 “ ´ 2 n j ÿ i P D ˚ j X ik X T i p p θ ´ θ ˚ q p Z T i p ∆ , and I 4 “ ´ 2 n j ÿ i P D ˚ j β T p p Z i ´ Z i q p Z T i p ∆ . T o b ound I 1 , w e note that E “ t X ik p Y i ´ X T i θ ˚ q ´ β T Z i u Z i ‰ “ 0 b y the definition of β . T o in v ok e Lemma S.2, w e con trol the second moment as E ” max 1 ď j ď p t X ik p Y i ´ X T i θ ˚ q ´ β T Z i u 2 Z 2 ij ı À K 2 1 E ” t X ik p Y i ´ X T i θ ˚ q ´ β T Z i u 2 ı À K 2 1 , where first step | Z ij | “ | X ij m p X i q ´ µ ij | À K 1 holds as | X ij | ď K 1 and | m p X i q| ď C a nd second step relies on the assumption that the second momen t of X ik p Y i ´ X T i θ ˚ q ´ β T Z i is b ounded. Therefore, applying Holder inequality and Lemma S.2 with m “ 2, we ha v e | I 1 | À › › › 1 n j ÿ i P D ˚ j t X ik p Y i ´ X T i θ ˚ q ´ β T Z i u Z i › › › 8 } p ∆ } 1 À K 1 c log p n } p ∆ } 1 . (S.31) Similarly , w e hav e | I 2 | À } 1 n j ř i P D ˚ j E ik p p Z i ´ Z i q} 8 } p ∆ } 1 , where E ik “ X ik p Y i ´ X T i θ ˚ q ´ β T Z i . F urthermore, we notice that 1 n j ÿ i P D ˚ j E ik p p Z i ´ Z i q “ 1 n j ÿ i P D ˚ j E ik X i p m ´ j p X i q ´ m p X i q ( ´ ¨ ˝ 1 n j ÿ i P D ˚ j E ik ˛ ‚ 1 n j ÿ i P D ˚ j ” X i p m ´ j p X i q ´ E t X i m p X i qu ı . S26 F or the first term, w e can apply Cauc h y–Sc hw arz inequalit y to show that max 1 ď l ď p ˇ ˇ ˇ 1 n j ÿ i P D ˚ j E ik X il t p m ´ j p X i q ´ m p X i qu ˇ ˇ ˇ ď max 1 ď l ď p ˇ ˇ ˇ 1 n j ÿ i P D ˚ j E 2 ik X 2 il ˇ ˇ ˇ 1 { 2 ˇ ˇ ˇ 1 n j ÿ i P D ˚ j t p m ´ j p X i q ´ m p X i qu 2 ˇ ˇ ˇ 1 { 2 À K 1 c n , (S.32) where in t he last step w e in v oke Lemma S.2 again to show max 1 ď l ď p | 1 n j ř i P D ˚ j E 2 ik X 2 il ´ E p E 2 ik X 2 il q| À K 2 1 b log p n and E p E 2 ik X 2 il q À K 2 1 together with t r iangle inequalit y imply the desired b o und. F or the second term, w e first notice that 1 n j ř i P D ˚ j E ik “ O p p 1 q , a nd then a similar argumen t leads to max 1 ď l ď p ˇ ˇ ˇ ˇ ˇ ˇ 1 n j ÿ i P D ˚ j “ X il p m ´ j p X i q ´ E t X il m p X i qu ‰ ˇ ˇ ˇ ˇ ˇ ˇ ď max 1 ď l ď p ˇ ˇ ˇ 1 n j ÿ i P D ˚ j X il p m ´ j p X i q ´ m p X i q ( ˇ ˇ ˇ ` max 1 ď l ď p ˇ ˇ ˇ 1 n j ÿ i P D ˚ j r X il m p X i q ´ E t X il m p X i qus ˇ ˇ ˇ À K 1 c n ` K 1 c log p n , (S.33) where w e apply the Ho effding inequalit y as | X il m p X i q| ď C K 1 . Com bining (S.32) and (S.3 3), w e hav e | I 2 | À › › › 1 n j ÿ i P D ˚ j E ik p p Z i ´ Z i q › › › 8 } p ∆ } 1 À ˜ K 1 c n ` K 1 c log p n ¸ } p ∆ } 1 . (S.34) W e now consider I 3 . Recall that Lemma S.5 implies 1 n ř n i “ 1 ! X T i p p θ ´ θ ˚ q ) 2 “ O p ! K 2 1 s p σ 2 ` Φ 2 q log p n ) . Th us, | I 3 | À ˇ ˇ ˇ 1 n j ÿ i P D ˚ j t X T i p p θ ´ θ ˚ qu 2 X 2 ik ˇ ˇ ˇ 1 { 2 p p ∆ T p F p ∆ q 1 { 2 À K 2 1 c s p σ 2 ` Φ 2 q log p n p p ∆ T p F p ∆ q 1 { 2 . (S.35) S27 Similarly , the Cauc h y–Sc h w arz inequalit y yields | I 4 | À „ 1 n j ř i P D ˚ j ! β T p p Z i ´ Z i q ) 2 1 { 2 p p ∆ T p F p ∆ q 1 { 2 . Moreo v er, 1 n j ÿ i P D ˚ j t β T p p Z i ´ Z i qu 2 ď 2 n j ÿ i P D ˚ j p β T X i q 2 t p m ´ j p X i q ´ m p X i qu 2 ` 2 ¨ ˝ 1 n j ÿ i P D ˚ j “ β T X i m p X i q ´ E t β T X i m p X i qu ‰ ˛ ‚ 2 À K 2 1 L 2 B c 2 n ` ˜ K 1 L B c n ` K 1 L B c log p n ¸ 2 where the last step holds by using a similar argument as in (S.32) and (S.33) together with the fact that | β T X i | ď } β } 1 } X i } 8 ď K 1 L B . As a result, w e ha v e | I 4 | À ˜ K 1 L B c n ` K 1 L B c log p n ¸ p p ∆ T p F p ∆ q 1 { 2 . Collecting the b ounds in (S.31), (S.34) and (S.35), w e obtain from (S.30 ) that p ∆ T p F p ∆ ď λ k β k 1 ´ λ p β 1 ` t 1 } p ∆ } 1 ` t 2 p p ∆ T p F p ∆ q 1 { 2 ď λ p ∆ S 1 ´ λ p ∆ S c 1 ` t 1 } p ∆ } 1 ` t 2 p p ∆ T p F p ∆ q 1 { 2 , where t 1 “ C ´ K 1 c n ` K 1 b log p n ¯ and t 2 “ C " K 1 L B ´ c n ` b log p n ¯ ` K 2 1 b s p σ 2 ` Φ 2 q log p n * for some sufficien tly large constan t C . By taking λ ě 2 t 1 , w e ha v e p ∆ T p F p ∆ ď 3 2 λ p ∆ S 1 ´ 1 2 λ p ∆ S c 1 ` t 2 p p ∆ T p F p ∆ q 1 { 2 . (S.36) In the follo wing, w e consider tw o cases. In case (1 ): t 2 p p ∆ T p F p ∆ q 1 { 2 ď λ p ∆ S 1 , (S.36) further implies p ∆ T p F p ∆ ď 5 2 λ p ∆ S 1 ´ 1 2 λ p ∆ S c 1 , S28 whic h leads to t he standard cone condition p ∆ S c 1 ď 5 p ∆ S 1 . With lemma S.6, w e can sho w that } p ∆ } 2 2 À λ p ∆ S 1 ď λs 1 { 2 B p ∆ S 2 and therefore } p ∆ } 2 À λs 1 { 2 B . Similar ly , w e can deriv e } p ∆ } 1 À λs B . In case (2): t 2 p p ∆ T p F p ∆ q 1 { 2 ą λ p ∆ S 1 , (S.36) implies p ∆ T p F p ∆ ď 3 2 λ p ∆ S 1 ` t 2 p p ∆ T p F p ∆ q 1 { 2 ď 5 2 t 2 p p ∆ T p F p ∆ q 1 { 2 , and therefore p ∆ T p F p ∆ ď 25 4 t 2 2 . Since t 2 p p ∆ T p F p ∆ q 1 { 2 ą λ p ∆ S 1 holds in case (2), we immedi- ately obtain p ∆ S 1 ď 5 t 2 2 2 λ . T o con trol p ∆ S c 1 , w e rely on (S.36) again, whic h is 1 2 λ p ∆ S c 1 ď 3 2 λ p ∆ S 1 ` t 2 p p ∆ T p F p ∆ q 1 { 2 . This leads to p ∆ S c 1 ď 3 p ∆ S 1 ` 5 t 2 2 λ ď 25 t 2 2 2 λ , suc h tha t } p ∆ } 1 À t 2 2 { λ . Com bining the b ounds in these tw o cases, w e deriv e } p ∆ } 1 À λs B ` t 2 2 { λ, where λ is sub ject t o the constrain t that λ ě 2 t 1 . T o establish a sharp ra te of } p ∆ } 1 , w e can further minimize f p λ q “ λs B ` t 2 2 { λ sub ject to the constrain t λ ě 2 t 1 . Define λ opt “ t 2 { s 1 { 2 B . When λ opt ě 2 t 1 , the minimizer of f p λ q is λ opt and the r esulting minimal v alue is f p λ opt q “ s 1 { 2 B t 2 . How ev er, when λ opt ă 2 t 1 , b y the mo no tonicit y of f p λ q the minimal is giv en by f p 2 t 1 q — t 1 s B . Combining these tw o cases, finally , w e obtain the desired rate } p ∆ } 1 À t 1 s B ` s 1 { 2 B t 2 . With a slight mo dification of t he pro of (e.g., | I 1 | À K 1 b log p n } p ∆ } 1 still holds unifo r mly ov er 1 ď k ď p ), w e obtain the same rate for } p B ¨ k ´ B ¨ k } 1 uniformly o v er 1 ď k ď p . This concludes the pro of. Recall that p Z i “ X i p m ´ j p X i q ´ p µ j , Z i “ X i m p X i q ´ µ and p F “ 1 n j ř i P D ˚ j p Z b 2 i S29 Lemma S.6 (RE condition for p B k ) . Assume that the same c onditions in The or em 1 ho l d . Then with pr ob ab ility tending to 1, inf v P C , v ‰ 0 v T p F v } v } 2 2 ě C , wher e C “ t v P R p : D S Ď t 1 , ..., p u , | S | “ s B , k v S c k 1 ď ξ k v S k 1 u for some c onstants C , ξ ą 0 . Pr o of. W e define F “ 1 n j ř i P D ˚ j Z b 2 i . It holds that v T p F v “ v T p p F ´ F q v ` v T t F ´ E p F qu v ` v T E p F q v ě v T E p F q v ´ | v T p p F ´ F q v | ´ | v T t F ´ E p F qu v | . In what follows, w e will b ound the three terms in the last line one b y one. Clearly , v T E p F q v ě C } v } 2 2 (S.37) uniformly o ve r v , as E p F q has b ounded smallest eigenv alues. F or the last term, | v T t F ´ E p F qu v | ď } v } 2 1 } F ´ E p F q} max ď s B p ξ ` 1 q 2 } v } 2 2 } F ´ E p F q} max À s B } v } 2 2 K 2 1 c log p n , where the second step holds as } v } 1 ď p ξ ` 1 q} v S } 1 ď p ξ ` 1 q s 1 { 2 B } v S } 2 ď p ξ ` 1 q s 1 { 2 B } v } 2 and the last step is obtained b y the Ho effding inequality together with the b ound } X i m p X i q} 8 ď C K 1 . Under the condition s B K 2 1 b log p n “ o p 1 q , w e ha v e sup v P C , v ‰ 0 | v T t F ´ E p F qu v | } v } 2 2 “ o p 1 q . (S.38) S30 No w, w e fo cus on the second term | v T p p F ´ F q v | . T o this end, w e first note that | v T p p µ j ´ µ q | ď ˇ ˇ ˇ 1 n j ÿ i P D ˚ j v T X i t p m ´ j p X i q ´ m p X i qu ˇ ˇ ˇ ` ˇ ˇ ˇ 1 n j ÿ i P D ˚ j v T r X i m p X i q ´ E t X i m p X i qus ˇ ˇ ˇ ď ˇ ˇ ˇ 1 n j ÿ i P D ˚ j p v T X i q 2 ˇ ˇ ˇ 1 { 2 ˇ ˇ ˇ 1 n j ÿ i P D ˚ j t p m ´ j p X i q ´ m p X i qu 2 ˇ ˇ ˇ 1 { 2 ` } v } 1 › › › 1 n j ÿ i P D ˚ j r X i m p X i q ´ E t X i m p X i qus › › › 8 À } v } 1 K 1 ˜ c n ` c log p n ¸ , (S.39) whic h is implied by the Ho effding inequalit y in the last step and } p m ´ j ´ m } 2 À c n . In addition, 1 n j ÿ i P D ˚ j p v T X i q 2 t p m ´ j p X i q ´ m p X i qu 2 À } v } 2 1 K 2 1 c 2 n . Com bined with (S.39), w e ha v e 1 n j ÿ i P D ˚ j r v T X i t p m ´ j p X i q ´ m p X i qu ´ v T p p µ j ´ µ q s 2 ď 2 n j ÿ i P D ˚ j r v T X i t p m ´ j p X i q ´ m p X i qus 2 ` 2 n j ÿ i P D ˚ j t v T p p µ j ´ µ q u 2 À } v } 2 1 K 2 1 ˜ c n ` c log p n ¸ 2 . (S.40) An implication of (S.40) is the following inequalit y 1 n j ÿ i P D ˚ j r v T X i t p m ´ j p X i q ` m p X i qu ´ v T p p µ j ` µ q s 2 ď 2 n j ÿ i P D ˚ j r v T X i t p m ´ j p X i q ´ m p X i qu ´ v T p p µ j ´ µ q s 2 ` 2 n j ÿ i P D ˚ j t 2 v T X i m p X i q ´ 2 v T µ u 2 À } v } 2 1 K 2 1 ˜ c n ` c log p n ¸ 2 ` } v } 2 1 K 2 1 À } v } 2 1 K 2 1 . (S.41) S31 Finally , applying Cauc h y–Sc h w arz inequality w e can show that | v T p p F ´ F q v | “ ˇ ˇ ˇ 1 n j ÿ i P D ˚ j ” v T X i p m ´ j p X i q ´ v T p µ ( 2 ´ v T X i m p X i q ´ v T µ ( 2 ı ˇ ˇ ˇ “ ˇ ˇ ˇ 1 n j ÿ i P D ˚ j r v T X i t p m ´ j p X i q ´ m p X i qu ´ v T p p µ ´ µ qsr v T X i t p m ´ j p X i q ` m p X i qu ´ v T p p µ ` µ qs ˇ ˇ ˇ ď ˇ ˇ ˇ 1 n j ÿ i P D ˚ j r v T X i t p m ´ j p X i q ´ m p X i qu ´ v T p p µ j ´ µ q s 2 ˇ ˇ ˇ 1 { 2 ˆ ˇ ˇ ˇ 1 n j ÿ i P D ˚ j r v T X i t p m ´ j p X i q ` m p X i qu ´ v T p p µ j ` µ q s 2 ˇ ˇ ˇ 1 { 2 À } v } 2 1 K 2 1 ˜ c n ` c log p n ¸ À } v } 2 2 s B K 2 1 ˜ c n ` c log p n ¸ , (S.42) where w e use ( S.4 0) and (S.41). Therefore, from (S.37) , (S.3 8 ) and (S.42), w e obtain inf v P C , v ‰ 0 v T p F v } v } 2 2 ě C ´ o p 1 q . S.5 Some T ec hn ical Details S.5.1 Sparsity assumption on B Here, w e first comprehensiv ely illustrate the meaning and the implication of the sparsit y assumption on the co efficien t matrix B , then w e in v estigate one scenario where t his sparsity assumption is satisfied, t o gether with a concrete example. Meaning and implications of the sparsit y of B . Recall t ha t the matrix B P R p ˆ p is defined as the coefficien t matrix w here X p Y ´ X T θ ˚ q is the res p o nse and X m p X q ´ µ is the co v ar ia te; i.e., X p Y ´ X T θ ˚ q “ B T t X m p X q ´ µ u ` E . S32 F or eac h co ordinate j , one can write X j p Y ´ X T θ ˚ q “ p ÿ k “ 1 B k j t X k m p X q ´ µ k u ` E j . Th us, the j t h column of B is sparse ; i.e., |t k : B k j ‰ 0 u| ! p , indicates that, among all the p v ariables t X k m p X q ´ µ k u , k “ 1 , . . . , p , only a small p o r t ion of t hem are truly con tributing to the outcome X j p Y ´ X T θ ˚ q . The matrix B ha s the closed-form expression B “ p E rt X m p X q ´ µ u b 2 sq ´ 1 E t X b 2 m p X qp Y ´ X T θ ˚ qu . F rom this expression, whether t he sparsit y assumption can b e satisfied is driv en b y a few factors, suc h as t he c hoice of the function m p x q , and the structure of cov ariate X . Below , w e first prov ide general justification for a scenario in whic h this assumption is naturally satisfied. Then, w e presen t a concrete example. General justification: when co v ariate X has the blo ckwise indep endence struc- ture. W e denote the supp ort of function m b y S m Ď t 1 , ..., p u whic h is the index set of all the v ariables presen t in m p¨q . Assume that the predictor v ariables exhibit blo c k indep en- dence with blo cks corresponding to the blo ck-diagonal co v aria nce matrix Σ , and the maximal blo c k-size is equal to b max . Under this assumption, w e firstly know that fo r 1 ď k ď p , if k R S m , } E rt X m p X q ´ µ u X k m p X qs} 0 ď b max , where w e use X k to denote the k th comp onen t of X . Otherwise, } E rt X m p X q ´ µ u X k m p X qs} 0 ď b max | S m | . S33 Therefore, w e can view the cov ariance matrix of X m p X q as a differen t blo ck -diag onal matrix with the same blo c ks as in Σ for those v ariables not in w orking mo del m . Moreo ve r, w e can claim that p E rt X m p X q ´ µ u b 2 sq ´ 1 presen ts the same blo c k structure as in co v ariance matrix of X m p X q . On the other hand, for k R S m Y S η , where η p X q “ f p X q ´ X T θ ˚ , } E rt X X k m p X q η p X qus} 0 ď b max , and the non-zero elemen ts are within the dep endence blo c k of X k . Therefore, giv en that B ¨ k “ p E r t X m p X q ´ µ u b 2 sq ´ 1 E rt X X k m p X q η p X qus , (S.43) w e kno w } B ¨ k } 0 ď b max since B j k is nonzero only wh en j is in the corresp onding dep endence blo c k of X k . F or k P S m Y S η , } E rt X X k m p X q η p X qus} 0 ď b max | S m Y S η | , and b y equation ( S.43) and the blo c k structure of p E rt X m p X q ´ µ u b 2 sq ´ 1 , w e know } B ¨ k } 0 ď b max | S m Y S η | . This inv estigation indicates that, if the supp orts of w orking mo del m p¨q and η p¨q , and the nonlinear part in f p¨q are sparse, the blo ck wise indep endence structure of X assumption is sufficien t to g uaran tee the sparsity of B . The fo llo wing example ev en indicates, in some s p ecial cases, only the blockw ise indep en- dence structure of X can guarantee the sparsit y of B . S34 Concrete example. Let p “ 2 M with M ě 2 and partitio n the features in to indep enden t biv ariate blo c ks X “ ¨ ˚ ˚ ˚ ˝ X 1 , X 2 G 1 , . . . , X p ´ 1 , X p G M ˛ ‹ ‹ ‹ ‚ T , G r „ N ¨ ˚ ˝ 0 , » — – 1 ρ ρ 1 fi ffi fl ˛ ‹ ‚ , where G r indep enden t across r , and | ρ | ă 1. No w, consider f p X q “ θ T X ` M ÿ r “ 1 γ r p X 2 r ´ 1 q 2 ´ 1 ( . By some simple a lg ebra, one can compute that θ ˚ “ θ , hence η p X q “ ř M r “ 1 γ r tp X 2 r ´ 1 q 2 ´ 1 u . In the follow ing deriv ations, we take m p X q : “ ř M r “ 1 tp X 2 r ´ 1 q 2 ´ 1 u , adopt the simpler no- tation that Z m p X q : “ X m p X q , then it is clear that µ “ E t X m p X q u “ 0 . By blo ck inde- p endence and symmetry , b oth E p Z m Z T m q and E t XX T m p X q η p X qu are blo ck-diagonal with iden tical 2 ˆ 2 blo c ks across r : E ` Z m Z T m ˘ “ diag p A , . . . , A q , E XX T m p X q η p X q ( “ diag p C 1 , . . . , C M q , where, A “ » — – 2 M ` 8 ρ p 2 M ` 8 q ρ p 2 M ` 8 q 2 M ` 8 ρ 2 fi ffi fl , C r “ » — – 2 G ` 8 γ r ρ p 2 G ` 8 γ r q ρ p 2 G ` 8 γ r q 2 G ` 8 ρ 2 γ r fi ffi fl , where G : “ ř M r “ 1 γ r . Therefore, eac h blo c k of B is B r “ A ´ 1 C r “ » — — – G ` 4 γ r M ` 4 4 ρ p M γ r ´ G q M p M ` 4 q 0 G M fi ffi ffi fl , r “ 1 , . . . , M . S35 Hence B “ diag p B 1 , . . . , B M q is blo c k-diagonal, hence sparse. An in teresting sp ecial case is when γ r ” 1, then B r “ I 2 for all r , then B b ecomes the identit y matrix I p . S.5.2 The formal pro of that t he condition 0 ă ψ ă 2 is necessary and sufficien t Recall that Γ ψ “ E p T b 2 i 1 q ´ N p 2 ψ ´ ψ 2 q n ` N E p T i 2 T T i 1 q ( T E p T b 2 i 2 q ( ´ 1 E p T i 2 T T i 1 q , K “ E p T b 2 i 1 q . Define c ψ : “ N p 2 ψ ´ ψ 2 q n ` N , A : “ E p T i 2 T T i 1 q , C : “ E p T b 2 i 2 qp ą 0 q . Then Γ ψ “ K ´ c ψ A T C ´ 1 A . F or an y v ‰ 0 , v T ΩΓ ψ Ω v “ v T Ω K Ω v ´ c ψ v T ΩA T C ´ 1 AΩ v “ v T Ω K Ω v ´ c ψ › › C ´ 1 { 2 AΩ v › › 2 2 . If 2 ψ ´ ψ 2 ą 0 (equiv alen tly 0 ă ψ ă 2), then c ψ ą 0 and v T ΩΓ ψ Ω v ď v T Ω K Ω v , with equality if a nd only if AΩ v “ 0 . In R emark 2, w e assume A has full rank (equiv alen tly A T C ´ 1 A ą 0 ), hence the inequalit y is strict for all v ‰ 0 : v T ΩΓ ψ Ω v ă v T Ω K Ω v . On the other hand, if v T ΩΓ ψ Ω v ă v T Ω K Ω v , then it follow s that c ψ › › C ´ 1 { 2 AΩ v › › 2 2 ą 0. Because A is of full rank whic h implies that } C ´ 1 { 2 AΩ v } 2 2 ą 0 for an y v ‰ 0 , it comes that c ψ ą 0 whic h implies 0 ă ψ ă 2. This completes the pro of. S36 S.5.3 E fficiency gain compared to the sup ervised estimator W e ar e able to see the efficie ncy gain by computing the relativ e efficienc y b etw een the sup ervised and the semi-sup ervised estimators. Note that the prop osed semi-supervised estimator a dmits the asymptotic v ariance v T ΩΓ ψ Ω v , while the sup ervised estimator has the asymptotic v ariance v T Ω K Ω v , with Γ ψ “ K ´ p 1 ´ ρ qp 2 ψ ´ ψ 2 q M , K “ E p T b 2 i 1 q , and M : “ t E p T i 2 T T i 1 qu T t E p T b 2 i 2 qu ´ 1 E p T i 2 T T i 1 q . Thus , the relative efficienc y equals v T ΩΓ ψ Ω v v T Ω K Ω v “ 1 ´ p 1 ´ ρ qp 2 ψ ´ ψ 2 q v T Ω M Ω v v T Ω K Ω v . Clearly , if w e ha ve more unlab eled data, ρ gets smaller, then w e ha v e a smaller relative efficiency that indicates a gr eat er efficiency gain. Also, it is clear that the optimal choice of ψ is 1. The term v T Ω M Ω v { v T Ω K Ω v is a lw a ys b ounded b et w een 0 and 1, since K ´ M is p ositiv e semi-definite. In the special situation that T i 1 is a line ar function of T i 2 , K = M a nd this terms b ecomes 1, where T i 1 “ X i p Y i ´ X T i θ ˚ q and T i 2 “ X i m p X i q ´ µ . S.5.4 Choice of functional class G for estimating m p x q The main assumption regarding the estimator p m p x q in Assumption 1 p ertains to the deter- ministic sequence c n where } p m ´ j ´ m } 2 “ O p p c n q . It is required that s B K 2 1 ´ c n ` b log p n ¯ “ o p 1 q . In practice, w e recommend that users of our metho d choose the function class G fro m commonly used ones, suc h as linear functions, a dditiv e functions, interaction mo dels (Z ha o & Leng 2016 ), single-index mo dels (Ra dchenk o 2015, Y ang, Ba lasubramanian & Liu 2017, Eftekhari et al. 2 0 21), or m ulti-index mo dels (Y ang , Balasubramanian, W ang & Liu 2017 ). If the function class G is c hosen to b e sparse linear, Theorem 7.20 in W ain wrigh t (2019) S37 sho w ed that c n — a s log p { n . Then the requiremen t b ecomes to s B K 2 1 a s log p { n “ o p 1 q . If the function class G is chose n to b e sparse additive , from some oracle inequalities for sparse additiv e estimator (Koltc hinskii & Y uan 2010 ) as w ell as classical nonparametric rate (Tsybak o v 2009), it implies that c n can b e chose n as ? s n ´ α {p 2 α ` 1 q ` a s log p { n, where it is assumed that eac h activ e univ aria t e comp o nen t has smo othness parameter α ą 0 . F or more complex choice s o f G , relev ant t heoretical results can b e found in the resp ectiv e literature, suc h as those for in teraction mo dels (Zhao & Leng 2 016), single-index mo dels (Radc henk o 201 5, Y ang, Balasubramanian & L iu 2017, Eftekhari et al. 2021), a nd multi- index mo dels (Y ang, Balasubramanian, W ang & Liu 2017). S.5.5 Comparison with related w ork in Section 3 When the dimension p is fixed and small, Azriel et al. (2022) a nd Chakrab ortty & Cai (2018) in v estigated how to incorp orate the unlab eled data to impro v e the estimation efficiency for regression co efficien ts in a w orking linear regression. In addition to the t echnic al ch allenges arise f rom the high dimensionalit y (e.g., regularization and one-step up date), a k ey difference from the previous works is that our dep endable semi-sup ervised approac h leads to a more efficien t estimator for an y linear com bination of θ ˚ . In t he follo wing, w e briefly summarize their metho dologies and explain the differences. T o impro v e the estimation efficiency for θ ˚ j , Azriel et al. (2022) considered the following adjusted linear regression, f o r an y j P r p s r Y ij “ θ ˚ j ` φ T j U ij ` r δ ij , where r Y ij “ Y i r X ij , U ij “ p U ij 1 , ..., U ij p q T with U ij k “ X ik r X ij for k ‰ j and U ij j “ X ij r X ij ´ 1 and r δ ij is a mean 0 random v aria ble. W e use the notatio n r X ij “ p X ij ´ γ T j X i, ´ j q{ E tp X ij ´ S38 γ T j X i, ´ j q 2 u where γ j is the estimand for the no dewise la sso (S.9). One in teresting prop erty of the adjusted linear r egr ession is that the para meter of in terest θ ˚ j b ecomes the inte rcept parameter, b ecause E p U ij q “ 0 and θ ˚ j “ E p Y i r X ij q “ E p r Y ij q b y the definition of r Y ij . Th us, when p is fixed and small, θ ˚ j can b e estimated b y p θ A j the LSE from the adjusted linear regression, where the unlab eled data can help the estimation of γ j and E tp X ij ´ γ T j X i, ´ j q 2 u . Thanks to the orthogonality of r δ ij and U ij , the a symptotic v ariance of p θ A j is s hown to b e no greater than p θ LS E j , the j th comp onent of the standard LSE p θ LS E “ p X T X q ´ 1 X T Y ; see their Theorem 2. As a result, if the parameter of in terest is an y c omp onen t of θ ˚ , their estimator pro vides the dep endable semi-sup ervised inference. Ho w ev er, since the adjusted linear regression is estimated for eac h j P r p s separately , their pro cedure do es not guarantee the o rthogonality of r δ ij and U ij 1 for an y j 1 ‰ j when the true regression function f p X q is nonlinear. Therefore, the linear comb ination of their estimators suc h as p θ A j ` p θ A j 1 ma y not b e more effic ien t than the standard LSE p θ LS E j ` p θ LS E j 1 . Unlik e their approac h, our estimator is constructed based on the geometric interpretation of estimating functions. The pro jection theory from estimating functions motiv ates us to consider the w orking regression mo del (5), whic h is different from the adjusted linear regression in Azriel et al. (2022). Chakrab ortty & Cai (2 0 18) prop osed a class of Efficien t and Adaptiv e Semi-Sup ervised Estimators (EASE) whic h exploit the unlab eled data based on a semi-non-parametric smo o th- ing and refitting estimate of a target imputation function µ p X q . They mainly fo cused on the con text that N is muc h larg er tha n n and p is fix ed. With an estimated imputation function p µ p X q , they deriv ed a n initial semi-sup ervised estimator p θ r through the estimating equation 1 N n ` N ÿ i “ n ` 1 X i p µ p X i q ´ X T i θ ( “ 0 . (S.44) The estimator p θ r attains the semi-parametric efficiency b ound when the imputation is suf- ficien t (i.e., the imputation function equals the conditiona l mean function µ p X q “ f p X q ) S39 or the conditional mean function f p X q is linear f p X q “ X T θ ˚ . As seen in Remark S.2 , these pro p erties also hold for our efficien t se mi-sup ervised estimator p θ d in ( 4 ). T o ensure the impro v ed efficiency o f EASE, they considered a further step of calibration whic h searc hed an optimal linear com bination of p θ r and the LSE p θ LS E . Their a da ptiv e estimator is defined as p θ E “ p θ LS E ` ∆ p p θ r ´ p θ LS E q , where ∆ is a diagona l matrix that minimizes the a symp- totic v ariance o f p θ E j for eac h j P r p s . When ∆ is consisten t ly estimated, p θ E j is alw ays no less efficien t than the LSE no ma t ter whether the imputation is sufficien t or f p X q is linear. Ho w ev er, by the construction of p θ E , the efficiency impro v emen t is not guaranteed if a linear com bination of θ ˚ is considered. S.5.6 The difference b etw een our framew ork and v ariable/feature imp or tance The setting w e adopt in this pap er is the so-called assumption-lean framew ork. This frame- w ork is suitable when one in inte rested in some simple but in terpretable parameter of interest, suc h as the asso ciation b et w een a certain phenoty p e and SNPs in the genome-wide asso ci- ation study . This framew ork do es not hav e t o b e confined in the linear working mo del. In fact, in Section 4, w e extend the metho dology to a more g eneral M-estimation fra mew ork, and w e hav e clarified that the key ideas carry ov er to this broader setting without substantial difficult y . V ariable imp ortance is a relev ant, but distinct, concept. In recen t y ears, o wing to its in terpretabilit y and generalit y , v ariable imp orta nce has attracted significan t interes t in the literature, particularly when estimated with flexible mac hine learning metho ds; see, e.g. Williamson et al. (2021, 2023), V erdinelli & W asserman (2024 a ), as w ell as applicatio ns in surviv al analysis (W olo c k et al. 2025) and causal inference (Hines et al. 2025 ). Many v ariable imp ortance measures exist, suc h as the one based on the Shapley v alue (V erdinelli & W asserman 2024 b ). Below, w e briefly review one of suc h measures. Using the notation w e use in our pap er, decomp ose the co v ariate X as X “ p X T 1 , X T 2 q T and denote f p X q “ E p Y | X q , S40 h p X q “ E p Y | X 2 q , then the imp o rtance of co v ariate X 1 can b e defined as ψ “ E “ t m p X q ´ h p X qu 2 ‰ . By construction, the parameter ψ quan tifies the impro v emen t in predictiv e p erformance ac hiev ed b y incorp ora ting X 1 , relativ e to solely using X 2 . While v ariable imp or tance measures are inhe rently model-ag nostic, their primary ob jec- tiv e is to quantify the predictiv e v alue of sp ecific features. In contrast, our goal in this pap er is to estimate and conduct inference on a generally defined parameter (e.g., a n as- so ciation measure deriv ed via a linear working mo del or a general M- estimator) within an assumption-lean framework. Therefore, the t w o o b jectiv es are fundamen tally distinct. S.6 Extra Numerical Results W e consider the following additiv e mo del fo r Y , that Y “ 0 . 5 X 2 1 ` 0 . 8 X 3 3 ´ p X 4 ´ 2 q 2 ` 2 p X 5 ` 1 q 2 ` 2 X 6 ` ǫ , where ǫ „ N p 0 , 1 q . Similar to Section 5, w e first generate a p - dimensional m ultiv aria t e normal random v ector U „ N p 0 , Σ q with Σ j k “ 0 . 3 | j ´ k | . W e set the co v ariate X “ p X 1 , ..., X p q T to be X 1 “ | U 1 | and X j “ U j for 1 ă j ď p . The reason w e tak e X 1 “ | U 1 | is that t his tr a nsformation implies E p X k 1 X j q “ 0 for j ‰ 1 but the parameter θ ˚ 1 for cen tered X 1 is nonzero. T o calculate the corresponding regression parameter θ ˚ under the w o rking linear mo del, w e first ce nte r Y and X 1 so that their means are 0. By Prop osition 4 in B ¨ uhlmann & V a n de Geer (2015), w e kno w that the supp ort of θ ˚ is S “ t 1 , 3 , 4 , 5 , 6 u and θ ˚ j for any j P S is giv en by the L 2 p P q pro jection in the sub-mo del only with the v ariable X j (e.g, θ ˚ 3 “ arg min E p 0 . 8 X 2 3 ´ θ 3 X 3 q 2 ). After some calculation, w e obtain θ ˚ “ p 1 . 1 , 0 , 2 . 4 , 4 , 4 , 2 , 0 , ..., 0 q T , whic h is sparse. With sample size n P t 100 , 30 0 u , the r a tio N { n P t 1 , 4 , 8 u and the dimension p P t 200 , 500 u , w e compare the p erformance of the four metho ds: p θ d 1 (D-Lasso1, that only uses lab eled data with sample size n ), p θ d 2 (D-Lasso2), b oth defined in (18), the straightforw ard S41 T able S.1: Simulation r esults for Mo del 1 with p “ 500: Bias, SD and RMSE stand f or empirical bias, standard dev iation, and root mean squared error , respective ly , len represen ts the length of 95 % confide nce in terv a l. The es timator s D-Lasso1 (that only uses lab eled da t a with sample size n ) and D-Lasso2 are p θ d 1 and p θ d 2 , defined in (24). The straightforw ard debi- ased estimator D-SSL is defined in (5). The pro p osed dep endable semi-supervised estimator S-SSL is defined in (1 4 ). The b est p erfo rmance is b olded during the comparison. n “ 100 n “ 300 n “ 500 N Bias SD RMSE len/2 Bias SD RMSE len/2 Bias SD RMSE len/2 θ 1 D-Lasso1 0.077 1.182 1.17 9 1.976 -0.072 0.296 0.303 0.54 8 -0.0 3 8 0.223 0.225 0.4 3 4 n D-Lasso2 0.008 0.695 0.692 1.14 2 -0.0 78 0.293 0.302 0.549 -0.038 0.222 0.224 0.433 D-SSL -0.188 0.618 0.643 2.192 -0.134 0.270 0.300 0.565 - 0 .074 0.196 0.208 0.351 S-SSL -0.198 0.562 0.594 0.963 - 0.112 0.260 0.282 0.466 -0.062 0.204 0.212 0 .368 4 n D-Lasso2 -0.009 0.677 0.674 1.113 -0 .077 0.290 0.29 8 0.546 -0.038 0.222 0.225 0.432 D-SSL -0.184 0.591 0.616 1.203 -0.148 0.280 0.316 0.401 -0.085 0.192 0.209 0.279 S-SSL -0.284 0.461 0.539 0.851 - 0.140 0.245 0.281 0.408 -0 .0 86 0.185 0.203 0.322 8 n D-Lasso2 -0.008 0.678 0.674 1.119 -0 .079 0.290 0.29 9 0.546 -0.039 0.222 0.225 0.432 D-SSL -0.200 0.575 0.606 0.906 -0.149 0.280 0.316 0.357 -0.089 0.190 0.209 0.259 S-SSL -0.318 0.439 0.540 0.798 - 0.146 0.243 0.283 0.390 -0 .0 93 0.177 0.199 0.307 θ 2 D-Lasso1 -0.386 1.867 1.898 2.50 4 0.017 0.162 0.1 6 2 0.330 -0.002 0.136 0.136 0.261 n D-Lasso2 0.031 0.363 0.362 0.64 8 0.016 0.162 0.1 6 2 0.330 -0.003 0.135 0.13 4 0.262 D-SSL -0.079 0.311 0.320 1.260 -0.017 0.141 0.141 0.328 -0.014 0.124 0.1 2 4 0.212 S-SSL -0.047 0.309 0.311 0.551 -0.003 0.142 0.141 0.288 -0.0 12 0.119 0.119 0.228 4 n D-Lasso2 0.026 0.347 0.347 0.64 1 0.013 0 .1 64 0.163 0 .330 -0.006 0.136 0.135 0 .262 D-SSL -0.104 0.311 0.326 0.695 -0.025 0.139 0.141 0.245 -0.019 0.113 0.114 0.174 S-SSL -0.118 0.285 0.307 0.484 - 0.024 0.138 0.139 0.261 -0 .0 21 0.113 0.115 0.205 8 n D-Lasso2 0.014 0.348 0.346 0.64 1 0.012 0 .1 64 0.163 0 .331 -0.006 0.137 0.136 0 .263 D-SSL -0.109 0.314 0.331 0.542 -0.024 0.139 0.140 0.222 -0.021 0.109 0.111 0.163 S-SSL -0.139 0.281 0.312 0.459 - 0.028 0.135 0.138 0.252 -0 .0 25 0.111 0.113 0 .1 99 θ 4 D-Lasso1 -0.284 2.374 2.379 3.90 6 -0.0 64 0.189 0.199 0.377 - 0.032 0.142 0.145 0.300 n D-Lasso2 -0.101 0.358 0.370 0.743 -0.059 0.194 0.202 0.377 -0.023 0.138 0.139 0.302 D-SSL -0.233 0.297 0.376 1.352 -0.083 0.180 0 .197 0.345 -0.048 0.120 0.129 0.222 S-SSL -0.203 0.309 0.368 0.604 -0.09 8 0.161 0.187 0.315 -0 .053 0.118 0.129 0.251 4 n D-Lasso2 -0.079 0.329 0.337 0.722 -0.046 0.195 0.199 0.378 -0.010 0.1 39 0.138 0.303 D-SSL -0.234 0.269 0.356 0.724 -0.085 0.167 0 .187 0.256 -0.04 9 0.111 0.121 0.182 S-SSL -0.251 0.273 0.370 0.510 -0.108 0.150 0.184 0.269 -0 .058 0.108 0.122 0.213 8 n D-Lasso2 -0.071 0.340 0.346 0.735 -0.039 0.195 0.198 0.379 -0.006 0.1 40 0.139 0.304 D-SSL -0.230 0.265 0.350 0.563 -0.086 0.162 0 .183 0.231 -0.04 7 0.116 0.125 0.170 S-SSL -0.264 0.268 0.375 0.485 -0.107 0.147 0.181 0.253 -0 .056 0.108 0.121 0.201 θ 5 D-Lasso1 0.481 1.909 1.95 9 1.912 0.139 0 .1 35 0.194 0 .251 0.080 0.092 0.122 0.191 n D-Lasso2 0.370 0.254 0.448 0.51 9 0.112 0.131 0.1 7 2 0.251 0.057 0.0 89 0.105 0.192 D-SSL 0.39 0 0.189 0.433 1.134 0.095 0.123 0.155 0.323 0.050 0.073 0.088 0.21 3 S-SSL 0.400 0.204 0.4 4 9 0.454 0.125 0.122 0.174 0.232 0.069 0.076 0.102 0.176 4 n D-Lasso2 0.268 0.256 0.370 0.521 0.078 0.133 0.154 0 .255 0.033 0.089 0.095 0.194 D-SSL 0.35 1 0.180 0.394 0.673 0.078 0.126 0.14 8 0.251 0.037 0.0 73 0.082 0 .178 S-SSL 0.346 0.183 0.3 9 1 0.414 0.089 0.115 0.145 0.218 0.047 0.072 0.085 0.164 8 n D-Lasso2 0.229 0.271 0.354 0.530 0.056 0.136 0.147 0 .257 0.019 0.091 0.092 0.196 D-SSL 0.32 8 0.190 0.379 0.544 0.069 0.123 0 .140 0.229 0.027 0.075 0.080 0 .168 S-SSL 0.310 0.181 0.359 0.402 0.077 0.111 0.135 0.213 0.036 0.071 0.080 0.161 θ 6 D-Lasso1 -0.097 0.676 0.680 1.164 -0 .057 0.135 0.14 6 0.245 -0.040 0.097 0.105 0.1 9 0 n D-Lasso2 -0.133 0.280 0.309 0.528 -0.042 0.139 0.145 0.246 -0.028 0.099 0.103 0.191 D-SSL -0.313 0.243 0.395 1.154 -0.056 0.120 0.132 0.327 -0.030 0.086 0.091 0 .217 S-SSL -0.219 0.238 0.323 0.456 -0.06 0 0.125 0.138 0.226 -0.040 0.093 0.101 0.175 4 n D-Lasso2 -0.099 0.265 0.281 0.529 -0.023 0.142 0.143 0.248 -0.017 0.1 02 0.103 0.193 D-SSL -0.281 0.257 0.380 0.700 -0.048 0.118 0.127 0.252 -0.030 0.080 0.085 0 .180 S-SSL -0.218 0.248 0.329 0.436 -0.04 9 0.120 0.129 0.213 -0.036 0.088 0.094 0.163 8 n D-Lasso2 -0.075 0.262 0.271 0.534 -0.015 0.143 0.143 0.250 -0.010 0.1 03 0.103 0.194 D-SSL -0.282 0.261 0.383 0.555 -0.045 0.117 0.125 0.230 -0.026 0.078 0.082 0.169 S-SSL -0.218 0.244 0.326 0.421 -0.04 2 0.118 0.124 0.210 -0.030 0.086 0.0 9 1 0.160 S42 100 200 300 400 500 0.00 0.15 0.30 n D−Lasso1 D−Lasso2 D−SSL S−SSL θ 1 N=n 100 200 300 400 500 0.00 0.15 0.30 n D−Lasso1 D−Lasso2 D−SSL S−SSL N=4n 100 200 300 400 500 0.00 0.15 0.30 n D−Lasso1 D−Lasso2 D−SSL S−SSL N=8n 100 200 300 400 500 0.00 0.15 0.30 n D−Lasso1 D−Lasso2 D−SSL S−SSL θ 2 100 200 300 400 500 0.00 0.15 0.30 n D−Lasso1 D−Lasso2 D−SSL S−SSL 100 200 300 400 500 0.00 0.15 0.30 n D−Lasso1 D−Lasso2 D−SSL S−SSL 100 200 300 400 500 0.00 0.15 0.30 n D−Lasso1 D−Lasso2 D−SSL S−SSL θ 4 100 200 300 400 500 0.00 0.15 0.30 n D−Lasso1 D−Lasso2 D−SSL S−SSL 100 200 300 400 500 0.00 0.15 0.30 n D−Lasso1 D−Lasso2 D−SSL S−SSL 100 200 300 400 500 0.00 0.15 0.30 n D−Lasso1 D−Lasso2 D−SSL S−SSL θ 5 100 200 300 400 500 0.00 0.15 0.30 n D−Lasso1 D−Lasso2 D−SSL S−SSL 100 200 300 400 500 0.00 0.15 0.30 n D−Lasso1 D−Lasso2 D−SSL S−SSL 100 200 300 400 500 0.00 0.15 0.30 n D−Lasso1 D−Lasso2 D−SSL S−SSL θ 6 100 200 300 400 500 0.00 0.15 0.30 n D−Lasso1 D−Lasso2 D−SSL S−SSL 100 200 300 400 500 0.00 0.15 0.30 n D−Lasso1 D−Lasso2 D−SSL S−SSL Figure S.1: Sim ulation results for Mo del 1 with p “ 500: absolute difference b et w een the empirical 95% co verage probabilit y and the nominal lev el 0.95. In all panels, r ows r epresen t differen t parameters, columns represen t differen t N { n ratios, and eac h panel plots the trend o v er the sample size n . S43 debiased estimator D-SSL p θ d defined in ( 4 ), and the prop osed dep endable semi-supervised estimator S-SSL p θ d S,ψ “ 1 defined in (9). Based on 100 sim ulation replicates, w e rep ort the empirical bias ( Bia s), standard devi- ation (SD) , ro o t mean squared error (RMSE), the half length of 95% confidence in terv al (len/2) a nd the co v erage proba bility (CVP) for eac h of the single parameters θ 1 , θ 3 , θ 4 , θ 5 and θ 6 , for p “ 200 a nd p “ 50 0 , in T able S.2 and T a ble S.3, resp ective ly . In T able S.4, w e also repo rt the computation time (in seconds) of one sim ulation replication of these four metho ds. It is seen that the co v erage rates o f all the metho ds ar e very close to the desired lev el 0 . 95, especially when the sample size n “ 300. In the ma jority of the sce narios w e consider, the D-SSL metho d pro duces the short est CIs among all four me tho ds, and the CIs fr o m the S-SSL metho d are alwa ys shorter than those fro m D -Lasso1 and D-Lasso2. As exp ected, the CIs fro m b oth D -SSL and S- SSL b ecome shorter as the size of unlab eled dat a N increases . Finally , we note tha t the length of CIs from D-La sso1 and D-L asso2 is v ery similar, whic h sho ws that the w ay of es timating Ω has little effect on debiased lasso estimators. In a ddition, in T able S.5, w e compare the p erfo r ma nce of the prop osed metho d S-SSL with differen t metho ds of estimating the conditional mean f unction f p¨q . Other than the metho d in Huang et al. (201 0 ) (huang), w e also implemen t the rando m forest metho d (randomforest) and the neural net w ork metho d (nnet). Under the setting w e consider, all three metho ds p erform ve ry similar and it is har d tell whic h one might b e b etter. In T able S.6, w e c ompare the p erfo rmance of the prop osed dep endable semi-supervised estimator S-SSL with different criteria of choosing the t uning parameters p λ Ω , λ B q in estimating p Ω , B q . Here, λ min refers to t he v alue of the tuning parameter λ that yields the minim um mean cross-v a lidated error, and λ 1 se refers to the largest (most regularized, o r ”simplest”) v alue of the tuning parameter λ suc h that the cross-v alidation error is within o ne standard error of the minimum error ac hiev ed b y λ min . Across the f o ur scenarios w e compare, their perfo r ma nces are v ery similar whic h indicates that the prop osed estimator is not sensitiv e to the tuning parameter selection. S44 F urther, in T able S.7, w e assess the p erformance of the prop osed metho d S-SSL for differen t linear combinations of the parameter of interest: ´ θ 1 ` 2 θ 6 (case 1) , ´ θ 1 ` θ 3 ` 2 θ 6 (case 2), ´ θ 1 ` θ 3 ` θ 5 ` θ 6 (case 3 ), and ´ θ 1 ` θ 3 ´ θ 4 ` θ 5 (case 4 ). In addition, in T a ble S.8, w e assess the p erformance of the pro p osed metho d S-SSL for differen t estimands where the v alue } v } 1 {} v } 2 ranges from 1 to ? 5. S45 T able S.2: Simulation r esults for Mo del 2 with p “ 200: Bias, SD and RMSE stand f or empirical bias, standard dev iation, and root mean squared error , respective ly , len represen ts the length of 95% confidence interv a l, and CVP is t he cov erag e pr o babilit y . The estimators D- Lasso1 (that only uses lab eled data with sample size n ) and D-Lasso2 are p θ d 1 and p θ d 2 , defined in (24). The straightforw a rd debiased estimator D -SSL is defined in (5). The prop osed dep endable semi-supervised estimator S-SSL is defined in (14). The b est p erformance is b olded during the comparison. n “ 100 n “ 300 N Bias SD RMSE len/2 CVP Bias SD R MSE len/2 CVP θ 1 D-Lasso1 -0.135 1.229 1.230 2.003 0.96 -0.059 0.420 0.422 0.8 3 7 0.97 n D-Lasso2 0.028 0.653 0.650 1.483 0.96 -0.062 0.419 0.421 0 .8 29 0.96 D-SSL -0.069 0.531 0.533 1.768 1.00 -0.086 0.379 0.387 0.7 48 0.91 S-SSL -0.049 0.60 7 0.606 1.298 0.97 -0.070 0.338 0.343 0.739 0.97 4 n D-Lasso2 0.064 0.662 0.662 1.48 6 0.97 -0.057 0.42 3 0.425 0.827 0.96 D-SSL -0.105 0.465 0.475 1.285 1.00 -0.064 0.304 0.310 0.612 0.95 S-SSL -0.013 0.561 0 .558 1.189 0.9 7 -0.094 0.339 0.350 0.691 0.93 8 n D-Lasso2 0.036 0.661 0.658 1.46 9 0.97 -0.059 0.42 5 0.427 0.831 0.96 D-SSL -0.086 0.443 0.449 1.150 0 .99 -0.061 0.302 0.306 0.572 0.96 S-SSL -0.013 0.560 0 .558 1.155 0.96 -0.095 0.336 0.347 0.67 5 0 .94 θ 3 D-Lasso1 0.195 0.917 1.384 1.60 6 0.91 0.039 0.398 0.398 0.771 0.96 n D-Lasso2 0.021 0.701 1.328 1.237 0.90 0.010 0.399 0.397 0 .772 0.95 D-SSL -0.173 0.551 1.312 1.219 0 .97 -0.076 0.325 0.333 0.493 0.95 S-SSL -0.087 0.58 3 1.295 1.069 0.91 -0 .015 0.33 3 0.332 0.6 4 4 0.95 4 n D-Lasso2 -0.031 0 .6 87 1.328 1.248 0.90 -0.004 0.401 0.399 0.775 0.95 D-SSL -0.253 0.519 1.356 0.844 0.82 -0.108 0.300 0.317 0.405 0.92 S-SSL -0.187 0.52 5 1.319 0.93 2 0.88 -0.082 0.285 0.295 0.549 0.92 8 n D-Lasso2 -0.057 0 .6 89 0.687 1.240 0.91 -0.015 0.401 0.399 0.7 82 0.96 D-SSL -0.283 0.511 0.582 0.750 0.84 -0.119 0.288 0.311 0.376 0.89 S-SSL -0.225 0.51 8 0.563 0.88 4 0.86 -0.096 0.265 0.281 0.519 0.91 θ 4 D-Lasso1 0.398 0.659 0.767 1.23 0 0.88 0.158 0.314 0.350 0.578 0.92 n D-Lasso2 0.315 0.546 0.628 1.03 3 0.88 0.108 0.314 0.330 0.577 0.92 D-SSL 0.037 0.440 0.440 1.138 1.00 0.023 0.247 0.247 0.498 0.95 S-SSL 0.310 0 .5 06 0.591 0.926 0.87 0.103 0.263 0.281 0.5 2 8 0.95 4 n D-Lasso2 0.203 0.550 0.584 1.02 6 0.93 0.075 0.313 0.321 0.580 0.94 D-SSL -0.051 0.408 0.409 0.83 5 0.97 0.010 0.206 0.205 0.411 0.96 S-SSL 0.170 0 .4 80 0.507 0.832 0.87 0.052 0.237 0.242 0.4 9 2 0.95 8 n D-Lasso2 0.135 0.539 0.553 1.01 9 0.97 0.052 0.316 0.319 0.585 0.94 D-SSL -0.093 0.400 0.408 0.750 0.93 -0.003 0.197 0.196 0.381 0.94 S-SSL 0.111 0 .4 77 0.488 0.810 0.87 0.024 0.236 0.2 36 0.482 0.94 θ 5 D-Lasso1 0.319 0.985 1.122 1.83 7 0.91 0.229 0.431 0.486 0.787 0.90 n D-Lasso2 0.213 0.712 0.740 1.23 5 0.90 0.177 0.430 0.463 0.788 0.94 D-SSL 0.044 0.594 0.593 1.180 0.94 0.069 0.315 0.321 0.520 0.88 S-SSL 0.195 0 .6 46 0.672 1.137 0.90 0.142 0.359 0.3 84 0.702 0.91 4 n D-Lasso2 0.122 0.709 0.716 1.25 3 0.90 0.129 0.429 0.446 0.791 0.94 D-SSL -0.019 0.530 0.528 0.852 0.87 0.028 0.253 0.254 0.431 0.90 S-SSL 0.061 0 .5 86 0.587 1.072 0.91 0.084 0.329 0.338 0.6 36 0.92 8 n D-Lasso2 0.072 0.711 0.711 1.24 7 0.89 0.111 0.434 0.446 0.796 0.95 D-SSL -0.048 0.508 0.508 0.758 0 .87 0.019 0.232 0.232 0.395 0.91 S-SSL 0.004 0.580 0 .5 77 1.038 0.92 0.054 0 .3 22 0.325 0.621 0.92 θ 6 D-Lasso1 0.168 0.943 0.953 1.91 2 0.98 0.057 0.254 0.259 0.492 0.96 n D-Lasso2 0.147 0.478 0.498 0.88 9 0.95 0.031 0.237 0.238 0.488 0.97 D-SSL 0.002 0.377 0.375 1.117 0.99 0.052 0 .2 17 0.222 0.450 0.97 S-SSL 0.113 0 .4 12 0.425 0.815 0.94 -0.001 0.189 0.188 0.475 0.99 4 n D-Lasso2 0.069 0.480 0.482 0.88 4 0.97 0.011 0.238 0.2 37 0.492 0.98 D-SSL -0.045 0.395 0.396 0.826 0.95 -0.014 0.187 0.186 0.398 0.97 S-SSL 0.043 0.401 0 .4 01 0.734 0.9 3 0.0 27 0.20 9 0.210 0.422 0.96 8 n D-Lasso2 0.039 0.472 0.471 0.88 1 0.96 0.000 0.236 0.235 0.497 0.98 D-SSL -0.065 0.373 0.377 0.739 0.93 -0.017 0.166 0.166 0.372 0.98 S-SSL 0.022 0.406 0 .4 04 0.709 0.9 1 0.0 13 0.20 3 0.202 0.414 0.96 S46 T able S.3: Simulation r esults for Mo del 2 with p “ 500: Bias, SD and RMSE stand f or empirical bias, standard dev iation, and root mean squared error , respective ly , len represen ts the length of 95% confidence interv a l, and CVP is t he cov erag e pr o babilit y . The estimators D- Lasso1 (that only uses lab eled data with sample size n ) and D-Lasso2 are p θ d 1 and p θ d 2 , defined in (24). The straightforw a rd debiased estimator D -SSL is defined in (5). The prop osed dep endable semi-supervised estimator S-SSL is defined in (14). The b est p erformance is b olded during the comparison. n “ 100 n “ 300 N Bias SD RMSE len/2 CVP Bias SD R MSE len/2 CVP θ 1 D-Lasso1 0.104 0.885 0.887 1.555 0.97 -0.14 6 0.448 0 .469 0.842 0.93 n D-Lasso2 -0.162 0.789 0.801 1.512 0.94 -0.149 0.441 0.463 0 .8 37 0.94 D-SSL -0.292 0.579 0.646 3.043 1.00 -0.16 2 0.349 0.383 0 .923 0.96 S-SSL -0.200 0.59 9 0.629 1.229 0.91 -0.125 0.387 0.405 0.740 0.92 4 n D-Lasso2 -0.193 0.749 0.770 1.462 0.91 -0.15 2 0.448 0 .471 0.832 0.93 D-SSL -0.319 0.54 4 0.628 1.706 0.99 -0.1 5 1 0.319 0.351 0 .680 0.96 S-SSL -0.197 0.540 0.572 1.120 0.93 -0.119 0.350 0.368 0.679 0.91 8 n D-Lasso2 -0.181 0.758 0.776 1.467 0.90 -0.14 7 0.448 0 .469 0.835 0.94 D-SSL -0.304 0.54 2 0.620 1.349 0.96 - 0.134 0.297 0.325 0.610 0.96 S-SSL -0.196 0.536 0.568 1.084 0 .91 -0.105 0.339 0.353 0.661 0.92 θ 3 D-Lasso1 0.177 0.689 1.243 1.38 5 0.96 0.11 6 0.332 0.350 0.808 0.98 n D-Lasso2 0.137 0.601 0.613 1.34 9 0.94 0.08 4 0.335 0.344 0.805 0.98 D-SSL -0.125 0.553 0.565 2.383 1.00 -0.008 0.277 0.2 75 0.645 0.97 S-SSL -0.046 0.558 0.557 1.120 0.95 0.046 0.268 0.270 0 .673 0.97 4 n D-Lasso2 0.076 0.630 0.631 1.321 0.94 0.054 0.339 0.342 0 .8 10 0.98 D-SSL -0.239 0.52 6 0.575 1.181 0.95 - 0.046 0.2 71 0.274 0.454 0.92 S-SSL -0.126 0.455 0.470 0.950 0 .91 -0.001 0.266 0.264 0.568 0.94 8 n D-Lasso2 0.051 0.644 0.643 1.336 0.93 0.049 0.341 0.343 0.813 0.98 D-SSL -0.245 0.51 6 0.569 0.898 0.85 -0.0 5 5 0.263 0.267 0.403 0.85 S-SSL -0.177 0.447 0.478 0.897 0 .87 -0.029 0.258 0.259 0.534 0.94 θ 4 D-Lasso1 0.550 0.552 0.777 1.07 9 0.87 0.18 2 0.304 0.353 0.572 0.87 n D-Lasso2 0.388 0.596 0.709 1.04 9 0.90 0.123 0.295 0.318 0.570 0.95 D-SSL 0.089 0.453 0.460 2.006 1.00 0.029 0.227 0.228 0.599 0.99 S-SSL 0.360 0 .5 41 0.647 0.917 0.85 0.126 0.260 0.288 0.520 0.88 4 n D-Lasso2 0.278 0.600 0.659 1.02 5 0.89 0.06 9 0.296 0.302 0.574 0.95 D-SSL 0.010 0.398 0.396 1.096 1.00 -0.001 0.217 0.216 0.450 0.9 7 S-SSL 0.209 0 .5 12 0.551 0.848 0.88 0.053 0.254 0.258 0.491 0.91 8 n D-Lasso2 0.249 0.616 0.661 1.03 2 0.90 0.044 0.298 0.300 0.577 0.95 D-SSL -0.009 0.398 0.396 0.87 6 1.00 -0.007 0.217 0.216 0.403 0.94 S-SSL 0.158 0 .4 91 0.513 0.838 0.90 0.02 8 0.250 0.251 0.481 0.92 θ 5 D-Lasso1 0.605 0.696 0.919 1.30 6 0.84 0.17 7 0.419 0.453 0.777 0.91 n D-Lasso2 0.307 0.785 0.839 1.30 2 0.89 0.12 8 0.417 0.434 0.779 0.92 D-SSL 0.098 0.638 0.642 2.289 1.00 0.017 0.330 0.329 0.611 0.9 1 S-SSL 0.291 0 .7 00 0.755 1.160 0.85 0.106 0.356 0.370 0.695 0.94 4 n D-Lasso2 0.192 0.772 0.791 1.28 8 0.87 0.07 7 0.426 0.430 0.784 0.94 D-SSL 0.026 0.545 0.543 1.147 0.97 0.004 0.284 0.283 0.459 0.8 7 S-SSL 0.102 0 .6 72 0.677 1.073 0.86 0.026 0.332 0.331 0.644 0.93 8 n D-Lasso2 0.139 0.781 0.789 1.30 5 0.88 0.04 4 0.428 0.428 0.789 0.94 D-SSL -0.020 0.530 0.528 0.890 0.90 -0.017 0.265 0.264 0.413 0.93 S-SSL 0.029 0 .6 57 0.655 1.049 0.85 0.002 0.325 0.32 4 0.626 0.94 θ 6 D-Lasso1 0.177 0.450 0.482 0.90 9 0.96 0.13 0 0.232 0.265 0.505 0.93 n D-Lasso2 0.125 0.497 0.510 0.92 9 0.94 0.112 0.225 0.251 0.504 0.96 D-SSL -0.008 0.404 0.402 1.920 1.00 0.028 0.197 0.198 0.586 1.00 S-SSL 0.124 0.387 0.404 0.836 0.93 0.103 0.207 0.230 0.458 0.94 4 n D-Lasso2 0.072 0.479 0.482 0.90 2 0.93 0.08 2 0.224 0.238 0.504 0.95 D-SSL -0.049 0.396 0.39 7 1.085 1.00 0.014 0.172 0.171 0.439 0.99 S-SSL 0.052 0.395 0.396 0.766 0.96 0.065 0.191 0.201 0.423 0.95 8 n D-Lasso2 0.047 0.495 0.495 0.91 2 0.91 0.06 7 0.232 0.240 0.508 0.95 D-SSL -0.059 0.388 0.391 0.865 0.98 0.005 0.171 0.170 0.396 0.98 S-SSL 0.013 0.390 0.388 0.741 0.93 0 .046 0.1 8 3 0.188 0.413 0.95 S47 T able S.4: Simulation results for Mo del 2: computationa l time ( in seconds) of one sim ulation replication. The estimates of B a nd Ω are implemen ted in para llel, with eac h utilizing 11 cores. p “ 200 p “ 500 n “ 100 n “ 300 n “ 100 n “ 300 D-Lasso1 3.897 6.563 10.3 60 28.99 4 N n D-Lasso2 8.020 5.201 19.0 85 137.224 D-SSL 7.939 5.167 18.3 26 136.795 S-SSL 9.141 13.526 22.0 4 0 145.803 4 n D-Lasso2 5.290 6.533 66.3 12 63.04 6 D-SSL 5.255 6.706 65.7 46 63.37 3 S-SSL 6.425 14.975 69.2 9 8 71.910 8 n D-Lasso2 5.558 8.724 58.9 87 115.264 D-SSL 5.601 9.358 58.7 36 117.025 S-SSL 6.727 17.474 62.0 6 6 124.901 T able S.5: Sim ulation results for Mo del 2 with p “ 200 and n “ 100: Bias, SD and RMSE stand for empirical bias, standard deviation, and r o ot mean squared error, resp ectiv ely , len represen ts the length of 95% confidence interv a l, and CVP is the co v erage pro ba bilit y . The p erformance comparison of the pr o p osed dep endable semi-sup ervised estimator S-SSL with differen t metho ds to estimate p f p¨q . h uang randomforest nnet N Bias SD RMSE len/2 CVP Bias SD RMSE len/2 CVP Bias SD RMSE len/2 CVP θ 1 n 0.022 0.655 0.65 6 1.282 0.93 -0.068 0.635 0.639 1.264 0.92 - 0.071 0.749 0.752 1.356 0.92 4 n -0.005 0.625 0.625 1.162 0 .90 -0.164 0.594 0.616 1.128 0 .87 -0.142 0.724 0.737 1.293 0.90 8 n -0.020 0.610 0.612 1.127 0 .90 -0.183 0.586 0.613 1.086 0 .86 -0.153 0.731 2.210 1.275 0.90 θ 3 n 0.113 0.472 0.48 5 1.135 0.98 -0.179 0.469 0.502 1.138 0.91 0.075 0.574 0.578 1.276 0.95 4 n -0.006 0.435 0.436 0.979 0 .95 -0.158 0.420 0.448 0.987 0 .80 -0.032 0.572 0.572 1.243 0.93 8 n -0.033 0.429 0.430 0.906 0 .94 -0.245 0.408 0.476 0.923 0 .71 -0.075 0.564 0.569 1.209 0.93 θ 4 n 0.311 0.568 0.64 7 0.911 0.84 0.143 0 .564 0.581 0.913 0.90 0.185 0.610 0.637 0 .983 0.90 4 n 0.156 0.513 0.536 0.825 0.89 -0.0 60 0.542 0.545 0.829 0.82 -0.0 16 0.604 0.604 0.95 0 0.88 8 n 0.106 0.507 0.518 0.808 0.89 -0.1 16 0.551 0.563 0.813 0.82 -0.0 71 0.612 0.616 0.95 2 0.85 θ 5 n 0.274 0.625 0.68 2 1.156 0.88 0.065 0 .633 0.636 1.155 0.90 0.103 0.686 0.693 1 .246 0.91 4 n 0.113 0.587 0.598 1.053 0.90 -0.1 91 0.625 0.653 1.052 0.86 -0.1 43 0.685 0.699 1.20 6 0.91 8 n 0.072 0.581 0.585 1.024 0.92 -0.2 55 0.627 0.676 1.024 0.82 -0.1 94 0.694 0.720 1.19 9 0.88 θ 6 n 0.071 0.411 0.41 7 0.826 0.98 -0.087 0.413 0.422 0.822 0.95 - 0.012 0.468 0.468 0.873 0.95 4 n -0.018 0.386 0.388 0.747 0 .96 -0.245 0.403 0.471 0.740 0 .88 -0.121 0.462 0.477 0.832 0.92 8 n -0.048 0.379 0.382 0.723 0 .94 -0.294 0.407 0.502 0.716 0 .83 -0.143 0.459 0.480 0.821 0.91 S48 T able S.6: Sim ulation results for Mo del 2 with p “ 200 and n “ 100: Bias, SD and RMSE stand for empirical bias, standard deviation, and r o ot mean squared error, resp ectiv ely , len represen ts the length of 95% confidence interv a l, and CVP is the co v erage pro ba bilit y . The p erformance comparison of the pr o p osed dep endable semi-sup ervised estimator S-SSL with differen t criteria of c ho osing the tuning para meters p λ Ω , λ B q in estimating p Ω , B q . p λ min , λ min q p λ 1 se , λ min q p λ min , λ 1 se q p λ 1 se , λ 1 se q N Bias SD RMSE len/2 CVP Bias SD RMSE len/2 CVP Bias SD RMSE len/2 CVP Bias SD RMSE len/2 CVP θ 1 n -0.268 0.609 0.663 1.212 0.92 -0.27 4 0.612 0.667 1.239 0.92 -0.224 0.681 0.714 1.302 0 .9 3 -0.232 0.684 0.719 1.332 0.92 4 n -0.217 0.5 62 0.600 1.138 0.93 -0.218 0.566 0.604 1.144 0.93 -0.179 0.672 0.692 1.301 0.9 2 -0.181 0.679 0.699 1.308 0.92 8 n -0.214 0.5 34 0.573 1.094 0.92 -0.220 0.538 0.579 1.098 0.92 -0.172 0.647 0.666 1.279 0.9 3 -0.179 0.652 0.673 1.284 0.93 θ 3 n 0.006 0.48 0 0 .478 1.070 0.9 6 0.11 8 0 .491 0.502 1.076 0.98 0.023 0.520 0.518 1.161 0 .98 0.141 0.538 0.553 1.170 0 .9 6 4 n -0.121 0.4 40 0.454 0.906 0.92 -0.018 0.450 0.448 0.909 0.93 -0.087 0.498 0.503 1.069 0.9 2 0.022 0.512 0.510 1.078 0.94 8 n -0.168 0.4 45 0.473 0.852 0.89 -0.066 0.445 0.447 0.854 0.89 -0.120 0.495 0.507 1.045 0.9 1 -0.012 0.499 0.496 1.052 0.94 θ 4 n 0.281 0.49 0 0 .562 0.916 0.8 6 0.49 8 0 .503 0.706 0.910 0.77 0.305 0.522 0.602 0.982 0 .89 0.529 0.531 0.748 0.980 0 .8 1 4 n 0.17 6 0.464 0.494 0.844 0.84 0.358 0.472 0.591 0.83 5 0.80 0.213 0.521 0.561 0.9 5 1 0.91 0.408 0.533 0.669 0.94 8 0.83 8 n 0.11 5 0.452 0.464 0.823 0.85 0.299 0.456 0.544 0.80 4 0.84 0.157 0.513 0.535 0.9 4 5 0.90 0.355 0.520 0.627 0.93 0 0.87 θ 5 n 0.101 0.66 4 0 .668 1.144 0.9 0 0.32 2 0 .689 0.757 1.124 0.88 0.151 0.734 0.746 1.233 0 .91 0.376 0.758 0.843 1.216 0 .9 0 4 n -0.040 0.5 98 0.597 1.056 0.87 0 .162 0.618 0.636 1 .039 0.88 0.0 29 0.705 0.707 1 .2 08 0.90 0.2 3 6 0 .728 0.762 1.195 0.8 6 8 n -0.092 0.5 85 0.589 1.035 0.85 0 .095 0.600 0.604 1 .011 0.88 -0.020 0.696 0.698 1.210 0.88 0.173 0.715 0.7 32 1.187 0.89 θ 6 n 0.172 0.37 0 0 .406 0.803 0.9 5 0.28 2 0 .369 0.463 0.809 0.93 0.194 0.400 0.443 0.863 0 .98 0.311 0.391 0.498 0.873 0 .9 5 4 n 0.07 8 0.368 0.375 0.731 0.93 0.179 0.355 0.396 0.72 3 0.91 0.101 0.411 0.421 0.8 3 6 0.96 0.212 0.396 0.447 0.83 1 0.95 8 n 0.04 6 0.355 0.356 0.711 0.95 0.145 0.348 0.375 0.69 6 0.92 0.073 0.404 0.408 0.8 3 1 0.96 0.180 0.399 0.436 0.81 7 0.96 T able S.7: Sim ulation results for Mo del 2 with p “ 200 and n “ 100: Bias, SD and RMSE stand for empirical bias, standard deviation, and r o ot mean squared error, resp ectiv ely , len represen ts the length of 95% confidence interv a l, and CVP is the co v erage pro ba bilit y . The p erformance comparison of the pr o p osed dep endable semi-sup ervised estimator S-SSL with differen t linear com binations v : Case 1 with v “ p´ 1 , 0 , 0 , 0 , 0 , 2 , 0 , ¨ ¨ ¨ , 0 q T , Case 2 with v “ p´ 1 , 0 , 1 , 0 , 0 , 2 , 0 , ¨ ¨ ¨ , 0 q T , Case 3 with v “ p´ 1 , 0 , 1 , 0 , 1 , 1 , 0 , ¨ ¨ ¨ , 0 q T , and Case 4 with v “ p´ 1 , 0 , 1 , ´ 1 , 1 , 0 , 0 , ¨ ¨ ¨ , 0 q T . N Bias SD RMSE len/2 CV P Case 1 n 0.105 0.956 0.962 2.02 0 0.97 4 n -0.032 0.915 0.9 1 6 1.8 2 0 0.9 6 8 n -0.081 0.892 0.8 9 5 1.7 7 3 0.9 7 Case 2 n 0.217 1.158 1.173 2.35 5 0.97 4 n -0.040 1.094 1.0 9 5 2.0 7 4 0.9 6 8 n -0.114 1.060 1.0 6 6 1.9 8 6 0.9 5 Case 3 n 0.426 0.962 1.048 2.26 1 0.96 4 n 0.091 0.910 0.914 1.937 0.95 8 n 0.005 0.864 0.864 1.830 0.93 Case 4 n 0.046 1.052 1.053 2.10 4 0.94 4 n -0.050 1.008 1.0 0 9 1.9 7 6 0.9 3 8 n -0.051 0.961 0.9 6 2 1.9 3 8 0.9 5 S49 T able S.8: Sim ulation results for Mo del 2 with p “ 200 and n “ 100: Bias, SD and RMSE stand for empirical bias, standard deviation, and ro ot mean squared error, resp ectiv ely , len represen ts the length of 95 % confidence in terv al, and CVP is the cov erage probability . The p erformance comparison of the pro p osed dep endable semi-sup ervised estimator S-SSL with differen t v alues o f } v } 1 {} v } 2 : Case 1 with v “ p´ 1 , 0 , 0 , 0 , 0 , 0 , 0 , ¨ ¨ ¨ , 0 q T , Case 2 with v “ p´ 1 , 0 , 1 , 0 , 0 , 0 , 0 , ¨ ¨ ¨ , 0 q T , Case 3 with v “ p´ 1 , 0 , 1 , ´ 1 , 0 , 0 , 0 , ¨ ¨ ¨ , 0 q T , Case 4 with v “ p´ 1 , 0 , 1 , ´ 1 , 1 , 0 , 0 , ¨ ¨ ¨ , 0 q T , and Case 5 with v “ p´ 1 , 0 , 1 , ´ 1 , 1 , ´ 1 , 0 , ¨ ¨ ¨ , 0 q T . N Bias SD RMSE len/2 CVP Case 1 n -0.026 0 .654 0.651 1.279 0.930 4 n 0.001 0.623 0.620 1.161 0.9 00 8 n 0.017 0.612 0.609 1.127 0.9 00 Case 2 n 0.086 0.769 0.769 1.6 32 0 .9 70 4 n -0.007 0.728 0.724 1.450 0.950 8 n -0.016 0.703 0.700 1.375 0.930 Case 3 n -0.228 0 .858 0.883 1.778 0.980 4 n -0.164 0.810 0.822 1.651 0.940 8 n -0.122 0.787 0.792 1.599 0.920 Case 4 n 0.046 1.052 1.048 2.1 04 0 .9 40 4 n -0.050 1.008 1.004 1.976 0.930 8 n -0.051 0.961 0.958 1.938 0.950 Case 5 n -0.020 1 .140 1.134 2.199 0.930 4 n -0.034 1.089 1.084 2.100 0.940 8 n -0.002 1.051 1.045 2.073 0.940 S50
Original Paper
Loading high-quality paper...
Comments & Academic Discussion
Loading comments...
Leave a Comment