Efficient Detection of Bad Benchmark Items with Novel Scalability Coefficients
The validity of assessments, from large-scale AI benchmarks to human classrooms, depends on the quality of individual items, yet modern evaluation instruments often contain thousands of items with minimal psychometric vetting. We introduce a new fami…
Authors: Michael Hardy, Joshua Gilbert, Benjamin Domingue
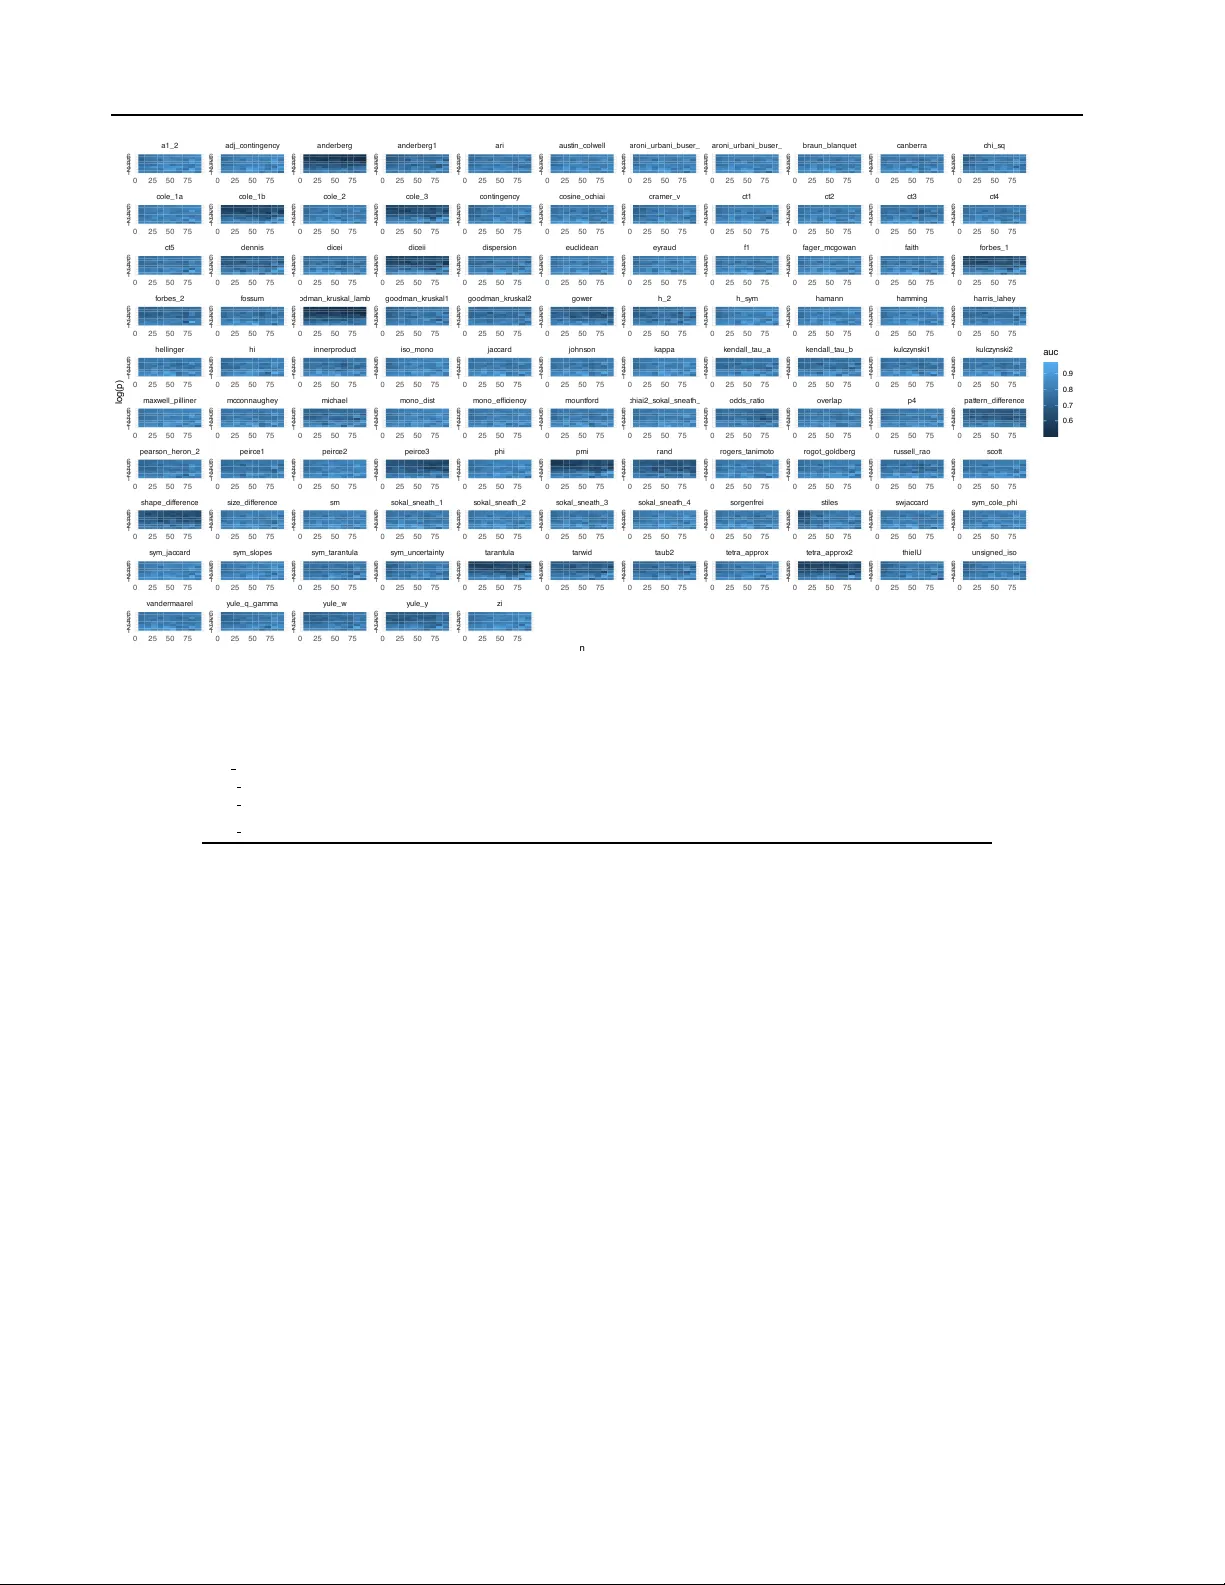
Efficient Detection of Bad Benchmark Items with Nov el Scalability Coefficients Michael Hardy * 1 Joshua Gilbert 2 Benjamin Domingue 1 Abstract The v alidity of assessments, from lar ge-scale AI benchmarks to human classrooms, depends on the quality of individual items, yet modern e v al- uation instruments often contain thousands of items with minimal psychometric vetting. W e introduce a new family of nonparametric scal- ability coef ficients based on interitem isotonic regression for efficiently detecting globally bad items (e.g., miske yed, ambiguously w orded, or construct-misaligned). The central contribution is the signed isotonic R 2 , which measures the max- imal proportion of variance in one item explain- able by a monotone function of another while pre- serving the direction of association via K endall’ s τ . Aggregating these pairwise coef ficients yields item-lev el scores that sharply separate problem- atic items from acceptable ones without assum- ing linearity or committing to a parametric item response model. W e pro ve that the signed iso- tonic R 2 is extremal among monotone predictors (it extracts the strongest possible monotone sig- nal between any two items) and sho w that this optimality property translates directly into practi- cal screening po wer . Across three AI benchmark datasets (HS Math, GSM8K, MMLU) and two human assessment datasets, the signed isotonic R 2 consistently achieves top-tier A UC for rank- ing bad items above good ones, outperforming or matching a comprehensi ve battery of classical test theory , item response theory , and dimensionality- based diagnostics. Crucially , the method remains robust under the small-n/large-p conditions typi- cal of AI e v aluation, requires only biv ariate mono- tone fits computable in seconds, and handles mixed item types (binary , ordinal, continuous) without modification. It is a lightweight, model- agnostic filter that can materially reduce the re- viewer ef fort needed to find fla wed items in mod- ern large-scale e v aluation re gimes. 1 Stanford Univ ersity , CA, United States 2 Harvard Univer - sity , MA, United States. Correspondence to: Michael Hardy < hardym[ ατ ]stanford[ · ]edu > . Pr eprint. Mar ch 27, 2026. 1. Introduction The validity of any assessment–from classroom exams to large-scale AI benchmarks–depends on the quality of its indivi dual items. Even a small number of flawed items (e.g., incorrect answer keys, scoring bugs, ambiguity , construct drift) can distort scores, undermine rankings, and lead to in- val id conclusions (Casabianca, 2025; Zhang et al., 2025). In high-stakes human testing, item de velopment is typically ac- companied by extensi ve qualitati v e revie w and quantitati ve pilot analyses, and problematic items are usually remov ed before operational deployment. By contrast, many modern AI benchmarks are assembled at scale (often synthetically), frequently rely on automated grading for unstructured re- sponses, and may contain thousands of items with minimal psychometric vetting. As a result, benchmark scores can be sensitive to a small set of bad items, and the burden of val idation is shifted to do wnstream users (Casabianca, 2025; Zhang et al., 2025; T ruong et al., 2025; Reuel et al., 2024; Salaudeen et al., 2025). This paper focuses on global bad-item detection : efficiently prioritizing items for human revie w when some items are flawed in ways that degrade measurement ov erall (as distinct from differential item functioning, which concerns group- specific item beha vior). The core problem is practical: giv en a response matrix with many items, how can we rank items so that the worst ones are found quickly? W e propose a new family of nonparametric scalability co- efficients based on interitem isotonic r e gr ession . The main contribution is a signed coefficient deri ved from the isotonic- regression coef ficient of determination, which we call the signed isotonic R 2 . F or a response matrix Y ∈ R n × p and for each ordered item pair ( i, j ) , we fit the best monotone relationship between item i and item j and measure the fraction of v ariance in Y j explained by a monotone function of Y i . Aggregating these pairwise associations yields item- lev el scores that sharply separate globally bad items from acceptable ones. Empirically , these coefficients improve practical detection ef ficiency (measured via A UC for rank- ing bad items above good ones) and remain computationally scalable for large benchmark re gimes. 1 Efficient Detection of Bad Items 2. Background and Moti vation 2.1. What counts as a “bad item”? An item is “bad” when it systematically breaks the intended measurement logic of the instrument. Across human assess- ments and AI benchmarks, we consider four common global failure modes: 1. Bad key : the labeled correct answer is wrong. 2. Bad grading : the scoring procedure is incorrect or inconsistently applied. 3. Ambiguity : multiple defensible answers or unclear prompt/specification. 4. Construct misalignment : the item elicits skills out- side the intended construct (e.g., format quirks, spuri- ous cues, irrelev ant kno wledge). These failure modes typically reduce an item’ s coherence with the rest of the test, even when the ov erall instrument is intended to measure a dominant latent trait. Our aim is to detect such globally problematic items; we do not address fairness questions or group-conditional anomalies (e.g., DIF 1 ) in this work. 2.2. Existing tools are often inefficient in lar ge regimes A wide range of item-quality indices exist across CTT , IR T , nonparametric scaling (Zijlmans et al., 2018a;b). These indices differ along three practical ax es: Dynamic: “bad r elativ e to what?” Common compar- isons include • Interitem (item vs. item): correlations, agreement, mutual information, pairwise scalability . • Item–rest (item vs. total/others): corrected item–total correlation, item-rest regression. • Item-drop (change in test statistic when removed): ∆ α , ∆ reliability . • Parameter -based (item as a member of a model): IR T discrimination/fit, factor loadings. Baseline: “bad with respect to what property?” Dif- ferent statistics implicitly target dif ferent notions of misfit: linear association, mean differences, v ariance explained, local independence violations, or parameter inconsistency . 1 Items that demonstrate DIF may also be flagged by globally problematic items. Instead of a group differential item functioning, for this study , the reference group is the entire population. Assumptions: “bad under what model?” Many indices are ef ficient only when their assumptions hold (e.g., linear- ity , parametric ICC forms, well-behav ed latent distributions, sufficient sample size). In AI benchmarks, these assump- tions are often strained: item types are mixed (binary/or- dinal/continuous scores), grading noise may be structured, and data may be sparse or highly imbalanced. Moreov er , some widely used indices are dir ection-blind (they empha- size magnitude but not sign) or collapse nonlinear monotone effects into weak er linear proxies. 2.3. Item “behavior” as interitem social compatibility A useful intuition is to treat items as a team: good items “get along” with other items that measure the same construct. If a test is approximately unidimensional responses to any two items should be positiv ely and monotonically related (up to noise and local dependence; (Sijtsma, 2009; Re velle & Condon, 2025; Mair & Leeuw, 2015; T en Ber ge & So ˇ can, 2004)). Bad items often exhibit one or more of: (i) weak association with most other items, (ii) non-monotone beha v- ior (e.g., middle-ability respondents outperform high-ability respondents due to ambiguity or grading), (iii) in versions (negati v e association) consistent with miske ying or system- atic scoring rev ersal. This motiv ates interitem measures of fit: quantify how well each item participates in the network of expected monotone dependencies. 2.4. Desiderata for scalable bad-item detection W e seek item-le vel indices that are: 1. Practically efficient : prioritize bad items early in a revie w queue. 2. Computationally efficient : feasible for lar ge n (re- sponses) and very lar ge p (items). 3. Model-agnostic : a void reliance on strict parametric IR T forms. 4. Monotonicity-aware : exploit the ke y qualitati ve con- straint of unidimensional measurement. 5. T ype-flexible : handle mixed outcome types and asym- metric relationships. 2.5. Why isotonic r egression? Isotonic regression pro vides a principled way to e xtract max- imal monotone signal between v ariables without committing to a parametric functional form. For item analysis, this is attractiv e because the key expectation under a dominant latent trait is monotonic dependence, not necessarily linear 2 Efficient Detection of Bad Items dependence. By measuring how much of an item’ s variabil- ity can be explained by a monotone function of another item, we obtain a natural nonparametric analogue of “scalability” that (i) directly targets the monotonicity assumption and (ii) can preserve directionality (through a signed association), enabling sharper detection of in v ersions such as miskeys. If a set of items measures a single latent trait, then perfor- mance on any two items should be positiv ely and monotoni- cally related. The strength of this monotonic relationship, aggregated across all item pairs, becomes a po werful indi- cator of item fit. The primary contribution is a new family of nonparametric, nonlinear scalability coefficients b uilt by maximizing the information gained by assuming monotonic- ity . T aking inspiration from Loe vinger’ s H (loe, 1947), 2 Mokken scaling (W ind, 2017; Mokken, 2011; Sijtsma & Molenaar, 2002; van der Ark, 2007), and advances in iso- tonic regression in IR T (Lee, 2002; 2007; Lee et al., 2009; Luzardo & Rodr ´ ıguez, 2015; Y u, 2022), this approach re- frames item fit as a function of its consistent, monotonic behavior with all other items on the scale. 3. Methods 3.1. Notation and setup Let Y ∈ R n × p be the response matrix with respondents r ∈ { 1 , . . . , n } and items i ∈ { 1 , . . . , p } . The column vector for item i is y i ∈ R n . Responses may be binary , ordinal, or continuous; we assume higher values reflect greater success on the construct (after any required recoding). Our goal is to compute, for each item i , a scalar badness score (or con v ersely a fit/scalability scor e ) used to rank items for revie w . 3.2. Interitem isotonic regr ession Fix an ordered pair of distinct items ( i, j ) . W e model y j as a monotone function of y i : y rj ≈ f i → j ( y ri ) , f i → j ∈ F ↑ , (1) where F ↑ is the set of non-decreasing functions on the ob- served support of y i . The isotonic regression estimator is ˆ f i → j ∈ arg min f ∈F ↑ n X r =1 ( y rj − f ( y ri )) 2 , (2) computed ef ficiently using the Pool Adjacent V iolators Al- gorithm (P A V A; (Busing, 2022)) after sorting observ ations by y i (with standard handling of ties). This yields fitted values ˆ y ( i → j ) rj = ˆ f i → j ( y ri ) . Asymmetry and mixed item types. Because the regres- sion is directional, the strength of i → j need not equal 2 The initial inspiration for these proposed solutions. j → i , which is useful when item types dif fer (e.g., a ordi- nal partial-credit item may monotonically explain a binary item dif ferently than vice v ersa). This asymmetry is a fea- ture: it permits detection based on predictable directional structure rather than forcing symmetry . 3.3. Signed isotonic R 2 as a pairwise scalability coefficient W e quantify the monotone explanatory power of item i for item j using an isotonic analogue of the coefficient of determination: R 2 i → j = 1 − P n r =1 y rj − ˆ y ( i → j ) rj 2 P n r =1 ( y rj − ¯ y j ) 2 , ¯ y j = 1 n n X r =1 y rj . (3) T o preserve directionality (inv ersions) we attach a sign based on the global direction of association between y i and y j based on Kendall’ s τ . Let s ij = sign( τ ( y i , y j )) , (4) with the con v ention that s ij = 0 if the correlation is nu- merically 0 or undefined (e.g., zero v ariance). The signed isotonic coefficient is M i → j = s ij R 2 i → j . (5) Intuitiv ely , M i → j estimates the pr oportion of monotone variance explained , while preserving whether the relation- ship aligns with the expected positi ve direction. Bad ke ys and systematic grading rev ersals tend to induce negati v e or unusually small signed values across man y pairs. 3.4. A formal inter pretation: optimality among monotone predictors The empirical adv antage of isotonic R 2 is explained by an optimization property: it measures the maximal proportion of variance e xplainable by any monotone transformation. Proposition 3.1 (Maximal monotone explained v ariance) . F ix item pair ( i, j ) and consider predictors of Y j of the form f ( Y i ) wher e f is non-decr easing. Let ˆ f be the isotonic r e gr ession solution as defined in Eq. 2. Then for any non- decr easing g , n X r =1 ( y rj − ˆ f ( y ri )) 2 ≤ n X r =1 ( y rj − g ( y ri )) 2 , and ther efor e R 2 i → j computed fr om ˆ f is the lar gest ac hie v- able R 2 among monotone pr edictors. 3 Efficient Detection of Bad Items 3.5. From pairwise coefficients to item-le vel badness scores For each focal item i , we aggregate its pairwise signed isotonic relationships with all other items: Fit( i ) = 1 p − 1 X j = i M i → j . (6) W e then rank items by increasing Fit( i ) (lower implies more suspicious). V ariants we consider in ablations (not required for using the method) include: (i) symmetrized aggregation 1 2 ( M i → j + M j → i ) , (ii) robust aggre gation using trimmed means/medians to reduce sensiti vity to local dependence clusters, (iii) nonnegati v e aggregation using |M i → j | when direction is known to be unreliable. 3.6. Computational considerations For each ordered pair ( i, j ) , isotonic regression reduces to sorting by y i and a linear-time P A V A pass. In practice, when many items are binary or low-cardinality , sorting can be implemented via counting/b ucketing, making pairwise fits fast. The full pairwise matrix is O ( p 2 ) fits; we therefore use two scalable strategies depending on re gime: • All-pairs for moderate p (typical in human assess- ments). • Subsampled neighbors for very large p (typical in AI benchmarks): compute Fit( i ) using a fixed-size set of comparison items per i (random, stratified by difficulty , or chosen via a computationally cheap pre-screen such as correlation). This preserves ranking quality while reducing compute to O ( pK ) fits for K ≪ p . 3.7. Evaluation pr otocol: efficiency as ranking performance W e e valuate item-detection efficiency by treating each met- ric as a scoring function that ranks items from most to least suspicious, then computing the area under the ROC curve (A UC) for classifying known bad items. Formally , for item scores S ( i ) where larger indicates “more bad” (we use S ( i ) = − Fit( i ) ), A UC equals Pr( S ( i bad ) > S ( i good )) , (7) the probability that a randomly chosen bad item is ranked abov e a randomly chosen good item. This directly reflects expected revie wer time sa ved: higher A UC concentrates bad items earlier in the queue. Thus we are e v aluating bad- item detection as a ranking problem: a statistic assigns each item i a score S ( i ) , and we sort items from most suspicious to least suspicious. Ground-truth labels L ( i ) ∈ { 0 , 1 } indicate whether an item is globally bad (Sec. 2; not DIF). Performance is measured by ho w ef fecti vely the ranking prioritizes bad items for revie w . 3.8. Baselines T o contextualize gains, we compare signed isotonic R 2 against a broad suite of established CTT/IR T and association-based indices, cov ering: (i) interitem associ- ation (e.g., linear and information-theoretic dependence), (ii) item-rest statistics (e.g., corrected item-total correlation and monotone dependence), (iii) parameter-based proxies (e.g., discrimination or explained-variance loadings), (iv) item-drop deltas (e.g., reliability changes). All methods produce an item ranking, ev aluated under the same A UC protocol. 3.9. Scope Our methods target global item misfit detectable via dis- rupted monotone coherence with the rest of a scale. W e do not attempt to diagnose the causal source of misfit (ke y- ing vs. ambiguity vs. construct drift), nor do we conduct group-conditional DIF analyses; rather , we provide a compu- tationally ef ficient front-end filter that materially impro ves the rate at which human re vie wers find problematic items in both traditional assessments and large AI benchmarks. 4. Empirical A pproach 4.1. Datasets and labels W e use both human assessment data and AI benchmark data. Human datasets reflect con ventional test de velopment pipelines where few bad items survive, but when they do, they are consequential. AI benchmark datasets represent large item banks assembled without comparable v alidation pipelines; these are the main moti v ation for scalable detec- tion tools. Each dataset includes an e xternally curated list of globally bad items (bad ke y , bad grading, ambiguity , construct mis- alignment). For experiments in volving bootstraps, we en- force a minimum number of bad items in each resample so that A UC is well-defined and not dominated by degenerate cases. 4 . 1 . 1 . A P P L I C A T I O N D O M A I N : A I B E N C H M A R K A S S E S S M E N T The emergence of lar ge language models (LLMs) has cre- ated unprecedented challenges for psychometric ev aluation. AI benchmarks often lack human comparison data, hav- ing been designed specifically for machine e v aluation. As model performance approaches saturation on existing bench- marks, the identification of problematic items becomes cru- cial—differences of one or two poor items can determine rankings among state-of-the-art models. 4 Efficient Detection of Bad Items a l p h a _ d r o p c n e g c m e a n g _ 1 5 Z i H i a 1 _ 2 a 1 _ 3 z _ o u t fi t _ 3 a d j _ d e p t h t a u i s o 0 1 0 0 2 0 0 3 0 0 4 0 0 5 0 0 MML U 5 B a d I t e m D e t e c t i o n Me t r i c s D a t a : M M L U 5 L i t e F igur e 1. Examples of Differences in Item Detection Efficiencies based on T echnique :Bad Item detection as ordered by each item-fit metric. iso = M iso ; tau = M τ ; adj depth = Isolation F orest T ree Depth (anomaly detection), z outfit 3 = standardized absolute 3PL outfit statistic, a1 3 and a1 2 = discrimination parameter for 3PL and 2PL, respectively; Hi = H i ; Zi = Z i , g 15 = loading on the general factor of a 15-factor estimation of McDonald’ s ω ; cmean = Mean inter-item tetrachoric correlation; cneg = proportion of inter -item tetrachoric correlations ¡ 0; alpha drop = benchmark reliability (Cronbach’ s α ) with item remov ed 4 . 1 . 2 . U N I D I M E N S I O N A L I T Y A S S U M P T I O N I N A I A S S E S S M E N T While human cogniti ve assessment typically rev eals multi- dimensional ability structures, AI models present a unique case. Contemporary LLMs share a fundamental training ob- jectiv e: autoregression of Internet text. Despite subsequent modifications through instruction tuning and reinforcement learning from human feedback (RLHF), we hypothesize that this primary objectiv e dominates performance across div erse benchmarks (McCoy et al., 2023). This suggests that for AI ev aluation contexts, a unidimen- sional latent ability model may be appropriate, or alterna- tiv ely , that the autoregressi v e ability component substan- tially outweighs other potential factors. W e v alidate this assumption using the MMLU (Massiv e Multitask Language Understanding) dataset, which spans fiv e distinct subject areas. 4 . 1 . 3 . A I A N D B E N C H M A R K S A N D G RO U N D T RU T H W e employed multiple datasets with independently validated item quality assessments, allowing for objecti v e ev aluation of metric performance. Each dataset contained items pre- viously identified as problematic through e xpert re vie w or statistical flagging procedures. The responses come from Holistic Evaluations of Language Models (HELM) datasets (Liang et al., 2023). 3 From HELM, we utilize the model responses and combined bad item labels of the HS Math, GSM8K, and HELM-Lite 5-subject MMLU Benchmark from the (T ruong et al., 2025; V endrow et al., 2025) studies. 3 https://crfm.stanford.edu/helm/ 4 . 1 . 4 . H U M A N D AT A S E T S Publicly available datasets datasets with “bad” items are rare, as bad items are typically removed before public re- lease. W e were fortunate enough to obtain access to two human data, in addition to the main AI benchmark datasets abov e. , we have two human datasets where “bad” items hav e been identified. One is publicly av ailable and found within the Item Response W arehouse. It has 31 items and 7780 respondents. The second human dataset is a priv ate dataset from an educational intervention pilot study in high school science. The flagged items were identified as either ambiguous or misaligned with the intended construct out of 20 items, each having 106 individual responses. W e conjec- ture that pilot studies, which are rarely accessible publicly , would be a natural format for using these analyses. 4.2. Evaluation metric: A UC as re viewer -efficiency W e operationalize efficienc y as the area under the ROC curve (A UC) when metrics are used to rank-order items by suspected quality . A UC represents the probability that a classifier will rank a randomly chosen instance of a bad item the higher than a randomly chosen instance from items without issues. For any item scoring rule S , we compute the area under the R OC curve (A UC) for classifying items using S ( i ) : A UC( S ) = Pr( S ( i bad ) > S ( i good )) (8) for i bad ∼ L = 1 , i good ∼ L = 0 . A UC has a direct operational interpretation: it is the proba- bility that a randomly chosen bad item is ranked ahead of a randomly chosen good item. Thus, higher A UC corresponds to less manual effort to disco v er flawed items. Specifically , 5 Efficient Detection of Bad Items we simulate the workflo w of a human re vie wer who e xam- ines items in order of decreasing fit (i.e., starting with the most problematic items as identified by each metric). Thus, the efficienc y score is alternati vely defined as: Efficienc y = A UC = Z 1 0 TPR ( FPR ) d ( FPR ) where TPR (True Positive Rate) represents the proportion of truly problematic items identified, and FPR (False Positi v e Rate) represents the proportion of acceptable items incor- rectly flagged. The estimation of the A UC was implemented with the pROC package (Robin et al., 2011). Sign con vention. Many fit indices (including our signed isotonic coefficient) are “higher is better . ” For A UC, we use a consistent con vention that larger S ( i ) means “more suspicious” by negating fit measures when needed. 4.3. Competing methods W e compare the signed isotonic R 2 coefficient against rep- resentativ e families of item-le v el diagnostics: • Interitem association (pairwise, aggregated to items): agreement-based statistics (e.g., SMC, κ ), correlation- based statistics (e.g., ϕ ), and information-theoretic de- pendence (MI, symmetric uncertainty). • Item–rest statistics : correlation or monotone depen- dence between item i and the rest score X − i . • Model-based parameters (when feasible): IR T dis- crimination ( a ) and difficulty ( d ) parameters. Our method is computed from interitem isotonic regres- sions (Sec. 3); item-le vel scores are obtained by aggregating signed monotone R 2 i → j across j = i . 5. Experiments 5.1. Experiment 1: full-dataset A UC acr oss analysis levels The first experiment ev aluates detection efficienc y on the full datasets. For each method, we compute an item score on all five datasets and report the A UC (T able 1). Our first experiment answers: When the dataset is fixed, which statistics best prioritize globally bad items? 5.2. Experiment 2: subsampled benchmark stress test (AI) AI benchmark regimes often face small- n /large- p condi- tions: relativ ely few “respondents” (models, prompts, or runs) and many items. T o probe robustness in this regime, we run B = 20 subsampling trials for each AI benchmark. In each trial, we sample without replacement p = 200 items and n = 50 respondents , compute a large battery of item statistics, and record A UC for each statistic on that subsample. W e then aggregate performance across bootstraps by ranking statistics within each trial (by A UC) and a veraging ranks; the comprehensiv e aggregated table is reported in Appendix T able A. This experiment e v aluates the consistency of the man y estimates in our statistical suite to generalize the statistical findings of the first experiment and reduce any sensiti vity to particular combinations of items. Thus, our second experiment answers: Which methods r e- main r eliable when both items and r espondents ar e not fixed 5.3. Experiment 3: scalability across n × p regimes (interitem-only) The third e xperiment isolates computationally light in- teritem methods to explore scaling behavior as the data aspect ratio v aries. This setting is especially important for benchmarks that ev olv e ov er time (items added/remov ed) and for emerging e v aluation settings where n is limited. W e consider two AI benchmarks (GSM8K and MMLU) and generate 5600 resamples total: • p ∈ { 2 3 , 2 4 , . . . , 2 9 } = { 8 , 16 , . . . , 512 } , • n varies ov er a grid of proportions of the original re- spondents, including deciles in [0 . 4 , 1 . 0] and an e xtrap- olated setting at 1 . 1 , • for each ( n, p ) configuration, we run 100 resamples with replacement (subject to a minimum number of bad items). For each resample, we compute A UC for each interitem statistic and then a verage A UC ov er the 100 resamples per ( n, p ) . Finally , to summarize overall rob ustness across regimes, we apply a Bor da count aggregation: each ( n, p ) configuration votes on a total ordering of methods by A UC, and we sum votes across configurations. The third experiment answers: Which interitem metrics r emain str ong acr oss wide chang es in sample size and test length? 5.4. Estimation details Detailed results are presented in the appendix, demonstrat- ing the practical adv antages of these novel scalability formu- lations for modern psychometric applications. Experiment 6 Efficient Detection of Bad Items T able 1. Bad-item detection efficiency (A UC) for association-based baselines. Interitem methods score an item by its mean pairwise association with all other items. Item-rest methods score an item by its association with the rest-score X − i . Higher A UC indicates better prioritization of bad items for revie w . Abbr ev . Statistic (pairwise) HS Math GSM8K MMLU-5 Human Interitem comparisons (mean pairwise association for item i with other items j = i ) Acc P ( X i = 1 , X j = 1) (probability both correct) 0.585 0.781 0.770 0.667 F1 2 P (1 | X i = 1) P (1 | X j = 1) P (1 | X i = 1) + P (1 | X j = 1) (cond. prob . both correct) 0.627 0.821 0.791 0.683 SMC P ( X i = X j ) (probability of item agreement) 0.885 0.841 0.827 0.733* MI H ( X i ) + H ( X j ) − H ( X i , X j ) (mutual dependence) 0.814 0.863 0.763 0.817* ϕ Corr( X i , X j ) (linear dependence) 0.889 0.872 0.865 0.917* ρ tet Corr( θ i , θ j ) (linear dependence among latent θ s) 0.765 0.872 0.866 0.896* κ P ( X i = X j ) − E [ P ( X i = X j )] 1 − E [ P ( X i = X j )] (meas. error for same θ ) 0.899 0.862 0.869 0.900* U sy m ¯ U i = 2 n X j = i MI( X i ; X j ) H ( X i ) + H ( X j ) (symmetrized uncertainty) 0.780 0.879 0.681 0.883* M 2 iso Signed isotonic R 2 (prop. interitem signal explained) 0.908 0.873 0.861 0.983* Item-group comparisons (association of item i against all items/rest-score X − i ) MI X,X ( − i ) H ( X i ) + H ( X − i ) − H ( X i , X − i ) (mutual information) 0.576 0.553 0.597 0.590 ρ Corr( X i , X − i ) (linear dependence) 0.789 0.870 0.871 0.896* z √ N − 1 P j = i Co v( X i , X j ) q P j = i V ar( X i ) V ar( X j ) (monotone depen- dence) 0.788 0.871 0.871 0.933* R 2 iso:X , i Signed isotonic R 2 (item signal explained by X ) 0.904 0.873 0.830 0.932* Item-drop comparisons (dif ference in statistic upon remov al of i ) ∆ α Change in Reliability; α X − α X − i 0.805 0.873 0.850 0.922* ∆ ¯ ρ 0.788 Change in Mean Correlation; ¯ ρ X − ¯ ρ X − i 0.788 0.870 0.871 0.895* Item-as-parameter comparisons (Use of parameter v alue) d 2PL 2PL difficulty parameter; σ ( a i ( θ − d i )) 0.670 0.746 0.761 0.771 a 2PL 2PL discrimination parameter; σ ( a i ( θ − d i )) 0.711 0.873 0.837 0.917* Bold Underline indicates the best A UC for a giv en dataset; Bold indicates the second-best; italics indicate others within 0 . 01 from best. ‘*’ signifies that for the first human dataset discussed in Sec. 4.1.4, the one “bad” item was correctly sorted first; H ( · ) denotes Shannon entropy; MI( · ; · ) mutual information. σ ( · ) denotes sigmoid. “tet. ” denotes tetrachoric correlation (latent θ correlation implied by dichotomous items). 1 compares all the dif ferent computation costs: all interitem, except tetrachoric, relationships and nonparametric rela- tionships were computed in R (T eam) in 4.0, 8.1, and 22.4 seconds for HS math, MMLU, and GSM8K respectively; whereas tetrachoric alone took 8.2, 39.0, and 190.5 seconds using psych package (Re v elle, 2024); fitting 2PL mod- els using mirt (Chalmers, 2012) took 5.0, 24.5, and 15.4 seconds, respecti vely . Detailed results are presented in the appendix with all comparisons computed as measured under a bootstrapped Borda count regime for ranking across sub- sample sizes. A UC is computed using pROC (Robin et al., 2011). W e drop degenerate cases where a method yields constant scores or where a resample contains only one label class. Missingness rates were recorded per metric per resam- ple to distinguish statistical weakness from non-estimability . In the present study , missingness was negligible. 6. Results Results demonstrate substantial improv ements in identifica- tion ef ficiency for both proposed metrics. T able A presents A UC v alues across multiple datasets, with M iso and M τ con- sistently ranking among the top-performing indices. Across three dif ferent datasets, the only metrics that outperform the signed isotonic scalability coefficient are inter-item tetra- choric correlations cut at the (arbitrary) 90, 95, and 99 7 Efficient Detection of Bad Items percentiles for each item. The superior performance appears particularly pronounced in contexts in volving mixed item types and moderate sam- ple sizes–precisely the conditions where traditional methods show degraded performance. These findings suggest that our biv ariate association approach successfully captures item misfit while maintaining robustness across di verse measure- ment scenarios. 6.1. Experiment 1: signed isotonic R 2 is consistently top-tier T able 1 reports A UC for representativ e interitem, item–rest, and model-based baselines across datasets. Three patterns are consistent. (i) Interitem monotone variance explained is highly di- agnostic. The signed isotonic R 2 achiev es the best or near-best A UC across datasets, including the strongest per- formance on the human dataset (A UC ≈ 0 . 98 ). This indi- cates that globally bad items are precisely those that fail to participate in the monotone dependency structure shared by most items. (ii) Nonlinear monotone signal matters beyond linear correlation. Linear association ( ϕ ) and agreement-based measures (SMC, κ ) are competitiv e on some datasets, but the signed isotonic R 2 improv es or matches them without assuming linearity and while preserving the direction of contribution. This is particularly important when misfit produces nonlinearity (e.g., ambiguity affecting mid-ability respondents disproportionately). (iii) Item–rest summaries can under perform interitem structure. Item–rest mutual information is substantially weaker than the best interitem methods in these datasets. Aggregating through the rest score X − i can wash out pair - wise violations, especially when a small number of bad items is diluted by many good ones. 6.2. Experiment 2: rob ustness under subsampling and broad method comparison Appendix T able A reports results from a comprehensi ve bat- tery of indices (CTT , IR T , scalability , PCA/ome ga, anomaly metrics) under B = 20 subsamples per AI benchmark. Signed isotonic R 2 ranks among the most efficient methods by a verage rank and percentile-A UC summaries, outper- forming many widely used diagnostics. T wo observ ations are particularly practically rele v ant: Stability under benchmark-sized subsamples. When restricted to only n = 50 respondents and p = 200 items, many model-based procedures can become unstable, slo w , or sensiti ve to estimation choices. The signed isotonic R 2 remains competitiv e because it depends only on biv ariate monotone fits and aggregation. Comparable accuracy with substantially lighter com- putation. On the full datasets, computing the full set of interitem statistics (including isotonic re gression) required seconds, whereas tetrachoric correlations and some IR T fits required substantially longer . This supports the use of signed isotonic R 2 as an early-stage screening tool: it produces high-quality revie w queues cheaply . 6.3. Experiment 3: best overall scaling r obustness acr oss n × p regimes Across 5600 resamples spanning p up to 512 and varying n , Borda aggregation yields a clear ordering: the signed isotonic R 2 is the most robust interitem method overall, fol- lowed by the signed adjusted isotonic R 2 , then correlation- based ( ϕ /MCC) and classic agreement-based metrics. This result is consistent with the interpretation that signed isotonic R 2 captures a fundamental regularity of unidimen- sional measurement–monotone coherence–while remaining insensitiv e to functional-form misspecification and changes in aspect ratio. Proposition 3.1 shows that the signed isotonic R 2 is not merely another association coef ficient: it is an extr emal measure of monotone predictability . When most items share a latent ordering, a good item should be predictably mono- tone from many others; globally bad items systematically reduce this maximal monotone predictability . 7. Discussion 7.1. What the experiments collectively sho w Across full datasets (Exp. 1), stress-tested subsamples (Exp. 2), and wide aspect-ratio regimes (Exp. 3), signed isotonic R 2 is consistently among the best detectors of glob- ally bad items. These findings support two claims: 1. Measurement coherence is fundamentally mono- tone. The strongest signal distinguishing good from bad items is whether an item participates in the ex- pected monotone dependency structure induced by a dominant latent trait. 2. Maximal monotone explainability is a practical screening principle. Quantifying “how much of an item can be monotone-explained by other items” yields revie w queues that are ef ficient across div erse item pathologies. 8 Efficient Detection of Bad Items 7.2. Why signed isotonic R 2 detects global badness Bad items can fail in dif ferent w ays (bad ke y , grading, am- biguity , construct drift), but they share a common footprint: they br eak monotone coherence with the rest of the instru- ment. Directionality matters. Miskeyed or systematically in- verted grading induces ne gative association with many items. A signed statistic can surface these in versions di- rectly , whereas unsigned dependence measures may treat in v ersions as “strong signal” and mis-rank the item. This is one reason the signed isotonic family tends to outperform the unsigned isotonic R 2 (which, for dichotomous items, collapses tow ard a squared correlation-style quantity). Nonlinearity matters. Ambiguity and construct drift can produce non-monotone or saturating effects: an item may be- hav e normally for low-ability respondents b ut become noisy for high-ability respondents (or vice versa). Linear correla- tion av erages these regimes; isotonic regression explicitly extracts the strongest monotone component and penalizes deviations through reduced R 2 . 7.3. Implications for AI benchmarks AI benchmarks lack the institutionalized validation pipelines typical of human testing. Our results suggest a lightweight, model-agnostic workflo w: 1. Compute signed isotonic R 2 item scores from an ev al- uation matrix (models × items or runs × items). 2. Revie w the top- k most suspicious items. 3. Fix or remove problematic items; re-score models; repeat. Because the method is bi v ariate and nonparametric, it can be applied even when item formats vary (binary/ordinal/- continuous) and when the “respondents” are heterogeneous systems rather than humans. 7.4. How to r ead Appendix T able A The appendix table is intentionally comprehensiv e: it re- ports (i) a large suite of indices spanning interitem associ- ation, Mokken scalability , item-drop reliability , IR T item fit, and dimensionality proxies, and (ii) aggre gated perfor - mance summaries across subsamples. Rather than serving as a central narrative element, it functions as a r obustness audit : the signed isotonic R 2 remains highly ranked ev en against dozens of alternati ve diagnostics and under repeated perturbations of the dataset. In the main text we therefore emphasize: (i) the head-to- head comparisons most interpretable to a broad audience (T able 1), and (ii) the scaling re gime where AI benchmark practice is most challenged (Exp. 2–3). 7.5. Conclusion Across both human assessments and AI benchmarks, signed isotonic R 2 provides a simple rule with a strong empirical and mathematical basis: Items that cannot be well explained by monotone functions of other items are the ones most likely to be globally bad. This principle yields re vie w queues that are more ef ficient, more scalable, and less assumption-laden than man y tradi- tional alternati ves, making it well-suited for modern lar ge- scale ev aluation re gimes. 7.6. Limitations and scope Global detection, not diagnosis. High suspicion scores indicate that an item fails to cohere with the rest of the instrument, but they do not identify the cause (miskey vs. ambiguity vs. construct drift). In practice, the score is a prioritization tool for human revie w . Not a DIF tool. Because we do not condition on group membership, this method does not detect group-conditional misfit. Combining signed isotonic R 2 with stratified analy- ses is a promising extension. Dependence on a dominant monotone structure. If the instrument is strongly multidimensional or intentionally non- monotone, interitem monotone coherence is not the correct baseline and may ov er-flag items. In such cases, applying the method within clusters (e.g., topics/subscales) or after dimensionality screening is recommended. Acknowledgments W e’ d like to thank Lijin Zhang, Sanmi Ko yejo, Sang Truong, Y uheng Tu, Elizabeth Childs, Y unsung Kim, Anka Reuel, Hansol Lee, and Jason Cho for their time, input, and support. References A systematic approach to the construction and ev aluation of tests of ability . Psychological Monographs , 61(4):i–49, 1947. ISSN 0096-9753. doi: 10.1037/h0093565. Place: US. Busing, F . M. T . A. Monotone Regression: A Simple and Fast O(n) P A V A Implementation. J ournal of Statistical Softwar e , 102:1–25, May 2022. ISSN 1548-7660. doi: 9 Efficient Detection of Bad Items 10.18637/jss.v102.c01. URL https://doi.org/10 .18637/jss.v102.c01 . Casabianca, J. M. Psychometrics is all you need, Nov ember 2025. URL ht t ps : // o s f. i o/ p re p r in t s/ e da rxiv/7w6pz_v1/ . Chalmers, R. P . mirt: A Multidimensional Item Response Theory Package for the R En vironment. Journal of Statistical Softwar e , 48:1–29, May 2012. ISSN 1548- 7660. doi: 1 0 . 1 8 6 3 7 / j s s . v 0 4 8 . i 0 6. URL h t t p s : //doi.org/10.18637/jss.v048.i06 . Lee, Y .-S. Applications of isotonic r e gression in item r esponse theory . Ph.D., The Uni versity of Wisconsin - Madison, United States – W isconsin, 2002. URL ht t p s : / / w w w . p r o q u e s t . c o m / d o c v i e w / 3 0 5 527109/abstract/59C2FF5794504049PQ/1 . Lee, Y .-S. A Comparison of Methods for Nonparamet- ric Estimation of Item Characteristic Curves for Bi- nary Items. Applied Psychological Measur ement , 31 (2):121–134, March 2007. ISSN 0146-6216. doi: 1 0 . 1 1 7 7 / 0 1 4 6 6 2 1 6 0 6 2 9 0 2 48. URL h t t p s : / / d o i.org/10.1177/0146621606290248 . Lee, Y .-S., W ollack, J. A., and Douglas, J. On the Use of Nonparametric Item Characteristic Curve Estimation T echniques for Checking Parametric Model Fit. Educa- tional and Psyc hological Measur ement , 69(2):181–197, April 2009. ISSN 0013-1644. doi: 1 0.1 177 /001 316 44 08322026. URL https://doi.org/10.1177/00 13164408322026 . Liang, P ., Bommasani, R., Lee, T ., Tsipras, D., Soylu, D., Y asunaga, M., Zhang, Y ., Narayanan, D., W u, Y ., Kumar , A., Newman, B., Y uan, B., Y an, B., Zhang, C., Cosgrove, C., Manning, C. D., R ´ e, C., Acosta-Navas, D., Hudson, D. A., Zelikman, E., Durmus, E., Ladhak, F ., Rong, F ., Ren, H., Y ao, H., W ang, J., Santhanam, K., Orr, L., Zheng, L., Y uksekgonul, M., Suzgun, M., Kim, N., Guha, N., Chatterji, N., Khattab, O., Henderson, P ., Huang, Q., Chi, R., Xie, S. M., Santurkar , S., Ganguli, S., Hashimoto, T ., Icard, T ., Zhang, T ., Chaudhary , V ., W ang, W ., Li, X., Mai, Y ., Zhang, Y ., and K oreeda, Y . Holistic Ev aluation of Language Models, October 2023. URL h t tp : / / arxiv.org/abs/221 1 . 09110 . [cs]. Luzardo, M. and Rodr ´ ıguez, P . A Nonparametric Estimator of a Monotone Item Characteristic Curv e. In Quantitative Psychology Resear ch , pp. 99–108. Springer , Cham, 2015. ISBN 978-3-319-19977-1. doi: 10.1007/978- 3- 319- 199 77- 1 8. URL https://link.springer.com/ch apter/10.1007/978- 3- 319- 19977- 1_8 . Mair , P . and Leeuw , J. D. Unidimensional Scaling. In W iley StatsRef: Statistics Reference Online , pp. 1–3. John W ile y & Sons, Ltd, 2015. ISBN 978-1-118-44511-2. doi: 10.1002/9781118445112.stat06462.pub2. URL https: / / o n l i n e l i b r a r y . w i l e y . c o m / d o i / a b s / 1 0 .1002/9781118445112.stat06462.pub2 . McCoy , R. T ., Y ao, S., Friedman, D., Hardy , M., and Griffiths, T . L. Embers of Autoregression: Understand- ing Large Language Models Through the Problem They are Trained to Solve, September 2023. URL h t t p s : //arxiv.org/abs/2309.13638v1 . Mokken, R. J. A Theory and Pr ocedur e of Scale Analy- sis: W ith Applications in P olitical Researc h . De Gruyter Mouton, July 2011. ISBN 978-3-11-081320-3. doi: 10.1515/9783110813203. URL https://www.degr u y t e r b r i l l . c o m / d o c u m e n t / d o i/ 1 0 . 1 51 5 / 9783110813203/html . Reuel, A., Hardy , A., Smith, C., Lamparth, M., Hardy , M., and Kochenderfer , M. J. BetterBench: Assessing AI Benchmarks, Uncov ering Issues, and Establishing Best Practices, Nov ember 2024. URL http://arxiv.or g/abs/2411.12990 . arXiv:2411.12990 [cs] v ersion: 1. Rev elle, W . psych: Procedures for Psychological, Psy- chometric, and Personality Research, June 2024. URL ht t p s : / / c r a n . r - p r o j e ct . o r g / we b / p a c ka ges/psych/index.html . Rev elle, W . and Condon, D. Unidim: An index of scale homogeneity and unidimensionality . Psychological Meth- ods , 2025. ISSN 1939-1463. doi: 10.1037/met0000729. Place: US. Robin, X., T urck, N., Hainard, A., Tiberti, N., Lisacek, F ., Sanchez, J.-C., and M ¨ uller , M. pR OC: an open- source package for R and S+ to analyze and compare R OC curves. BMC Bioinformatics , 12(1):77, March 2011. ISSN 1471-2105. doi: 10.1186/1471- 2105- 12- 77. URL h t t p s : / / d o i . o r g / 1 0 . 1 1 8 6 / 1 4 7 1 - 2 1 0 5- 1 2- 77 . Salaudeen, O., Reuel, A., Ahmed, A., Bedi, S., Robertson, Z., Sundar , S., Domingue, B., W ang, A., and K oyejo, S. Measurement to Meaning: A V alidity-Centered Frame- work for AI Ev aluation, June 2025. URL http://ar x i v . o r g / a b s / 2 5 0 5 . 1 0 5 73 . arXi v:2505.10573 [cs]. Sijtsma, K. On the Use, the Misuse, and the V ery Limited Usefulness of Cronbach’ s Alpha. Psychometrika , 74(1): 107–120, March 2009. ISSN 0033-3123, 1860-0980. doi: 10.1007/s11336- 008- 9101- 0. URL https://www.ca m b r i d g e . o r g / c o r e / j ou r n a l s / p s y c h o m e t r 10 Efficient Detection of Bad Items ika/article/on- the- use- the- misuse- and - the - ver y- lim ite d- us eful nes s- of- c r onb ac h s - al p h a /7 2 E 9 A 6 4 8 D 5 3 2 4 4 1 2 A F 5 5 0 6 7 0 1 B6BE325 . Sijtsma, K. and Molenaar , I. The Monotone Homogene- ity Model: Scalability Coefficients. In Intr oduction to Nonparametric Item Response Theory , pp. 49–64. SA GE Publications, Inc., 2002. ISBN 978-1-4129-8467- 6. doi: 1 0 . 4 1 3 5 / 9 7 8 1 4 1 2 9 8 4 6 7 6. URL h t t p s : / / m e t h o d s . s a g e p u b . c o m / b o o k / m o n o / i n t r od u c ti o n - t o- n o n pa r a me t r ic - ite m- res p o ns e- th e o r y / ch p t / m o n o t o n e- ho m o g e ne i t y - model- scalability- coefficients . T eam, R. C. R: A Language and En vironment for Statistical Computing. URL https://www.r- project.org / . T en Berge, J. M. F . and So ˇ can, G. The Greatest Lower Bound to the Reliability of a T est and the Hypothesis of Unidimensionality. Psychometrika , 69(4):613–625, December 2004. ISSN 0033-3123, 1860-0980. doi: 10.1 007/BF02289858. URL https://www.cambridge. or g / c o r e / p r o d u c t / i d e n t i f i e r / S 0 0 3 3 3 1 2 30002353X/type/journal_article . T ruong, S., T u, Y ., Hardy , M., Reuel, A., T ang, Z., Bu- rapacheep, J., Perera, J., Uwakwe, C., Domingue, B., Haber , N., and Ko yejo, S. Fantastic Bugs and Where to Find Them in AI Benchmarks, Nov ember 2025. URL h t tp : / / a r x i v . o r g / a b s / 2 5 1 1 . 1 6 8 42 . arXiv:2511.16842 [cs]. van der Ark, L. A. Mokken Scale Analysis in R. J ournal of Statistical Software , 20:1–19, February 2007. ISSN 1548-7660. doi: 10.186 37/ jss. v020 .i1 1. URL http s: //doi.org/10.18637/jss.v020.i11 . V endrow , J., V endrow , E., Beery , S., and Madry , A. Do Large Language Model Benchmarks T est Reliability?, February 2025. URL 02.03461 . arXiv:2502.03461 [cs]. W ind, S. A. An Instructional Module on Mokken Scale Analysis. Educational Measurement: Is- sues and Practice , 36(2):50–66, 2017. ISSN 1745-3992. doi: 1 0 . 1 1 1 1 / e m i p . 1 2 1 53. URL h t t p s : / / o n l i n e l i b r a r y . w i l e y . c o m / d o i / a b s / 1 0 . 1 1 1 1 / e m i p . 1 2 1 53 . eprint: https://onlinelibrary .wiley .com/doi/pdf/10.1111/emip.12153. Y u, A. Learning models and the double monotone model . Thesis, Uni versity of Illinois at Urbana-Champaign, Oc- tober 2022. URL ht t p s: / / h dl . h an d l e . n e t /2 142/117700 . Zhang, G., Dorner , F . E., and Hardt, M. How Benchmark Prediction from Fewer Data Misses the Mark, June 2025. URL h t tp : / / a r x i v . o r g / a b s / 2 5 0 6 . 0 7 6 73 . arXiv:2506.07673 [cs]. Zijlmans, E. A. O., T ijmstra, J., van der Ark, L. A., and Sijtsma, K. Item-Score Reliability in Empirical- Data Sets and Its Relationship W ith Other Item In- dices. Educational and Psycholo gical Measur ement , 78(6):998–1020, December 2018a. ISSN 0013-1644. doi: 1 0 . 1 1 7 7 / 0 0 1 3 1 6 4 4 1 7 7 2 8 3 58. URL h t t p s : //doi.org/10.1177/0013164417728358 . Zijlmans, E. A. O., van der Ark, L. A., Tijmstra, J., and Sijtsma, K. Methods for Estimating Item-Score Reliability . Applied Psychological Measur ement , 42 (7):553–570, October 2018b. ISSN 0146-6216. doi: 10.1177/0146621618758290. URL https://doi.or g/10.1177/0146621618758290 . 11 Efficient Detection of Bad Items A. A ppendix Metric Metric T ype A v e. Rank R 1 . 0 MMLU5 R 1 . 0 GSM8K R 1 . 0 HSMath M iso Isotonic 12.67 0.91 0.83 0.85 c75 Inter-Item Correlations (tet), 75-quantile 14.00 0.91 0.83 0.84 a 2 P L IR T : Discrimination 19.33 0.91 0.83 0.83 g (5) Omega: General Factor 25.00 0.90 0.82 0.81 g (3) Omega: General Factor 25.00 0.88 0.81 0.90 h 2 (3) Omega: V ariance 25.50 0.73 0.82 0.95 u 2 (3) PCA: V ariance 26.83 0.73 0.82 0.95 h 2 (5) Omega: V ariance 26.83 0.73 0.82 0.96 min( ρ i ( tet ) ) Inter-Item Correlations (tet) 27.33 0.90 0.81 0.86 u 2 (5) PCA: V ariance 28.50 0.72 0.82 0.96 ρ τ mean Inter-Item Correlations (tetrachoric) 28.83 0.91 0.83 0.77 M τ,j Kendall’ s τ 30.00 0.91 0.83 0.77 a 3 P L IR T : Discrimination 31.83 0.84 0.79 0.89 h 2 (15) Omega: V ariance 31.83 0.67 0.82 0.96 ∆ α CTT : Reliability 32.17 0.86 0.83 0.78 Zi Scalability 34.00 0.90 0.83 0.77 ∆ r other 34.00 0.90 0.83 0.77 u 2 (15) PCA: V ariance 34.33 0.67 0.81 0.96 cmedse Inter-Item Correlations (tet) 35.00 0.69 0.76 0.97 Hi (Loevinger) Scalability 35.33 0.91 0.79 0.79 g (15) other 36.83 0.91 0.83 0.73 SE( ρ ) Inter-Item Correlations (tet) 37.83 0.70 0.78 0.94 V ar( ρ ) Inter-Item Correlations (tet) 37.83 0.70 0.78 0.94 median( ρ ) Inter-Item Correlations (tet) 41.17 0.90 0.82 0.72 dcor drop Rest Distance Correlation 42.17 0.77 0.82 0.77 p2 5 Ome ga: V ariance 48.17 0.73 0.76 0.81 p2 3 Ome ga: V ariance 48.67 0.62 0.69 0.97 P manifest 50.67 0.91 0.77 0.66 cneg Inter-Item Correlations (tet) 50.67 0.89 0.80 0.67 corr drop Rest Correlation 50.67 0.86 0.80 0.70 c25 Inter-Item Correlations (tet) 51.33 0.89 0.82 0.60 com 15 Omega: V ariance 51.83 0.58 0.72 0.96 tc5 15 PCA: V ariance 54.00 0.63 0.65 0.92 p2 15 Omega: V ariance 56.17 0.75 0.79 0.73 c5 Inter-Item Correlations (tet) 58.83 0.80 0.81 0.63 g2 2 Ome ga: V ariance 59.00 0.57 0.68 0.95 Σ V iol. Scalability (Mokken) 59.50 0.83 0.81 0.61 f3 5 Omega: V ariance 61.67 0.64 0.64 0.83 tc13 15 PCA: V ariance 61.67 0.64 0.61 0.91 c10 Inter-Item Correlations (tet) 62.33 0.86 0.82 0.51 tc11 15 PCA: V ariance 63.33 0.71 0.47 0.96 f13 15 Ome ga: V ariance 64.17 0.67 0.59 0.87 tc4 5 PCA: V ariance 64.33 0.64 0.67 0.80 raw alpha Item-drop 64.50 NA N A 0.78 N viol. Scalability 65.17 0.85 0.81 0.51 f15 15 Ome ga: V ariance 65.67 0.68 0.53 0.90 crit Inter-Item Correlations (tet) 66.33 0.86 0.77 0.53 tc2 15 PCA: V ariance 66.67 0.67 0.58 0.85 adj depth Anomaly: Item Isolation 66.67 0.46 0.82 0.81 com 3 Omega: V ariance 67.33 0.60 0.68 0.82 f1 5 Omega: V ariance 67.50 0.81 0.62 0.69 Max V iol. Scalability (Mokken) 67.67 0.72 0.74 0.65 tc7 15 PCA: V ariance 68.00 0.60 0.63 0.86 tc2 3 PCA: V ariance 68.33 0.74 0.62 0.76 x2 2 IR T: Item Fit 68.50 0.54 0.65 0.88 f2 3 Omega: V ariance 68.67 0.74 0.62 0.76 f11 15 Ome ga: V ariance 68.67 0.61 0.60 0.91 adj density Anomaly: Item Isolation 69.00 0.47 0.82 0.79 sum number ac Scalability (Mokken) 69.33 0.82 0.75 0.54 f12 15 Ome ga: V ariance 69.33 0.67 0.54 0.87 12 Efficient Detection of Bad Items number ac Scalability 69.33 0.66 0.74 0.73 number vi number ac Scalability 69.83 0.81 0.72 0.58 f9 15 Omega: V ariance 69.83 0.55 0.60 0.95 f2 5 Omega: V ariance 70.67 0.74 0.67 0.63 tc1 5 PCA: V ariance 71.17 0.81 0.64 0.63 tc2 5 PCA: V ariance 72.00 0.74 0.62 0.68 tc1 3 PCA: V ariance 72.33 0.82 0.68 0.56 tc1 15 PCA: V ariance 73.67 0.60 0.62 0.80 f1 3 Omega: V ariance 75.00 0.82 0.64 0.56 tc5 5 PCA: V ariance 75.33 0.62 0.60 0.81 f2 15 Omega: V ariance 75.67 0.65 0.56 0.80 average r other 76.00 NA N A 0.77 g6 smc CTT: Reliability 76.00 NA NA 0.77 r cor Item-total Correlation 76.00 NA N A 0.77 r drop alpha Item-drop 76.00 NA N A 0.77 raw r Item-drop 76.00 NA N A 0.77 SNR Alpha 76.00 NA N A 0.77 std alpha Item-drop 76.00 NA N A 0.77 std r Item-drop 76.00 NA NA 0.77 f5 15 Omega: V ariance 76.67 0.63 0.64 0.74 rmsea x2 2 Fit Deviation 76.83 0.50 0.61 0.88 f4 5 Omega: V ariance 77.67 0.62 0.60 0.80 complexity 5 PCA: V ariance 77.83 0.62 0.51 0.87 f8 15 Omega: V ariance 79.00 0.56 0.60 0.86 outfit 3 IRT : Item Fit 80.33 0.56 0.74 0.73 f3 15 Omega: V ariance 81.17 0.67 0.61 0.69 f1 15 Omega: V ariance 82.17 0.63 0.59 0.78 rmsea g2 2 Fit Deviation 82.33 0.57 0.53 0.87 tc3 5 PCA: V ariance 82.33 0.49 0.62 0.83 c1 Inter-Item Correlations (tet) 83.33 0.61 0.80 0.57 tc10 15 PCA: V ariance 83.67 0.62 0.53 0.80 tc12 15 PCA: V ariance 84.33 0.54 0.59 0.84 com 5 Omega: V ariance 85.17 0.58 0.70 0.66 complexity 15 PCA: V ariance 86.00 0.58 0.51 0.85 tc6 15 PCA: V ariance 86.17 0.62 0.48 0.81 cmin Inter -Item Correlations (tet) 86.67 0.54 0.50 0.90 f5 5 Omega: V ariance 87.00 0.47 0.62 0.80 z infit 3 IR T : Item Fit 87.67 0.78 0.54 0.60 f14 15 Ome ga: V ariance 88.33 0.66 0.64 0.56 tc15 15 PCA: V ariance 88.33 0.63 0.63 0.61 f3 3 Omega: V ariance 88.50 0.47 0.62 0.79 rmsea g2 3 Fit Deviation 88.67 0.58 0.55 0.79 g2 3 Ome ga: V ariance 89.00 0.55 0.71 0.64 tc3 3 PCA: V ariance 91.50 0.47 0.61 0.79 tc3 15 PCA: V ariance 92.50 0.52 0.59 0.78 tc14 15 PCA: V ariance 94.00 0.69 0.55 0.59 z outfit 3 IRT : Item Fit 94.17 0.59 0.62 0.64 f10 15 Ome ga: V ariance 94.50 0.46 0.61 0.77 guess 3 IR T : Discrimination 95.17 0.68 0.46 0.66 outfit 2 IRT : Item Fit 95.17 0.53 0.70 0.61 tc9 15 PCA: V ariance 95.50 0.66 0.52 0.64 infit 3 IR T : Item Fit 95.67 0.78 0.52 0.53 x2 3 IR T: Item Fit 95.67 0.50 0.69 0.63 tc8 15 PCA: V ariance 99.67 0.63 0.60 0.54 rmsea x2 3 Fit Deviation 100.33 0.49 0.64 0.63 complexity 3 PCA: V ariance 100.83 0.63 0.58 0.58 z infit 2 IR T : Item Fit 103.00 0.64 0.50 0.61 f7 15 Omega: V ariance 104.17 0.60 0.61 0.51 f4 15 Omega: V ariance 106.00 0.51 0.52 0.75 infit 2 IR T : Item Fit 106.17 0.60 0.52 0.63 f6 15 Omega: V ariance 107.50 0.63 0.46 0.63 z outfit 2 IRT : Item Fit 110.67 0.55 0.59 0.56 number zsig Scalability 111.33 0.62 0.56 0.42 tc4 15 PCA: V ariance 111.33 0.56 0.56 0.56 13 Efficient Detection of Bad Items v a n d e r m a a r e l y u l e _ q _ g a m m a y u l e _ w y u l e _ y z i s y m _ j a c c a r d s y m _ s l o p e s s y m _ t a r a n t u l a s y m _ u n c e r t a i n t y t a r a n t u l a t a r w i d t a u b 2 t e t r a _ a p p r o x t e t r a _ a p p r o x 2 t h i e l U u n s i g n e d _ i s o s h a p e _ d i f f e r e n c e s i z e _ d i f f e r e n c e s m s o k a l _ s n e a t h _ 1 s o k a l _ s n e a t h _ 2 s o k a l _ s n e a t h _ 3 s o k a l _ s n e a t h _ 4 s o r g e n f r e i s t i l e s s w j a c c a r d s y m _ c o l e _ p h i p e a r s o n _ h e r o n _ 2 p e i r c e 1 p e i r c e 2 p e i r c e 3 p h i p m i r a n d r o g e r s _ t a n i m o t o r o g o t _ g o l d b e r g r u s s e l l _ r a o s c o t t m a x w e l l _ p i l l i n e r m c c o n n a u g h e y m i c h a e l m o n o _ d i s t m o n o _ e f fi c i e n c y m o u n t f o r d o c h i a i 2 _ s o k a l _ s n e a t h _ 5 o d d s _ r a t i o o v e r l a p p 4 p a t t e r n _ d i f f e r e n c e h e l l i n g e r h i i n n e r p r o d u c t i s o _ m o n o j a c c a r d j o h n s o n k a p p a k e n d a l l _ t a u _ a k e n d a l l _ t a u _ b k u l c z y n s k i 1 k u l c z y n s k i 2 f o r b e s _ 2 f o s s u m g o o d m a n _ k r u s k a l _ l a m b d a g o o d m a n _ k r u s k a l 1 g o o d m a n _ k r u s k a l 2 g o w e r h _ 2 h _ s y m h a m a n n h a m m i n g h a r r i s _ l a h e y c t 5 d e n n i s d i c e i d i c e i i d i s p e r s i o n e u c l i d e a n e y r a u d f 1 f a g e r _ m c g o w a n f a i t h f o r b e s _ 1 c o l e _ 1 a c o l e _ 1 b c o l e _ 2 c o l e _ 3 c o n t i n g e n c y c o s i n e _ o c h i a i c r a m e r _ v c t 1 c t 2 c t 3 c t 4 a 1 _ 2 a d j _ c o n t i n g e n c y a n d e r b e r g a n d e r b e r g 1 a r i a u s t i n _ c o l w e l l b a r o n i _ u r b a n i _ b u s e r _ 1 b a r o n i _ u r b a n i _ b u s e r _ 2 b r a u n _ b l a n q u e t c a n b e r r a c h i _ s q 0 2 5 5 0 7 5 0 2 5 5 0 7 5 0 2 5 5 0 7 5 0 2 5 5 0 7 5 0 2 5 5 0 7 5 0 2 5 5 0 7 5 0 2 5 5 0 7 5 0 2 5 5 0 7 5 0 2 5 5 0 7 5 0 2 5 5 0 7 5 0 2 5 5 0 7 5 0 2 5 5 0 7 5 0 2 5 5 0 7 5 0 2 5 5 0 7 5 0 2 5 5 0 7 5 0 2 5 5 0 7 5 0 2 5 5 0 7 5 0 2 5 5 0 7 5 0 2 5 5 0 7 5 0 2 5 5 0 7 5 0 2 5 5 0 7 5 0 2 5 5 0 7 5 0 2 5 5 0 7 5 0 2 5 5 0 7 5 0 2 5 5 0 7 5 0 2 5 5 0 7 5 0 2 5 5 0 7 5 0 2 5 5 0 7 5 0 2 5 5 0 7 5 0 2 5 5 0 7 5 0 2 5 5 0 7 5 0 2 5 5 0 7 5 0 2 5 5 0 7 5 0 2 5 5 0 7 5 0 2 5 5 0 7 5 0 2 5 5 0 7 5 0 2 5 5 0 7 5 0 2 5 5 0 7 5 0 2 5 5 0 7 5 0 2 5 5 0 7 5 0 2 5 5 0 7 5 0 2 5 5 0 7 5 0 2 5 5 0 7 5 0 2 5 5 0 7 5 0 2 5 5 0 7 5 0 2 5 5 0 7 5 0 2 5 5 0 7 5 0 2 5 5 0 7 5 0 2 5 5 0 7 5 0 2 5 5 0 7 5 0 2 5 5 0 7 5 0 2 5 5 0 7 5 0 2 5 5 0 7 5 0 2 5 5 0 7 5 0 2 5 5 0 7 5 0 2 5 5 0 7 5 0 2 5 5 0 7 5 0 2 5 5 0 7 5 0 2 5 5 0 7 5 0 2 5 5 0 7 5 0 2 5 5 0 7 5 0 2 5 5 0 7 5 0 2 5 5 0 7 5 0 2 5 5 0 7 5 0 2 5 5 0 7 5 0 2 5 5 0 7 5 0 2 5 5 0 7 5 0 2 5 5 0 7 5 0 2 5 5 0 7 5 0 2 5 5 0 7 5 0 2 5 5 0 7 5 0 2 5 5 0 7 5 0 2 5 5 0 7 5 0 2 5 5 0 7 5 0 2 5 5 0 7 5 0 2 5 5 0 7 5 0 2 5 5 0 7 5 0 2 5 5 0 7 5 0 2 5 5 0 7 5 0 2 5 5 0 7 5 0 2 5 5 0 7 5 0 2 5 5 0 7 5 0 2 5 5 0 7 5 0 2 5 5 0 7 5 0 2 5 5 0 7 5 0 2 5 5 0 7 5 0 2 5 5 0 7 5 0 2 5 5 0 7 5 0 2 5 5 0 7 5 0 2 5 5 0 7 5 0 2 5 5 0 7 5 0 2 5 5 0 7 5 0 2 5 5 0 7 5 0 2 5 5 0 7 5 0 2 5 5 0 7 5 0 2 5 5 0 7 5 0 2 5 5 0 7 5 0 2 5 5 0 7 5 0 2 5 5 0 7 5 0 2 5 5 0 7 5 0 2 5 5 0 7 5 0 2 5 5 0 7 5 0 2 5 5 0 7 5 0 2 5 5 0 7 5 1 2 3 4 5 6 1 2 3 4 5 6 1 2 3 4 5 6 1 2 3 4 5 6 1 2 3 4 5 6 1 2 3 4 5 6 1 2 3 4 5 6 1 2 3 4 5 6 1 2 3 4 5 6 1 2 3 4 5 6 1 2 3 4 5 6 1 2 3 4 5 6 1 2 3 4 5 6 1 2 3 4 5 6 1 2 3 4 5 6 1 2 3 4 5 6 1 2 3 4 5 6 1 2 3 4 5 6 1 2 3 4 5 6 1 2 3 4 5 6 1 2 3 4 5 6 1 2 3 4 5 6 1 2 3 4 5 6 1 2 3 4 5 6 1 2 3 4 5 6 1 2 3 4 5 6 1 2 3 4 5 6 1 2 3 4 5 6 1 2 3 4 5 6 1 2 3 4 5 6 1 2 3 4 5 6 1 2 3 4 5 6 1 2 3 4 5 6 1 2 3 4 5 6 1 2 3 4 5 6 1 2 3 4 5 6 1 2 3 4 5 6 1 2 3 4 5 6 1 2 3 4 5 6 1 2 3 4 5 6 1 2 3 4 5 6 1 2 3 4 5 6 1 2 3 4 5 6 1 2 3 4 5 6 1 2 3 4 5 6 1 2 3 4 5 6 1 2 3 4 5 6 1 2 3 4 5 6 1 2 3 4 5 6 1 2 3 4 5 6 1 2 3 4 5 6 1 2 3 4 5 6 1 2 3 4 5 6 1 2 3 4 5 6 1 2 3 4 5 6 1 2 3 4 5 6 1 2 3 4 5 6 1 2 3 4 5 6 1 2 3 4 5 6 1 2 3 4 5 6 1 2 3 4 5 6 1 2 3 4 5 6 1 2 3 4 5 6 1 2 3 4 5 6 1 2 3 4 5 6 1 2 3 4 5 6 1 2 3 4 5 6 1 2 3 4 5 6 1 2 3 4 5 6 1 2 3 4 5 6 1 2 3 4 5 6 1 2 3 4 5 6 1 2 3 4 5 6 1 2 3 4 5 6 1 2 3 4 5 6 1 2 3 4 5 6 1 2 3 4 5 6 1 2 3 4 5 6 1 2 3 4 5 6 1 2 3 4 5 6 1 2 3 4 5 6 1 2 3 4 5 6 1 2 3 4 5 6 1 2 3 4 5 6 1 2 3 4 5 6 1 2 3 4 5 6 1 2 3 4 5 6 1 2 3 4 5 6 1 2 3 4 5 6 1 2 3 4 5 6 1 2 3 4 5 6 1 2 3 4 5 6 1 2 3 4 5 6 1 2 3 4 5 6 1 2 3 4 5 6 1 2 3 4 5 6 1 2 3 4 5 6 1 2 3 4 5 6 1 2 3 4 5 6 1 2 3 4 5 6 1 2 3 4 5 6 1 2 3 4 5 6 1 2 3 4 5 6 1 2 3 4 5 6 n l o g ( p ) a u c 0 . 6 0 . 7 0 . 8 0 . 9 F igur e 2. Instrument Composition Permutation Bootstrap Results (n x p) cmax Inter-Item Correlations (tet) 112.00 0.51 0.53 0.63 MI drop Rest Mutual Information 118.00 0.56 0.52 0.52 msa 15 PCA: V ariance 127.50 0.50 0.50 0.50 msa 3 PCA: V ariance 127.50 0.50 0.50 0.50 msa 5 PCA: V ariance 127.50 0.50 0.50 0.50 T able 2. The first numeric column represents the average Borda count rank. The subsequent columns represent the average percentile rank for A UC. Estimation of the A UC was done with the pROC package (Robin et al., 2011). B. Full List of Dichotomous Associations C. F ormal T reatment of Isotonic Regr ession This appendix builds the mathematical relationships of isotonic regression in the conte xt of scalability and bad item detection. C.1. The Probability Space W e begin by defining the measure-theoretic foundation. Let (Ω , F , P ) be a probability space, where: • Ω is the sample space (a set of outcomes). • F is a σ -algebra of events (a set of subsets of Ω ). • P is a probability measure on F . Let X and Y be two real-v alued random v ariables, which are measurable functions from our probability space to the real numbers: • X : Ω → R • Y : Ω → R 14 Efficient Detection of Bad Items The expectation of a random v ariable Z (or any inte grable function g ( X , Y ) ) is its Lebesgue integral with respect to the measure P : E [ Z ] := R Ω Z ( ω ) dP ( ω ) W e assume that X and Y hav e finite second moments, i.e., E [ X 2 ] < ∞ and E [ Y 2 ] < ∞ . This ensures that their variances are well-defined and finite. • V ar ( X ) = E [( X − E [ X ]) 2 ] = R Ω ( X ( ω ) − E [ X ]) 2 dP ( ω ) • V ar ( Y ) = E [( Y − E [ Y ]) 2 ] = R Ω ( Y ( ω ) − E [ Y ]) 2 dP ( ω ) C.2. Signed Isotonic (Monotonic) Regression Isotonic regression finds the best-fitting monotonic function. Unlike linear re gression, we search o ver the entire space of monotonic functions to minimize the mean squared error (MSE). W e define the two sets of monotonic, measurable functions: • The set of non-decreasing (isotonic) functions: M ↑ = { f : R → R | f is measurable and x 1 ≤ x 2 = ⇒ f ( x 1 ) ≤ f ( x 2 ) } • The set of non-increasing (antitonic) functions: M ↓ = { f : R → R | f is measurable and x 1 ≤ x 2 = ⇒ f ( x 1 ) ≥ f ( x 2 ) } C.3. Signed R 2 for Y r egressed on X First, we consider the regression of Y on X . W e must find the best monotonic fit, which could be either non-decreasing or non-increasing. 1. Find the best non-decreasing fit ( f ↑ Y | X ): This function minimizes the MSE over all functions in M ↑ . f ↑ Y | X := arg min f ∈M ↑ E [( Y − f ( X )) 2 ] = arg min f ∈M ↑ R Ω ( Y ( ω ) − f ( X ( ω ))) 2 dP ( ω ) Let the resulting minimum MSE be MSE ↑ Y | X = E [( Y − f ↑ Y | X ( X )) 2 ] . 2. Find the best non-increasing fit ( f ↓ Y | X ): This function minimizes the MSE ov er all functions in M ↓ . f ↓ Y | X := arg min f ∈M ↓ E [( Y − f ( X )) 2 ] = arg min f ∈M ↓ R Ω ( Y ( ω ) − f ( X ( ω ))) 2 dP ( ω ) Let the resulting minimum MSE be MSE ↓ Y | X = E [( Y − f ↓ Y | X ( X )) 2 ] . 3. Determine the Direction and the Signed R²: The direction of the monotonicity is determined by which fit is better (i.e., has a lower MSE). W e define a sign, σ Y | X , based on this comparison. σ Y | X := ( +1 if MSE ↑ Y | X ≤ MSE ↓ Y | X − 1 if MSE ↑ Y | X > MSE ↓ Y | X The ov erall best monotonic MSE is min( MSE ↑ Y | X , MSE ↓ Y | X ) . The corresponding unsigned R 2 is: R 2 Y | X = 1 − min( MSE ↑ Y | X , MSE ↓ Y | X ) V ar ( Y ) The signed R² for Y on X, which we denote S 2 Y | X , is the product of the sign and the unsigned R²: S 2 Y | X := σ Y | X · 1 − min( E [( Y − f ↑ Y | X ( X )) 2 ] ,E [( Y − f ↓ Y | X ( X )) 2 ]) V ar ( Y ) C.4. Signed R² for X r egr essed on Y The process is perfectly symmetric. W e now regress X on Y . W e need a ne w set of functions, which we’ll call g , to av oid confusion. 1. Find the best non-decreasing fit ( g ↑ X | Y ): g ↑ X | Y := arg min g ∈M ↑ E [( X − g ( Y )) 2 ] MSE ↑ X | Y = E [( X − g ↑ X | Y ( Y )) 2 ] 2. Find the best non-increasing fit ( g ↓ X | Y ): g ↓ X | Y := arg min g ∈M ↓ E [( X − g ( Y )) 2 ] MSE ↓ X | Y = E [( X − g ↓ X | Y ( Y )) 2 ] 3. Determine the Direction and the Signed R²: σ X | Y := ( +1 if MSE ↑ X | Y ≤ MSE ↓ X | Y − 1 if MSE ↑ X | Y > MSE ↓ X | Y 15 Efficient Detection of Bad Items The signed R² for X on Y , denoted S 2 X | Y , is: S 2 X | Y := σ X | Y · 1 − min( E [( X − g ↑ X | Y ( Y )) 2 ] ,E [( X − g ↓ X | Y ( Y )) 2 ]) V ar ( X ) C.5. Final Notation for the Association Measur e The final association measure is the mean of the two signed R² v alues. Let’ s call this measure ρ 2 m ( X, Y ) , where the subscript ’m’ stands for monotonic. The final mathematical notation is: ρ 2 m ( X, Y ) = 1 2 S 2 Y | X + S 2 X | Y where: S 2 Y | X = sgn ( MSE ↓ Y | X − MSE ↑ Y | X ) · 1 − min( MSE ↑ Y | X , MSE ↓ Y | X ) V ar ( Y ) S 2 X | Y = sgn ( MSE ↓ X | Y − MSE ↑ X | Y ) · 1 − min( MSE ↑ X | Y , MSE ↓ X | Y ) V ar ( X ) and the components are defined using Lebesgue integrals o ver the probability space (Ω , F , P ) as follo ws: • MSE ↑ Y | X = inf f ∈M ↑ R Ω ( Y ( ω ) − f ( X ( ω ))) 2 dP ( ω ) • MSE ↓ Y | X = inf f ∈M ↓ R Ω ( Y ( ω ) − f ( X ( ω ))) 2 dP ( ω ) • MSE ↑ X | Y = inf g ∈M ↑ R Ω ( X ( ω ) − g ( Y ( ω ))) 2 dP ( ω ) • MSE ↓ X | Y = inf g ∈M ↓ R Ω ( X ( ω ) − g ( Y ( ω ))) 2 dP ( ω ) • V ar ( Y ) = R Ω Y ( ω ) − R Ω Y ( ω ′ ) dP ( ω ′ ) 2 dP ( ω ) • V ar ( X ) = R Ω X ( ω ) − R Ω X ( ω ′ ) dP ( ω ′ ) 2 dP ( ω ) ρ 2 miso ( X, Y ) = sgn mono · 2 − argmin g ∈M ( R Ω ( X ( ω ) − g ( Y ( ω ))) 2 dP ( ω )) R Ω ( Y ( ω ) − R Ω Y ( ω ′ ) dP ( ω ′ ) ) 2 dP ( ω ) − argmin f ∈M ( R Ω ( Y ( ω ) − f ( X ( ω ))) 2 dP ( ω )) R Ω ( X ( ω ) − R Ω X ( ω ′ ) dP ( ω ′ ) ) 2 dP ( ω ) ! M ↑ and M ↓ are the sets of non-decreasing and non-increasing measurable functions, respecti v ely . The use of ‘inf‘ (infimum) is slightly more rigorous than ‘min‘ (minimum) as the minimum might not be achiev ed by a specific function within the set, though in the context of these L 2 projections, it is. The ‘argmin‘ notation used earlier implies this e xistence. The sign function ‘sgn‘ is defined as sgn ( z ) = +1 for z ≥ 0 and sgn ( z ) = − 1 for z < 0 , which matches our definition of σ . 16
Original Paper
Loading high-quality paper...
Comments & Academic Discussion
Loading comments...
Leave a Comment