Vision-Language Models vs Human: Perceptual Image Quality Assessment
Psychophysical experiments remain the most reliable approach for perceptual image quality assessment (IQA), yet their cost and limited scalability encourage automated approaches. We investigate whether Vision Language Models (VLMs) can approximate hu…
Authors: Imran Mehmood, Imad Ali Shah, Ming Ronnier Luo
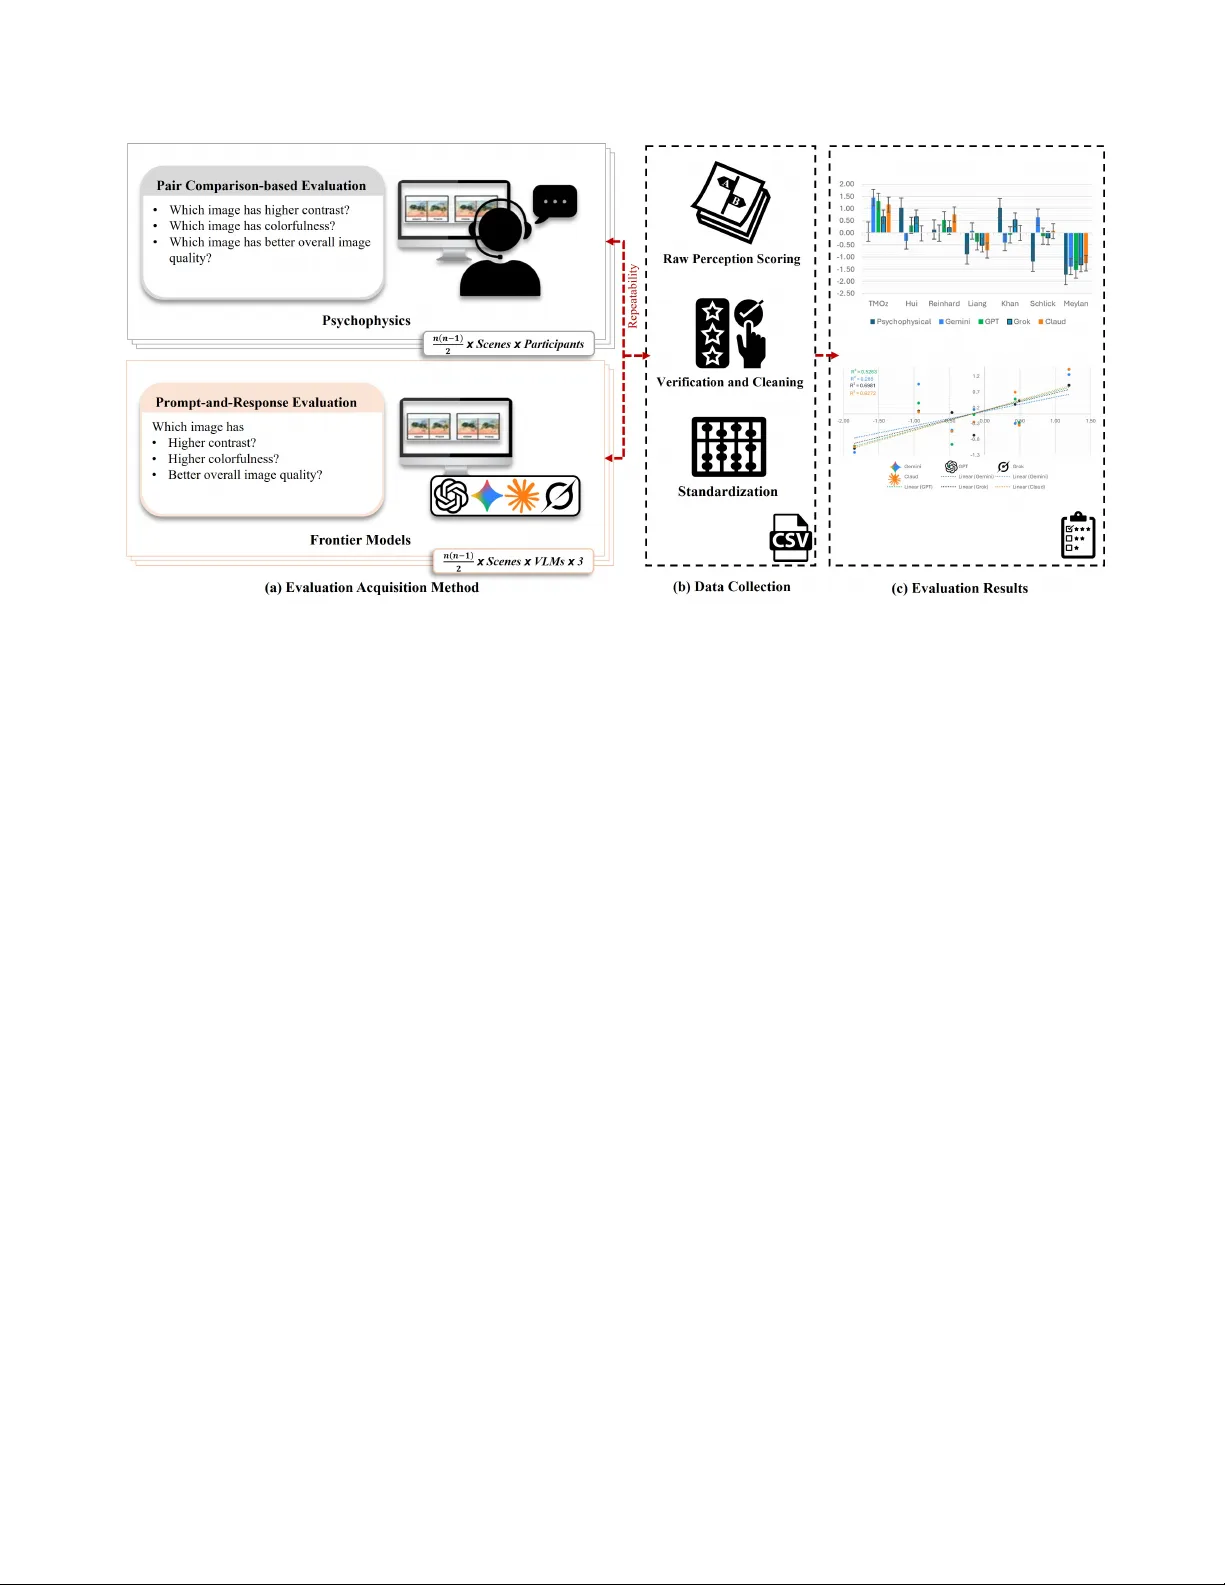
V ision-Language Models vs Human: P erceptual Image Quality Assessment Imran Mehmood 1 , Imad Ali Shah 1 , Ming Ronnier Luo 2 , and Brian Deegan 1 1 School of Engineering, Univ ersity of Galway , Ireland 2 State Ke y Laboratory of Extreme Photonics and Instrumentation, Zhejiang University , Hangzhou, China. Abstract Psychophysical experiments r emain the most r eliable ap- pr oach for per ceptual image quality assessment (IQA), yet their cost and limited scalability encourag e automated ap- pr oaches. W e investigate whether V ision-Language Mod- els (VLMs) can appr oximate human perceptual judgments acr oss thr ee image quality scales: contrast, colorfulness, and overall pr eference . Six VLMs (four pr oprietary and two open-weight models) are benchmarked against psyc hophys- ical data. This work pr esents a systematic benchmark of VLMs for per ceptual IQA thr ough comparison with human psychophysical data. The r esults r eveal strong attribute- dependent variability: models with high human alignment for colorfulness ( ρ up to 0 . 93 ) underperform on contrast, and vice-versa. Attribute weighting analysis further shows that most VLMs assign higher weights to colorfulness com- par ed to contrast when evaluating overall pr efer ence, sim- ilar to the psychophysical data. Intra-model consistency analysis r eveals a counterintuitive trade-off: the most self- consistent models ar e not necessarily the most human- aligned, sugg esting r esponse variability r eflects sensitiv- ity to scene-dependent per ceptual cues. Furthermore , hu- man–VLM agr eement is incr eased with perceptual separ a- bility , indicating VLMs ar e mor e reliable when stimulus dif- fer ences are clearly e xpressed. 1. Introduction Evaluation of perceptual image quality (IQ) [ 5 , 14 ] in computational imaging remains a central challenge for re- searchers. Numerous IQ e valuation metrics [ 4 , 5 , 17 , 24 , 25 ] hav e been dev eloped depending on the research area, This publication is jointly funded by T aighde ´ Eireann - Research Ire- land under Grant Number 13/RC/2094 2, and co-funded by the EU under the Systems, Methods, Context (SyMeCo) programme, Grant Agreement Number 101081459. The vie ws and opinions e xpressed are those of the authors only and do not necessarily reflect those of the EU or the European Research Ex ecutive Agency . Neither the EU nor the granting authority can be held responsible for them. Corresponding Author: imran.mehmood@universityofgalway .ie which formulate human perception to quantify IQ. The cor- relation of these metrics is highly scene-content dependent, and the metrics struggle to correlate well with human per- ception for complex scenes. Consequently , psychophysical ev aluation with human observ ers remains the most reliable method, despite being time-consuming, expensi ve, and dif- ficult to scale. Recent adv ances in vision language models (VLMs) hav e significantly improv ed machine understanding of vi- sual content. Beyond recognition and captioning, these models can generate detailed qualitati ve assessments about image attributes, raising the question of whether they can approximate human perceptual ev aluations. If reliable, VLM-based assessments could accelerate algorithm de vel- opment by enabling rapid screening and hypothesis testing before costly human studies. Howe ver , perceptual IQ as- sessment (IQA) presents unique challenges. Assessments of IQ attributes such as contrast and colorfulness are sub- jectiv e, context-dependent, and shaped by subtle interac- tions, necessitating a controlled experimental environment. Lev eraging VLMs in this domain, to e valuate their capa- bility for capturing perceptual cues and their failure condi- tions, remains largely une xplored. In this work, we conduct a systematic ev aluation of four proprietary and two open-weight VLMs by directly com- paring their IQA with psychophysical data. Using an iden- tical pairwise comparison protocol for humans and VLMs, we ev aluate three perceptual attributes: contrast, colorful- ness, and o verall preference. T o ev aluate the positioning of VLMs as human observ ers, we perform a diagnostic e valu- ation to identify whether the perceptual attributes are cap- tured reliably by VLMs and where they di ver ge from human judgments. W e analyze model behavior along three axes: (1) internal consistency; (2) agreement between different VLMs; and (3) alignment with human perceptual rankings. The contributions of this w ork are threefold: • W e pro vide the first systematic benchmark comparing six VLMs against established psychophysical IQ data. • W e demonstrate strong attribute-dependent v ariability across VLMs, re vealing distinct strengths and limitations. • W e identify a dataset-specific breakdo wn in VLM perfor - Figure 1. W orkflow for comparing perceptual IQA between human observers and VLMs. (a) Evaluation acquisition: Human psychophys- ical data are obtained through pairwise comparisons, while VLM assessments are collected via prompt-based image comparisons using an identical query . (b) Data processing: Responses from both sources undergo repeatability filtering, verification, and score standardization to produce a unified ev aluation dataset. (c) Evaluation results: Standardized human and VLM scores are compared to quantify model–human alignment, rev ealing attribute-dependent performance and varying agreement with the psychoph ysical baseline. mance for ov erall IQ, highlighting risks when e valuating perceptually optimized algorithms. 2. Methodology 2.1. Psychophysical Dataset The dataset for our studies is based on a psychophysical ex- periment conducted by Mehmood et al. [ 15 ] on the IQ e val- uation of tone mapping operators (TMOs) in terms of three perceptual IQ scales: contrast, colorfulness, and ov erall preference. The ev aluation dataset was constructed using 10 high dynamic range (HDR) images rendered through sev en TMOs: Hui [ 10 ], Khan [ 9 ], Liang [ 11 ], Meylan [ 16 ], Rein- hard [ 20 ], Schlick [ 21 ], and TMO z [ 15 ], representing di- verse scene content, including outdoor en vironments, vary- ing illumination conditions, and different dynamic range characteristics. These models were selected to provide a stimulus space where the rendered images for each scene exhibit both subtle and significant variations across the three target IQ scales. Each HDR image was rendered using de- fault parameters for each TMO, resulting in a total of 70 images (10 HDR images × 7 TMOs). 2.2. Psychophysical Experiment The experiment was conducted with 20 observ ers, with a mean age of 25 and a standard deviation (SD) of 2.5. (7 female, 13 male) who had normal or corrected-to-normal vision. All observers passed a color vision test using the Ishihara test [ 8 ]. The experimentation setting and assess- ment protocols consisted of: 1. Controlled viewing en vironment using an Apple Pro Display XDR installed in a dark room with a wall re- flectance of approximately 4 cd/m 2 . The peak luminance of the display’ s peak white was calibrated to 562 cd/m 2 under CIE D65 illumination using the 1931 standard colorimetric observer . The background surrounding the presented image pairs was set to black, and all instruc- tional and labeling text was rendered in neutral gray . Ob- servers were seated following ITU recommendations [ 7 ], with the viewing distance fixed at 1.2 m, corresponding to approximately 2.5× the display height, and the line of sight oriented at 22° normal to the display . 2. The spatial uniformity of the display screen was e val- uated by di viding the screen into a 3 × 3 grid, and the mean CIELAB color difference ( ∆ E ab ) [ 12 ] between the center and each segment was measured as 1 . 1 ∆ E ab . Display characterization was performed using the gain- offset-g amma (GOG) model [ 3 ], and the 24-patch Color Checker chart [ 13 ] was used to validate model per- formance. The resulting characterization accuracy had a mean error of 0 . 39 ∆ E ab , with values ranging from 0 . 16 ∆ E ab to 1 . 13 ∆ E ab . All images were transformed to the display’ s RGB space using this characterization model before presentation. 3. The observers were presented with pairs of images and asked to select the image based on the following e valua- tion criteria: (1) higher contrast, (2) higher colorfulness, and (3) overall preference, matching the three-attribute framew ork used in VLM assessment. 4. Each observ er assessed 273 pairs (including repetitions), ev aluating a total of 2,730 assessments. The validity of experimental data was e valuated by analyzing intra- and inter-observ er variabilities. Overall, the mean v alues of the intra- and inter-observer variability were considered reliable for data interpretation and validity of the exper- iment. 5. The raw experimental data were conv erted to standard- ized z-scores using Thurstone’ s law of comparativ e judg- ment [ 22 ], and the ranking of the rendering models was established. 2.3. VLM Assessment W e ev aluate a set of six of the most recent VLMs, includ- ing both proprietary and open-weight models: Anthropic Claude Opus 4.6 (Claude) [ 2 ], Google Gemini 3.1 Pro (Gemini) [ 6 ], OpenAI GPT -5.2 (GPT) [ 18 ], xAI Grok-4.1 (Grok) [ 23 ], OpenGVLab InternVL-3.5-38B (Intern) [ 19 ], and Alibaba Qwen3-VL-32B-Instruct (Qwen) [ 1 ]. Propri- etary models were accessed through their respectiv e APIs, while open-weight models were ex ecuted locally using their publicly av ailable checkpoints. 2.3.1. Prompt Design W e developed a structured prompt framework designed to elicit comparati ve quality assessments from VLMs across three perceptual scales: contrast, colorfulness, and over - all IQ. The prompt employed a forced-choice paradigm matching the paired comparison methodology used in psy- chophysical ev aluation. The complete prompt template is as shown belo w: Prompt Compare these two images: • The first image is ‘ A ’ • The second image is ‘B’ For each of the following IQ scales, select exactly one image and pro- vide a brief rationale: • Which image has higher Contrast (choose A or B) • Which image has higher Colorfulness (choose A or B) • Which image has better Overall image quality (choose A or B) Each key MUST contain a nested object with two keys: ‘selection’ (value should be strictly A or B) and ‘reason’ (a string). 2.3.2. Assessment Protocol Image pairs were submitted to VLMs using nativ e multi- image input capabilities supported by each API, with no preprocessing, i.e., keeping the original image resolution and data. The image names were specifically changed to alphabets, i.e., A-G, to remo ve any bias arising from the original image source or if the VLMs had learned those rendering models. Hence, each comparison was conducted anonymously and independently without reference to the source or previous comparisons, maintaining experimental independence. Each image pair was ev aluated three times by each VLM to assess response consistency and account for potential stochasticity in model outputs. API calls were made with default settings, and the temperature was set to 1, which is the API default, to ensure reproducibility across API calls while permitting natural response variation. For each assessment, we extracted: 1. The selected image pair (e.g, A or B) for each attribute, 2. The textual rationale for each selection, and 3. The content description. VLM responses were parsed automatically using struc- tured output extraction. The JSON-formatted responses fa- cilitated reliable parsing of selections and rationales. 3. Analysis and Results For each image pair and attribute, we computed the consis- tency of VLMs across the three repeated assessments. Pairs with unanimous selections (3/3 agreement) were considered high-confidence judgments, while split decisions indicated assessment uncertainty . W e aggregated VLM’ s preference scores across all comparisons to deriv e attribute-specific rankings for each rendered image by con verting the pref- erence scores into standardized z-scores using Thurstone’ s law of comparati ve judgment [ 22 ], similar to the e valuation approach applied to human data in Mehmood et al. [ 15 ]. In this section, we present a comparati ve analysis frame- work and corresponding findings. W e ev aluate VLM per- formance through three complementary perspectiv es: inter- nal consistency (intra-model reliability), cross-model agree- ment (inter-model consistency), and alignment with human psychophysical data. 3.1. Intra-Model V ariability Analysis T o assess VLM reliability , we quantified intra-model con- sistency across the three repeated assessments for each im- age pair . For each VLM and perceptual attribute, we com- pute the inter -run variability rate (VR%), defined as the percentage of trials producing different rankings across the three runs. This metric reflects the stochasticity and sta- bility of each model’ s perceptual assessments, analogous to intra-observer v ariability in psychophysical experiments. T able 1 summarizes intra-model v ariability across the three perceptual scales. Claude demonstrates the high- est consistency , with v ery lo w variability for Colorful- ness (0.95%), Overall Preference (1.27%), and Contrast (1.90%), indicating highly repeatable perceptual judgments. While high consistency reflects stable model behavior , it T able 1. Intra-model variability performance comparison (VR %): Mean (Max, SD). Scale Claude Gemini GPT Grok Intern Qwen Contrast 1.90 (2.38, 0.82) 2.54 (2.86, 0.55) 4.44 (5.24, 0.73) 6.67 (7.62, 0.95) 17.78 (20.00, 1.98) 2.54 (2.86, 0.27) Colorfulness 0.95 (1.43, 0.48) 6.03 (7.14, 1.53) 8.89 (10.00, 0.99) 7.30 (8.10, 1.37) 14.92 (17.14, 2.40) 2.86 (4.29, 1.26) Overall 1.27 (1.43, 0.27) 10.48 (13.81, 4.97) 7.62 (8.10, 0.82) 8.25 (10.48, 2.15) 13.02 (14.29, 1.45) 6.35 (7.62, 1.45) T able 2. Cross-model variability rate comparison (VR %): Mean (Max, SD) Scale Model Claude GPT Gemini Grok Intern Contrast GPT 25 . 87 (26 . 67 , 0 . 67) — — — — Gemini 25 . 71 (26 . 67 , 0 . 79) 10 . 00 (11 . 90 , 1 . 56) — — — Grok 46 . 03 (46 . 67 , 0 . 53) 43 . 02 (43 . 81 , 0 . 98) 41 . 38 (42 . 86 , 1 . 08) — — Intern 40 . 79 (40 . 95 , 0 . 24) 52 . 06 (52 . 38 , 0 . 24) 48 . 73 (49 . 05 , 0 . 48) 52 . 22 (52 . 86 , 0 . 48) — Qwen 26 . 35 (26 . 67 , 0 . 24) 24 . 92 (25 . 24 , 0 . 24) 21 . 90 (22 . 86 , 0 . 82) 38 . 41 (39 . 05 , 0 . 48) 49 . 05 (49 . 05 , 0 . 00) Colorfulness GPT 21 . 90 (23 . 33 , 1 . 17) — — — — Gemini 38 . 73 (40 . 95 , 1 . 39) 28 . 99 (33 . 33 , 2 . 31) — — — Grok 38 . 94 (40 . 48 , 0 . 95) 36 . 19 (38 . 10 , 1 . 26) 37 . 57 (39 . 05 , 1 . 08) — — Intern 21 . 59 (21 . 90 , 0 . 24) 32 . 70 (34 . 76 , 1 . 56) 51 . 43 (53 . 81 , 2 . 06) 44 . 44 (45 . 24 , 1 . 19) — Qwen 15 . 08 (15 . 71 , 0 . 63) 25 . 24 (27 . 14 , 1 . 89) 41 . 75 (42 . 86 , 0 . 86) 32 . 22 (32 . 86 , 0 . 63) 21 . 43 (21 . 43 , 0 . 00) Overall GPT 35 . 08 (36 . 67 , 1 . 06) — — — — Gemini 39 . 21 (45 . 24 , 4 . 31) 20 . 21 (22 . 86 , 1 . 83) — — — Grok 49 . 21 (50 . 00 , 0 . 48) 34 . 13 (36 . 67 , 1 . 61) 34 . 44 (37 . 14 , 2 . 69) — — Intern 24 . 60 (25 . 24 , 0 . 63) 53 . 33 (54 . 29 , 0 . 71) 54 . 60 (61 . 90 , 5 . 54) 65 . 24 (66 . 19 , 1 . 09) — Qwen 19 . 21 (19 . 52 , 0 . 24) 37 . 78 (39 . 52 , 1 . 67) 40 . 95 (42 . 86 , 1 . 49) 44 . 29 (45 . 71 , 1 . 24) 24 . 76 (24 . 76 , 0 . 00) does not necessarily indicate alignment with human percep- tual judgments, a distinction addressed in Section 4.2 . Gemini shows increased variability when the task shifts to holistic judgments. While Contrast remains relatively stable (2.54%), v ariability rises for Colorfulness (6.03%) and Overall Preference (10.48%). GPT and Grok exhibit moderate v ariability across attributes, suggesting reason- ably stable but less consistent perceptual e valuations. In contrast, Intern displays the highest v ariability across all perceptual dimensions, indicating greater stochasticity in its decision process. Qwen maintains low variability for Contrast and Colorfulness but sho ws higher variability for Overall Preference, suggesting that holistic judgments re- main more challenging. Most VLMs demonstrate strong internal consistency , with variability typically below 10%. The observed vari- ability tends to arise in perceptually ambiguous cases where stimulus differences are subtle, reflecting patterns similar to decisional uncertainty observed in human psychophysical experiments. 3.2. Cross-Model V ariability Analysis T o quantify agreement among VLMs independent of human judgments, we computed pairwise v ariability rates between all model pairs. For each perceptual scale, the percentage of image pairs where two models selected different images as superior was calculated. This analysis reveals cross-model agreement patterns across the IQ scale to identify attribute- dependent differences in inter-model alignment. The results are summarized in T able 2 , which reports the mean VR per - centage for each model pair along with the maximum and SD. Consistent with patterns observed in human psychophys- ical studies, the Contrast scale e xhibited higher inter-model inconsistency compared to colorfulness [ 15 ]. For exam- ple, Grok showed substantial disagreement with Claude (46.03%) and GPT (43.02%), while the open-weight model Intern reached the highest disagreement with all the VLMs. Qwen has better agreement with proprietary models. These results suggest that contrast ev aluation remains particularly challenging for cross-model alignment. Analysis of individual model pairs re veals clusters of perceptual similarity and diver gence. GPT and Gemini demonstrate relatively strong agreement for contrast (10% disagreement), indicating a shared strate gy for ev aluating luminance-driv en attrib utes. In contrast, Grok and Intern div erge more strongly from the proprietary model clus- ter , suggesting different computational sensitivities to tonal structure and local contrast. Colorfulness ev aluations show slightly stronger agreement for certain model pairs. Claude and Qwen demonstrate the highest alignment (15.08% dis- agreement), whereas Gemini and Intern display substantial div ergence (51.43%). For Overall Preference, v ariability in- creases as models inte grate multiple perceptual cues into a single judgment. In particular , Grok consistently shows higher disagreement relativ e to the Claude–GPT–Gemini T able 3. Agreement between model predictions and human judgments. Each cell reports Spearman correlation ρ with 95% CI ( ρ [ l,u ] ) and mean scene-wise Spearman ( ρ s ), with T op-1 match ( ✓ : Y es and × : No) in parentheses. Model Colorfulness Contrast Overall Claude 0 . 93 [0 ., 1 . 00] / 0 . 80 ( × ) 0 . 54 [0 . 30 , 0 . 91] / 0 . 50 ( × ) 0 . 64 [0 . 34 , 0 . 86] / 0 . 54 ( × ) GPT 0 . 77 [0 . 46 , 0 . 96] / 0 . 63 ( × ) 0 . 75 [0 . 47 , 0 . 95] / 0 . 61 ( ✓ ) 0 . 86 [0 . 50 , 0 . 95] / 0 . 67 ( ✓ ) Gemini 0 . 11 [ − 0 . 14 , 0 . 59] / 0 . 21 ( × ) 0 . 79 [0 . 50 , 0 . 95] / 0 . 63 ( ✓ ) 0 . 54 [0 . 39 , 0 . 86] / 0 . 55 ( ✓ ) Grok 0 . 43 [ − 0 . 34 , 0 . 73] / 0 . 21 ( × ) 0 . 54 [ − 0 . 16 , 0 . 71] / 0 . 04 ( × ) 0 . 57 [0 . 39 , 0 . 91] / 0 . 38 ( ✓ ) Intern 0 . 92 [0 . 68 , 0 . 96] / 0 . 72 ( × ) 0 . 18 [ − 0 . 25 , 0 . 55] / 0 . 13 ( × ) 0 . 54 [0 . 07 , 0 . 59] / 0 . 24 ( × ) Qwen 0 . 93 [0 . 75 , 1 . 00] / 0 . 74 ( × ) 0 . 86 [0 . 43 , 0 . 93] / 0 . 52 ( ✓ ) 0 . 54 [0 . 35 , 0 . 89] / 0 . 52 ( × ) cluster , approaching 50% disagreement with Claude. For the Overall Preference scale, inter-model variabil- ity increases as models integrate multiple perceptual cues into a single judgment. GPT and Gemini show relatively stronger agreement, suggesting similar strategies for holis- tic quality ev aluation. Among the open-weight models, Qwen demonstrates comparati vely better alignment with proprietary models, indicating closer agreement in overall preference decisions. Overall, the analysis of inter-model consistency demon- strates that while colorfulness and overall preference are as- sessed with moderate agreement across models, contrast re- mains the attribute with the greatest disagreement, reflect- ing both human perceptual difficulty and the limitations of current VLM architectures. This finding underscores the importance of attrib ute-specific ev aluation when bench- marking VLMs on subjectiv e IQ tasks. 3.3. VLM-Human Alignment Analysis Agreement between psychophysical and VLMs predictions was measured using Spearman’ s rank correlation coeffi- cient ( ρ s ). For each perceptual scale (Contrast, Colorful- ness, and Overall Preference), psychophysical and VLMs z-scores were first aligned to include the same scenes and rendered images. The correlations were computed on im- age rendering model-le vel mean z-scores av eraged across scenes, rather than directly on raw scene-wise assessments. T o estimate uncertainty , bootstrap resampling over scenes was applied. In each iteration, scenes were sampled with replacement, the mean psychophysical and model render- ing vectors were recomputed, and Spearman’ s ρ was calcu- lated. The 95% confidence interval (CI) was obtained from the 2.5th and 97.5th percentiles of the bootstrap distribution. In addition to the ov erall correlation, we ev aluated scene- wise agreement by computing the Spearman correlation in- dependently for each scene between the psychophysical and VLMs z-scores. The mean scene-wise Spearman correla- tion ( ρ s ) was then reported as the av erage across all scenes. Finally , we measured T op-1 agreement, which indicates whether the rendering model with the highest mean score predicted by the model matches the highest mean score in the human data. T able 3 summarizes the agreement between model pre- dictions and human judgments across the three perceptual scales. Each entry reports the global Spearman correlation ( ρ ) with its 95% confidence interval, the mean scene-wise correlation ( ρ s ), and whether the model correctly predicts the T op-1 image rendering model. 3.3.1. Colorfulness Prediction For colorfulness prediction (T able 3 ), se veral models ex- hibit strong global agreement with human rankings (T a- ble 3 ). Claude and Qwen achieve the highest correlations ( ρ = 0 . 93 ), followed closely by Intern ( ρ = 0 . 92 ). These models also show relativ ely strong scene-wise agreement, with ρ s values between 0 . 72 and 0 . 80 . GPT demonstrates moderate alignment ( ρ = 0 . 77 ), while Grok ( ρ = 0 . 43 ) and Gemini ( ρ = 0 . 11 ) sho w sub- stantially weaker agreement with human colorfulness judg- ments. Notably , none of the models correctly identify the T op-1 image rendering model for colorfulness, indicating that although sev eral models capture general ranking trends, predicting the highest-ranked result remains challenging. 3.3.2. Contrast Prediction For contrast prediction, Qwen and Gemini sho w the strongest alignment with psychophysical data, achieving correlations of ρ = 0 . 86 and ρ = 0 . 79 , respecti vely . Both models also correctly identify the T op-1 image ren- dering model. GPT demonstrates similarly strong agree- ment ( ρ = 0 . 75 ) with consistent scene-wise performance ( ρ s = 0 . 61 ) and also matches the T op-1 selection. Claude and Grok exhibit moderate correlation with hu- man rankings ( ρ = 0 . 54 ), while Intern shows substantially weaker agreement ( ρ = 0 . 18 ), indicating limited consis- tency with human contrast perception. 3.3.3. Overall Prefer ence Prediction For overall aesthetic preference, GPT achieves the high- est agreement with human rankings (T able 3 ), reaching ρ = 0 . 86 with a scene-wise correlation of ρ s = 0 . 67 . GPT also correctly predicts the T op-1 image rendering model, indicating the strongest overall alignment with human per- ceptual judgments. Claude reaches ρ = 0 . 64 , while Grok and Gemini achieve ρ = 0 . 57 and ρ = 0 . 54 , respecti vely . Despite their moderate correlations, both Grok and Gemini correctly identify the T op-1 image rendering model. Intern and Qwen show similar global correlations ( ρ = 0 . 54 ) but lower scene-wise agreement and f ail to predict the T op-1 result. 3.4. Attribute W eighting Regression T o analyze ho w ov erall preference assessments correlate with other attributes and whether the VMLs correlate with human perception to ev aluate IQ, we modeled preference as a linear combination of contrast and colorfulness using standardized linear regression: z ( Overall ) = αz ( Contrast ) + β z ( Colorfulness ) (1) where the coefficients α and β represent the relative con- tributions of contrast and colorfulness, respectively . Each regression was performed using matched observations for each (scene, image rendering model) pair to ensure that pre- dictors correspond to the same rendered image rather than rank position. Fig. 2 visualizes the resulting coefficients for humans and VLMs. Human judgments place greater weight on col- orfulness than contrast, indicating that percei ved color rich- ness plays a stronger role than contrast when forming over - all preference ratings. Most of the VLMs exhibit similar attribute reliance. Qwen, Gemini, and Intern show strong weighting to ward colorfulness with relatively smaller contrast contributions, positioning them close to the human weighting pattern along the colorfulness axis. Claude also follows this trend but with slightly more balanced contributions from both attributes. In contrast, GPT assigns substantially higher weight to contrast while maintaining moderate sensiti vity to colorfulness, indicating a more balanced b ut contrast- leaning strategy . Grok shows the most distinct behavior , relying heavily on contrast while assigning minimal weight to colorfulness. Models positioned closer to the human point reflect more human-like weighting of contrast and colorfulness in form- ing ov erall image preference ev aluation. 3.5. Per ceptual Separability Analysis T o analyze how psychophysical data varies with scene per- ceptual separability , we compute a scene-lev el separability score from human judgments and relate it to scene-wise agreement VLMs. For each perceptual scale and scene s , let h s = [ h s ( t 1 ) , . . . , h s ( t K )] denote the v ector of psychophysical z -scores across the K rendering models, and let m s = [ m s ( t 1 ) , . . . , m s ( t K )] denote the corresponding VLMs Z- score vector . 0.0 0.1 0.2 0.3 0.4 0.5 0.6 0.7 Standardized Contrast weight (α) 0.0 0.2 0.4 0.6 0.8 Standardized Colorfulness weight (β) Human Claude Gemini GPT Grok Intern Qwen Figure 2. Attrib ute weighting for ov erall preference. The x-axis represents the contrast weight ( α ) and the y-axis represents the colorfulness weight ( β ). Scene perceptual separability is deri ved from the spread of psychophysical scores across image rendering models. Separability is defined as the SD of the psychophysical scores i.e., d ( s ) = SD( h s ) . A lar ger v alue of d ( s ) indicates that human observ ers more clearly dif ferentiate the tone- mapping operators for scene s , whereas a smaller value in- dicates that the operators are perceiv ed more similarly . The agreement for scene s is measured using Spearman’ s rank correlation: a ( s ) = ρ ( h s , m s ) . (2) Giv en the set of scenes S , we compute the separability values { d ( s ) : s ∈ S } and partition them into N = 500 quantile bins. Let the bin edges be q 0 < q 1 < · · · < q N , (3) where q i is the i/ N quantile of the empirical separability distribution. The n -th bin is then defined as B n = ( { s ∈ S | q n − 1 ≤ d ( s ) < q n } , n < N , { s ∈ S | q N − 1 ≤ d ( s ) ≤ q N } , n = N . (4) For each separability bin, we report the mean scene-wise agreement ¯ a n and the corresponding mean separability ¯ d n : ¯ a n = 1 |B n | X s ∈B n a ( s ) , ¯ d n = 1 |B n | X s ∈B n d ( s ) . (5) Plotting ¯ a n as a function of ¯ d n yields the separability- aware agreement curv e for each model. T o estimate uncertainty , we bootstrap scenes with re- placement. For each bootstrap replicate b , scenes are re- sampled, and the bin-wise mean agreement is recomputed 0.9 1.0 1.1 1.2 Perceptual Separability −1.00 −0.75 −0.50 −0.25 0.00 0.25 0.50 0.75 1.00 Agreement (Spearman ρ ) Claude Gemini GPT Grok InternVL-38B Qwen3-VL -32B (a) 0.70 0.75 0.80 0.85 0.90 0.95 1.00 1.05 Perceptual Separability −1.00 −0.75 −0.50 −0.25 0.00 0.25 0.50 0.75 1.00 Agreement (Spearman ρ ) Claude Gemini GPT Grok InternVL-38B Qwen3-VL -32B (b) 1.000 1.025 1.050 1.075 1.100 1.125 1.150 1.175 1.200 Perceptual Separability −1.00 −0.75 −0.50 −0.25 0.00 0.25 0.50 0.75 1.00 Agreement (Spearman ρ ) Claude Gemini GPT Grok InternVL-38B Qwen3-VL -32B (c) Figure 3. Mean scene agreement (Spearman) as a function of scene difficulty for (a) colorfulness, (b) contrast, and (c) o verall preference. as ¯ a ( b ) n . The 95% confidence interv al for each bin is ob- tained from the 2.5th and 97.5th percentiles of the bootstrap distribution: CI 95% (¯ a n ) = h Q 0 . 025 { ¯ a ( b ) n } B b =1 , Q 0 . 975 { ¯ a ( b ) n } B b =1 i . (6) Fig. 3 shows the mean scene-wise agreement as a func- tion of scene perceptual separability for the three perceptual scales. For the Contrast scale, GPT giv es the highest agreement with human rankings and reaches its best performance at the higher separability levels, where the agreement approaches ρ ≈ 0 . 8 . Gemini also shows relatively strong agreement across most separability bins, while Claude and Qwen re- main at a moderate level around ρ ≈ 0 . 4 – 0 . 6 . In con- trast, Grok fails to capture the human ranking for most bins, showing near-zero or negativ e agreement at intermediate separability le vels ( ρ ≈ − 0 . 1 ). Intern also performs weak er than the leading models and drops to near-zero agreement at the highest separability bin. For Colorfulness, the agreement is generally higher and more stable across models. Claude, GPT , and Qwen main- tain strong alignment with human judgments across most separability bins, with agreement values around ρ ≈ 0 . 7 – 0 . 9 . Gemini performs poorly at the lo west separability level ( ρ ≈ − 0 . 1 ) but improves steadily as separability increases. Grok again fails to reproduce human rankings, remaining low across the range with agreement around ρ ≈ 0 . 1 – 0 . 2 . Intern shows moderate agreement ( ρ ≈ 0 . 5 – 0 . 7 ) but does not reach the performance of the best models. For Overall Preference, the agreement patterns sho w greater variability across separability bins. Claude and GPT maintain relativ ely strong agreement across the range, gen- erally around ρ ≈ 0 . 5 – 0 . 7 . Gemini also sho ws moderate performance with slight improvement toward higher sepa- rability . Qwen produces lo wer b ut consistent agreements around ρ ≈ 0 . 3 – 0 . 4 . Intern’ s agreement drops to approx- imately ρ ≈ − 0 . 2 at intermediate separability le vels, in- dicating difficulty reproducing human rankings when per- ceptual dif ferences are neither clearly pronounced nor com- pletely ambiguous. This instability suggests that the model may rely on different cues compared to humans, leading to negati ve correlation. Grok again demonstrates weak per- formance, with agreement remaining belo w ρ ≈ 0 . 4 and fluctuating across bins. 4. Discussion 4.1. Cross-Attrib ute Model Beha vior The attrib ute-specific performance patterns observed across models re veal notable differences in how VLMs capture perceptual image attributes (T able 3 ). Qwen demonstrates the strongest contrast assessment correlation ( ρ = 0 . 86 ) and also achie ves very high correlation for colorfulness ( ρ = 0 . 93 ), but shows weak er agreement for overall prefer - ence ( ρ = 0 . 54 ), suggesting difficulty integrating multiple perceptual cues into a holistic quality judgment. GPT shows the most balanced performance across at- tributes, achieving strong correlation for contrast ( ρ = 0 . 75 ) and the highest agreement for overall preference ( ρ = 0 . 86 ), while maintaining moderate alignment for colorful- ness ( ρ = 0 . 77 ). This indicates relatively stable perceptual modeling across different visual attrib utes. Claude and Intern demonstrate strong alignment with hu- man colorfulness rankings ( ρ = 0 . 93 and ρ = 0 . 92 , re- spectiv ely), but weaker performance for contrast and overall preference. Intern shows very limited correlation for con- trast ( ρ = 0 . 18 ) and only moderate agreement for over - all preference ( ρ = 0 . 54 ), suggesting that its predictions rely more strongly on chromatic cues than luminance-based contrast differences. In contrast, Gemini sho ws strong contrast prediction ( ρ = 0 . 79 ) b ut very weak colorfulness correlation ( ρ = 0 . 11 ), suggesting a stronger reliance on luminance cues than chromatic information. Despite this limitation, Gemini achiev es moderate agreement for o verall preference ( ρ = 0 . 54 ), indicating that some perceptual aspects beyond col- orfulness may still be captured. Grok exhibits moderate but inconsistent agreement across attributes ( ρ = 0 . 43 – 0 . 57 ), with relati vely low scene-wise correlations, indicating limited but some what stable perceptual alignment. 4.2. VLM vs. Human Alignment T rade-offs An intriguing pattern emerges when comparing intra-model variability with human alignment. Claude exhibits the high- est internal consistency , with very lo w variability across at- tributes (1.90% VR for contrast, 0.95% for colorfulness, and 1.27% for overall preference), yet shows only moder- ate correlation with human contrast judgments ( ρ = 0 . 54 ). This suggests Claude produces highly stable but poten- tially biased perceptual assessments. Con versely , GPT demonstrates higher intra-model v ariability (4.44–8.89% VR across attributes) while achieving strong human align- ment, particularly for overall preference ( ρ = 0 . 86 ). This trade-off suggests that some degree of response variability may capture the inherent conte xt dependence of human per - ceptual judgments. This finding has important implications for using VLMs to e v aluate nov el image processing algorithms: models that produce highly stable predictions may still deviate system- atically from human perception, whereas models with mod- erate variability may better reflect scene-dependent percep- tual cues. Consequently , VLMs may under- or over -rate al- gorithms that optimize for human perceptual preferences in ways that differ from patterns learned during model train- ing. 4.3. Implications for IQA These observations underscore the importance of multi- attribute ev aluation frameworks when benchmarking VLMs for perceptual IQA tasks. VLMs may capture individual perceptual attributes effecti vely while still struggling to re- produce holistic human judgments. Moreo ver , the scene- dependent effects observ ed in the separability analysis sug- gest that ev aluation datasets should include div erse percep- tual conditions to properly assess model reliability across varying visual contexts. For practical applications, our re- sults suggest that: • VLMs ar e most r eliable for rapid hypothesis testing : Their moderate-to-strong correlations with human judg- ments make them useful for the screening of images if the difference between two images is relatively high. Psy- chophysical validation remains necessary for final per- ceptual quality assessment. • Attribute-awar e evaluation is necessary : Since model performance v aries across contrast, colorfulness, and ov erall preference, conclusions about perceptual quality should not rely on a single aggregate score. • Scene conte xt matters : Agreement generally increases for scenes with greater perceptual separability , indicating that VLM-based IQA is more dependable when perceptual differences between images are clearly expressed and less reliable when scene-dependent differences are subtle. • Limitations : – The reported VLM behavior depends on the specific prompt design and model/API versions used in this study . Different prompting strategies, decoding set- tings, or future model updates may lead to different assessment patterns. – The findings reflect model behavior for the API v er- sions av ailable d uring Jan–Feb 2026, and performance may change as models are updated. – The results for other attributes such as sharpness, nat- uralness, or visible artifacts were not explicitly ev alu- ated. 5. Conclusion This w ork benchmark ed six VLMs against psychophysi- cal ground truth across contrast, colorfulness, and ov er- all preference, rev ealing attribute-dependent performance with practical implications for perceptual IQA pipelines. Human–VLM alignment v aries substantially across models and attributes: GPT demonstrates the most balanced cross- attribute performance and highest overall preference agree- ment ( ρ = 0 . 86 ), while Claude and Qwen lead for color - fulness ( ρ = 0 . 93 each) and Qwen also achiev es strong contrast alignment ( ρ = 0 . 86 ). Howe ver , no current VLM uniformly captures the full range of perceptual dimensions relev ant to IQA. Three further findings carry practical significance. The high intra-model consistency does not imply strong hu- man alignment: Claude produces highly stable predictions yet diver ges systematically from human contrast judgments, while moderately variable models such as GPT align more closely with human rankings. The attribute weighting anal- ysis rev eals that most VLMs also assign different weights to image quality scales while performing ov erall image qual- ity preference, similar to human behavior . Furthermore, hu- man–VLM agreement also increases with perceptual sepa- rability , confirming that VLM-based e v aluation is most de- pendable when stimulus differences are clearly expressed and least reliable for fine-grained perceptual distinctions. These results indicate that VLMs can support rapid screening and exploratory ev aluation in perceptual IQA workflo ws, howe ver , current VLMs are not yet capable of substituting psychophysical experiments for rigorous per- ceptual ev aluation. Future work should examine whether ensemble approaches or fine-tuning on psychophysical data can close the gap with human judgment. References [1] Alibaba. QwenVL3 (Jan 2026 version) [V ision Language Model], 2026. Accessed Feb 24, 2026. 3 [2] Anthropic. Claude Opus 4.6 (2026 version) [Large Language Model], 2026. Accessed Feb 13, 2026. 3 [3] Roy S. Berns. Methods for characterizing crt displays. Dis- plays , 16(4):173–182, 1996. 2 [4] Y uming Fang, Kede Ma, Zhou W ang, W eisi Lin, Zhijun Fang, and Guangtao Zhai. No-reference quality assessment of contrast-distorted images based on natural scene statistics. IEEE Signal Pr ocessing Letters , 22(7):838–842, 2014. 1 [5] Deepti Ghadiyaram and Alan C Bovik. Perceptual quality prediction on authentically distorted images using a bag of features approach. Journal of vision , 17(1):32–32, 2017. 1 [6] Google. Gemini 3.1 Pro (Gemini) [Large Language Model]. https : / / deepmind . google / technologies / gemini/ , 2026. Accessed Feb 14, 2026. 3 [7] International T elecommunication Union. Methodologies for the subjecti ve assessment of the quality of television images. T echnical report, International T elecommunication Union, 2020. 2 [8] Shinobu Ishihara. Ishihara’ s test for colour-blindness . Kane- hara Shuppan Company , 1985. 2 [9] I. R. Khan, W . Aziz, and S.-O. Shim. T one-mapping using perceptual-quantizer and image histogram. IEEE Access , 8: 31350–31358, 2020. 2 [10] Hui Li, Xixi Jia, and Lei Zhang. Clustering based content and color adaptive tone mapping. Computer V ision and Im- age Under standing , 168:37–49, 2018. 2 [11] Z. Liang, J. Xu, D. Zhang, Z. Cao, and L. Zhang. A hybrid l1-l0 layer decomposition model for tone mapping. In Pr o- ceedings of the IEEE Conference on Computer V ision and P attern Recognition , pages 4758–4766, 2018. 2 [12] M. R. Luo. Cie division 8: A servant for the imaging in- dustry . In Color Science and Imaging T echnolo gies , pages 51–55, 2002. 2 [13] Calvin S McCamy , Harold Marcus, James G Davidson, et al. A color-rendition chart. J. App. Photog. Eng , 2(3):95–99, 1976. 2 [14] Imran Mehmood, Xiaoxuan Liu, Muhammad Usman Khan, and Ming Ronnier Luo. Method for dev eloping and using high quality reference images to ev aluate tone mapping op- erators. Journal of the Optical Society of America A , 39(6): B11–B20, 2022. 1 [15] Imran Mehmood, Xinye Shi, Muhammad Usman Khan, and Ming Ronnier Luo. Perceptual tone mapping model for high dynamic range imaging. IEEE Access , 11:110272–110288, 2023. 2 , 3 , 4 [16] Laurence Meylan and Sabine S ¨ usstrunk. High dynamic range image rendering with a retinex-based adaptive filter . IEEE T ransactions on Image Pr ocessing , 15(9):2820–2830, 2006. 2 [17] Anish Mittal, Anush Krishna Moorthy , and Alan Conrad Bovik. No-reference image quality assessment in the spatial domain. IEEE T ransactions on image pr ocessing , 21(12): 4695–4708, 2012. 1 [18] OpenAI. GPT -5.2 (GPT) [Large Language Model], 2025. Accessed Feb 14, 2026. 3 [19] OpenGVLab. InternVL-3.5-38B ((Jan 2026 version)) [V ision-Language Model], 2025. Accessed Feb 20, 2026. 3 [20] Erik Reinhard, Michael Stark, Peter Shirley , and James Fer- werda. Photographic tone reproduction for digital images. In Pr oceedings of the 29th Annual Conference on Computer Graphics and Interactive T echniques , pages 267–276, 2002. 2 [21] Christophe Schlick. Quantization techniques for visualiza- tion of high dynamic range pictures. In Photorealistic Ren- dering T echniques , pages 7–20. Springer , 1995. 2 [22] L. L. Thurstone. A law of comparative judgment. Psycho- logical Revie w , 34(4):273–286, 1927. 3 [23] xAI. Grok-4.1 (Grok) [Large Language Model], 2026. Ac- cessed Feb 14, 2026. 3 [24] Jingtao Xu, Peng Y e, Qiaohong Li, Haiqing Du, Y ong Liu, and David Doermann. Blind image quality assessment based on high order statistics aggregation. IEEE T ransactions on Image Pr ocessing , 25(9):4444–4457, 2016. 1 [25] Wufeng Xue, Xuanqin Mou, Lei Zhang, Alan C Bovik, and Xiangchu Feng. Blind image quality assessment using joint statistics of gradient magnitude and laplacian features. IEEE T ransactions on Image Pr ocessing , 23(11):4850–4862, 2014. 1
Original Paper
Loading high-quality paper...
Comments & Academic Discussion
Loading comments...
Leave a Comment