i-IF-Learn: Iterative Feature Selection and Unsupervised Learning for High-Dimensional Complex Data
Unsupervised learning of high-dimensional data is challenging due to irrelevant or noisy features obscuring underlying structures. It's common that only a few features, called the influential features, meaningfully define the clusters. Recovering the…
Authors: Chen Ma, Wanjie Wang, Shuhao Fan
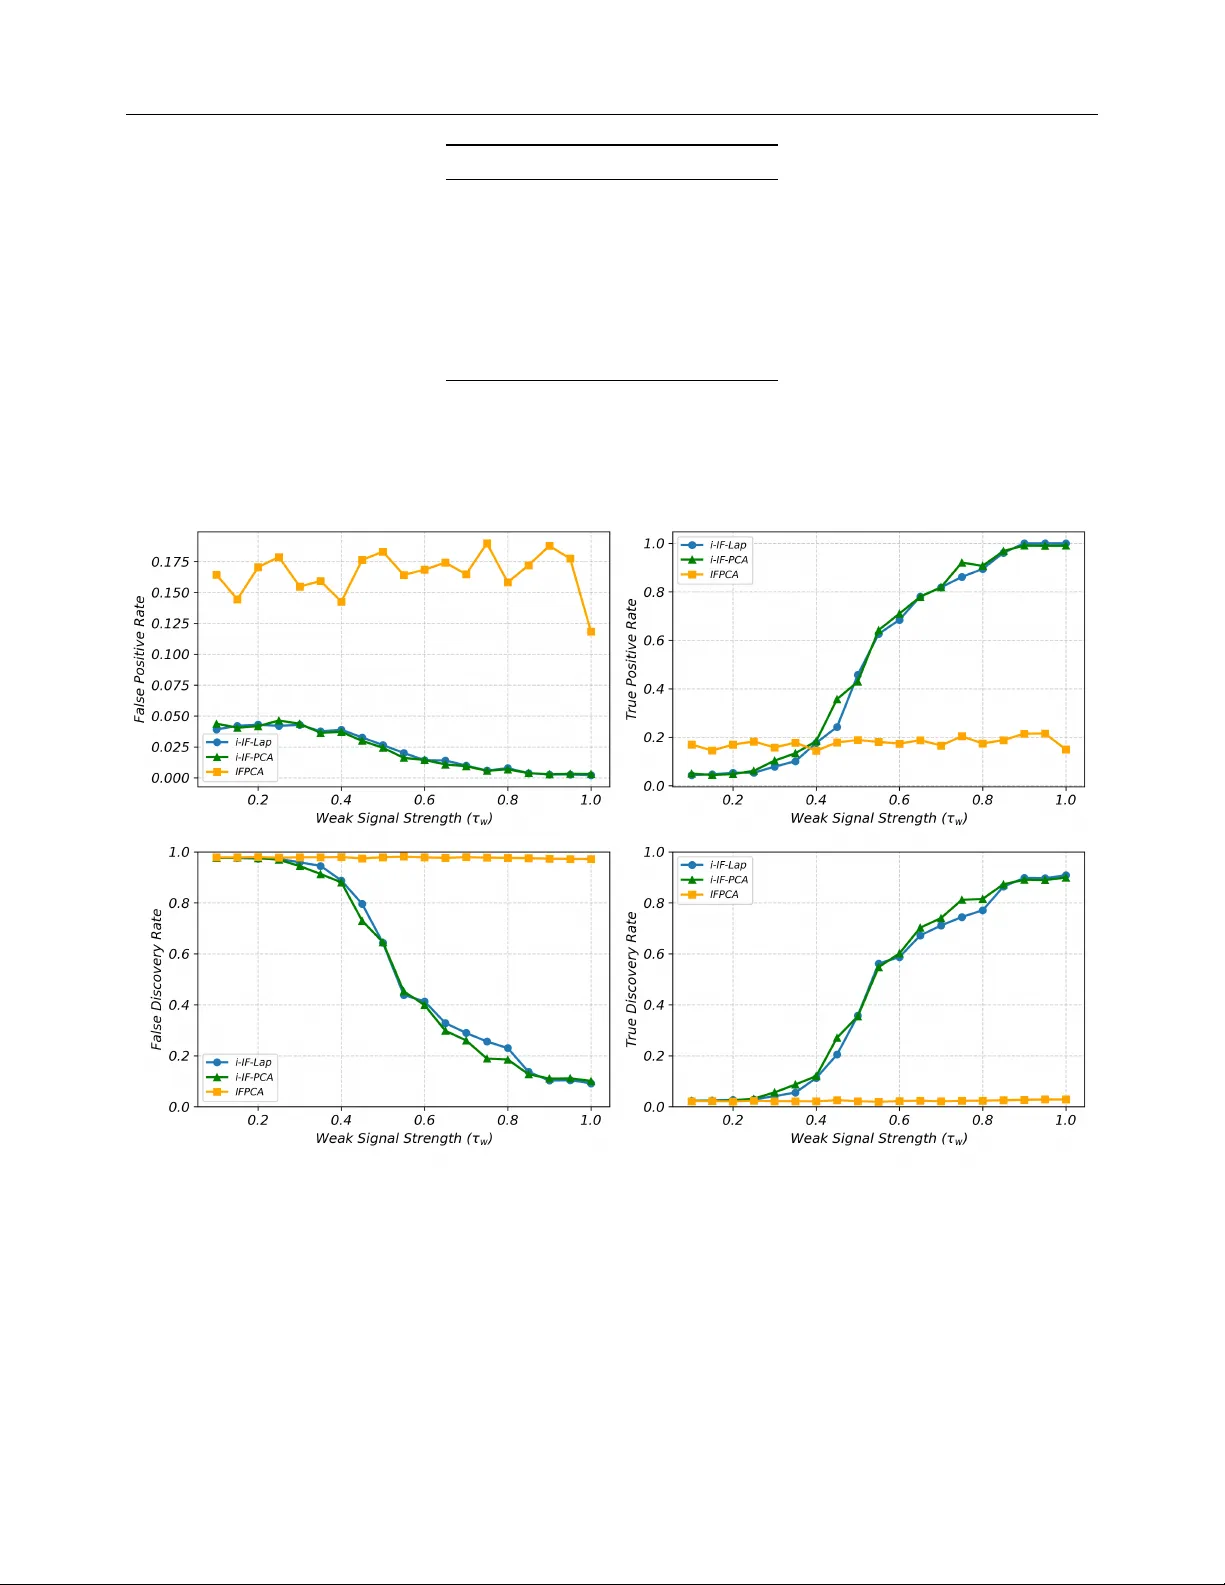
i-IF-Learn: Iterativ e F eature Selection and Unsup ervised Learning for High-Dimensional Complex Data Chen Ma W anjie W ang Sh uhao F an SUST ech NUS NUS Abstract Unsup ervised learning of high-dimensional data is c hallenging due to irrelev ant or noisy features obscuring underlying structures. It’s common that only a few features, called the influen tial features, meaningfully define the clusters. Reco vering these influen tial features is helpful in data in terpretation and clustering. W e prop ose i-IF-L e arn , an iterativ e unsup er- vised framew ork that join tly p erforms feature selection and clustering. Our core inno v a- tion is an adaptive feature selection statis- tic that effectiv ely combines pseudo-lab el su- p ervision with unsup ervised signals, dynam- ically adjusting based on intermediate lab el reliabilit y to mitigate error propagation com- mon in iterative frameworks. Leveraging low- dimensional embeddings (PCA or Laplacian eigenmaps) follow ed by k -means, i-IF-Learn sim ultaneously outputs influen tial feature sub- set and clustering lab els. Numerical exp er- imen ts on gene microarray and single-cell RNA-seq datasets sho w that i-IF-Learn signif- ican tly surpasses classical and deep clustering baselines. F urthermore, using our selected influen tial features as prepro cessing substan- tially enhances do wnstream deep mo dels such as DeepCluster, UMAP , and V AE, highlight- ing the importance and effectiveness of tar- geted feature selection. 1 In tro duction Unsup ervised learning, or clustering, is a fundamental learning task in v arious domains, including computer vision, natural language pro cessing, and biomedical data analysis. Supp ose X i ∈ R p are observ ed, 1 ≤ Pro ceedings of the 29 th In ternational Conference on Arti- ficial Intelligence and Statistics (AIST A TS) 2026, T angier, Moro cco. PMLR: V olume 300. Cop yright 2026 by the au- thor(s). i ≤ n , eac h with a dimension of p . Clustering is to reco ver a label vector ℓ ∈ { 1 , · · · , K } n , which reveals the hidden group structure of these n data points. Unlik e sup ervised learning, there is no prior knowledge of ℓ and direct optimization metho ds are not a v ailable. No wada ys, researchers are facing c hallenges of complex data. F or example, the feature dimension is muc h larger than the sample size, i.e., p ≫ n , but many features ma y be irrelev an t or ev en misleading for clustering. Simply applying a clustering algorithm on all dimen- sions often results in p oor p erformance due to the curse of dimensionality ( Donoho et al. , 2000 ; Elman et al. , 2020 ). The features related to the intrinsic structure, whic h we call the influential features, are comparatively sparse. A feature selection step is critical. It identifies these influential features, which offers insights in the dataset and scientific problem. F urthermore, clustering metho ds can b e applied on these influential features. Ev en with a correct set of influential features, reco v- ering the label v ector ℓ remains difficult due to com- plex dep endencies and low signal-to-noise ratios. Low- dimensional embedding metho ds ( Belkin and Niy ogi , 2003 ; McInnes et al. , 2020 ; Kingma and W elling , 2013 ) can extract the manifold structure and suppress noise. Incorp orating these embeddings into the clustering step should enhance p erformance. An iterative framework app ears particularly promising, where estimated lab els from previous iterations guide subsequen t rounds of feature selection and clustering. Ho wev er, iterative approaches face inh eren t challenges: early clustering errors may propagate, p oten tially rein- forcing misleading patterns. Balancing the exploitation of early insights with safeguards against error propaga- tion is thus essen tial. 1.1 Related W ork Clustering has b een widely studied, with classical al- gorithms such as k -means ( Hartigan and W ong , 1979 ), DBSCAN ( Ester et al. , 1996 ), and sp ectral clustering ( Lee et al. , 2010 ). While effective in low dimensions, these metho ds are sensitive to irrelev ant features in i-IF-Learn: Iterative F eature Selection and Unsup ervised Learning for High-Dimensional Complex Data high-dimensional data. T o mitigate this, unsup ervised feature selection approaches hav e b een developed, see surv eys ( Li et al. , 2017 ; Zhao et al. , 2019 ). F or example, sparse k -means ( Witten and Tibshirani , 2010 ; Zhang et al. , 2020 ) incorp orates feature weigh ting, whereas Influen tial F eatures PCA (IFPCA) ( Jin et al. , 2017 ; Jin and W ang , 2016 ) and IF V ariational Auto-Enco der (IFV AE) ( Chen et al. , 2023 ) integrate feature screening with clustering. Metho ds without explicit feature selection hav e also b een prop osed; see Kiselev et al. ( 2017 ); Satija et al. ( 2015 ). Examples include manifold fitting ( Y ao et al. , 2024 ), deep learning-based clustering metho ds ( Li et al. , 2020a ; Svirsky and Lindenbaum , 2024 ), and latent rep- resen tation approac hes ( Jiang et al. , 2017 ). These approac hes fo cus on data reconstruction or latent rep- resen tations. How ever, such metho ds cannot provide a direct understanding of the original features. Recen t w orks address interpretabilit y through differentiable feature selection ( Lindenbaum et al. , 2021 ; Lee et al. , 2022 ; Upadhy a and Cohen , 2024 ; Qiu et al. , 2024 ), un- der the assumptions of dense features, semi-sup ervised settings, scenarios where n ≫ p or sp ecific tpy e of data. F urthermore, several adv anced clustering frameworks ( Eisen b erg et al. , 2025 ; Li et al. , 2020b ; Qiu et al. , 2024 ) demand supplemen tary information. Recen tly , there has b een significan t in terest in iter- ativ e clustering framew orks. Deep clustering meth- o ds such as DEC ( Xie et al. , 2016 ) and DeepCluster ( Caron et al. , 2018 ) iteratively refine neural embeddings and cluster assignmen ts, ac hieving strong empirical results in large-scale image and text datasets. Ho w- ev er, these neural netw ork-based metho ds often lack in terpretability , limiting their utility in domains like genomics, where feature relev ance insights are crucial. Metho ds like IDC ( Svirsky and Lindenbaum , 2024 ) and CLEAR ( Han et al. , 2022 ) are also designed to impro ve interpretabilit y , incorp orated feature selection in to clustering frameworks. Outside the clustering context, feature selection in an unsup ervised setting is also of great interest ( W u and Cheng , 2021 ; Boutemedjet et al. , 2007 ) to understand the data. Algorithms suggest that clustering lab els could guide on feature selection ( Boutsidis et al. , 2009 ; Linden baum et al. , 2021 ). Ho wev er, these methods p erform feature selection indep enden tly from clustering, missing opp ortunities for iterative joint refinement. 1.2 Our Con tribution W e prop ose the iterative Influential F e atures Learning ( i-IF-Learn ) framework, explicitly designed for joint feature selection and clustering in high-dimensional, noisy datasets. Our approach integrates adaptive fea- ture selection directly into the clustering pip eline, iter- ativ ely improving b oth clustering accuracy and feature in terpretability . Our main contributions include: • W e introduce a nov el comp osite statistic that adap- tiv ely balances sup ervised (pseudo-lab el-based) and unsup ervised statistics for feature selection. Based on the reliability of the pseudo-lab els, our statistic dynamically adjusting the reliance on them to mitigate error propagation in iterativ e clustering framew orks. • W e develop tw o embedding-based clustering v ari- an ts within our framework, i-IF-PCA and i-IF- Lap, emplo ying PCA and Laplacian eigenmaps, resp ectiv ely . Empirical results indicate sup erior p erformance of nonlinear embeddings (i-IF-Lap), highligh ting the b enefits of capturing complex man- ifold structures. • Our metho d simultaneously outputs cluster lab els and an interpretable set of influential features. This feature subset substantially enhances down- stream analyses, improving the clustering p erfor- mance of state-of-the-art metho ds like DeepClus- ter, UMAP , and V AE when used as prepro cessing. • W e establish consistency results for b oth lab el re- co very and feature selec tion under a weak signal mo del. Exp erimen ts on microarra y and single-cell RNA-seq datasets show sup erior p erformance ov er classical and deep clustering methods. F urther- more, i-IF-Lap+deep clustering metho ds leads to significan t improv ements. Figure 1: Eigenv ector pro jection of data p oints in 3D space using three clustering pip elines. T o illustrate the effect of iteration and em b edding c hoice, we analyze SRBCT dataset using three meth- o ds: (a) IFPCA, a non-iterative baseline( Jin and W ang , 2016 ); (b) i-IF-PCA, our iterative v ariant using PCA; and (c) i-IF-Lap, using Laplacian eigenmaps for non- linear embedding. Figure 1 displays the resulting 3D em b eddings by these metho ds, colored b y ground-truth lab els. With the iteration step, b oth i-IF-PCA and i-IF-Lap hav e a b etter embedding than IFPCA. F ur- ther, due to the nonlinear prop ert y of gene microarray Chen Ma, W anjie W ang, Shuhao F an data, i-IF-Lap using a Laplacian eigenmap embedding p erforms b etter than i-IF-PCA. The comparison shows that b oth iteration and nonlinear embeddings substan- tially improv e cluster separation. More comprehensive n umerical results can b e found in Sections 4 and 5 . 1.3 Organization W e first introduce our i-IF-Learn framework in Section 2 with technical details. In Section 3 , we introduce the mo del and theoretical results. Numerical results can b e found in Section 4 on real data sets and Sec tion 5 on synthetic data. Proofs, implemen tation details, and data description are left to the app endix. 2 Algorithm: Iterativ e High-Dimensional Clustering Consider the data matrix X ∈ R n × p , where each ro w is X i ∈ R p with a high dimension p . F or eac h data point, the lab el is denoted as ℓ i ∈ [ K ] for a kno wn constant K , where K is the n umber of clus- ters. Denote I to b e the set of these influen tial fea- tures, where I = { 1 ≤ j ≤ p : E [ X ij | ℓ i = k 1 ] = E [ X ij | ℓ i = k 2 ] , for some 1 ≤ k 1 = k 2 ≤ K } , k 1 and k 2 represen t tw o arbitrary distinct cluster lab els in the set { 1 , . . . , K } . It means if there are tw o clusters with differen t exp ectations on this feature, then this feature if influential feature. W e aim to recov er b oth the latent cluster lab els ℓ and the set of influential features I that driv e the clustering structure. W e prop ose the i-IF-Learn algorithm, an iterative clus- tering framework with an initialization stage and an iterativ e refinemen t lo op, as illustrated in Figure 2 . The initialization stage recov ers relatively strong sig- nals with a noisy clustering lab el, and the iterativ e lo op further recov ers the weak signals and refines the clustering assignments. It is outlined as Algorithm 1 . In Sections 2.1 – 2.5 , we explain the idea of each step. The complete algorithm with ev ery implementation detail can b e found in Algorithm 4 in App endix. Figure 2: Overview of the i-IF-Learn framework. Algorithm 1 i-IF-Learn Algorithm Require: Data matrix X ∈ R n × p , num b er of clusters K , maxim um iterations T Ensure: Clustering lab els ˆ ℓ , selected features ˆ I . Stage 1: Initialization Require: Data X ∈ R n × p , n umber of clusters K Ensure: Initial pseudo-lab els ℓ (0) and feature set I (0) Stage 2: Iterative Lo op 1: for t = 1 , 2 , . . . do 2: Step 1: F or each feature j , compute score S ( t ) j based on ℓ ( t − 1) , set Higher Criticism threshold τ ( t ) , and up date I ( t ) = { 1 ≤ j ≤ p : S j ≥ τ ( t ) } . 3: Step 2: Construct the p ost-selection data matrix X ( t ) = X ( I ( t ) ) , p erform low-dimensional em b edding to obtain U ( t ) , and run k -means on U ( t ) to get ℓ ( t ) . 4: Step 3: Compute influential feature change ratio r = r ( I ( t − 1) , I ( t ) ) . 5: if r ≤ 10% or t = T then 6: break 7: end if 8: end for 9: ˆ ℓ = ℓ ( t ) , ˆ I = I ( t ) . In IF step, due to the large p , we employ a ranking and thresholding pro cedure for computation efficiency . F or each feature j , w e prop ose a comp osite score S ( t ) j = ω ( t ) T sup j ( ℓ ( t − 1) ) + (1 − ω ( t ) ) T unsup j , (1) where T sup j ( ℓ ( t − 1) ) is a pseudo-label-sup ervised test statistic and T unsup j is an unsup ervised statistic. The w eight for the sup ervised statistic is defined as ω ( t ) = w ( t ) p ( w ( t ) ) 2 + (1 − w ( t ) ) 2 , (2) where w ( t ) reflects the reliability of the lab el estimates ℓ ( t − 1) , and (1 − ω ) corresp ondingly represents the w eight assigned to the unsup ervised statistic. W e then compute p -v alues based on S ( t ) j and apply Higher Criticism thresholding (HCT) to obtain the up dated influential feature set I ( t ) . This pro cedure is en tirely data-driven and requires no tuning parameters; details are in Sections 2.2 – 2.3 . In the Learn step, w e p erform lo w-dimensional em- b edding of X ( I ( t ) ) on the selected features I ( t ) . The algorithm has v arian ts dep ending on the selection of em b edding metho ds. W e call it i-IF-PCA when PCA is employ ed for embedding and i-IF-Lap when Lapla- cian eigemap is used for embedding. T o capture the lo w-dimensional manifold structure, i-IF-Lap usually p erforms b etter. K -means clustering is then applied to the embedded data to generate up dated lab els ℓ ( t ) . i-IF-Learn: Iterative F eature Selection and Unsup ervised Learning for High-Dimensional Complex Data The algorithm contin ues until the feature set I ( t ) sta- bilizes or a maxim um num b er of iterations is reached. The final outputs are the estimated lab els ˆ ℓ = ℓ ( T ) and influen tial feature set ˆ I = I ( T ) . The initialization step has a computation cost of O ( n + ns ) where s is the num b er of selected features. F or every iteration, the complexit y for S j is O ( n ) and for clustering is O ( n 2 s ) . Therefore, the ov erall computation complexity is O ( T n 2 s ) , where T is the num b er of iterations, n is the sample size and s is the num b er of selected features. By the iterativ e framew ork, i-IF-Learn reco vers fea- tures with b oth the relativ ely strong signals and weak signals. T o illustrate the effectiveness of ˆ I , we apply m ultiple clustering metho ds to data restricted on ˆ I to get the cluster lab els, instead of the estimated lab els b y i-IF-Lap itself. In numerical analysis, we consider UMAP , DeepCluster, and V AE as the do wnstream clustering metho ds, and all of them hav e a significant impro vemen t in clustering. It further prov es that our algorithm provides interpretable results that deep ens our understanding of data. 2.1 Initialization The i-IF-Learn algorithm b egins with an initialization step to estimate the initial cluster lab els ℓ (0) and the influen tial feature set I (0) . While our theoretical guar- an tees allow for any reasonable initialization, we adopt the IFPCA metho d ( Jin and W ang , 2016 ) for tw o main reasons. First, IFPCA has demonstrated strong th eo- retical and empirical p erformance in high-dimensional clustering. It reliably identifies features with relatively strong signals and pro duces stable clustering labels. Second, our iterative pro cedure leverages b oth T sup and T unsup . The unsup ervised comp onent T unsup co- incides with the IF step in IFPCA, reducing the com- putation cost. The IFPCA pro cedure is summarized in Algorithm 2 , with implementation details deferred to Algorithm 3 in App endix. 2.2 No vel Iterativ e Screening Statistic A key ingredient in the IF step is the score statistic S ( t ) j , whic h determines how relev ant each feature is to the underlying structure. Unlike traditional screening metho ds that rely solely on either sup ervised or unsu- p ervised tests, we introduce a new comp osite statistic that adaptiv ely combines b oth sources of information as follo ws: S ( t ) j = ω ( t ) Φ − 1 (1 − P ( t ) F,j ) + (1 − ω ( t ) )Φ − 1 (1 − P K S,j ) . (3) Here, T sup j ( ℓ ( t − 1) ) = Φ(1 − P ( t ) F,j ) denotes the super- vised test statistic and T unsup j = Φ − 1 (1 − P K S,j ) de- Algorithm 2 IFPCA Initialization Pro cedure Require: Data X ∈ R n × p , n umber of clusters K Ensure: Initial lab els ℓ (0) , influen tial feature set I (0) 1: Step 1 : Compute unsup ervised test scores ψ n,j ← K olmogorov e-Smirnov score b et ween the empirical CDF of x j and normal CDF. Normalize scores: ψ ∗ n,j ← ψ n,j − mean ( ψ n, · ) std ( ψ n, · ) 2: Step 2 : F eature selection by HCT π j ← 1 − F 0 ( ψ ∗ n,j ) , where F 0 is the null distribution. H C j ← a function based on π j 3: ˆ j ← arg max j H C p,j , t HC p ← ψ ∗ n, ˆ j Selected features: I (0) ← { 1 ≤ j ≤ p | ψ ∗ n,j > t HC p } 4: Step 3 : PCA embedding and k -means clustering Apply PCA to p ost-selection data, retain top K − 1 comp onen ts. Denote it as U . Lab els: ℓ (0) ← k -means( U , K ) notes the unsup ervised test statistic. In detail, P ( t ) F,j is the p -v alue of marginal F -statistic, using x j and the curren t lab el estimates ℓ ( t − 1) . P K S,j is the p -v alue of the Kolmogoro v-Smirnov (KS) statistic b etw een the empirical distribution of x j for feature j and a sp ecified n ull distribution ( Smirnov , 1939 ). While our frame- w ork is general and can accommo date any appropriate n ull distribution based on the sp ecific domain, in this w ork we adopt the standard normal distribution as the n ull. This c hoice aligns with the rare and w eak signal setting commonly assumed for high-dimensional genet- ics data ( Jin and W ang , 2016 ). P K S,j remains static among iterations while P ( t ) F,j dep ends on the pseudo- lab el in every iteration. Both are corrected to get rid of the gap b et ween empirical null and theoretical null ( Efron , 2004 ; Jin and W ang , 2016 ). The KS statistic P K S,j captures distributional deviation, while the F- statistic P ( t ) F,j measures separation across pseudo-lab el clusters. Their asso ciated p -v alues provide a statisti- cally grounded measure of feature imp ortance. Finally , w e transform them into normal quan tiles to calculate S ( t ) j , instead of using p -v alues ( W ang et al. , 2022 ) or the original statistics. Hence, the selected features are in terpretable. The reliabilit y weigh tage w ( t ) ∈ [0 , 1] is to ev al- uate our trust in the current estimated lab el ˆ ℓ ( t − 1) . When the pseudo-lab el ℓ ( t ) is more reliable, we tend to hav e a larger w ( t ) on the sup ervised statistic, with a higher p ow er in feature selection. Ho wev er, without the ground-truth of lab els, the trust in ℓ ( t ) is difficult to ev aluate. The idea is, if the selected features in previous step l ( t − 1) is further aw ay from noises, then the predicted lab el ℓ ( t ) based on l ( t − 1) should b e more reliable. Con- sider the set of p -v alues from F -statistics { P F,j ; j ∈ Chen Ma, W anjie W ang, Shuhao F an I ( t − 1) } . W e conduct a hypothesis testing on whether P F,j con tains information or not, using this set. Let p ( t ) 1 ∈ (0 , 1) denote the p -v alue of this test, where the details can b e found in App endix A.1 . A smaller p ( t ) 1 indicates a larger p ossibilit y that I ( t − 1) is informative. The definition of w ( t ) as follo ws: w ( t ) = 1 − p ( t ) 1 / ( p ( t ) 1 + c ) . (4) The constant c giv es the default imp ortance of P F,j , at c/ (1 + c ) . Even when p ( t ) 1 → 1 , i.e., the b eginning stage, w e still hop e P F,j to take part in. When p ( t ) 1 → 0 , the w eight gradually approach 1 , no matter what c is. A reasonable range for c is 0 . 35 ≤ c ≤ 0 . 6 . In numerical analysis, we consistently use 0 . 6 , with an exp erimen t on the effects of c in Section 5 . 2.3 F eature Selection b y HCT Our nov el score statistic S ( t ) j ranks the imp ortance of features, where a larger score S ( t ) j indicates a larger p oten tial for feature j to be influen tial. Hence, the selection follo ws that, for a threshold τ ( t ) , I ( t ) = { 1 ≤ j ≤ p | S ( t ) j ≥ τ ( t ) } . (5) The key is to decide τ ( t ) in every iteration. W e apply HCT, a data-driven threshold that optimizes the selec- tion. First derive the p -v alues π ( t ) j = 1 − Φ( S ( t ) j ) , then order the p -v alues in an increasing order, π ( t ) (1) ≤ π ( t ) (2) ≤ · · · ≤ π ( t ) ( p ) . The HCT is defined as τ ( t ) = S ( t ) ˆ j , (6) where ˆ j = arg max log p ≤ j ≤ p/ 2 ( j /p − π ( t ) ( j ) ) / q π ( t ) ( j ) (1 − π ( t ) ( j ) ) Using this HCT in ( 5 ) , the ˆ j features with largest scores, i.e. smallest p -v alues, are selected. The selected features are considered as the influential features. The corresp onding p ost-selection data matrix follows that X ( t ) = X [: , I ( t ) ] . 2.4 Em b edding and Clustering After selecting influential features, we normalize the corresp onding submatrix X ( t ) to obtain W ( t ) , where eac h column has mean zero and unit v ariance. Despite feature selection, the high-dimensional data still con- tain redundant noise. Th us, we apply low-dimensional em b edding techniques to extract underlying structure and enhance the signal-to-noise ratio. W e consider t wo embedding metho ds: Principal Comp o- nen t Analysis (PCA) and Laplacian Eigenmaps. PCA ( Hotelling , 1933 ; W ang et al. , 2022 ; T ong et al. , 2025 ) pro jects the data on to directions of maxim um v ari- ance and is widely used due to its simplicity and inter- pretabilit y . How ever, it may fail to capture complex nonlinear structures inherent in many mo dern datasets. Laplacian Eigenmaps ( Belkin and Niyogi , 2003 ), in con- trast, construct a data dissimilarit y graph and compute em b eddings in to sp ectral space that preserve lo cal ge- ometry . This approach is particularly effective when data lie on a nonlinear manifold. Other em b edding metho ds, suc h as UMAP ( McInnes et al. , 2020 ) and Auto encoder ( Baldi , 2011 ), are also ev aluated; their comparativ e results on real data sets can b e found in the App endix E . F or b oth metho ds on W ( t ) , w e consider the embeddings in to K + 2 -dimensional space. Under the low-rank struc- ture, separating K clusters only requires an em b edding dimension larger than K − 1 ( Duda et al. , 2001 ). In this w ork, we conserv atively choose K + 2 dimensions to en- sure that the embedding preserves sufficient structural information. Therefore, w e construct a sp ectral matrix U ( t ) from either W ( t ) or the data similarity matrix: U ( t ) = [ u ( t ) 1 , u ( t ) 2 , . . . , u ( t ) K +2 ] ∈ R n × ( K +2) . (7) Then we p erform k -means on U ( t ) , treating each ro w as a data p oin t, to obtain pseudo-lab els ℓ ( t ) = k -means ( U ( t ) , K ) . In real data analysis, we find that both embedding metho ds outp erform clustering on raw features, with Laplacian Eigenmaps (i-IF-Lap) cons isten tly yielding b etter results, highlighting the utility of nonlinear em- b eddings in complex data. 2.5 Stopping Criteria T o determine conv ergence, we monitor the stability of the selected influen tial feature sets across iterations. Let the relative change rate b et ween iterations t − 1 and t b e r ( t ) = I ( t ) /I ( t − 1) / I ( t − 1) . If the change rate r ( t ) ≤ 10% or the num b er of iterations exceeds a fixed limit (e.g., 10), we terminate the pro cess. 3 Mo del Assumptions and Theoretical Guaran tee Consider the asymptotic clustering mo del where the signals are rare and weak. In detail, the data matrix X i ∼ N ( µ 0 + µ ℓ i , Σ) , where Σ is a diagonal matrix with diagonals σ 2 j . Let M = [ m 1 , m 2 , · · · , m K ] ∈ R p × K , where m k = Σ − 1 / 2 µ k b e the normalized mean vectors. i-IF-Learn: Iterative F eature Selection and Unsup ervised Learning for High-Dimensional Complex Data Let M j denote the j -th column of M . The influential features set is that I = { 1 ≤ j ≤ p | ∥ M j ∥ = 0 } . Asymptotically , we assume that the signals are sparse, in the sense that when p → ∞ , ϵ = | I | /p → 0 . (8) The sparse setting causes a low signal-to-noise ratio, whic h is challenging in high-dimensional unsup ervised learning. While most theoretical pap ers fo cus on a uniform sig- nal strength to decide the detection b oundary , it is not the case in practice. The signal strength in individ- ual features has severe heterogeneity . By an iterative framew ork, based on the extremely sparse features with relativ ely strong signals, we ha ve an initial clustering lab el, and then recov er the features with weak signals in iterations. The following theorem explains the iterativ e feature selection effect. The tec hnical conditions are not strict. In the simplified scenario that K = 2 with equal group size, as long as the accuracy rate is a constant larger than 1 / 2 , then the condition is satisfied. Theorem 3.1. Consider the estimate d lab el ˆ ℓ , which c an b e the initial lab el ˆ ℓ (0) or the estimate d lab el ℓ ( t − 1) fr om last r ound. Denote w ij = E [Σ − 1 / 2 X ij ] as the exp e ctation for data p oint i on fe atur e j , and the over al l me an ¯ w j = 1 n P n i =1 w ij . Denote n k ( ˆ ℓ ) = P n i =1 1 { ˆ ℓ i = k } , k ∈ [ K ] . Suppose for the influential featur es in I , the c ommunity lab el satisfies that for a c onstant c 0 > 0 , min j ∈ I U j ≥ c 0 (log p ) 2 , (9) wher e U j := X k ∈ [ K ] 1 n k ( ˆ ℓ ) X ˆ ℓ i = k ( w ij − ¯ w j ) 2 . Then our weight sele ction satisfies P ( w ( t ) ≥ 1 − p − 2 ) ≥ 1 − p − 2 . F urthermor e, with pr ob ability 1 − p − 4 , the ˆ I fr om IF step in i-IF-L e arn satisfies that I ⊂ ˆ I and | ˆ I /I | ≤ C 0 (log p ) 2 . The correct recov ery of I leads to a correct lab el recov- ery , as long as I contains sufficien t information. Theorem 3.2. Supp ose the assumptions of The or em 3.1 hold. L et ˆ I denote the sele cte d fe atur e set and M ˆ I denote the me an fe atur e matrix M r estricte d on ˆ I . L et τ ˆ I b e the eigengap of matrix M ˆ I , then with a high pr ob ability, the K -me ans clustering err or fol lows that E r r ( ˆ ℓ, ℓ ) ≤ C ( n 1 / 2 + | ˆ I | 1 / 2 ) 2 /nτ 2 ˆ I . (10) F urther, when the signal str ength satisfies min j ∈ I ∥ M j ∥ ≥ log 2 p/ √ n , then the clustering lab el by i-IF-L e arn has that E r r ( ˆ ℓ, ℓ ) → 0 . Our theorems suggest that when p is sufficiently large, one-step iteration could recov er the correct lab els and influen tial feature set from a random initialization. In practical data, since the constants are difficult to decide and p migh t b e inadequate, w e run iterations multi- ple times to ensure robustness and enhance practical p erformance. 4 Real Datasets W e ev aluate our prop osed i-IF-Learn metho d on a collection of 18 datasets, including 10 gene mi- croarra y datasets and 8 single-cell RNA sequencing (scRNA-seq) datasets. The datasets are publicly a v ailable at https://data.mendeley.com/datasets/ cdsz2ddv3t/1 and https://data.mendeley.com/ datasets/nv2x6kf5rd/1 . Details and pre-pro cessing can b e found in App endix D.2 . These datasets are c har- acterized by high dimensionality , sparse signal struc- ture, and v arying degrees of cluster separation, making them p opular in literature for assessing the p erformance of high-dimensional clustering algorithms. 4.1 Gene Microarra y Datasets W e b enc hmark our method on 10 gene microarra y datasets. F or each data set, we hav e a set of patients from different classes, and the gene expression levels of the same genes across all patients are recorded. These datasets hav e b een widely used in prior clustering stud- ies ( Jin and W ang , 2016 ; Chen et al. , 2023 ). They co ver a range of cluster coun ts (from 2 to 5), with sample sizes ranging from 40 to 300 and num b er of genes typically in the thousands. Our goal is to tell the class from the gene expression levels data. F or each dataset, w e consider tw o v ariants of our metho d: i-IF-Lap and i-IF-PCA. Using i-IF-Lap as a pre-pro cessing feature selection metho d, we further consider i-IF-Lap+DeepCluster, i-IF-Lap+UMAP , and i-IF-Lap+V AE, where we apply DeepCluster, UMAP , and V AE to the final influential features ˆ I , resp ectiv ely . The b enchmark metho ds include: (1) classical meth- o ds, such as KMeans ( Hartigan and W ong , 1979 ) and Sp ecGEM ( Lee et al. , 2010 ); (2) neural net works, in- cluding DeepCluster ( Caron et al. , 2018 ), DEC ( Xie et al. , 2016 ) and UMAP ( McInnes et al. , 2020 ); (3) feature selection and clustering metho ds, including IF- PCA ( Jin and W ang , 2016 ) and IFV AE ( Chen et al. , 2023 ). Additionally , the exp erimental results for IDC ( Svirsky and Linden baum , 2024 ) are provided in Ap- p endix F . The compute resource is in App endix D.1 . Implemen tation details and hyperparameter selection for all algorithms are in App endix C . W e assess clustering quality using tw o complementary metrics: A ccuracy , which measures the b est-matc hed Chen Ma, W anjie W ang, Shuhao F an T able 1: A ccuracy comparison of clustering metho ds across 10 gene microarray datasets. Dataset KMeans SpecGEM UMAP DEC DeepCluster IFPCA IFV AE i-IF-PCA i-IF-Lap i-IF-Lap+UMAP i-IF-Lap+DeepCluster i-IF-Lap+V AE Brain 0.667 0.857 0.676 (0.07) 0.638 (0.09) 0.721 (0.06) 0.738 0.500 0.691 0.738 0.783 (0.02) 0.783 (0.02) 0.612 (0.05) Breast 0.562 0.562 0.556 (0.00) 0.629 (0.0 2) 0.548 (0.00) 0.594 0.565 0.623 0.630 0.550 (0.01) 0.582 (0.02) 0.628 (0.00) Colon 0.548 0.516 0.500 (0.00) 0.561 (0.09) 0.635 (0.12) 0.597 0.597 0.629 0.597 0.570 (0.02) 0.594 (0.01) 0.597 (0.00) Leukemia 0.972 0.708 0.778 (0.00) 0.910 (0.05) 0.969 (0.01) 0.931 0.722 0.861 0.972 0.972 (0.00) 0.971 (0.01) 0.971 (0.01) Lung1 0.901 0.878 0.899 (0.03) 0.832 (0.01) 0.834 (0.14) 0.967 0.967 0.995 0.995 0.962 (0.02) 0.890 (0.00) 0.989 (0.00) Lung2 0.783 0.567 0.507 (0.00) 0.676 (0.02) 0.777 (0.01) 0.783 0.783 0.724 0.803 0.788 (0.00) 0.783 (0.00) 0.783 (0.00) Lymphoma 0.984 0.774 0.571 (0.02) 0.874 (0.12) 0.618 (0.08) 0.935 0.742 0.968 0.936 0.853 (0.18) 0.903 (0.02) 0.647 (0.12) Prostate 0.578 0.578 0.555 (0.01) 0.568 (0.07) 0.578 (0.01) 0.618 0.588 0.588 0.569 0.568 (0.00) 0.575 (0.01) 0.616 (0.00) SRBCT 0.556 0.492 0.543 (0.01) 0.460 (0.04) 0.546 (0.08) 0.556 0.524 0.587 0.984 0.984 (0.00) 0.981 (0.01) 0.975 (0.02) SuCancer 0.523 0.511 0.672 (0.00) 0.569 (0.01) 0.549 (0.05) 0.667 0.672 0.500 0.603 0.687 (0.05) 0.609 (0.02) 0.605 (0.02) Rank 6.000 (3.3) 8.800 (3.3) 9.500 (2.9) 8.600 (2.9) 7.700 (3.2) 4.100 (1.6) 6.400 (3.6) 5.400 (3.5) 3.400 (2.8) 5.000 (3.7) 5.100 (2.2) 4.800 (3.0) Regret 0.109 (0.1) 0.172 (0.1) 0.191 (0.1) 0.145 (0.1) 0.139 (0.1) 0.078 (0.1) 0.151 (0.2) 0.100 (0.1) 0.041 (0.0) 0.045 (0.0) 0.051 (0.0) 0.074 (0.1) T able 2: ARI comparison of clustering metho ds across 10 gene microarray datasets. Dataset KMeans SpecGEM UMAP DEC DeepCluster IFPCA IFV AE i-IF-PCA i-IF-Lap i-IF-Lap+UMAP i-IF-Lap+DeepCluster i-IF-Lap+V AE Brain 0.375 0.567 0.450 (0.03) 0.411 0.534 (0.10) 0.481 0.189 0.468 0.546 0.547 (0.03) 0.552 (0.02) 0.344 (0.05) Breast 0.116 0.006 0.005 (0.00) 0.010 0.006 (0.00) 0.004 0.007 0.017 0.025 -0.006 (0.00) 0.013 (0.01) 0.017 (0.00) Colon 0.090 -0.010 -0.018 (0.00) 0.030 0.207 (0.22) 0.009 0.013 0.045 0.018 0.003 (0.01) 0.016 (0.01) 0.018 (0.00) Leukemia 0.889 0.212 0.300 (0.00) 0.568 0.642 (0.22) 0.734 0.211 0.515 0.890 0.890 (0.00) 0.885 (0.04) 0.896 (0.04) Lung1 0.487 0.595 0.464 (0.18) 0.239 0.623 (0.05) 0.834 0.893 0.973 0.973 0.830 (0.01) 0.426 (0.01) 0.945 (0.01) Lung2 0.254 -0.003 -0.005 (0.00) -0.002 0.239 (0.01) 0.254 0.240 0.096 0.314 0.281 (0.00) 0.254 (0.00) 0.245 (0.00) Lymphoma 0.947 0.398 0.402 (0.02) 0.652 0.467 (0.17) 0.824 0.652 0.893 0.880 0.738 (0.25) 0.803 (0.02) 0.505 (0.16) Prostate 0.016 0.009 0.003 (0.00) 0.009 0.022 (0.01) 0.050 0.022 0.026 0.009 0.009 (0.00) 0.013 (0.00) 0.047 (0.00) SRBCT 0.121 0.125 0.190 (0.01) 0.082 0.162 (0.08) 0.143 0.129 0.259 0.946 0.946 (0.00) 0.938 (0.02) 0.917 (0.06) SuCancer -0.003 0.092 0.115 (0.00) 0.011 -0.002 (0.01) 0.102 0.115 -0.002 0.046 0.145 (0.07) 0.045 (0.02) 0.042 (0.02) Rank 5.900 (4.3) 8.100 (3.4) 9.300 (3.2) 8.500 (2.5) 6.700 (2.8) 5.700 (3.0) 7.200 (3.3) 5.200 (3.3) 3.300 (2.4) 5.100 (3.9) 5.500 (2.6) 5.200 (3.3) Regret 0.187 (0.3) 0.317 (0.3) 0.326 (0.2) 0.315 (0.3) 0.226 (0.2) 0.173 (0.2) 0.269 (0.3) 0.187 (0.2) 0.051 (0.1) 0.078 (0.1) 0.122 (0.2) 0.119 (0.1) prop ortion of true lab els, and Adjusted Rand Index (ARI) ( Hub ert and Arabie , 1985 ), which quantifies the similarity b etw een predicted and true clusters for un balanced data. When the standard deviation is smaller than 0 . 0001 , we do not rep ort it. T o summarize p erformance across datasets, w e further rep ort the a verage rank to rank the algorithm among all metho ds and the av erage regret that captures how far a metho d’s result deviates from the b est-performer on each dataset. Lo wer rank and regret mean b etter p erformance. The accuracy and ARI are summarized in T able 1 and 2 , resp ectiv ely . In b oth tables, our i-IF-Lap algorithm demonstrates the most consisten t and sup erior p erfor- mance across 10 microarray datasets. It outp erforms all other metho ds in 5 out of 10 datasets in terms of accuracy . In b oth tables, i-IF-Lap ac hieves the low est a verage rank and regrets, indicating that it consistently ranks among the top-p erforming algorithms and cap- tures all the information across diverse datasets. Our i-IF-Lap algorithm not only suggests consistent clustering lab els ˆ ℓ , but also recov ers an influential fea- ture set ˆ I . Based on ˆ I , DeepCluster, UMAP and V AE all enjo y lo wer av erage ranks (7.7 → 5, 6.5 → 5.1, and 5.4 → 4.8, resp ectiv ely), compared to their p erformance without i-IF-Lap pre-pro cessing. It strongly supp orts the consistency of the i-IF-Lap feature selection. 4.2 Single-cell RNA Sequencing Datasets W e further ev aluate i-IF-Learn on 8 single-cell RNA-seq (scRNA-seq) datasets, which measures gene expression lev els at the resolution of individual cells. The num b er of cells ranges from a few hundred to several thousand, with gene dimensions ranging from 2,000 to 10,000. Due to dropout ev ents, scRNA-seq data are usually more sparse and noisy than gene microarray datasets. W e consider tw o v arian ts of our metho d, i-IF-Lap and i-IF-PCA, and further explore i-IF-Lap combined with DeepCluster, UMAP , or V AE to illustrate the effect of selected features. Benc hmark metho ds include: (1) scRNA-seq clustering baselines, such as Seurat ( Satija et al. , 2015 ), SC3 ( Kiselev et al. , 2017 ), scAMF ( Y ao et al. , 2024 ), and DESC ( Li et al. , 2020a ); (2) neu- ral netw ork methods, including DeepCluster ( Caron et al. , 2018 ) and UMAP ( McInnes et al. , 2020 ); and (3) feature selection combined with clustering, includ- ing IFPCA ( Jin and W ang , 2016 ) and IFV AE ( Chen et al. , 2023 ). A dditionally , the exp erimen tal results for CLEAR ( Han et al. , 2022 ) are provided in App endix F . Compute resources are listed in App endix D.1 , and implemen tation details with hyperparameter choices are in App endix C . The accuracy and ARI are demonstrated in T ables 3 and 4 , resp ectiv ely . Our i-IF-Lap algorithm achiev es the low est a verage rank and a verage regret in b oth tables. The second b est p erformer is DeepCluster with i-IF-Lap selected ˆ I . It prov es the p o wer of deep clus- tering metho ds with i-IF-Lap pre-pro cessing. As a summary , our i-IF-Lap algorithm provides b oth reli- able clustering lab els and influential feature set. 4.3 Statistical Significance T o rigorously ev aluate p erformance, we conducted non- parametric statistical testing across all 18 real-world datasets. The F riedman test on the clustering results i-IF-Learn: Iterative F eature Selection and Unsup ervised Learning for High-Dimensional Complex Data T able 3: A ccuracy comparison of clustering metho ds across 8 scRNA-seq datasets. Dataset Seurat SC3 scAMF DESC UMAP DeepCluster IFPCA IFV AE i-IF-PCA i-IF-Lap i-IF-Lap+UMAP i-IF-Lap+DeepCluster i-IF-Lap+V AE Camp1 0.643 0.788 0.882 0.799 0.673 (0.03) 0.612 (0.02) 0.738 0.706 0.738 0.740 0.687 (0.07) 0.657 (0.03) 0.640 (0.00) Camp2 0.654 0.778 0.673 0.656 0.615 (0.01) 0.608 (0.04) 0.660 0.690 0.617 0.605 0.573 (0.00) 0.656 (0.00) 0.577 (0.03) Darmanis 0.779 0.736 0.766 0.609 0.628 (0.03) 0.583 (0.01) 0.789 0.540 0.783 0.785 0.718 (0.04) 0.793 (0.05) 0.662 (0.06) Deng 0.534 0.563 0.646 0.563 0.559 (0.09) 0.624 (0.08) 0.828 0.652 0.802 0.869 0.658 (0.01) 0.857 (0.01) 0.830 (0.07) Goolam 0.629 0.758 0.823 0.629 0.508 (0.00) 0.847 (0.08) 0.721 0.492 0.629 0.758 0.500 (0.00) 0.835 (0.09) 0.945 (0.02) Grun 0.993 0.500 0.523 0.968 0.663 (0.00) 0.783 (0.02) 0.673 0.750 0.991 0.994 0.691 (0.00) 0.694 (0.01) 0.724 (0.01) Li 0.985 0.919 0.804 0.827 0.896 (0.02) 0.871 (0.05) 0.909 0.852 0.980 0.966 0.955 (0.00) 0.970 (0.01) 0.797 (0.04) Patel 0.653 0.995 0.958 0.939 0.927 (0.01) 0.859 (0.05) 0.940 0.569 0.788 0.942 0.945 (0.00) 0.954 (0.01) 0.875 (0.05) Rank 7.125 (4.3) 5.750 (4.2) 5.625 (4.3) 7.250 (3.4) 9.750 (1.5) 10.750 (3.0) 5.625 (2.5) 8.875 (3.1) 5.750 (3.0) 4.250 (3.2) 7.750 (2.6) 4.375 (3.1) 8.250 (4.4) Regret 0.171 (0.2) 0.150 (0.2) 0.146 (0.2) 0.156 (0.1) 0.222 (0.1) 0.363 (0.2) 0.123 (0.1) 0.249 (0.1) 0.114 (0.1) 0.073 (0.1) 0.293 (0.2) 0.103 (0.1) 0.149 (0.1) T able 4: ARI comparison of clustering metho ds across 8 scRNA-seq datasets. Dataset Seurat SC3 scAMF DESC UMAP DeepCluster IFPCA IFV AE i-IF-PCA i-IF-Lap i-IF-Lap+UMAP i-IF-Lap+DeepCluster i-IF-Lap+V AE Camp1 0.519 0.763 0.801 0.729 0.521 (0.04) 0.516 (0.02) 0.629 0.639 0.635 0.650 0.624 (0.08) 0.616 (0.00) 0.597 (0.00) Camp2 0.425 0.594 0.484 0.483 0.406 (0.01) 0.375 (0.03) 0.490 0.464 0.522 0.524 0.399 (0.00) 0.505 (0.01) 0.413 (0.04) Darmanis 0.719 0.700 0.667 0.526 0.535 (0.05) 0.458 (0.01) 0.703 0.428 0.674 0.694 0.591 (0.03) 0.703 (0.06) 0.558 (0.06) Deng 0.427 0.541 0.561 0.426 0.440 (0.09) 0.393 (0.13) 0.848 0.431 0.810 0.876 0.567 (0.01) 0.867 (0.01) 0.835 (0.10) Goolam 0.544 0.687 0.914 0.543 0.423 (0.00) 0.766 (0.01) 0.537 0.205 0.582 0.687 0.427 (0.00) 0.801 (0.13) 0.976 (0.01) Grun 0.969 -0.060 -0.074 0.928 0.093 (0.00) 0.137 (0.07) -0.096 0.244 0.955 0.971 0.145 (0.00) 0.150 (0.01) 0.198 (0.01) Li 0.971 0.934 0.779 0.782 0.885 (0.02) 0.632 (0.13) 0.880 0.782 0.985 0.943 0.936 (0.00) 0.948 (0.01) 0.790 (0.04) Patel 0.577 0.989 0.905 0.383 0.836 (0.01) 0.729 (0.09) 0.853 0.383 0.697 0.871 0.874 (0.00) 0.898 (0.02) 0.784 (0.04) Rank 7.250 (4.7) 4.750 (3.5) 6.125 (4.4) 8.500 (3.6) 9.750 (1.9) 10.875 (3.3) 7.375 (3.2) 8.125 (3.8) 5.375 (3.1) 3.375 (1.8) 7.500 (2.5) 4.125 (2.5) 7.250 (3.3) Regret 0.220 (0.2) 0.221 (0.1) 0.234 (0.3) 0.256 (0.2) 0.347 (0.2) 0.363 (0.2) 0.262 (0.3) 0.383 (0.3) 0.131 (0.1) 0.087 (0.1) 0.271 (0.2) 0.178 (0.3) 0.220 (0.2) yielded p = 3 . 6 × 10 − 5 , indicating a statistically sig- nifican t difference in ov erall p erformance among the ev aluated metho ds. T o further assess pairwise sup eriority , we conducted a Wilco xon signed-rank test with Holm correction against the alternative hypothesis that i-IF-Lap achiev es b et- ter clustering. T able 5 summarizes the results for metho ds ev aluated across all 18 datasets. Our i-IF- Lap metho d significan tly outp erforms baselines such as UMAP , DeepCluster, and IFV AE, and sho ws sta- tistically significant improv ements ov er its V AE and UMAP pip eline v ariants. T able 5: Summary of p -v alues from the Wilco xon signed-rank test with Holm correction (Alternativ e h yp othesis: i-IF-Lap works b etter). The metho ds com- pared are those ev aluated across all 18 datasets. Metho d p -v alue Metho d p -v alue UMAP 0.000 i-IF-Lap+UMAP 0.045 DeepCluster 0.011 i-IF-PCA 0.074 IFV AE 0.011 IFPCA 0.163 i-IF-Lap+V AE 0.045 i-IF-Lap+DeepCluster 0.290 5 Syn thetic Datasets W e conduct simulation studies to ev aluate i-IF-Learn under controlled settings. W e first compare the fea- ture selection and clustering p erformance of i-IF-Learn metho ds under linear and non-linear settings, and then discuss the effects of the initial lab el and the constant c in reliability w eightage. Linear setting . Let X i ∼ N ( ℓ i µ, Σ) , where ℓ i ∈ {− 1 , 1 } with equal probability . The mean vector µ ∈ R p has µ j = 0 for j / ∈ I and µ j = 0 for j ∈ I . Let I = I s ∪ I w , where µ j ∼ 1 2 N ( τ s , 0 . 01 2 ) + 1 2 N ( − τ s , 0 . 01 2 ) for j ∈ I s and µ j ∼ 1 2 N ( τ w , 0 . 01 2 ) + 1 2 N ( − τ w , 0 . 01 2 ) for j ∈ I w . Hence, I s is the set of relatively strong signals and I w is the set of w eak signals. The cov ariance matrix Σ is a diagonal matrix with diagonals σ 2 j , where σ j ∼ U nif (1 , 3) . W e set n = 500 , p = 5000 , | I s | = 4 relatively strong signals and | I w | = 100 weak signals. Let τ s = 1 . 1 and τ w ∈ { 0 . 1 , 0 . 15 , 0 . 2 , · · · , 1 . 0 } . A larger τ w indicates a stronger signal-to-noise ratio. Metho ds. W e consider 1) i-IF-Lap and i-IF-PCA; 2) i-IF-Lap+DeepCluster/UMAP/V AE, where Deep- Cluster, UMAP , and V AE are applied to the influen- tial features ˆ I from i-IF-Lap, resp ectiv ely; 3) KMeans, Sp ecGEM, DeepCluster, DEC, UMAP , IFPCA and IFV AE as b enc hmark metho ds. F or feature selection accuracy , we compare i-IF-Lap, i-IF-PCA, and IFPCA. F or all metho ds, the input is the data points X i ’s, without lab els or influen tial feature information. The compute resource is in App endix D.1 . Implementation details and h yp erparameter selection for all algorithms are in App endix C . Results. The accuracy rates v ersus τ w o ver 100 rep e- titions in the right panel of Figure 3 . As τ w increases, all metho ds hav e a b etter accuracy from 0.5 to ∼ 1 . Our i-IF-Learn algorithms p erform the b est, esp ecially when 0 . 4 ≤ τ w ≤ 0 . 8 . Metho ds using i-IF-Lap as pre- pro cessing step also enjo y an outstanding p erformance, due to the reliable recov ery of influential features. T o inv estigate the estimate of I , we summarize the F alse Discov ery Rate (FDR) ov er 100 rep etitions in the left panel of Figure 3 . As τ w increases, FDR for i-IF- Learn drops sharply , while IFPCA remains high across all settings. This highlights the benefit of iterative Chen Ma, W anjie W ang, Shuhao F an Figure 3: Left: FDR of feature selection step versus signal strength for signals in I w . Right: the clustering accuracy v ersus signal strength for signals in I w . refinemen t: i-IF-Learn is able to recov er weak signals with high precision. More figures ab out I can b e found in App endix D.3 . Nonlinear setting. Sample the underlying data p oin ts from a 2D manifold, and then pro ject them to p -dimensional space. The observ ed data p oin ts are x i ∈ R p . Let n = 500 and K = 2 . W e consider tw o exp erimen ts: • p-Sw eep. Let 20 features b e strong signals with strength 1.0 and 60 features b e weak signals with strength 0.2, while the remaining features are ir- relev ant. V ary p from 1500 to 6000. • µ -P ow er Sweep. Let p = 4000 , with 80 influen- tial features. Each influential feature j has a signal strength at µ a j , where µ j ∼ i.i.d U (0 . 2 , 1) and the p o w er a ∈ { 1 / 4 , 1 / 3 , 1 / 2 , 1 , 2 , 3 , 4 } . Metho ds . W e compare i-IF-Lap , i-IF-PCA , and IFPCA . Figure 4 shows that i-IF-Lap outp erforms all other metho ds in b oth settings. It illustrates the p ow er of non-linear embedding. F urthermore, the i-IF-PCA metho d outp erforms IFPCA, indicating the p o wer of iteration. Figure 4: Left: clustering accuracy v ersus dimension p in the p -Sw eep exp eriment. Right: clustering accuracy v ersus the p ow er a in the µ -Sweep exp eriment. Robustness. W e examine the robustness of i-IF-Learn with resp ect to the choice of the constan t c in Eq. ( 4 ) and the initialization sc heme. T able 6 reports clustering accuracies for c ∈ { 0 . 4 , 0 . 5 , 0 . 6 } under b oth linear and nonlinear settings. F or each c , the top row corresp onds to IFPCA initialization, while the b ottom row corre- sp onds to a random initialization. Results comparing differen t embedding metho ds (e.g., UMAP , Auto en- co der, PCA, Laplacian Eigenmaps) can be found in App endix 6 . The results show that i-IF-Learn is stable across different constants c . F urthermore, even with a random initialization, our i-IF-Learn framework still enjo ys some clustering improv ements. c Init ℓ (0) Linear Non-linear i-IF-Lap i-IF-PCA i-IF-Lap i-IF-PCA 0.4 IFPCA 0.733 (0.22) 0.731 (0.22) 0.715 (0.08) 0.674 (0.11) Random 0.606 (0.17) 0.611 (0.17) 0.618 (0.11) 0.610 (0.11) 0.5 IFPCA 0.713 (0.22) 0.712 (0.22) 0.701 (0.09) 0.674 (0.10) Random 0.576 (0.12) 0.573 (0.12) 0.627 (0.11) 0.611 (0.09) 0.6 IFPCA 0.742 (0.22) 0.738 (0.22) 0.702 (0.09) 0.672 (0.12) Random 0.585 (0.14) 0.580 (0.14) 0.644 (0.11) 0.619 (0.11) T able 6: A ccuracy (mean (std)) of i-IF-Lap and i-IF- PCA across different constan ts and initializations. 6 Discussion W e in tro duce i-IF-Learn, an iterative framework for high-dimensional clustering that integrates feature se- lection with lo w-dimensional embedding. By adaptively using sup ervised pseudo-lab els and unsup ervised statis- tics, our nov el screening metric enables robust feature selection even when early clustering assignments are noisy . Unlik e static pip elines, i-IF-Learn iteratively refines b oth feature sets and lab els to effectively am- plify weak signals. Beyond assigning cluster lab els, i-IF-Learn outputs an interpretable set of influential features. As an exploration of the framework’s flexibilit y , w e replaced the IF step with a sup ervised Lasso p enalty; ho wev er, this yielded sub-optimal p erformance (see App endix G ). While demonstrating strong empirical results, i-IF- Learn presents several av enues for future research. First, the curren t marginal screening step ev aluates features individually , p oten tially ignoring pairwise or blo c k interactions. F uture work could incorp orate a su- p ervised recov ery step (e.g., using CIFE ( Lin and T ang , 2006 ), or JMI ( Y ang and Mo o dy , 1999 )) on the full feature set, guide d by the generated pseudo-lab els, to capture joint effects and eliminate redundancies. Sec- ond, i-IF-Learn curren tly identifies a single global set of influen tial features. Dev eloping high-resolution meth- o ds to detect distinct, cluster-sp ecific feature subsets is a highly relev ant next step. More HDLSS datasets can b e found in the publicly av ailable rep ository pro- vided by Li et al. ( 2017 )( https://jundongl.github. io/scikit- feature/datasets ). i-IF-Learn: Iterative F eature Selection and Unsup ervised Learning for High-Dimensional Complex Data A ckno wledgements This researc h was supp orted b y the Singap ore Min- istry of Education Academic Researc h F und Tier 1 under Grant A-8001451-00-00. C. Ma gratefully ac- kno wledges the financial supp ort from the Southern Univ ersity of Science and T echnology (SUST ech) dur- ing the exchange program at the National Universit y of Singap ore (NUS), and the trav el supp ort provided b y the W allinsk a resestip endiet and the Swedish Asso- ciation for Medical Statistics (FMS) trav el sc holarship. The authors also thank the anonymous review ers for their v aluable comments and suggestions, whic h led to the addition of new exp erimen ts in this work. References Pierre Baldi. Auto encoders, unsup ervised learning and deep architectures. In Pr o c e e dings of the 2011 Inter- national Confer enc e on Unsup ervise d and T r ansfer L e arning W orkshop - V olume 27 , UTL W’11, page 37–50. JMLR.org, 2011. Mikhail Belkin and P artha Niy ogi. Laplacian eigenmaps for dimensionality reduction and data representation. Neur al Computation , 15(6):1373–1396, 2003. doi: 10.1162/089976603321780317. Sabri Boutemedjet, Djemel Ziou, and Nizar Bouguila. Unsup ervised feature selection for accurate recommendation of high-dimensional image data. In J. Platt, D. K oller, Y. Singer, and S. Row eis, editors, A dvanc es in Neur al Infor- mation Pr o c essing Systems , volume 20. Curran Asso ciates, Inc., 2007. URL https://proceedings. neurips.cc/paper_files/paper/2007/file/ 073b00ab99487b74b63c9a6d2b962ddc- Paper.pdf . Christos Boutsidis, P etros Drineas, and Michael W Mahoney . Unsup ervised feature selection for the k-means clustering problem. In Y. Bengio, D. Sch uurmans, J. Lafferty , C. Williams, and A. Culotta, editors, A dvanc es in Neur al Infor- mation Pr o c essing Systems , volume 22. Curran Asso ciates, Inc., 2009. URL https://proceedings. neurips.cc/paper_files/paper/2009/file/ c51ce410c124a10e0db5e4b97fc2af39- Paper.pdf . Mathilde Caron, Piotr Bo jano wski, Armand Joulin, and Matthijs Douze. Deep clustering for unsup er- vised learning of visual features. In Pr o c e e dings of the Eur op e an Confer enc e on Computer Vision (ECCV) , Septem b er 2018. Dieyi Chen, Jiashun Jin, and Zheng T racy Ke. Sub ject clustering by IF-PCA and several recen t metho ds. F r ontiers in Genetics , 14:1166404, 2023. Chandler Da vis and William Morton Kahan. The rotation of eigenv ectors by a p erturbation. iii. SIAM Journal on Numeric al Analysis , 7(1):1–46, 1970. Da vid Donoho and Jiashun Jin. Higher criticism for detecting sparse heterogeneous mixtures. The Annals of Statistics , pages 962–994, 2004. Da vid L Donoho et al. High-dimensional data analysis: The curses and blessings of dimensionality . AMS Math Chal lenges L e ctur e , 1(2000):32, 2000. Ric hard O. Duda, Peter E. Hart, and David G. Stork. Pattern Classific ation , chapter 5. Wiley-In terscience, 2 edition, 2001. ISBN 0-471-05669-3. Bradley Efron. Large-scale simultaneous hypothesis testing: the choice of a null hypothesis. Journal of the Americ an Statistic al Asso ciation , 99(465):96–104, 2004. Ran Eisenberg, Jonathan Svirsky , and Ofir Linden- baum. Cop er: Correlation-based p erm utations for m ulti-view clustering. In Y. Y ue, A. Garg, N. P eng, F. Sha, and R. Y u, editors, International Confer enc e on L e arning R epr esentations , volume 2025, pages 46154–46179, 2025. URL https: //proceedings.iclr.cc/paper_files/paper/ 2025/file/720719dbe00dcd5210cd5ec3a7399476\ - Paper- Conference.pdf . Miriam R Elman, Jessica Minnier, Xiaohui Chang, and Dongseok Choi. Noise accumulation in high dimen- sional classification and total signal index. Journal of Machine L e arning R ese ar ch , 21(36):1–23, 2020. Martin Ester, Hans-Peter Kriegel, Jörg Sander, and Xi- ao wei Xu. A density-based algorithm for discov ering clusters in large spatial databases with noise. In Pr o- c e e dings of the Se c ond International Confer enc e on Know le dge Disc overy and Data Mining , v olume 96, pages 226–231, 1996. W enk ai Han, Y uqi Cheng, Jiay ang Chen, Huaw en Zhong, Zhihang Hu, Siyuan Chen, Licheng Zong, Liang Hong, Ting-F ung Chan, Irwin King, Xin Gao, and Y u Li. Self-sup ervised contrastiv e learn- ing for integrativ e single cell rna-seq data analysis. Briefings in Bioinformatics , 23(5):bbac377, 09 2022. ISSN 1477-4054. doi: 10.1093/bib/bbac377. URL https://doi.org/10.1093/bib/bbac377 . John A Hartigan and Manchek A W ong. Algorithm AS 136: A K-means clustering algorithm. Journal of the R oyal Statistic al So ciety. series c (Applie d Statistics) , 28(1):100–108, 1979. Harold Hotelling. Analysis of a complex of statisti- cal v ariables into principal comp onen ts. Journal of Educ ational Psycholo gy , 24(6):417, 1933. La wrence Hub ert and Phipps Arabie. Comparing parti- tions. Journal of Classific ation , 2(1):193–218, Decem- b er 1985. ISSN 1432-1343. doi: 10.1007/BF01908075. URL https://doi.org/10.1007/BF01908075 . Chen Ma, W anjie W ang, Shuhao F an Zh uxi Jiang, Yin Zheng, Huac hun T an, Bangsheng T ang, and Hanning Zhou. V ariational deep em- b edding: an unsup ervised and generative approach to clustering. In Pr o c e e dings of the 26th Interna- tional Joint Confer enc e on Artificial Intel ligenc e , IJ- CAI’17, page 1965–1972. AAAI Press, 2017. ISBN 9780999241103. Jiash un Jin and W anjie W ang. Influential features PCA for high dimensional clustering. The Annals of Statistics , 44(6):2323–2359, 2016. Jiash un Jin, Zheng T racy Ke, and W anjie W ang. Phase transitions for high dimensional clustering and re- lated problems. The Annals of Statistics , 45(5):2151– 2189, 2017. Diederik P Kingma and Max W elling. Auto-enco ding v ariational Bay es. arXiv pr eprint arXiv:1312.6114 , 2013. Vladimir Y u Kiselev, Kristina Kirsc hner, Mic hael T Sc haub, T allulah Andrews, Andrew Yiu, T amir Chan- dra, Kedar N Natara jan, W olf Reik, Mauricio Bara- hona, Anthon y R Green, et al. SC3: consensus clus- tering of single-cell RNA-seq data. Natur e Metho ds , 14(5):483–486, 2017. Ann B Lee, Diana Luca, and Kathryn Ro eder. A sp ec- tral graph approach to discov ering genetic ancestry . The A nnals of Statistics , 4(1):179, 2010. Changhee Lee, F ergus Imrie, and Mihaela v an der Sc haar. Self-supervision enhanced feature selection with correlated gates. In International Confer enc e on L e arning R epr esentations , 2022. Jundong Li, Kewei Cheng, Suhang W ang, F red Morstat- ter, Rob ert P T revino, Jiliang T ang, and Huan Liu. F eature selection: A data p erspective. ACM Com- puting Surveys (CSUR) , 50(6):1–45, 2017. Xiang jie Li, Kui W ang, Y afei Lyu, Huize Pan, Jingx- iao Zhang, Dwight Stam b olian, Katalin Susztak, Muredac h P Reilly , Gang Hu, and Mingyao Li. Deep learning enables accurate clustering with batch ef- fect remov al in single-cell rna-seq analysis. Natur e Communic ations , 11(1):2338, 2020a. Xiang jie Li, Kui W ang, Y afei Lyu, Huize Pan, Jingx- iao Zhang, Dwight Stam b olian, Katalin Susztak, Muredac h P . Reilly , Gang Hu, and Mingyao Li. Deep learning enables accurate clustering with batc h effect remov al in single-cell rna-seq analysis. Na- tur e Communic ations , 11(1):2338, 2020b. doi: 10. 1038/s41467- 020- 15851- 3. URL https://doi.org/ 10.1038/s41467- 020- 15851- 3 . Dah ua Lin and Xiao ou T ang. Conditional infomax learning: An integrated framework for feature ex- traction and fusion. In Aleš Leonardis, Horst Bischof, and Axel Pinz, editors, Computer Vision – ECCV 2006 , pages 68–82, Berlin, Heidelb erg, 2006. Springer Berlin Heidelb erg. ISBN 978-3-540-33833-8. Ofir Lindenbaum, Uri Shaham, Erez Peterfreund, Jonathan Svirsky , Nicolas Casey , and Y uv al Kluger. Differen tiable unsup ervised feature selection based on a gated laplacian. In M. Ranzato, A. Beygelzimer, Y. Dauphin, P .S. Liang, and J. W ortman V aughan, editors, A dvanc es in Neur al Information Pr o c essing Systems , volume 34, pages 1530–1542. Curran Asso ciates, Inc., 2021. URL https://proceedings. neurips.cc/paper_files/paper/2021/file/ 0bc10d8a74dbafbf242e30433e83aa56- Paper.pdf . Leland McInnes, John Healy , and James Melville. UMAP: Uniform manifold approximation and pro- jection for dimension reduction. arXiv pr eprint arXiv:1802.03426 , 2020. Y ushan Qiu, Lingfei Y ang, Hao Jiang, and Quan Zou. sctp c: a no vel semisup ervised deep clus- tering model for scrna-seq data. Bioinformatics , 40(5):btae293, 04 2024. ISSN 1367-4811. doi: 10.1093/bioinformatics/btae293. URL https://doi. org/10.1093/bioinformatics/btae293 . Rah ul Satija, Jeffrey A F arrell, David Gennert, Alexan- der F Schier, and A viv Regev. Spatial reconstruction of single-cell gene expression data. Natur e Biote ch- nolo gy , 33(5):495–502, 2015. Nik olai V Smirnov. On the estimation of the discrep- ancy b et ween empirical curves of dis tribution for tw o indep enden t samples. Bul l. Math. Univ. Mosc ou , 2 (2):3–14, 1939. Jonathan Svirsky and Ofir Lindenbaum. Interpretable deep clustering for tabular data. In International Confer enc e on Machine L e arning . PMLR, 2024. Xin T T ong, W anjie W ang, and Y uguan W ang. Uniform error b ound for PCA matrix denoising. Bernoul li , 31(3):2251–2275, 2025. Nakul Upadhy a and Eldan Cohen. Neurcam: In ter- pretable neural clustering via additiv e mo dels, 2024. URL . Roman V ersh ynin. Introduction to the non-asymptotic analysis of random matrices. arXiv pr eprint arXiv:1011.3027 , 2010. Jianqiao W ang, W anjie W ang, and Hongzhe Li. Sparse blo c k signal detection and identification for shared cross-trait asso ciation analysis. The Annals of Ap- plie d Statistics , 16(2):866–886, 2022. Daniela M Witten and Rob ert Tibshirani. A framework for feature selection in clustering. Journal of the A meric an Statistic al Asso ciation , 105(490):713–726, 2010. Xinxing W u and Qiang Cheng. Algorithmic stability and generalization of an unsupervised feature i-IF-Learn: Iterative F eature Selection and Unsup ervised Learning for High-Dimensional Complex Data selection algorithm. In M. R anzato, A. Beygelzimer, Y. Dauphin, P .S. Liang, and J. W ortman V aughan, editors, A dvanc es in Neur al Information Pr o c essing Systems , volume 34, pages 19860–19875. Curran Asso ciates, Inc., 2021. URL https://proceedings. neurips.cc/paper_files/paper/2021/file/ a546203962b88771bb06faf8d6ec065e- Paper.pdf . Jun yuan Xie, Ross Girshick, and Ali F arhadi. Un- sup ervised deep embedding for clustering analysis. In International Confer enc e on Machine L e arning , pages 478–487. PMLR, 2016. Ho ward Y ang and John Moo dy . Data visual- ization and feature selection: New algorithms for nongaussian data. In S. Solla, T. Leen, and K. Müller, editors, A dvanc es in Neur al Information Pr o c essing Systems , volume 12. MIT Press, 1999. URL https://proceedings. neurips.cc/paper_files/paper/1999/file/ 8c01a75941549a705cf7275e41b21f0d- Paper.pdf . Zhigang Y ao, Bing jie Li, Y ukun Lu, and Shing-T ung Y au. Single-cell analysis via manifold fitting: A framew ork for RNA clustering and b ey ond. Pr o c e e d- ings of the National A cademy of Scienc es , 121(37): e2400002121, 2024. Zhiyue Zhang, Kenneth Lange, and Jason Xu. Simple and scalable s parse k-means clustering via feature ranking. In H. Laro c helle, M. Ranzato, R. Hadsell, M.F. Balcan, and H. Lin, editors, A dvanc es in Neur al Information Pr o c essing Sys- tems , volume 33, pages 10148–10160. Curran Asso ciates, Inc., 2020. URL https://proceedings. neurips.cc/paper_files/paper/2020/file/ 735ddec196a9ca5745c05bec0eaa4bf9- Paper.pdf . Zheng Zhao, Lei W ang, and Xiaofeng Du. Exploring feature selection with limited lab els: A comprehen- siv e survey of semi-sup ervised and unsup ervised ap- proac hes. IEEE T r ansactions on Pattern Analysis and Machine Intel ligenc e , 41(8):1769–1787, 2019. Chec klist 1. F or all mo dels and algorithms presented, chec k if y ou include: (a) A clear description of the mathematical set- ting, assumptions, algorithm, and/or mo del. [Y es] W e provide the mathematical setting and assumptions in Section 3 , and describ e the algorithms in Section 2 and provide pseudo- co des for each algorithms in App endix B . (b) An analysis of the prop erties and comple xit y (time, space, sample size) of any algorithm. [Y es] The computational complexity is ana- lyzed in Section 2 . (c) (Optional) Anon ymized source co de, with sp ecification of all dep endencies, including external libraries. [Y es] An anonymized im- plemen tation with dep endencies is included in the supplemental file i-IF-Lear.zip and NumericalStudy.zip . 2. F or any theoretical claim, chec k if you include: (a) Statemen ts of the full set of assumptions of all theoretical results. [Y es] All assumptions are clearly stated in Section 3 . (b) Complete pro ofs of all theoretical results. [Y es] F ull pro ofs are pro vided in Appendix A . (c) Clear explanations of any assumptions. [Y es] Explanations are given alongside the assump- tions in Section 3 . 3. F or all figures and tables that present empirical results, c heck if you include: (a) The co de, data, and instructions needed to re- pro duce the main exp erimental results (either in the supplemental material or as a URL). [Y es] Co de is included in the supplemen tal ma- terial, and datasets are public with download links provided in Section 4 and more details ab out in D.2 . (b) All the training details (e.g., data splits, hy- p erparameters, how they were chosen). [Y es] Detailed implementation settings and hyper- parameters are listed in App endix C . (c) A clear definition of the sp ecific measure or statistics and error bars (e.g., with resp ect to the random seed after running exp erimen ts m ultiple times). [Y es] W e rep ort standard deviations for all results, and omit them only when the v ariance is negligible (less than 0.0001). (d) A description of the computing infrastructure used. (e.g., type of GPUs, in ternal cluster, or cloud provider). [Y es] As describ ed in Ap- p endix D.1 , our exp erimen ts are ligh tw eight and repro ducible on a standard PC without sp ecialized hardware. 4. If you are using existing assets (e.g., co de, data, mo dels) or curating/releasing new assets, chec k if y ou include: (a) Citations of the creator If y our w ork uses existing assets. [Y es] All datasets and existing co des are prop erly cited (see Section 4 and App endix D.2 ). (b) The license information of the assets, if ap- plicable. [Y es] License information for the datasets is listed in App endix. Chen Ma, W anjie W ang, Shuhao F an (c) New assets either in the supplemental material or as a URL, if applicable. [Y es] W e provide an anon ymized implementation of our prop osed metho d in i-IF-Learn.zip . (d) Information ab out consent from data pro viders/curators. [Not Applicable] All datasets used are publicly av ailable. (e) Discussion of sensible conten t if applicable, e.g., p ersonally identifiable information or of- fensiv e con tent. [Not Applicable] The datasets do not contain sensitive or p ersonally ide n tifi- able con tent. 5. If you used crowdsourcing or conducted research with h uman sub jects, chec k if you include: (a) The full text of instructions given to partici- pan ts and screenshots. [Not Applicable] Our w ork do es not inv olve crowdsourcing or hu- man sub jects. (b) Descriptions of p otential participan t risks, with links to Institutional Review Board (IRB) appro v als if applicable. [Not Applicable] Our w ork do es not inv olve crowdsourcing or hu- man sub jects. (c) The estimated hourly w age paid to partici- pan ts and the total amoun t sp en t on partic- ipan t compensation. [Not Applicable] Our w ork do es not inv olve crowdsourcing or hu- man sub jects. i-IF-Learn: Iterativ e F eature Selection and Unsup ervised Learning for High-Dimensional Complex Data: Supplemen t Material A T echnical Details and Pro ofs In section A.1 , we explain the details of the weigh t selection. With the weigh t selection, we pro ve the main theorems and corresp onding lemmas in the following subsections. A.1 Dynamic W eigh t T o decide the reliability constan t w ( t ) , we wan t to test our trust in P ( t ) F,j , j ∈ I ( t − 1) . In other words, we w onder whether these statistics follow a null distribution or not. Let π ( t − 1) I = { P ( t ) F,j , j ∈ I ( t − 1) } b e the set of p -v alues from corrected marginal F -statistics, restricted on the features in I ( t − 1) . An unreliable feature set I ( t − 1) will hav e uniformly distribute d p -v alues π ( t − 1) I . Therefore, it is the h yp othesis testing problem that π ( t − 1) I ∼ U nif (0 , 1) . W e construct a test for the hypothesis H 0 : π ( t − 1) ( j ) ∼ U nif (0 , 1) v s H 1 : π ( t − 1) ( j ) ∼ (1 − ϵ ) U nif (0 , 1) + ϵG, where G is some other distribution that fo cuses on small p -v alues. W e conduct the Higher Criticism statistic Donoho and Jin ( 2004 ) for this test. Denote s ( t − 1) = | I ( t − 1) | and π ( t − 1) ( j ) as the j -th smallest v alue in π ( t − 1) I . The p -v alue is p ( t ) 1 = 1 − exp( − e c − bT ) , where T = max 1 ≤ j ≤ 2 s ( t − 1) / 3 p s ( t − 1) j /s ( t − 1) − π ( t − 1) ( j ) q π ( t − 1) ( j ) (1 − π ( t − 1) ( j ) ) , (11) and b = p 2 log(log ( s ( t − 1) )) , c = 2 log ( log ( s ( t − 1) )) + log ( log ( log ( s ( t − 1) ))) / 2 − log (4 π ) / 2 . Here, the p -v alue p ( t ) 1 ∈ (0 , 1) , and a smaller p ( t ) 1 indicates a larger p ossibilit y that I ( t − 1) is informativ e. A.2 Pro of of Theorem 3.1 Giv en a lab el ˆ ℓ , we use it as a pseudo-lab el to select the influential features for the next step. The selection is based on our new score S ( t ) j = S j ( ˆ ℓ ) , defined in ( 3 ) , where the weigh t is defined in ( 4 ) . Therefore, to show that our IF step is p o werful, we need the score S j ( ˆ ℓ ) to efficiently ev aluate the dep endency b et ween feature x j and ˆ ℓ , and then the data-driven threshold HCT to select a prop er threshold. The follo wing lemma explains the p o wer of our statistic: when the initial lab el delivers some information, then the weigh t will b e close to 1, so that the S j ( ˆ ℓ ) highly dep ends on the F -statistics. F urther, ev en with noisy lab els, our statistic S j ( ˆ ℓ ) clearly separates I and I c . The pro of of the lemma can b e found in Section A.3 . Lemma A.1. Fix a c onstant q > 4 . Denote w ij = E [Σ − 1 / 2 X ij ] as the exp e ctation for data p oint i on fe atur e j , and the over al l me an ¯ w j = 1 n P n i =1 w ij . Denote n k ( ˆ ℓ ) = P n i =1 1 { ˆ ℓ i = k } , k ∈ [ K ] . Supp ose for the influential fe atur es in I , the c ommunity lab el satisfies that for a c onstant c 0 > 0 , min j ∈ I U j ≥ c 0 (log p ) 2 , wher e U j := X k ∈ [ K ] 1 n k ( ˆ ℓ ) X ˆ ℓ i = k ( w ij − ¯ w j ) 2 . Then we have P ( w ≥ 1 − p − q / 2 ) ≥ 1 − p − q / 2 , and further Chen Ma, W anjie W ang, Shuhao F an • If j ∈ I , P ( S j ( ˆ ℓ ) > p − q ) ≤ p − q . • If j ∈ I c , for any u ∈ (0 , 1) , P ( S j ( ˆ ℓ ) < u ) ≤ u − exp( − p ) . F or notation simplicity , w e write S j = S j ( ˆ ℓ ) when there is no misunderstanding. The pro of consists of three steps. W e first show that S j for j ∈ I and j / ∈ I has a clear division with high probability . Then we show that Higher Criticism Threshold (HCT) almost ac hieves the optimal division, in the sense that H C ( j ) for all j ∈ I c is smaller than the selected HCT and no more than C log p feature in I ha ve low er H C ( j ) than HCT. Step 1: Clear division with high probability . W e define a go od even t that the statistics from j ∈ I and j / ∈ I are clearly divided, that B = { max j / ∈ I c S j < 1 + q log p < min j ∈ I S j } . By Lemma A.1 , the probability of B b ounded by the union b ound 1 − P ( B ) ≤ | S | p − q + pp − q = o (1) . Step 2: Under B , all indices from I will b e selected b y HCT. By the algorithm, ˆ I is achiev ed by selecting all the features with p -v alues smaller than the threshold τ . In other words, if we order the features in the wa y that the p-v alue of S j is decreasing, then the first | ˆ I | features are selected. A ccording to the definition of B in Step 1, features from I alw ays hav e smaller p -v alues than those in I c . Therefore, the first | I | features are from I and the following features are from I c . As long as we set the threshold as the p-v alue of the | I | -th smallest one, then we exactly recov er I . Note that we select | ˆ I | according to where the HC scores H C ( j ) achiev es maximum. If H C ( j ) achiev es maximum around j = | I | , then the cutoff is correct. It suffices to show that for any j < | I | , H C ( j ) ≤ H C ( | I | ) . (12) Under B , max j ∈ I S j ≤ p − q . Introduce it into H C ( | I | ) , we hav e H C ( | I | ) ≥ | I | /p − p − q p | I | /p (1 − | I | /p ) ≥ | I | /p − p − q p | I | /p (1 − | I | /p ) . (13) Mean while, we hav e H C ( j ) ≤ √ ( | I |− 1) /p √ 1 − ( | I |− 1) /p for all j ≤ | I | − 1 . Plug these upp er b ounds and ( 13 ) into ( 12 ). W e hav e [ H C ( j )] 2 ≤ [ H C ( | I | )] 2 ⇔ ( | I | − 1) /p 1 − ( | I | − 1) /p ≤ ( | I | /p − p − q ) 2 | I | /p (1 − | I | /p ) ⇔ ( | I | − 1) | I | ( p − | I | ) ≤ ( | I | − p − q ) 2 ( p − | I | + 1) . Rearrange the terms and it suffices to show ( 12 ) if we can show that | I | ( p − | I | )(1 − 2 p − 2 q ) + | I | ( | I | − 2 p − q ) + p − 2 q ( p − | I | + 1) ≥ 0 . When p is sufficiently large, it holds. So ( 12 ) holds for sufficiently large p . Step 3: Under B , only C log 2 p features from I c will b e selected b y HCT. According to previous analysis, it suffices to show H C ( | I | + k ) < H C ( | I | ) when k > C log 2 p . Consider a sequence of threshold v k = k / | I c | for k > C 1 log 2 p . Note that P ( S j ≤ u ) ≤ u − exp ( − p ) for all j ∈ I c . By the Bernstein inequality with δ k = 4 p v k log p/p , when C 1 > 2( p/ | I c | ) 2 and | I c | /p > 1 / 2 , w e hav e P 1 | I c | X j ∈ I c 1 S j δ k ≤ exp − | I c | δ 2 k 2( v k (1 − v k ) + δ k / 3) ≤ exp − | I c | δ 2 k 4 v k (1 − v k ) + e − 3 | I c | δ k / 4 ≤ 2 p − 2 . (14) i-IF-Learn: Iterative F eature Selection and Unsup ervised Learning for High-Dimensional Complex Data Naturally , the union b ound follows, whic h is P 1 | I c | X j ∈ I c 1 S j δ k , for an y k ≥ C 1 log 2 p ≤ 1 p . Hence, the complementary ev ent happ ens with probability 1 − O ( p − 1 ) . Define it as C := 1 | I c | X j ∈ I c 1 S j C 1 log 2 p , X i ∈ I c 1 { S i < v j } < | I c | ( v j + δ j ) < j + 4 p j log p. It means S 0 ( j +4 √ j log p ) ≥ v j . No w let k b e the smallest integer so that k ≥ j + 4 √ j log p , then it follo ws j ≥ k − 1 − 4 √ k log p . Hence, under C ∩ B , for k ≥ 3 C 1 log 2 p , S ( | I | + j +4 √ j log p ) ≥ v j = ⇒ S ( | I | + k ) ≥ ( k − 1) /p − 4 p k log p/p, This further leads to H C ( | I | + k ) = | I | + k p − S ( | I | + k ) q ( | I | + k ) p (1 − | I | + k p ) ≤ | I | + k p − k − 1 p + 4 √ k log p p q ( | I | + k ) p (1 − | I | + k p ) . Com bine it with ( 13 ). T o conclude our claim, we need to show that if 0 . 25 p > k ≥ 3 C 1 log 2 p , there is ( | I | − p − c ) 2 | I | ( p − | I | ) > ( | I | + 1 + 4 √ k log p ) 2 ( | I | + k )( p − | I | − k ) . This can b e shown if ( | I | − p − c ) 2 ( | I | + k )( p − | I | − k ) > ( | I | + 1 + 4 p k log p ) 2 ( | I | + k )( p − | I | − k ) . When | I | ≫ log p , it can further b e simplified as p | I | 3 + k p | I | 2 > p | I | 3 + 8 p p k log p | I | 2 + low er order terms . It holds when k ≥ 3 C 1 log 2 p and p large enough. In other words, H C ( | I | + k ) < H C ( | I | ) for k > C log 2 p where C = 3 C 1 . This gives our second b ound. Com bining the results, Theorem 3.1 is prov ed. A.3 Pro of of Lemma A.1 In this section, we prov e Lemma A.1 used in the previous section. First we discuss the required condition that min j ∈ I U j ≥ c 0 (log p ) 2 , whic h is ab out the estimated lab els ˆ ℓ and the influential features. Consider the K = 2 case where b oth classes hav e size n/ 2 . F or feature j ∈ I , since the ov erall sum is m = 0 , for a constant signal strength κ , there is m 1 = κ and m 2 = − κ . No w, consider the estimated lab el ˆ ℓ . Suppose it classifies r 11 n/ 2 with true lab el 1 and r 21 n/ 2 with true lab el 2 as Class 1. Then we ha ve X k ∈ [ K ] 1 n k ( X i ∈ [ n k ] m i,k ) 2 = 1 ( r 11 + r 21 ) n/ 2 ( κr 11 n/ 2 − κr 21 n/ 2) 2 + 1 (2 − r 11 − r 21 ) n/ 2 ( κ (1 − r 11 ) n/ 2 − κ (1 − r 21 ) n/ 2) 2 = nκ 2 ( r 11 − r 21 ) 2 ( r 11 + r 21 )(2 − r 11 − r 21 ) . Chen Ma, W anjie W ang, Shuhao F an Hence, as long as r 11 = r 21 , i.e. there is a constant difference b etw een the prop ortion the tw o classes that ˆ ℓ classifies in to class 1, then the whole term is at an order of C nκ 2 . The condition follows that C nκ 2 ≥ (log p ) 2 ⇔ κ 2 ≥ (log p ) 2 n . It means a constant error rate is accepted in the initial lab el. No w we come to the pro of. W e will suppress the app earance of feature index j in the subscript for notational simplicit y . W e also remov e ˆ ℓ . Denote J k = { i | ˆ ℓ = k } , k ∈ [ K ] . Let n k = | J k | for k ∈ [ K ] . When j / ∈ I c , the nominator of the F-statistics is given by N 0 = 1 K − 1 X k ∈ [ K ] n k ( 1 n k X i ∈ J k ξ i − 1 n X i ∈ [ n ] ξ i ) 2 ∼ χ 2 K − 1 K − 1 , where ξ i are some N (0 , 1) distributed random v ariables. While the denominator D 0 = 1 n − K X k ∈ [ K ] X i ∈ J k ( ξ i − 1 n k X j ∈ J k ξ j ) 2 ∼ χ 2 n − K n − K . Using concen tration inequality , we find that there is a constant C 0 so that P ( N 0 > 1 + C 0 q log p ) ≤ p − q , P ( D 0 < 1 − C 0 p q log p/n ) ≤ p − q . So P ( N 0 /D 0 > 1 + 2 C 0 q log p ) ≤ 2 p − q . And if j ∈ I , denote ∆ m i = m i − ¯ m, ∆ ξ i = ξ i − ¯ ξ N 1 = 1 K − 1 X k ∈ [ K ] n k ( 1 n k X i ∈ J k (∆ ξ i + ∆ m i )) 2 ∼ χ 2 K − 1 K − 1 + Q + U j Where Q = 1 K − 1 X k ∈ [ K ] 1 n k X i ∈ J k ∆ ξ i + ∆ m i ! 2 Using concen tration inequality of Gaussian, P ( | Q | + χ 2 K − 1 K − 1 > q log p ) ≤ p − q . So P ( N 1 < U j − q log p ) ≤ p − q . Mean while, if l ( i ) = k , we denote ∇ m i = m i − 1 n k P j ∈ J k m j , ∇ ξ i = ξ i − 1 n k P j ∈ J k ξ j D 1 = 1 n − K X i ∈ [ n ] ( ∇ m i + ∇ ξ i ) 2 ∼ χ 2 n − K + 2 P i ∈ [ n ] ∇ m i ∇ ξ i + ( ∇ m i ) 2 n − K Using Gaussian concentration, there is a constant C , so that P ( D 1 > C ) ≤ p − q . In combine, we find P ( D 1 / N 1 ≤ q log p ) ≤ P ( D 1 / N 1 < U j /C ) ≤ p − q . Therefore, P ( P F,j ≥ p − q ) ≤ P ( D 1 / N 1 ≤ q log p ) ≤ p − q . The next step would b e considering the reliability constant. W e note that T ≥ p | I | 1 / | I | − P F, (1) p P F, (1) ≥ p − 1 − p − q p − q / 2 ≥ p q / 2 − 1 ≥ 2 p Then p 1 ≥ 1 − exp( − exp(log p − p )) ≥ exp( − p ) . And w e get w = 1 − p 1 p 1 +0 . 6 ≥ 1 − exp( − p ) . Finally , for j ∈ I we ha ve P ( S j > 2 p − q ) ≤ P ( P F,j > 2 p − q − w + 1) ≤ p − q . F or j ∈ I c , w e hav e P ( S j < u ) ≤ P ( P F,j w < u ) ≤ u − exp( − p ) . The result is prov ed. i-IF-Learn: Iterative F eature Selection and Unsup ervised Learning for High-Dimensional Complex Data A.4 Pro of of Theorem 3.2 With a correct selection of I , k -means on the low-dimensional embeddings will give a nice clustering result. The clustering error rate is ev aluated by the Hamming error, which is the prop ortion of unmatc hed lab els under the b est scenario. In detail, for estimated lab el ˆ ℓ , let π : [ K ] → [ K ] b e any p ermutation of { 1 , · · · , K } , then E r r ( ˆ ℓ, ℓ ) = min π :[ K ] → [ K ] n X i =1 1 { ˆ ℓ π ( i ) = ℓ i } . F or notation simplicity , denote X as the p ost-selection data matrix X ( t ) . Denote s I b e the num b er of informative features in I ( t ) and s b e the total num b er. The normalized data matrix can b e written as W = LM I + E , where E is the noise matrix, L ∈ { 0 , 1 } n × K is the lab el matrix and M I ∈ R s × K b e the mean matrix on I ( t ) among all classes. Denote τ I b e the eigengap of M I , whic h is no smaller than τ √ s I . A ccording to random matrix theory V ershynin ( 2010 ), with high probability ∥ E ∥ ≤ 2( √ n + √ s ) Let ˆ U denote the top K left singular v ectors of X and U denote the top K left singular v ectors of LM I . By Da vis-Kahan Theorem Davis and Kahan ( 1970 ), there exists an orthogonal matrix O , so that ∥ ˆ U − U O ∥ ≤ √ n + √ s eigengap ( LM I ) ≤ C √ n + √ s √ nτ I := δ. Next w e examine the p erformance of k -means on ˆ U . F or any estimated label ˆ ℓ and cen ters ˆ u , define the within-cluster distance L ( ˆ ℓ, ˆ u ) = P n i =1 ∥ z i − ˆ u ˆ ℓ ( i ) ∥ 2 . The algorithm k -means is to find ˆ ℓ that minimizes L ( ˆ ℓ, ˆ u ) . Supp ose the singular v alue decomp osition LM I = U Λ V ′ , then U = LM I V Λ − 1 . F or tw o no des i and j in the same group, there is ℓ i = ℓ j and the i -th row and j -th row in L are the same. Therefore, the i -th row and j -th ro w of U are the same. This will b e the basis of clustering. Denote the i -th row of ˆ U as z i . Denote the k -th row of M I V Λ − 1 as u k . F or the true lab els ℓ and centers u k ’s, there is L ( ℓ, u ) = P n i =1 ∥ z i − u ℓ ( i ) ∥ 2 . Let ˆ ℓ and ˆ u b e the lab els and centers identified by k -means. Hence, for cen ters ˆ u k and lab els ˆ ℓ , L ( ˆ ℓ, ˆ u ) ≤ L ( ℓ, u ) , (15) F or any comm unity k , let the p erm utation π ( k ) = arg min 1 ≤ j ≤ K ∥ u k − ˆ u j ∥ . Hence, π ( k ) is the comm unity where the estimated center is closest to u k . W e wan t to con trol the distance b et ween u k and ˆ u π ( k ) . A ccording to k -means, for communit y k , let n k b e the size of communit y k , then L ( ˆ ℓ, ˆ u ) ≥ X ℓ ( i )= k ∥ z i − ˆ u ˆ ℓ ( i ) ∥ 2 ≥ X ℓ ( i )= k ( −∥ z i − u k O ∥ 2 + 1 2 ∥ u k O − ˆ u ˆ ℓ ( i ) ∥ 2 ) ≥ − n X i =1 ∥ z i − u k O ∥ 2 + 1 2 X ℓ ( i )= k ∥ u k O − ˆ u ˆ ℓ ( i ) ∥ 2 ≥ − L ( ℓ, u ) + 1 2 n k ∥ u k O − ˆ u π ( k ) ∥ 2 . (16) Com bining ( 15 ) and ( 16 ), there is ∥ u k − ˆ u π ( k ) ∥ 2 ≤ 4 L ( ℓ, u ) /n k ≤ 4 L ( ℓ, u ) /cn. Recall that the centers { u i , i = 1 , . . . , K } are 1 / √ n -distance apart. If L ( ℓ, u ) < c 0 for a constant c 0 small enough, then eac h u k is paired with a unique ˆ u π ( k ) suc h that ∥ ˆ u π ( k ) − u k ∥ ≤ 2 p L ( ℓ, u ) /cn . Chen Ma, W anjie W ang, Shuhao F an F urthermore, since the data p oin ts come from ˆ U and the centers are from U , where the distance is controlled by the Da vis-Kahan Theorem. Therefore, w e control the loss in the idean case, where L ( ℓ, uO ) = n X i =1 ∥ z i O ′ − u ℓ ( i ) O O ′ ∥ 2 ≤ K δ 2 . (17) Finally , we consider the mis-classification rate. T o simplify the notations, we assume π ( k ) = k without loss of generalit y . Then the misclassified no des are S = { i : ℓ i = ˆ ℓ i } . The misclassification rate is E r r ( ˆ ℓ, ℓ ) = | S | /n . L ( ˆ ℓ, ˆ u ) = n X i =1 ∥ z i − ˆ u ˆ ℓ i ∥ 2 ≥ − n X i =1 ∥ z i O ′ − u ℓ i ∥ 2 + 1 2 n X i =1 ∥ u ℓ i − ˆ u ˆ ℓ i O ′ ∥ 2 ≥ − L ( ℓ, uO ) + 1 2 X i ∈ S ∥ u ℓ i − ˆ u ˆ ℓ i O ′ ∥ 2 ≥ − L ( ℓ, uO ) + 1 2 | S | /n. Com bining it with L ( ˆ ℓ, ˆ u ) ≤ L ( ℓ, uO ) in ( 15 ) and L ( ℓ, uO ) ≤ δ 2 in ( 17 ), then we hav e E r r ( ˆ ℓ, ℓ ) = | S | /n ≤ nδ 2 . The theorem is prov ed. i-IF-Learn: Iterative F eature Selection and Unsup ervised Learning for High-Dimensional Complex Data B Pseudo-co de for Algorithms In this section, we present the pseudo-co de for our algorithm and some other algorithms without existing pack ages. Here is the list of algorithms we hav e discussed: • IFPCA, the initialization step and a comparison algorithm, in Algorithm 3 • i-IF-Learn, our algorithm, in Algorithm 4 • DeepCluster in Algorithm 5 • Deep Em b edding Clustering (DEC) in Algorithm 6 • Uniform Manifold Approximation and Pro jection (UMAP) in Algorithm 7 • V ariational Auto enco der (V AE) in Algorithm 8 In this section, we only present the pseudo-co de. Hyper-parameter selections and implementation details can b e found in Section C . Algorithm 3 IFPCA Initialization Pro cedure Require: Data matrix X ∈ R n × p , n umber of clusters K Ensure: Initial cluster lab els ℓ (0) , initial influential feature set I (0) , p-v alues of KS test P K S,p 1: Normalized data matrix X , denoted it as W . Step 1.1 Compute K olmogorov e-Smirnov scores 2: for j = 1 to p do 3: ψ n,j ← √ n · sup t | F n,j ( t ) − Φ( t ) | , where F n,j ( t ) is the empirical cumulativ e density function of w j and Φ is standard normal distribution. 4: end for 5: Normalize scores: ψ ∗ n,j ← ψ n,j − mean ( ψ n, · ) std ( ψ n, · ) Step 1.2: HCT and feature selection: 6: for j = 1 to p do 7: P K S,j ← 1 − F 0 ( ψ ∗ n,j ) , where F 0 is the null distribution. 8: end for 9: Sort p-v alues: P K S, 1 ≤ P K S, 2 ≤ · · · ≤ P K S,p 10: for j = 1 to p/ 2 where P K S,j > log ( p ) /p do 11: H C p,j ← √ p ( j /p − π ( j ) ) q max { √ n ( j /p − π ( j ) ) , 0 } + j /p 12: end for 13: ˆ j ← arg max j H C p,j , t HC p ← ψ ∗ n, ˆ j 14: I (0) ← { 1 ≤ j ≤ p | ψ ∗ n,j > t HC p } 15: Step 1.3: PCA embedding and k -means clustering: 16: Apply PCA to p ost-selection data, retain top K − 1 comp onen ts. Denote it as U . 17: ℓ (0) ← k -means( U , K ) Chen Ma, W anjie W ang, Shuhao F an Algorithm 4 i-IF-Learn Require: Data matrix X ∈ R n × p , n umber of clusters K Ensure: Predicted cluster lab els ℓ , influential feature set I Step 1: Initialization with IFPCA Require: Data matrix X ∈ R n × p , n umber of clusters K Ensure: Initial cluster lab els ℓ (0) , initial influential feature set I (0) , p-v alues of KS test P K S,p 1: Detail for this part, please see in Alg 3 Step 2: Iterative Lo op Require: Data matrix X ∈ R n × p , num b er of clusters K , initial cluster lab els ℓ (0) , initial influential feature set I (0) , p-v alues of KS test P K S,p Ensure: Predicted cluster lab els ℓ , influential feature set I 1: Sample F random as F statistics under random selected features. 2: for t = 1 , 2 , . . . , max_iter do Step 2.1: Compute F statistic 3: for j = 1 to p do 4: Computer F ( t ) ( j ) under ℓ (0) 5: Normalize the F statistics with quantiles: F ( t ) adj ( j ) = F ( j ) − Q d 2 Q d 3 − Q d 1 ∗ ( Q t 3 − Q t 1 ) + Q t 2 , where Q d q and Q t q are empirical and theoretical q-th quantiles of F ( t ) ( j ) and the null F-distribution F 0 , resp ectiv ely . 6: P ( t ) F,j ← 1 − F 0 ( F ( t ) adj ( j )) 7: end for Step 2.2 Calculate w eight for F-test 8: F or { 1 ≤ m ≤ p | m ∈ I ( t − 1) } , π ( t − 1) m = mean( F ( t ) adj ( m ) < F random ) 9: Sort π ( t − 1) : π ( t − 1) (1) ≤ π ( t − 1) (2) ≤ · · · ≤ π ( t − 1) ( s ( t − 1) ) , where s ( t − 1) = | I ( t − 1) | 10: p ( t ) 1 = 1 − exp( − e c − bT ) , where T = max 1 ≤ j ≤ 2 s ( t − 1) / 3 √ s ( t − 1) j /s ( t − 1) − π ( t − 1) ( j ) q π ( t − 1) ( j ) (1 − π ( t − 1) ( j ) ) 11: W eight w ( t ) = 1 − p ( t ) 1 / ( p ( t ) 1 + 0 . 6) Step 2.3: Compute core statistic 12: F or eac h feature j , core statistic is S ( t ) j = w ( t ) Φ − 1 (1 − P ( t ) F,j ) + (1 − w ( t ) )Φ − 1 (1 − P K S,j ) , where Φ − 1 is in verse standard normal distribution Step 2.4: Calculate threshold 13: F or each feature j , π ( t ) j = Φ(1 − S ( t ) j / p ( w ( t ) ) 2 + (1 − w ( t ) ) 2 ) , where Φ is standard normal distribution 14: Sort the p -v alues as π ( t ) (1) ≤ π ( t ) (2) ≤ · · · ≤ π ( t ) ( p ) 15: The HCT can b e found as τ ( t ) = S ( t ) ˆ j , where ˆ j = arg max log p ≤ j ≤ p/ 2 j /p − π ( t ) ( j ) q π ( t ) ( j ) (1 − π ( t ) ( j ) ) 16: I ( t ) = { 1 ≤ j ≤ p | S ( t ) j ≥ τ ( t ) } Step 2.5: Reduce dimensions and cluster 17: Apply Laplacian Eignmap or PCA on W [: , I ( t ) ] , retain the top K + 2 eigenv ectors to form a sp ectral matrix U ( t ) 18: P erform k -means on U ( t ) , then ℓ ( t ) = k -means ( U ( t ) , K ) 19: if r ( t ) = | I ( t ) /I ( t − 1) | | I ( t − 1) | < 10% then 20: break 21: end if 22: end for i-IF-Learn: Iterative F eature Selection and Unsup ervised Learning for High-Dimensional Complex Data Algorithm 5 DeepCluster with Auto encoder and Hyp erparameter Optimization Require: Input data X , num b er of clusters K Ensure: Predicted cluster lab els ℓ 1: Initialize an Optuna study to maximize clustering p erformance 2: for eac h trial in Optuna do 3: Sample h yp erparameters: hidden size h , ep ochs E , iterations T 4: Initialize an auto encoder mo del with enco der, deco der, and a classification head ℓ (0) 5: for eac h iteration t = 1 to T do 6: Enco de input W to get lo w-dimensional features z 7: Normalize z and apply k -means with K clusters to obtain pseudo-lab els 8: for eac h ep o c h e = 1 to E do 9: Deco de z to reconstruct input, and classify using pseudo-lab els 10: Compute total loss: reconstruction loss + classification loss 11: Up date mo del parameters via backpropagation 12: end for 13: end for 14: Compute silhouette score s based on final cluster assignments 15: Define ob jective score as: s − 0 . 5 · final loss 16: end for 17: Retriev e the b est hyperparameters from Optuna 18: T rain the mo del again using the b est settings, obtion predicted cluster lab els ℓ Algorithm 6 Clustering with DEC Require: Input data X , num b er of clusters K Ensure: Predicted cluster lab els ℓ 1: Define an auto encoder: enco der f ϕ ( x ) = z , deco der g θ ( z ) = ˆ x 2: for ep och = 1 to N pretrain do 3: Compute reconstruction: ˆ x = g θ ( f ϕ ( x )) 4: Minimize MSE loss: L recon = ∥ x − ˆ x ∥ 2 5: end for 6: Enco de all data: z = f ϕ ( x ) 7: Apply k -means on z to obtain cluster centers { µ k } K k =1 8: Initialize cluster lay er with these centers 9: for ep och = 1 to N DEC do 10: Enco de z = f ϕ ( x ) and compute soft assignments q ik : q ik = (1+ ∥ z i − µ k ∥ 2 ) − 1 P j (1+ ∥ z i − µ j ∥ 2 ) − 1 11: Compute target distribution p : p ik = q 2 ik / P i q ik P j ( q 2 ij / P i q ij ) 12: Minimize KL div ergence loss: L KL = KL ( P ∥ Q ) = P i P k p ik log p ik q ik 13: T otal loss: L = L KL + L recon 14: Up date mo del parameters via gradien t descent 15: end for 16: Assign cluster lab el ℓ i = arg max k q ik for eac h sample Algorithm 7 Clustering with UMAP Require: Input data X , num b er of clusters K Ensure: Predicted lab els ℓ 1: Obtain top K + 2 eigenv ectors for X X T , and use them as initialization for UMAP optimizer 2: Apply UMAP on X , retain the top K + 2 eigenv ectors to form a sp ectral matrix U 3: P erform k -means on U , then predicted lab els ℓ = k -means ( U, K ) Chen Ma, W anjie W ang, Shuhao F an Algorithm 8 Clustering with V AE Require: Input data X , num b er of clusters K Ensure: Predicted lab els ℓ 1: Define enco der netw ork q ϕ ( z | x ) that maps input X to latent mean µ and log-v ariance log σ 2 2: Use reparameterization trick: z = µ + σ · ϵ , where ϵ ∼ N (0 , I ) 3: Define deco der netw ork p θ ( w | x ) to reconstruct input from latent vector 4: T rain the V AE b y minimizing the loss: L ( x ) = E q ϕ ( z | x ) [log p θ ( x | z )] − β · D KL ( q ϕ ( z | x ) ∥ p ( z )) 5: Use a warm-up sc hedule to gradually increase β from 0 to 1 during training 6: Enco de all samples to latent space: Z = µ ( x ) for each x 7: Apply k -means clustering on Z with K clusters, obtain predicted lab els ℓ C Implemen tation Details and P arameters In the follo wing subsections, we present the implementation details and hyperparameter settings of all metho ds in volv ed in our study . Specifically , i-IF-Lap is our prop osed iterative feature selection algorithm that incorp orates Laplacian embedding to guide low-dimensional clustering. It constructs a cosine-based affinity graph and applies sp ectral embedding for representation learning. DeepCluster is a self-sup ervised deep clustering metho d that alternates b etw een clustering with K-means and up dating a feature enco der, which we adapt to our tabular datasets using ligh tw eight auto encoders. IFV AE and i-IF-Lap+V AE are based on the V ariational Auto enco der framew ork, where clustering is p erformed in the learned latent space, and i-IF-Lap+V AE further in tegrates our iterativ e feature selection pro cedure. DEC (Deep Embedded Clustering) jointly optimizes a clustering loss and a deep auto encoder, and has b een used as a strong baseline for representation-based clustering. UMAP is a non-linear dimensionality reduction technique that preserves b oth lo cal and global struc ture of the data, and w e use it b oth as a baseline and as part of i-IF-Lap+UMAP . Each metho d is implemen ted with reasonable default parameters or carefully tuned hyperparameters, as detailed in the sections b elo w. C.1 i-IF-Lap In i-IF-Lap, implementation details for Laplacian Eignmap are: Cosine distance is computed b et ween all pairs of feature vectors in W [: , I ( t ) ] . The affinit y matrix A ∈ R n × s ( t ) is constructed using a Gaussian kernel applied to the cosine distances: A ij = exp( − γ · d 2 ij ) , where d ij is the cosine distance b et ween feature vectors i and j , and γ is a scaling parameter. F or parameters: • Gamma ( γ ): 1 • Affinit y t yp e: Precomputed affinity matrix • Num b er of nearest neigh b ors: 8 • Output dimensionalit y: K + 2 • Implemen tation: SpectralEmbedding from scikit-learn The resulting low-dimensional represen tation U ∈ R n × ( K +2) is subsequen tly used for clustering. C.2 DeepCluster Our dataset is relatively small and low-dimensional compared to image dataset, and therefore do es not require a deep or complex neural netw ork architecture. F or b oth Deep cluster and i-IF-Lap+DeepCluster, we use optuna to obtain optimal parameters. The parameters tuned include: i-IF-Learn: Iterative F eature Selection and Unsup ervised Learning for High-Dimensional Complex Data • h : the size of the Auto enco der’s hidden lay er, selected from {64, 128, 256}. • E : the num b er of training ep ochs p er clustering iteration, ranging from 5 to 15. • T : the total num b er of clustering-training iterations, ranging from 3 to 10. • learning_rate : 1 × 10 − 3 C.3 V AE W e use the IFV AE imp lemen tation pro vided under the GNU GPL by Chen et al. (2023) Chen et al. ( 2023 ), as instructed in the rep ository license. The citation to the original pap er is included in our manuscript. F or b oth IFV AE and i-IF-Lap+V AE, parameters are: • laten t_dim : Dimensionalit y of the latent space in the V AE, set to 25. • batc h_size : Mini-batc h size during training, set to 50. • ep ochs : T otal num b er of training ep ochs, set to 100. • learning_rate : Learning rate used in the optimizer, set to 0.0005). • k appa : W arm-up increment p er ep o c h for β in the KL divergence term, set to 1. C.4 DEC W e use the publicly av ailable DEC implementation released under the MIT License by Junyuan Xie (2015) Xie et al. ( 2016 ). The license p ermits use, mo dification, and redistribution with appropriate credit. F or parameters in DEC: • Hidden la yer dimensions: A list sp ecifying the num b er of neurons in the enco der and deco der lay ers, set to [500, 10] for an enco der of size p → 500 → 10 and a mirrored deco der. • Pretraining ep ochs ( N pretrain ): Number of ep o c hs for unsup ervised auto encoder pretraining, set to 10. • DEC training ep ochs ( N DEC ): Number of ep o c hs for joint clustering optimization, set to 100. • Batc h size: Num b er of samples p er training batch, set to 256. • Learning rate: Learning rate for the optimizer, set to 1 × 10 − 3 . C.5 UMAP F or b oth UMAP and i-IF-Lap+UMAP , parameters are: • Num b er of neigh b ors: 8 • Metric: Cosine distance • Em b edding dimensionalit y: K + 2 • Angular random pro jection forest: Enabled ( angular_rp_forest=True ) • Implemen tation: umap.UMAP from the umap Python pac k age Chen Ma, W anjie W ang, Shuhao F an D Details ab out Numerical Exp erimen ts D.1 Computer Resources All exp erimen ts w ere conducted on Amazon W eb Services (A WS) using m5.large instances. The key sp ecifications of the compute environmen t are as follows: • Instance t yp e: A WS m5.large • CPU: In tel(R) Xeon(R) Platinum 8175M CPU @ 2.50GHz • Cores/Threads: 2 cores, 4 threads (Hyp erthreading enabled) • Memory: 8 GB RAM • GPU: None (CPU-only setup) • Virtualization: KVM hypervisor D.2 Datasets T o facilitate comparative analysis, following tables summarize the key c haracteristics of the b enc hmark data sets used in this study . F or each data set, we rep ort three key quantities: the num b er of samples n , the num b er of features p , and the num b er of cluster K . W e use a set of publicly a v ailable gene microarra y datasets in our study . Do wnload datasets by following links: h ttps://data.mendeley .com/datasets/nv2x6kf5rd/1 , https://data.mendeley .com/datasets/cdsz2ddv3t/1 . These datasets are licensed under the Creative Commons Attribution 4.0 In ternational License (CC BY 4.0), as indicated on the data hosting platform. T able 8 includes the 8 scRNA-seq data sets, while T able 7 contains the 10 microarray data sets. This alignment enables consistent assessment of algorithmic p erformance across diverse biological con texts. Data name Source K n p 1 Brain Pomero y (02) 5 42 5,597 2 Breast cancer W ang et al. (05) 2 276 22,215 3 Colon cancer Alon et al. (99) 2 62 2,000 4 Leukemia Golub et al. (99) 2 72 3,571 5 Lung cancer (1) Gordon et al. (02) 2 181 12,533 6 Lung cancer (2) Bhattac harjee et al. (01) 2 203 12,600 7 Lymphoma Alizadeh et al. (00) 3 62 4,026 8 Prostate cancer Singh et al. (02) 2 102 6,033 9 SRBCT Kahn (01) 4 63 2,308 10 Su cancer Su et al. (01) 2 174 7,909 T able 7: Summary of microarray datasets with K (num b er of clusters), n (samples), and p (features). F or scRNA-seq data sets except Patel, we add log transformation ( X = l og ( X + 1) ) on data matrices. i-IF-Learn: Iterative F eature Selection and Unsup ervised Learning for High-Dimensional Complex Data Data set K n p 1 Camp1 7 777 13,111 2 Camp2 6 734 11,233 3 Darmanis 9 466 13,400 4 Deng 6 268 16,347 5 Go olam 5 124 21,199 6 Grun 2 1,502 5,547 7 Li 9 561 25,369 8 Patel 5 430 5,948 T able 8: Summary of scRNA-seq datasets with K (num b er of clusters), n (samples), and p (features). D.3 A dditional Simulation Results in Synthetic Datasets Figure 5: Comparison of feature selection p erformance under increasing weak signal strength ( τ w ). Each subplot rep orts a differen t metric: (a) F alse Positiv e Rate (FPR), (b) T rue Positiv e Rate (TPR), (c) F alse Discov ery Rate (FDR), and (d) T rue Discov ery Rate (TDR). W e compare three feature selection metho ds: baseline IFPCA, our prop osed i-IF-PCA and i-IF-Lap. As τ w increases, w e provide detailed insights into each subplot of Figure 5 : • (a) F alse Positiv e Rate (FPR). As τ w increases, b oth i-IF-PCA and i-IF-Lap significantly reduce FPR, while IF-PCA maintains a consistently high FPR across all levels. This indicates that our prop osed iterative metho ds are muc h more effective in suppressing noise features, esp ecially as signal strength gro ws. • (b) T rue Positiv e Rate (TPR). The TPR for IFPCA remains stagnant, failing to reco ver true signals Chen Ma, W anjie W ang, Shuhao F an under increasing τ w . In contrast, b oth i-IF-PCA and i-IF-Lap demonstrate a clear transition from lo w to high TPR as τ w increases, indicating their capacity to adaptively extract true features. Notably , i-IF-Lap and i-IF-PCA achiev e near-p erfect TPR when τ w > 0 . 7 . • (c) F alse Discov ery Rate (FDR). IFPCA shows extremely high FDR (close to 1), suggesting that nearly all selected features are false disco veries. Both i-IF v ariants show decreasing FDR as τ w increases, with i-IF-PCA sligh tly outp erforming i-IF-Lap under high signal strengths. • (d) T rue Discov ery Rate (TDR). TDR follows a similar trend to TPR. The iterative metho ds rapidly increase TDR with growing τ w , again highlighting their adaptabilit y . i-IF-Lap and i-IF-PCA reach near-p erfect TDR b ey ond τ w = 0 . 8 , indicating v ery high fidelity in recov ering true features. Conclusion. These results further confirm that iterative frameworks (i-IF-PCA and i-IF-Lap) significantly outp erform the static IFPCA in b oth reducing false selections and recov ering weak signals, particularly when w eak signals b ecome stronger. E A dditional Exp erimen t for Em b edding Metho ds W e applied our i-IF-L e arn framew ork with different embedding metho ds on scRNA-seq datasets. W e compared four p opular dimensionality reduction techniques: UMAP , Auto encoder, Laplacian Eigenmap, and PCA. The clustering accuracy is rep orted in the form of mean (standard deviation) o ver 30 rep etitions. Data UMAP Auto enco der Laplacian PCA camp1 0.804 (0.0012) 0.671 (0.0418) 0.740 (0.0000) 0.738 (0.0000) camp2 0.546 (0.0041) 0.630 (0.0137) 0.605 (0.0000) 0.617 (0.0000) darmanis 0.720 (0.0227) 0.781 (0.0222) 0.785 (0.0000) 0.783 (0.0000) deng 0.626 (0.0083) 0.861 (0.0026) 0.869 (0.0000) 0.802 (0.0000) go olam 0.665 (0.0109) 0.916 (0.0750) 0.758 (0.0000) 0.629 (0.0000) grun 0.672 (0.0027) 0.692 (0.0087) 0.994 (0.0000) 0.991 (0.0000) li 0.943 (0.0135) 0.897 (0.0019) 0.966 (0.0000) 0.980 (0.0000) patel 0.946 (0.0028) 0.771 (0.0284) 0.942 (0.0000) 0.788 (0.0000) T able 9: Clustering accuracy of different embedding metho ds across scRNA-seq datasets using i-IF-Learn. Ov erall, the results sho w that Laplacian Eigenmap achiev es the b est performance across multiple datasets, demonstrating b oth high accuracy and stability . While UMAP and Auto enco der sometimes ac hieve the highest accuracy for sp ecific datasets, their p erformance is less stable, with larger standard deviations. PCA p erforms w ell on datasets with linear structure, but is generally outp erformed by Laplacian Eigenmap in most other cases. i-IF-Learn: Iterative F eature Selection and Unsup ervised Learning for High-Dimensional Complex Data F A dditional Baseline Comparisons: IDC and CLEAR T o further comprehensively ev aluate our prop osed metho d, we conducted additional exp erimen ts comparing i-IF-Lap against tw o other baseline metho ds: IDC and CLEAR. First, we applied IDC to our datasets. How ever, w e encountered out-of-memory constraints on the larger datasets, limiting its successful application to 6 datasets. As sho wn in T able 10 , our i-IF-Lap metho d outp erforms IDC on 5 out of the 6 ev aluated datasets. A dditionally , we compared i-IF-Lap with CLEAR across 8 scRNA-seq datasets. As detailed in T able 11 , i-IF-Lap demonstrates sup erior clustering accuracy , consistently outp erforming CLEAR across all 8 datasets. T able 10: Clustering accuracy comparison b et ween IDC and i-IF-Lap on 6 datasets. IDC encoun tered out-of- memory errors on the remaining larger datasets. Metho d Brain Colon Lymphoma Leukemia Prostate SRBCT IDC 0.238 0.645 0.645 0.653 0.510 0.524 i-IF-Lap 0.783 0.635 0.936 0.972 0.569 0.984 T able 11: Clustering accuracy comparison b etw een CLEAR and i-IF-Lap on 8 scRNA-seq datasets. Metho d Camp1 Camp2 Darmanis Deng Go olam Grun Li Patel CLEAR 0.597 0.426 0.487 0.549 0.742 0.540 0.886 0.540 i-IF-Lap 0.740 0.605 0.785 0.869 0.758 0.994 0.966 0.942 G A dditional Exp erimen t: Lasso with Pseudo Lab els The reviewer suggested comparing our approach with sup ervised feature selection metho ds such as Lasso. While these metho ds are p o werful when reliable lab els are av ailable, our problem is inherently unsup ervised and relies on pseudo-labels generated during the iterative pro cedure. As discussed in the main text, pseudo-lab els in early iterations can b e noisy , and sup ervised feature selection metho ds may treat these lab els as ground truth, p oten tially leading to error propagation. T o further examine this issue, we conducted an additional exp erimen t using Lasso-based feature selection on the microarra y datasets. Sp ecifically , we applied Lasso to the standardized data using the pseudo-lab els pro duced by the iterativ e pro cedure, and ev aluated the classification accuracy using the selected features. Metho ds Brain Breast Colon Leukemia Lung1 Lung2 Lymphoma Prostate SRBCT SuCancer Lasso 0.643 0.627 0.597 0.931 0.967 0.783 0.468 0.618 0.460 0.500 i-if-lap 0.738 0.630 0.597 0.972 0.995 0.803 0.936 0.569 0.984 0.603 T able 12: Comparison b etw een Lasso-based feature selection and the i-IF-Lap on microarray datasets. As sho wn in T able 12 , our prop osed i-IF-Lap metho d outp erforms the Lasso-based approach on 9 out of the 10 ev aluated microarray datasets. Notably , in datasets such as Lymphoma and SRBCT , the accuracy of Lasso drops drastically compared to our framework. This substantial p erformance gap empirically v alidates our hypothesis: explicitly treating early-stage, noisy pseudo-lab els as absolute ground truth—as standard sup ervised metho ds like Lasso inherently do—leads to severe error propagation. In contrast, our adaptiv e screening metric successfully mitigates this risk by dynamically balancing pseudo-lab el sup ervision with unsup ervised signals, demonstrating the necessit y and sup eriority of our tailored unsup ervised framework.
Original Paper
Loading high-quality paper...
Comments & Academic Discussion
Loading comments...
Leave a Comment