Central Dogma Transformer III: Interpretable AI Across DNA, RNA, and Protein
Biological AI models increasingly predict complex cellular responses, yet their learned representations remain disconnected from the molecular processes they aim to capture. We present CDT-III, which extends mechanism-oriented AI across the full ce…
Authors: Nobuyuki Ota
Central Dogma T ransf ormer III: Interpr etable AI Acr oss DN A, RNA, and Pr otein Nobuyuki Ota Independent Researcher Burlingame, CA, USA nobuyuki.ohta@gmail.com Abstract Biological AI models increasingly predict complex cellular responses, yet their learned representations remain disconnected from the molecular processes they aim to capture—an interpretability gap that limits scientific insight. Closing this gap requires architectures that mirror the cell’ s own logic—the central dogma’ s information flow from DN A to RN A to protein—so that each computational step corresponds to a verifiable biological process. W e present CDT -III, which ex- tends mechanism-oriented AI across the full central dogma: DN A, RN A, and protein. Its two-stage architecture mirrors the spatial compartmentalization of the cell: a V irtual Cell Embedder for the nucleus (VCE-N) models transcrip- tion and one for the cytosol (VCE-C) models translation. By follo wing the cell’ s molecular pathway , CDT -III produces interpretable attention maps at every layer and jointly predicts mRN A and surface protein changes from CRISPRi pertur- bations. On fiv e held-out genes, CDT -III achiev es per-gene RN A r = 0 . 843 and protein r = 0 . 969 . Adding protein prediction improves RN A performance ov er the RN A-only model ( r = 0 . 804 → 0 . 843 ), demonstrating that downstream tasks can regularize upstream representations. Protein supervision also sharpens DN A-lev el interpretability , increasing CTCF enrichment by 30%. Applied to in silico CD52 knockdown—approximating Alemtuzumab’ s mechanism of action— the model predicts 29/29 protein changes in the correct direction and rediscovers 5 of 7 known clinical side effects without clinical data. Moreover , gradient-based side effect profiling requires only unperturbed baseline data as input ( r = 0 . 939 vs. perturbation-based analysis), enabling screening of all 2,361 modeled genes without new experiments. This demonstrates that mechanism-oriented AI, de- signed to re veal rather than merely predict, can generate clinically actionable in- sights from perturbation data alone. 1 Introduction The interpretability gap in biological AI—the disconnect between a model’ s predictions and the molecular mechanisms producing them—persists in part because existing architectures do not re- flect the cell’ s own information flow [ Novak ovsky et al. , 2023 , Eraslan et al. , 2019 ]. The central dogma [ Crick , 1970 ] routes information from DNA through RN A to protein, yet existing pertur- bation models stop at mRNA [ Roohani et al. , 2024 , Lotfollahi et al. , 2023 ], missing protein-lev el phenotypes entirely; mRN A abundance explains only 40–80% of protein v ariance [ Gygi et al. , 1999 , V ogel & Marcotte , 2012 ]. This architectural mismatch carries direct consequences for drug devel- opment, where mechanistic understanding at the protein le vel determines whether a side effect can be anticipated or only observed after the fact. Despite this gap, substantial progress has been made in perturbation prediction [ Roohani et al. , 2024 , Lotfollahi et al. , 2023 ], single-cell foundation models [ Cui et al. , 2024 , Theodoris et al. , 2023 ], and multi-modal biological AI [ Chen et al. , 2024a ]. CDT -II [ Ota , 2026 ] demonstrated that mirroring Preprint. the central dogma in model architecture yields attention maps directly interpretable as regulatory structure. Howe ver , no existing model connects all three layers of the central dogma—DN A, RNA, and protein—in an interpretable, end-to-end framew ork for perturbation response prediction. W e present CDT -III, which extends mechanism-oriented AI to the complete central dogma. The architecture comprises two stages—VCE-N (nuclear) and VCE-C (cytosolic)—that separate tran- scription and translation into distinct computational modules, each with attention mechanisms cor - responding to specific biological processes. This biological inductive bias is not optional: a naiv e single-stage fusion fails to maintain RN A prediction quality (Section 5.1 ), confirming that architec- tural design must respect the spatial and functional organization of the cell. CDT -III yields three findings with implications be yond biology: 1. Multi-task r egularization : Adding protein prediction improv es RN A prediction, demon- strating that downstream tasks can re gularize upstream representations. 2. Downstream supervision impro ves upstream interpretability : Protein supervision sharpens DNA-le vel regulatory element detection by 30%, showing that learning to pre- dict distal phenotypes improv es proximal understanding. 3. In silico pharmacology : Applied to CD52 knockdown (approximating Alemtuzumab), CDT -III rediscov ers known clinical side ef fects and generates novel testable hypotheses from perturbation data alone, without access to any clinical information. T ogether , these results suggest that AI architectures aligned with biological struct ure can simultane- ously achiev e prediction, interpretation, and clinical translation. 2 Related W ork Perturbation pr ediction and foundation models. GEARS [ Roohani et al. , 2024 ] and CP A [ Lot- follahi et al. , 2023 ] predict expression changes from unseen perturbations but are limited to RNA. Foundation models (scGPT [ Cui et al. , 2024 ], Geneformer [ Theodoris et al. , 2023 ], Enformer [ A vsec et al. , 2021 ], Borzoi [ Linder et al. , 2025 ], AlphaGenome [ A vsec et al. , 2026 ]) pro vide po werful rep- resentations, though recent benchmarks show deep learning does not yet consistently outperform simple baselines [ Hetzel et al. , 2025 , Piran et al. , 2024 ]. STRAND [ Bunne et al. , 2026 ] conditions perturbation prediction on DNA sequence for zero-shot inference but does not model protein re- sponses. CDT -III dif fers in jointly predicting RN A and protein changes with interpretable internal representations. Multi-modal biological AI. IsoF ormer [ Chen et al. , 2024a ] integrates DN A, RN A, and protein for isoform prediction. LucaOne [ He et al. , 2025 ] provides a unified DN A/RNA/protein foundation model, and CAPT AIN [ Ji et al. , 2025 ] pre-trains on 4M+ co-assayed RNA and protein cells, b ut nei- ther addresses perturbation prediction or interpretability . CITE-seq [ Stoeckius et al. , 2017 ] and DSB normalization [ Mul ` e et al. , 2022 ] enable single-cell protein quantification, and perturbation datasets are increasingly harmonized [ Peidli et al. , 2024 , Heumos et al. , 2025 ]. Despite these resources, no existing model jointly predicts RN A and protein perturbation responses in an interpretable frame- work. Drug safety and interpretability . Drug side effect prediction typically relies on chemical struc- ture [ Zitnik et al. , 2018 ] or network proximity [ Guney et al. , 2016 ], requiring known drug–target interactions. CDT -III derives predictions from learned gradients without clinical data. Chen et al. [ Chen et al. , 2024b ] emphasize rigorous interpretability practices, warning against single- method reliance and disconnection from biological validation. CDT -II [ Ota , 2026 ] established mechanism-oriented AI with attention maps v alidated against external data, addressing the attention- as-explanation debate [ Jain & W allace , 2019 , W iegref fe & Pinter , 2019 ]. CDT -III extends this to clinical application, validating attention ag ainst CTCF ChIP-seq and Hi-C data. 2 3 Method 3.1 Problem F ormulation Giv en a CRISPRi perturbation at genomic locus ℓ and a cell with RNA expression x RNA ∈ R 2361 and surface protein lev els x Prot ∈ R 189 (DSB-normalized), CDT -III predicts perturbation-induced changes at both molecular lev els: f ( D ℓ , x RNA , x Prot ) = ( ˆ y RNA , ˆ y Prot ) (1) where D ℓ ∈ R 896 × 3072 are pre-computed Enformer [ A vsec et al. , 2021 ] embeddings spanning ∼ 115 kb around locus ℓ , ˆ y RNA ∈ R 2361 are predicted RNA log2 fold changes, and ˆ y Prot ∈ R 189 are predicted protein expression dif ferences relativ e to unperturbed cells. 3.2 Architectur e: T wo-Stage V irtual Cell Embedder CDT -III models the complete information flow of the central dogma—from DNA to RNA to protein—as a single, end-to-end dif ferentiable architecture (Figure 1 ). Six attention mechanisms each correspond to a specific biological process: two for genomic structure (DN A self-attention), one each for gene co-regulation (RN A self-attention) and protein co-regulation (protein self- attention), and two cross-attention layers modeling transcriptional (DN A → RN A) and translational (RN A → Protein) control. This information flow is organized into two stages—VCE-N (Nuclear) and VCE-C (Cytosolic)— that mirror the spatial compartmentalization of gene expression in eukaryotic cells: transcription in the nucleus, translation in the cytosol. The ke y design principle is that each stage preserves dimen- sional compatibility with its predecessor , enabling 100% transfer of pre-trained CDT -II weights—a property that prov es essential, as single-stage alternati ves that break this compatibility fail to learn (Section 5.1 ). Stage 1: VCE-N (Nuclear — T ranscription). Architecturally identical to CDT -II [ Ota , 2026 ]: DN A embeddings projected to d = 512 with 2 self-attention layers, RNA encoded with 1 self- attention layer , cross-attention (RNA queries, DNA keys/v alues) for transcriptional control, and VCE pooling fusing both into e RNA ∈ R 512 . An RNA task head predicts ˆ y RNA (Appendix B ). Stage 2: VCE-C (Cytosolic — T ranslation). Protein expression x Prot ∈ R 189 is encoded using the same architecture as the RN A encoder (identity embeddings + value projection), follo wed by 1 self-attention layer . RNA-to-protein cross-attention (protein queries, RNA sequence representations as keys/v alues) allo ws each protein to attend to the full gene expression context. A second VCE pools e RNA (from VCE-N) and the attention-pooled protein representation into e Prot ∈ R 512 via the same fusion architecture ( d × 2 → d × 2 → d ). A protein task head predicts ˆ y Prot . Loss function. L = L RNA + λ · L Prot , λ = 0 . 1 (2) where L RNA is MSE over all 2,361 genes. All 189 proteins pass through the encoder , self-attention, and cross-attention layers, but L Prot is computed only on 65 detectably expressed proteins (DSB mean > 0 . 5 ), masking non-expressed proteins from the loss to prevent the model from learning triv- ial zero-to-zero mappings. The v alue λ = 0 . 1 was selected to balance RNA and protein objecti ves (see ablation in Section 5.1 ). T otal parameters: 30,987,766 ( ∼ 21M from CDT -II + ∼ 10M ne w). 3.3 T raining: T wo-Phase Strategy T o prevent catastrophic forgetting of CDT -II’ s learned representations, training proceeds in two phases. Phase 1 (300 epochs, patience 30): VCE-N frozen with CDT -II weights; only VCE-C trained (lr = 10 − 3 ), allowing the protein pathway to initialize before interacting with pre-trained components. Phase 2 (500 epochs, patience 50): all parameters unfrozen with dif ferential learning rates (CDT -II: 10 − 5 , new: 5 × 10 − 5 ). CDT -III fine-tuning completes in ∼ 3 hours on a single A100 GPU (Appendix B ). 3.4 In Silico Pharmacology Pipeline CDT -III enables two complementary approaches to drug safety assessment. For perturbations with matched RN A and protein measurements, dir ect prediction simultaneously predicts RNA and pro- 3 Figure 1: CDT -III two-stage V irtual Cell Embedder architecture. VCE-N (nuclear stage, iden- tical to CDT -II) processes DNA Enformer embeddings and per-cell RN A expression through self- attention and cross-attention, modeling transcription to produce a cell-le vel RNA embedding. VCE- C (cytosolic stage) takes this RN A embedding and protein expression, modeling translation to pro- duce a protein embedding. Each stage has an independent task head. tein changes, revealing which surface proteins are affected and in which direction. For novel per- turbations not present in the training data, gradient analysis ( ∂ ˆ y Prot ,j /∂ x RNA ,g ) quantifies how each surface protein j responds to changes in gene g ’ s expression, yielding a protein-le vel side ef fect pro- file from the trained model’ s weights alone—without requiring new experimental data. Neither ap- proach requires clinical or pharmacological data—predictions deriv e entirely from in vitro CRISPRi experiments and the model’ s learned multi-modal relationships. Note that CRISPRi knockdown ap- proximates but does not recapitulate antibody drug action (see Limitations). 4 Experimental Setup Dataset. W e used the STING-seq v2 dataset [ Morris et al. , 2023 ] (GEO: GSE171452), which jointly profiles scRNA-seq and 193 surface proteins (CITE-seq) in K562 cells subjected to CRISPRi pertur - bations. K562 is one of the most extensi vely characterized human cell lines (ENCODE, Roadmap Epigenomics, 4DN), providing the external v alidation data used throughout this study , and as a chronic myelogenous leukemia line, is directly relev ant to hematological drug discovery . Multi- modal perturbation datasets combining CRISPRi, scRN A-seq, and surface protein measurements remain rare; K562 STING-seq is currently the only large-scale dataset with all three modalities. 4 T able 1: Per -gene pr ediction performance. Per-gene mean r (pseudo-bulk) on five held-out v ali- dation genes. CDT -II v alues are from the same checkpoint used for CDT -III weight transfer . RNA per-gene mean r improves from CDT -II ( 0 . 804 ) to CDT -III ( 0 . 843 ) despite adding a second task. Protein per-gene mean r on 65 expressed proteins reaches 0 . 969 . Gene Cells RN A r (CDT -II) RNA r (CDT -III) ∆ Protein r (e xpr .) GFI1B 477 0.851 0.885 +0.034 0.969 TNFSF9 349 0.831 0.868 +0.037 0.991 TFRC 847 0.824 0.854 +0.030 0.989 CD44 233 0.795 0.858 +0.063 0.935 CD52 131 0.719 0.748 +0.029 0.962 Mean 0.804 0.843 +0.039 0.969 After guide assignment filtering, we retained 8,250 TSS-perturbed cells and 2,078 non-targeting control (NTC) cells. Of 193 ADTs, 4 isotype controls were remo ved, leaving 189 surface proteins quantified by DSB normalization [ Mul ` e et al. , 2022 ], which uses isotype controls for robust back- ground correction. Gene/protein sets. 2,361 RNA genes were selected by cross-dataset reproducibility filtering (in- tersection of two independent CRISPRi screens [ Morris et al. , 2023 , Gasperini et al. , 2019 ]). Of 189 ADT proteins, 65 are detectably expressed (mean DSB > 0 . 5 ); protein loss and ev aluation are restricted to these 65. Data splits. T raining: 6,213 TSS-perturbed cells from 23 perturbation targets. V alidation: 2,037 cells from five perturbation targets held out entirely at the gene level—no perturbation data for these genes appears in training, ensuring that predictions reflect genuine generalization: GFI1B (477 cells), TFRC (847), TNFSF9 (349), CD44 (233), CD52 (131). Evaluation. Prediction performance is measured by Pearson r at two levels: per-cell (correlation across all genes within each cell) and per-gene mean (mean predicted vs. mean observ ed expression change for each held-out gene, av eraged across genes). Interpretability is assessed by CTCF ChIP- seq enrichment (ENCODE K562) and Hi-C 3D contact ratios (4DN K562, 5 kb resolution). Clinical validation uses systematic comparison with published Alemtuzumab side ef fect profiles. 5 Results 5.1 Architectural Design Matters: Single-Stage vs. T wo-Stage A nai ve approach to adding protein prediction w ould fuse all three modalities in a single VCE layer . W e tested five such single-stage variants (Appendix C ): all f ail, with the best achieving per-cell RN A r = 0 . 37 vs. CDT -II’ s per-cell r = 0 . 64 . The failure traces to modifying VCE fusion dimensions ( d × 2 → d × 3 ), which prev ents transfer of CDT -II’ s pre-trained fusion weights—the critical bottleneck, as encoder and attention weights transfer successfully . CDT -III’ s two-stage design resolves this by preserving VCE-N’ s dimensions exactly (100% weight transfer) and adding VCE-C as a separate module. 5.2 Prediction P erformance RNA pr ediction improv es. Adding protein prediction does not degrade RN A performance—it im- prov es it (T able 1 , Figure 2 ). The per-gene mean r increases from 0 . 804 to 0 . 843 ( +4 . 9% ). This multi-task regularization effect is consistent across all 5 genes, with improvement ranging from +0 . 029 ( CD52 ) to +0 . 063 ( CD44 ). The improv ement indicates that protein loss gradients, back- propagating through VCE-C into VCE-N, provide additional supervision that sharpens the shared DN A and RN A representations. Protein prediction. Of 189 surface proteins measured by CITE-seq, only 65 are detectably ex- pressed in K562 cells. W e e valuate exclusiv ely on these 65 proteins to av oid inflating metrics with trivial zero-to-zero predictions (a pitfall that explains the apparent r > 0 . 76 of single-stage models in T able 4 ). On the 65 expressed proteins, per-gene protein r averages 0 . 969 , with all 5 held-out 5 Figure 2: Prediction performance. (A) Single-stage vs. two-stage VCE comparison (RNA r by architecture). (B) Per-gene RNA correlation: CDT -II vs. CDT -III. (C) Per-gene protein predicted vs. actual (65 expressed proteins, 5 genes). T able 2: CTCF enrichment and Hi-C validation. Protein supervision improves DNA-le vel inter- pretability . Metric CDT -II CDT -III Change Mean CTCF enrichment 6 . 6 × 8 . 59 × +30% Genes > 2 × enriched — 27/27 (100%) † — Permutation P < 0 . 001 < 0 . 001 — Hi-C mean contact ratio — 1 . 30 × — Genes with ratio > 1 — 16/25 (64%) — W ilcoxon P — 0.020 — † Of 28 genes with ENCODE K562 ChIP-seq annotations, 1 gene (MSR1) has no CTCF sites; enrichment is computed over the 27 genes with ≥ 1 CTCF site. genes exceeding r = 0 . 93 (T able 1 ). This indicates that CDT -III accurately captures which proteins change and in which direction following each perturbation. Per-protein cell-level r = 0 . 28 is lo wer , consistent with kno wn ADT measurement noise [ Stoeckius et al. , 2017 , Mul ` e et al. , 2022 ]. The gap between cell-level and per-gene mean accuracy indicates that the model learns true regulatory relationships rather than fitting noise. A veraging across cells recov ers the robust perturbation signal, positioning CDT -III for pseudo-b ulk applications including drug safety assessment (Section 5.4 ). 5.3 Protein Super vision Improves DN A Interpr etability A surprising finding is that adding protein prediction improves CDT -III’ s ability to identify DN A regulatory elements, e ven though protein information does not directly enter the DN A pathway . CTCF enrichment. DNA-to-RN A cross-attention in CDT -III shows 8 . 59 × enrichment at CTCF binding sites across 27 genes with CTCF sites (of 28 with ENCODE K562 ChIP-seq annotations; 1 gene has no CTCF sites), compared to 6 . 6 × for CDT -II ( +30% improvement; T able 2 ). All 27 genes with CTCF sites sho w > 2 × enrichment. Permutation testing ( n = 1 , 000 ) yields P < 0 . 001 . Mechanism. Protein loss L Prot backpropagates through VCE-C into the shared RN A embedding e RNA , which encodes both DN A and RN A information via DNA-to-RN A cross-attention. Because this embedding carries DN A-deriv ed features, protein gradients flow further into VCE-N and the cross-attention weights, providing an additional signal that sharpens attention tow ard genomic po- sitions that ultimately matter for protein-lev el phenotypes. CTCF binding sites—which demarcate topologically associating domain (T AD) boundaries and mediate 3D chromatin organization influ- encing both transcription and protein expression—are precisely such positions, explaining the +30% enrichment improv ement. Attention re veals 3D chromatin structure at single-locus resolution. Cross-attention not only enriches for CTCF sites in aggregate b ut resolves regulatory architecture at indi vidual genomic loci. For CD55, the model’ s cross-attention profile across the ± 57 kb windo w aligns precisely with CTCF ChIP-seq peaks: 3 of 4 CTCF binding sites fall within the top 10% attention bins (Appendix L ). The 6 Figure 3: Protein supervision impro ves DNA interpretability . (A) Hi-C contact ratio per gene (top 20 attention bins vs. random 20 bins; mean = 1 . 30 × , P = 0 . 020 ). (B) Attention-high vs. random bins scatter plot sho wing that high-attention genomic regions hav e stronger physical contact with promoters. single CTCF site ignored by the model lacks strong Hi-C contact with the promoter, indicating that the model distinguishes functionally rele vant insulators from inacti ve ones. Hi-C data independently confirm this selecti vity: across 25 genes with sufficient co verage (of 28; 3 excluded: B2M , TFRC , GFI1B ), high-attention bins show 1 . 30 × higher 3D contact frequencies with promoter re gions than random bins ( P = 0 . 020 , W ilcoxon signed-rank; 4DN K562, 5 kb resolution), with 16/25 genes showing ratios > 1 . This genomic-position-le vel correspondence between learned attention, CTCF binding, and 3D chromatin contacts emerges entirely from perturbation prediction training—without any chromatin structure supervision. 5.4 In Silico Drug Safety: CD52/Alemtuzumab Case Study CD52 (CAMP A TH-1 antigen) is the target of Alemtuzumab (Lemtrada ® ), an FD A-approved mon- oclonal antibody for multiple sclerosis and chronic lymphocytic leukemia [ Ruck et al. , 2022 ]. As discussed in Section 3.4 , CRISPRi knockdown of CD52 provides an in silico approximation of Alemtuzumab’ s mechanism of action. Critically , CD52 is one of five genes held out entirely from training—the model has nev er observed any CD52 perturbation data. W e apply both direct predic- tion (131 CD52-perturbed cells from the held-out validation set) and gradient analysis (using only the non-tar geting control mean expression and CD52’ s DN A embedding) to assess potential clinical consequences at the protein lev el. Prediction accuracy . For CD52 knockdown, CDT -III achiev es RN A per-gene r = 0 . 748 and protein r = 0 . 962 (65 e xpressed proteins). The self-knockdo wn prediction is highly accurate: mean predicted CD52 mRN A change = − 0 . 136 vs. mean actual = − 0 . 172 (per-cell r = 0 . 952 across 131 cells), confirming that CDT -III correctly predicts the direct effect of a perturbation on its o wn target. Side effect map: 29/29 direction agreement. Of 65 expressed proteins, 29 show detectable changes following CD52 knockdo wn (absolute DSB difference > 0 . 1 ). All 29 predictions match the ob- served direction of change (Figure 4 C). The top changes (ranked by measured effect size) are: TFRC (CD71) ↑ (iron metabolism), CD81 ↑ (B cell co-receptor), MCAM (CD146) ↑ (endothelial adhesion), CD58 (LF A-3) ↑ (immune reconstitution), ICAM1 (CD54) ↑ (inflammatory adhesion), and FCGR2A (CD32) ↑ (Fc receptor , autoimmunity link). Notably , while CD52 knockdown causes widespread mRN A decreases (Figure 4 A), the experimentally measured surface proteins frequently change in the opposite direction: among the 27 expressed proteins with matched mRN A measurements in the STING-seq experimental data [ Morris et al. , 2023 ], the majority of those with observable mRNA changes ( | log2FC | > 0 . 01 ) show opposite directions of change between measured mRNA and mea- sured protein (8/12, 66.7%; Appendix K ), underscoring why protein-lev el prediction is essential for safety assessment. Systematic clinical validation. W e compare CDT -III’ s protein-lev el predictions against known Alemtuzumab side effects from clinical literature [ Ruck et al. , 2022 , Thompson et al. , 2010 , De- 7 T able 3: CDT -III predictions vs. known Alemtuzumab side effects. Fiv e of sev en known side effects are recapitulated by CDT -III’ s protein predictions, without access to any clinical data. Known side ef fect Incidence CDT -III predicted proteins Match Autoimmune th yroid dis- ease 36–42% FCGR2A ↑ , B AFF-R ↑ , CD40 ↑ ✓ ITP 2–3% FCGR2A ↑ ✓ Infection risk 66–77% CD58 ↑ ⋆ , TFRC ↑ ⋆ ✓ Infusion reaction > 90% ICAM1 ↑ , CD29 ↑ ✓ Autoimmune nephropa- thy 0.2–0.3% MCAM ↑ ✓ Goodpasture syndrome < 0.1% — ✗ Listeria meningitis rare — ✗ ⋆ CD58 ↑ and TFRC ↑ are compensatory responses to lymphocyte depletion, serving as molecular markers of the immunocompromised state rather than direct causes of infection. Note that gradient analysis yields TFRC ↓ , reflecting immediate perturbation sensitivity rather than the compensatory response captured by direct prediction. vonshire et al. , 2018 ] (T able 3 ). Of 7 major kno wn side effects, CDT -III recapitulates 5, providing mechanistic protein-lev el explanations for each. The 2 unmatched side effects (Goodpasture syn- drome, listeria meningitis) in v olve pathogen-specific or tissue-specific mechanisms outside K562’ s biology . Gradient analysis without perturbation data. The gradient analysis results above were ob- tained without any CD52 perturbation data—only the non-targeting control (NTC) mean expres- sion and CD52’ s Enformer DN A embedding were provided as input, and the protein-level side effect profile was derived entirely from the trained model’ s learned weights via backpropagation ( ∂ ˆ y Prot ,j /∂ x RNA ,g ). T o validate this approach, we compared gradients computed from NTC mean input against those computed from actual CD52-perturbed cells: on 65 expressed proteins, the two approaches show Pearson r = 0 . 939 and 96 . 9% direction agreement (Appendix J ). This confirms that gradient analysis can screen novel drug tar gets without perturbation data: any gene within the model’ s 2,361-gene vocab ulary can be ev aluated for potential side effects without conducting a ne w perturbation experiment. Novel predictions. CDT -III also generates testable hypotheses not yet reported in the Alemtuzumab literature. Gradient analysis predicts B2M ↓ , which would reduce MHC class I surface expression and potentially enable immune ev asion. Direct prediction identifies CD81 ↑ during B cell rebound, suggesting a nov el biomarker for monitoring autoimmune risk post-treatment. 6 Discussion Multi-task regularization as a general principle. Adding protein prediction improv es RNA pre- diction ( r = 0 . 804 → 0 . 843 )—a non-trivial result, as multi-task learning often de grades indi vidual task performance [ Crawsha w , 2020 ]. Protein supervision provides complementary gradient signals that sharpen shared representations, a principle applicable to any hierarchical multi-task system. Why two stages, not one. The single-stage VCE failure (T able 4 ) illustrates a tension between flexibility and transfer in multi-modal architectures. Adding modalities to a joint fusion layer breaks weight compatibility . The two-stage design resolves this by decomposing fusion along the causal structure of the data—a principle that may generalize to other multi-modal systems where modalities follow a natural hierarch y . Downstr eam supervision sharpens upstream inter pretability . The +30% CTCF enrichment im- prov ement is unexpected: protein data nev er enters the DNA pathway directly , yet protein loss gradients sharpen DN A-lev el attention toward genomic positions rele vant to protein-level pheno- types. This sharpening operates at single-locus resolution—the model selecti vely attends to CTCF sites with confirmed 3D promoter contacts while ignoring nearby sites that lack such contacts (Ap- pendix L )—suggesting a broader principle: in hierarchical systems, supervision at the most distal output can improv e the fidelity of learned internal structure at ev ery upstream layer . In silico pharmacology and the necessity of protein-le vel predi ction. Gradient analysis produces concordant results from perturbed and unperturbed cells ( r = 0 . 939 ; Appendix J ), enabling scalable in silico drug screening of arbitrary targets. Critically , analysis of the experimentally measured 8 Figure 4: In silico Alemtuzumab side effect pr ediction. (A) CD52 knockdo wn RN A prediction vs. actual (per-gene r = 0 . 748 ). (B) Protein prediction vs. actual for 65 expressed proteins ( r = 0 . 962 ). (C) Side effect map: predicted vs. measured protein changes for 29 proteins with detectable effects (29/29 direction agreement, color-coded by clinical rele v ance). mRN A and protein responses in the STING-seq data [ Morris et al. , 2023 ] re veals that the majority of genes with observable mRN A changes show opposite protein-le vel changes (66.7% at | log2FC | > 0 . 01 , rising to 87.5% at | log2FC | > 0 . 02 ; Appendix K ). This exposes a fundamental limitation of RN A-only models [ Roohani et al. , 2024 , Lotfollahi et al. , 2023 ]: the implicit assumption that protein follows mRN A direction fails for the majority of genes with measurable mRNA responses. CDT - III’ s VCE-C cross-attention learns to decouple these responses, achieving protein r = 0 . 962 despite pervasi ve direction discordance—a capability architecturally impossible in single-modality models. Limitations. All experiments use K562 cells, reflecting the scarcity of multi-modal perturbation datasets (Section 4 ); the architecture applies without modification to other cell types as such data become available. CRISPRi knockdown approximates but does not recapitulate antibody drug action (CRISPRi suppresses transcription; Alemtuzumab depletes via ADCC/CDC). Per-protein cell-lev el r = 0 . 28 limits single-cell applications. Gradient-based interpretability (correlation be- tween gradient-deri ved regulatory importance and CTCF binding) achiev es r = 0 . 443 (vs. CDT -II’ s r = 0 . 83 ), though only 2 held-out genes with sufficient CTCF sites are testable. Hi-C permutation P = 0 . 088 is mar ginal, though parametric tests are significant ( P = 0 . 020 ). Broader impact. In silico drug safety screening could prioritize candidates and identify adverse effects early . More broadly , the mRN A–protein direction div ergence reported here suggests that CRISPRi screens relying solely on RN A readouts may miss or mischaracterize protein-lev el pheno- types critical for drug dev elopment. 7 Conclusion The interpretability gap in biological AI can be closed by aligning model architecture with the cell’ s own logic. CDT -III connects all three layers of the central dogma (DNA → RN A → Pro- tein) in a single interpretable architecture—to our knowledge, the first to do so for perturbation response prediction—showing that prediction and mechanistic understanding need not be separate goals. Each attention map corresponds to a specific biological process, and e very prediction can be traced through a mechanistic pathway . Three principles extend beyond biology: do wnstream supervision improves upstream representation, multi-modal fusion should respect causal data structure, and mechanism-oriented AI can bridge basic science to clinical application. The path to trustworthy AI in biomedicine lies in architectures that rev eal the mechanisms underlying their predictions. 9 Acknowledgments and Disclosur e of Funding The author thanks Morris et al. for making the STING-seq v2 dataset publicly av ailable, the de- velopers of Enformer , and the open-source communities behind PyT orch and related tools. Claude (Anthropic) was used for manuscript editing. This work recei ved no external funding. References A vsec, ˇ Z. et al. Effectiv e gene expression prediction from sequence by integrating long-range inter - actions. Nat. Methods , 18:1196–1203, 2021. A vsec, ˇ Z. et al. Advancing regulatory variant effect prediction with AlphaGenome. Natur e , 649:1206–1218, 2026. Bunne, C. et al. Sequence-conditioned transport for single-cell perturbations. Preprint at https: //arxiv.org/abs/2602.10156 , 2026. Chen, K. et al. IsoFormer: attention-based isoform prediction with contextual protein-lev el supervi- sion. In Pr oc. NeurIPS , 2024. Chen, V . et al. Applying interpretable machine learning in computational biology—pitfalls, recom- mendations and opportunities for new de velopments. Nat. Methods , 21:1455–1461, 2024. Crawsha w , M. Multi-task learning with deep neural networks: a surve y . Preprint at https:// arxiv.org/abs/2009.09796 , 2020. Crick, F . Central dogma of molecular biology . Natur e , 227:561–563, 1970. Cui, H. et al. scGPT: to ward building a foundation model for single-cell multi-omics using genera- tiv e AI. Nat. Methods , 21:1470–1480, 2024. Dev onshire, V . et al. Monitoring and management of autoimmunity in multiple sclerosis patients treated with alemtuzumab . Curr . Med. Res. Opin. , 34:1585–1594, 2018. Eraslan, G., A vsec, ˇ Z., Gagneur, J. & Theis, F . J. Deep learning: new computational modelling techniques for genomics. Nat. Rev . Genet. , 20:389–403, 2019. Gasperini, M. et al. A genome-wide framework for mapping gene regulation via cellular genetic screens. Cell , 176:377–390, 2019. Heumos, L. et al. Pertpy: an end-to-end framework for perturbation analysis. Nat. Methods , 22:1355–1358, 2025. Ji, B. et al. CAPT AIN: a multimodal foundation model pretrained on co-assayed single-cell RN A and protein. Preprint at https://doi.org/10.1101/2025.07.07.663366 , 2025. He, Y . et al. LucaOne: generalized biological foundation model with unified nucleic acid and protein language. Nat. Mach. Intell. , 7:889–901, 2025. Hetzel, L. et al. Deep-learning-based gene perturbation effect prediction does not yet outperform simple linear baselines. Nat. Methods , 22:679–681, 2025. Guney , E., Menche, J., V idal, M. & Bar ´ abasi, A.-L. Network-based in silico drug efficac y screening. Nat. Commun. , 7:10331, 2016. Gygi, S. P ., Rochon, Y ., Franza, B. R. & Aebersold, R. Correlation between protein and mRN A abundance in yeast. Mol. Cell. Biol. , 19:1720–1730, 1999. Jain, S. & W allace, B. C. Attention is not explanation. In Pr oc. N AA CL-HLT , pp. 3543–3556, 2019. Linder , J. et al. Predicting RNA-seq coverage from DN A sequence as a unifying model of gene regulation. Nat. Genet. , 57:1275–1284, 2025. Lotfollahi, M. et al. Predicting cellular responses to complex perturbations in high-throughput screens. Mol. Syst. Biol. , 19:e11517, 2023. 10 Morris, J. A. et al. Discovery of target genes and pathways at GW AS loci by pooled single-cell CRISPR screens. Science , 380:eadh7699, 2023. Mul ` e, M. P ., Martins, A. J. & Tsang, J. S. Normalizing and denoising protein expression data from droplet-based single cell profiling. Nat. Commun. , 13:2099, 2022. Nov akovsk y , G. et al. Obtaining genetics insights from deep learning via explainable artificial intelligence. Nat. Rev . Genet. , 24:125–137, 2023. Ota, N. Central Dogma T ransformer II: mechanism-oriented AI for interpretable cellular regulatory discov ery . Preprint at , 2026. Peidli, S. et al. scPerturb: harmonized single-cell perturbation data. Nat. Methods , 21:531–540, 2024. Piran, Z. et al. Disentangling the impact of single-cell foundation models on perturbation response prediction. In Pr oc. NeurIPS , 2024. Roohani, Y ., Huang, K. & Leskov ec, J. Predicting transcriptional outcomes of nov el multigene perturbations with GEARS. Nat. Biotechnol. , 42:927–935, 2024. Ruck, T . et al. Alemtuzumab-induced immune phenotype and repertoire changes: implications for secondary autoimmunity . Brain , 145:1711–1725, 2022. Stoeckius, M. et al. Simultaneous epitope and transcriptome measurement in single cells. Nat. Methods , 14:865–868, 2017. Theodoris, C. V . et al. T ransfer learning enables predictions in network biology . Natur e , 618:616– 624, 2023. Thompson, S. A. J. et al. B-cell reconstitution and BAFF after alemtuzumab (Campath-1H) treat- ment of multiple sclerosis. J. Clin. Immunol. , 30:99–105, 2010. V ogel, C. & Marcotte, E. M. Insights into the re gulation of protein abundance from proteomic and transcriptomic analyses. Nat. Rev . Genet. , 13:227–232, 2012. W iegref fe, S. & Pinter , Y . Attention is not not explanation. In Pr oc. EMNLP-IJCNLP , pp. 11–20, 2019. Zitnik, M., Agrawal, M. & Lesko vec, J. Modeling polypharmacy side ef fects with graph con volu- tional networks. Bioinformatics , 34:i457–i466, 2018. A CDT -II Architectur e CDT -III’ s VCE-N is architecturally identical to CDT -II. Figure 5 shows the CDT -II architecture from which all VCE-N weights are transferred. B Detailed Architectur e B.1 VCE-N (Nuclear — T ranscription Stage) VCE-N is identical to CDT -II [ Ota , 2026 ]: • DNA pathway : Linear projection ( 3072 → 512 ) + LayerNorm → 2 self-attention layers ( h = 8 , FFN = 2048 , GELU, dropout 0.3) • RNA pathway : RawExpressionEncoder (gene identity embeddings d = 512 + expression value projection) → 1 self-attention layer • Cross-attention : RN A queries, DNA k eys/v alues ( h = 8 ) • VCE pooling : 4-head attention pooling per modality → concatenate → MLP ( d × 2 → d × 2 → d ) → e RNA ∈ R 512 • RNA task head : 2-layer MLP ( 512 → 1024 → 2361 ) 11 Figure 5: CDT -II ar chitecture. The model mirrors the central dogma: DN A self-attention captures genomic relationships within a ± 57 kb window , RNA self-attention captures gene co-regulation, and cross-attention models transcriptional control. A V irtual Cell Embedder integrates both modalities to predict perturbation effects. CDT -III’ s VCE-N preserves this architecture exactly , enabling 100% weight transfer . B.2 VCE-C (Cytosolic — T ranslation Stage) VCE-C is new in CDT -III: • Protein pathway : RawExpressionEncoder ( n = 189 , d = 512 ) → 1 self-attention layer • RNA → Pr otein cross-attention : Protein queries, RN A keys/v alues ( h = 8 ) • VCE pooling : T akes e RNA from VCE-N + protein representation → MLP ( d × 2 → d × 2 → d ) → e Prot ∈ R 512 • Protein task head : 2-layer MLP ( 512 → 1024 → 189 ) C Ablation: Single-Stage vs. T wo-Stage VCE W e trained five single-stage VCE variants that fuse DN A, RNA, and protein embeddings jointly , varying the protein loss weight λ (T able 4 ). All single-stage models transfer CDT -II’ s encoder and attention weights (DNA projector , self- attention layers, RN A encoder , cross-attention), yet fail to reach CDT -II’ s RNA performance ( r = 0 . 64 ), with the best achieving only r = 0 . 37 . The failure traces to a single architectural component: modifying VCE fusion dimensions from d × 2 to d × 3 prev ents loading CDT -II’ s pre-trained fusion weights, forcing this critical layer to learn from random initialization. Even with curriculum learning ( λ warmup, Exp E), RN A performance does not recov er—demonstrating that the VCE fusion layer is the bottleneck, not the encoders. 12 T able 4: Single-stage vs. two-stage VCE. Per -cell correlation ( r ) on the v alidation set. All models transfer CDT -II encoder and attention weights; the critical dif ference is the VCE fusion layer . Single- stage architectures modify fusion dimensions ( d × 2 → d × 3 ), pre venting fusion weight transfer and causing RN A prediction to collapse despite encoder transfer . The two-stage architecture preserves full weight compatibility including fusion. ∗ Protein r v alues for single-stage models are inflated by 124/189 non-expressed proteins predicted as ∼ 0. Architecture λ RN A r Protein r Fusion transfer CDT -II RN A only — 0.64 — — Exp A 1-Stage 1.0 0.19 0.76 ∗ ✗ Exp B 1-Stage 0.11 0.24 0.77 ∗ ✗ Exp C 1-Stage 0.05 0.35 0.81 ∗ ✗ Exp D 1-Stage 0.01 0.37 0.80 ∗ ✗ Exp E 1-Stage ( λ warmup) 0.001 → 0.01 0.30 0.21 ✗ CDT -III 2-Stage VCE 0.1 0.64 0.43 ✓ The two-stage VCE resolves this by preserving VCE-N’ s dimensions exactly , enabling 100% weight transfer including the fusion layer . VCE-C is added as a new module with its own fusion layer ( d × 2 → d × 2 → d ), initialized from scratch but trained without disrupting VCE-N. The per-cell protein r = 0 . 43 (on 65 expressed proteins only) may appear modest, but pseudo-bulk (per-gene mean) ev aluation yields r = 0 . 969 , re vealing that CDT -III accurately captures perturbation-lev el protein response patterns despite single-cell noise. D Gradient Flow The two-stage design creates two distinct gradient pathw ays: ∂ L RNA ∂ θ VCE-N : Direct (same as CDT -II) (3) ∂ L Prot ∂ θ VCE-N : Through e RNA → VCE-C → L Prot (new in CDT -III) (4) The protein loss gradient provides additional supervision to VCE-N, explaining why CTCF enrich- ment improv es from 6 . 6 × to 8 . 59 × . E Attention Map In ventory CDT -III produces six attention maps, compared to CDT -II’ s three: T able 5: Attention map inv entory . CDT -III produces six interpretable attention maps, each corre- sponding to a specific biological process. Four are inherited from CDT -II; two are ne w . Attention Map Shape Biological Meaning Source DN A Self-Attention (L0) [8 , 896 , 896] Genomic interactions CDT -II DN A Self-Attention (L1) [8 , 896 , 896] Higher-order genomic CDT -II RN A Self-Attention [8 , 2361 , 2361] Gene co-regulation CDT -II DN A → RN A Cross-Attention [8 , 2361 , 896] T ranscriptional control CDT -II Protein Self-Attention [8 , 189 , 189] Protein co-regulation CDT -III RN A → Protein Cross-Attention [8 , 189 , 2361] T ranslational control CDT -III 13 F Per -Gene CTCF Enrichment T able 6: CTCF enrichment for all 28 genes with ENCODE K562 ChIP-seq data. 14/27 genes with CTCF sites show perfect 10.0 × enrichment (all CTCF sites in top 10% attention bins). Gene CTCF T op 10% Enrich. Gene CTCF T op 10% Enrich. CD82 7 7 10.0 × SLC3A2 6 5 8.33 × CD69 7 7 10.0 × TNFSF9 5 4 8.00 × CD40 9 9 10.0 × CD44 4 3 7.50 × ITGB1 2 2 10.0 × CD58 4 3 7.50 × ENTPD1 2 2 10.0 × CD55 4 3 7.50 × KLRG1 3 3 10.0 × LGALS3 4 3 7.50 × KLRD1 2 2 10.0 × ITGAE 4 3 7.50 × TNFSF13B 3 3 10.0 × FCGR2A 2 1 5.00 × B2M 4 4 10.0 × CD83 5 2 4.00 × CD19 4 4 10.0 × IL21R 6 2 3.33 × NECTIN2 4 4 10.0 × MSR1 0 0 N/A EPCAM 4 4 10.0 × TFRC 2 2 10.0 × GFI1B 3 3 10.0 × ICAM1 8 7 8.75 × Mean 8.59 × CD52 7 6 8.57 × CD81 7 6 8.57 × G 1-Stage VCE Ablation Details T able 7: Full results for all five single-stage VCE e xperiments. Exp λ Strategy RN A r Prot r Epochs Notes A 1.0 Fixed 0.19 0.76 148 Protein-dominated loss B 0.11 Fixed 0.24 0.77 209 Equal-weight by variance C 0.05 Fixed 0.35 0.81 386 Best single-stage protein D 0.01 Fixed 0.37 0.80 472 Best single-stage RN A E 0.001 → 0.01 W armup 0.30 0.21 ∼ 300 Curriculum failed Root cause analysis. All single-stage e xperiments share the same fundamental limitation: the VCE fusion layer requires d × 3 input dimensions (DN A + RN A + Protein pooled representations), com- pared to CDT -II’ s d × 2 . This dimensional mismatch pre vents loading CDT -II’ s pre-trained fusion weights, forcing the fusion layer to learn from random initialization. Since CDT -II required > 500 epochs to reach r = 0 . 57 from scratch, the single-stage fusion layer cannot recov er to comparable quality within feasible training time. The two-stage VCE av oids this entirely by keeping VCE-N dimensions unchanged. 14 H CD52 Side Effect Prediction Details T able 8: T op 20 proteins predicted to change upon CD52 knockdown (gradient-based analysis). Rank Protein (Gene) Gradient Category 1 CD32 (FCGR2A) +0 . 059 ↑ Fc receptor / ADCC 2 CD146 (MCAM) +0 . 044 ↑ Endothelial adhesion 3 CD54 (ICAM1) +0 . 043 ↑ Inflammatory adhesion 4 CD81 (CD81) +0 . 031 ↑ B cell co-receptor 5 CD58 (CD58) +0 . 030 ↑ T cell activ ation (LF A-3) 6 CD224 (GGT1) +0 . 030 ↑ Oxidative stress 7 CD29 (ITGB1) +0 . 019 ↑ Cell adhesion 8 Ig κ (IGKC) +0 . 010 ↑ B cell / antibody 9 TCR V γ 9 (TRGV9) +0 . 010 ↑ γ δ T cell 10 CD71 (TFRC) − 0 . 009 ↓ Iron metabolism 11 Ig λ (IGLC1) +0 . 008 ↑ B cell / antibody 12 CD11c (ITGAX) +0 . 008 ↑ Dendritic cell 13 CD40 (CD40) +0 . 007 ↑ B cell acti vation 14 TSLPR (CRLF2) +0 . 007 ↑ Autoimmunity 15 CD5 (CD5) +0 . 006 ↑ T/B1 cell 16 CD144 (CDH5) +0 . 006 ↑ Endothelial barrier 17 β 2 M (B2M) − 0 . 006 ↓ MHC class I 18 CD268 (TNFRSF13C) +0 . 006 ↑ BAFF-R / B cell survi val 19 CD198 (CCR8) +0 . 006 ↑ Tre g migration 20 CD294 (PTGDR2) +0 . 005 ↑ Th2 / allergy I Hi-C V alidation Details T able 9: Per-gene Hi-C contact ratios for all 25 genes with sufficient cov erage (4DN K562 data, 5 kb resolution). Three genes excluded due to zero Hi-C records: B2M , TFRC , GFI1B . Mean ratio = 1 . 30 × ; 16/25 genes show ratio > 1 ( P = 0 . 020 , Wilcoxon signed-rank). Gene T op 20 Hi-C Random 20 Hi-C Ratio Note CD55 156.4 56.8 2 . 75 × Complement regulator CD82 66.2 29.0 2 . 28 × T etraspanin IL21R 68.6 31.2 2 . 20 × IL-21 receptor FCGR2A 93.8 45.1 2 . 08 × Fc receptor CD83 71.5 36.0 1 . 99 × Dendritic cell ITGB1 51.3 29.9 1 . 72 × Integrin β 1 ITGAE 74.7 49.0 1 . 53 × Integrin α E CD44 42.1 28.3 1 . 49 × Cell adhesion SLC3A2 47.9 34.4 1 . 39 × Amino acid transporter MSR1 48.6 35.4 1 . 37 × Scavenger receptor EPCAM 30.7 23.2 1 . 32 × Epithelial adhesion TNFSF13B 18.0 13.8 1 . 30 × B AFF NECTIN2 75.4 57.9 1 . 30 × Cell–cell adhesion LGALS3 30.3 24.4 1 . 24 × Galectin-3 KLRD1 31.8 28.5 1 . 12 × NK receptor CD40 30.4 28.1 1 . 08 × B cell acti vation CD69 36.5 37.4 0 . 97 × Early activ ation ICAM1 56.6 60.0 0 . 94 × Inflammatory adhesion KLRG1 30.3 38.3 0 . 79 × NK/T inhibitory ENTPD1 21.4 29.7 0 . 72 × A TP metabolism CD58 27.4 39.4 0 . 70 × LF A-3 CD52 35.7 53.5 0 . 67 × CAMP A TH-1 antigen CD81 26.1 41.9 0 . 62 × T etraspanin TNFSF9 27.0 48.7 0 . 56 × 4-1BB ligand CD19 20.8 61.4 0 . 34 × B cell marker Mean 1 . 30 × 16/25 > 1 15 J Gradient Analysis: NTC Mean V alidation T o validate that gradient analysis can predict side effects without perturbation data, we compared two gradient computation approaches for CD52: (1) using actual CD52-perturbed cells as input (as in Section 5.4 ), and (2) using only the non-tar geting control (NTC) mean e xpression and NTC mean protein le vels—i.e., no CD52 perturbation data whatsoev er . T able 10 sho ws that the two approaches produce highly concordant results, confirming that gradient analysis can screen novel drug targets from unperturbed baseline data alone. T able 10: Gradient analysis validation: NTC mean vs. perturbation cell input. Concordance between protein-lev el gradients ( ∂ ˆ y Prot ,j /∂ x RNA, CD52 ) computed using NTC mean input (no pertur- bation data) vs. actual CD52-perturbed cell input. Metric All proteins (189) Expressed proteins (65) Pearson r 0.913 0.939 Spearman ρ 0.752 0.865 Direction agreement 145/189 (76.7%) 63/65 (96.9%) T op 20 direction agreement 20/20 (100%) — K mRNA–Pr otein Response Div ergence T o comprehensiv ely assess the relationship between mRN A and surface protein responses to CD52 knockdown, we analyzed the experimentally measured values from the Morris et al. STING-seq CRISPRi dataset [ Morris et al. , 2023 ]—not CDT -III predictions. W e computed mRNA log2 fold changes from the full transcriptome (36,601 genes; CD52 knockdown vs. non-targeting control, 1,369 vs. 39,101 cells) and used DSB-normalized protein effects (131 CD52 cells, consistent with all other protein analyses in this paper). Matching the 65 detectably expressed proteins to their corresponding gene symbols yielded 27 unique gene–protein pairs (26 with nonzero changes). T able 11 shows a sensitivity analysis across mRN A change thresholds. Among all 26 pairs with nonzero changes, 16 (61.5%) show opposite directions—mRN A decreases while protein increases. As the threshold increases to focus on genes with more reliable mRNA changes, the di vergence rate rises further: at | log2FC | > 0 . 01 , 8/12 (66.7%) sho w opposite directions; at | log2FC | > 0 . 02 , 7/8 (87.5%); and at | log2FC | > 0 . 05 , 4/4 (100%). This pattern demonstrates that for genes where mRN A responds measurably to perturbation, the protein-le vel response predominantly mov es in the opposite direction. T able 11: Sensitivity analysis of mRNA–protein dir ection divergence. For each mRN A change threshold, we report the number of gene–protein pairs with opposite vs. same direction of change following CD52 knockdown. mRN A: full transcriptome log2FC; protein: DSB-normalized effects (65 expressed proteins, 27 matched pairs). | log2FC | threshold N genes Opposite Same % Opposite > 0 (all nonzero) 26 16 10 61.5% > 0 . 005 16 10 6 62.5% > 0 . 01 12 8 4 66.7% > 0 . 02 8 7 1 87.5% > 0 . 05 4 4 0 100.0% Figure 6 shows the per-gene comparison for the 12 genes with | log2FC | > 0 . 01 . Dark-colored bars indicate gene–protein pairs with opposite directions of change; light-colored bars indicate same-direction pairs. The dominant pattern is mRNA decrease with protein increase: for exam- ple, ICAM1 mRN A decreases ( − 0 . 124 log2FC) while its surface protein increases, consistent with post-translational compensation. These discordances cannot be captured by mRNA-le vel analysis alone. 16 Figure 6: mRNA vs. surface pr otein r esponse di vergence after CD52 knockdown. Left: Paired bar chart for 12 genes with | mRN A log2FC | > 0 . 01 (DSB-normalized protein), showing mRNA change (blue) and protein change (red, scaled) for each gene. Dark colors indicate opposite-direction pairs (8/12, 66.7%); light colors indicate same-direction pairs. The dominant pattern—mRN A de- creases while surface protein increases—is consistent with post-translational regulation. Right: Sensitivity analysis showing the percentage of gene–protein pairs with opposite directions at in- creasing mRNA change thresholds. The di vergence rate rises from 61.5% to 100% as the threshold increases, indicating that genes with the strongest mRNA responses show the most pronounced protein-lev el discordance. Despite this div ergence, CDT -III correctly predicts both the mRNA decrease and the protein increase for these genes. This implies that the model has learned to decouple mRNA-le vel and protein-lev el responses—likely through the RN A → Protein cross-attention in VCE-C, which allows each protein to selectiv ely attend to gene expression patterns that drive its surface-lev el change, independent of the target gene’ s own mRNA direction. Analyzing which genes each protein attends to in this cross-attention layer could rev eal the compensatory re gulatory mechanisms underlying the observed mRN A–protein div ergence, a direction we lea ve for future work. L Cross-Attention Genome T racks T o illustrate what CTCF enrichment means at the individual gene le vel, Figure 7 and Figure 8 sho w the DNA → RN A cross-attention profile aligned with CTCF ChIP-seq peaks for two representative genes. Red v ertical lines indicate CTCF binding sites that fall within the top 10% of attention bins; gray lines indicate CTCF sites outside the top 10%. For CD55 (Hi-C contact ratio 2 . 75 × ), 3 of 4 CTCF sites fall within the highest-attention regions, demonstrating that the model has learned to attend to positions of known insulator function. For FCGR2A ( 2 . 08 × ), the single high-attention CTCF site lies upstream of the TSS, consistent with a distal regulatory element mediating 3D chromatin contact. These genome-lev el views confirm that the aggregate CTCF enrichment statistic ( 8 . 59 × ; T able 2 ) reflects genuine, position-specific alignment between learned attention and kno wn regulatory archi- tecture. Notably , the model does not attend to all CTCF sites equally: it selectively focuses on those that mediate 3D contacts with the promoter, distinguishing functionally relev ant insulators from those not inv olved in regulating a giv en gene—a discrimination that emerges entirely from perturbation prediction training, without any chromatin structure supervision. 17 Figure 7: CD55 cross-attention genome track. DNA → RN A cross-attention profile (top) aligned with CTCF ChIP-seq peaks (bottom) across the ± 57 kb Enformer windo w . Red lines: CTCF sites in top 10% attention (3/4). TSS indicated by dotted line. Hi-C contact ratio: 2 . 75 × (T able 9 ). Figure 8: FCGR2A cross-attention genome track. Same format as Figure 7 . CTCF site in top 10% attention (1/2) located upstream of TSS, consistent with distal re gulatory contact. Hi-C contact ratio: 2 . 08 × . 18 NeurIPS Paper Checklist 1. Claims Question: Do the main claims made in the abstract and introduction accurately reflect the paper’ s contributions and scope? Answer: [Y es] Justification: All claims (multi-task regularization, interpretability improv ement, in silico pharmacology) are supported by experimental results in Sections 5.2–5.4. 2. Limitations Question: Does the paper discuss the limitations of the work performed by the authors? Answer: [Y es] Justification: Section 6 (Limitations) discusses K562-only ev aluation, cell-lev el protein r = 0 . 28 , gradient interpretability r = 0 . 443 on 2 genes, CRISPRi vs. antibody action, and marginal Hi-C permutation P . 3. Theory assumptions and proofs Question: For each theoretical result, does the paper provide the full set of assumptions and a complete (and correct) proof? Answer: [N/A] Justification: This is an empirical paper with no theoretical results. 4. Experimental result r eproducibility Question: Does the paper fully disclose all the information needed to reproduce the main experimental results of the paper to the e xtent that it affects the main claims and/or conclu- sions of the paper (regardless of whether the code and data are pro vided or not)? Answer: [Y es] Justification: Full architecture details (Section 3, Appendix B), hyperparameters (Sec- tions 3.3–3.4), data splits (Section 4), and training procedure are provided. Code will be released upon publication. 5. Open access to data and code Question: Does the paper pro vide open access to the data and code, with suf ficient instruc- tions to faithfully reproduce the main experimental results, as described in supplemental material? Answer: [Y es] Justification: The dataset is publicly av ailable (GEO: GSE171452). Code will be released upon publication. 6. Experimental setting/details Question: Does the paper specify all the training and test details (e.g., data splits, hyperpa- rameters, how the y were chosen, type of optimizer) necessary to understand the results? Answer: [Y es] Justification: Data splits (Section 4), two-phase training strate gy with learning rates and pa- tience (Section 3.3), loss function and λ (Section 3.2), and architecture details (Section 3.2, Appendix B) are all specified. 7. Experiment statistical significance Question: Does the paper report error bars suitably and correctly defined or other appropri- ate information about the statistical significance of the experiments? Answer: [Y es] Justification: Per-gene r values are reported indi vidually for all 5 held-out genes (T able 1). CTCF enrichment is validated with permutation testing ( P < 0 . 001 , n = 1 , 000 ). Hi-C validation uses W ilcoxon signed-rank test ( P = 0 . 020 ) and permutation test ( P = 0 . 088 , n = 10 , 000 ). 19 8. Experiments compute resour ces Question: For each experiment, does the paper provide sufficient information on the com- puter resources (type of compute w orkers, memory , time of ex ecution) needed to reproduce the experiments? Answer: [Y es] Justification: Single NVIDIA A100 GPU. CDT -III fine-tuning: ∼ 3 hours; CDT -II pre- training (weight transfer source): ∼ 48 hours (Section 3.3). 9. Code of ethics Question: Does the research conducted in the paper conform, in every respect, with the NeurIPS Code of Ethics https://neurips.cc/public/EthicsGuidelines ? Answer: [Y es] Justification: The research uses publicly av ailable cell line data (no human subjects), and in silico predictions are explicitly cautioned as not being clinical recommendations (Section 6, Broader impact). 10. Broader impacts Question: Does the paper discuss both potential positi ve societal impacts and negativ e societal impacts of the work performed? Answer: [Y es] Justification: Section 6 (Broader impact) discusses the potential for early drug safety screening and cautions that predictions require experimental validation and should not be used as definitiv e safety assessments. 11. Safeguards Question: Does the paper describe safeguards that have been put in place for responsible release of data or models that have a high risk for misuse (e.g., pre-trained language models, image generators, or scraped datasets)? Answer: [N/A] Justification: The model predicts perturbation responses in a single cell line and poses no direct risk for misuse. 12. Licenses for existing assets Question: Are the creators or original owners of assets (e.g., code, data, models), used in the paper , properly credited and are the license and terms of use explicitly mentioned and properly respected? Answer: [Y es] Justification: STING-seq data (GEO: GSE171452), ENCODE ChIP-seq data, and 4DN Hi-C data are all publicly av ailable and properly cited. 13. New assets Question: Are ne w assets introduced in the paper well documented and is the documenta- tion provided alongside the assets? Answer: [N/A] Justification: No new datasets are released. Code will be released upon publication with documentation. 14. Crowdsour cing and resear ch with human subjects Question: For crowdsourcing experiments and research with human subjects, does the pa- per include the full text of instructions gi ven to participants and screenshots, if applicable, as well as details about compensation (if any)? Answer: [N/A] Justification: No crowdsourcing or human subjects research (cell line data only). 15. Institutional re view board (IRB) approvals or equivalent for research with human subjects 20 Question: Does the paper describe potential risks incurred by study participants, whether such risks were disclosed to the subjects, and whether Institutional Revie w Board (IRB) approv als (or an equiv alent approv al/revie w based on the requirements of your country or institution) were obtained? Answer: [N/A] Justification: No human subjects research (cell line data only). 16. Declaration of LLM usage Question: Does the paper describe the usage of LLMs if it is an important, original, or non-standard component of the core methods in this research? Note that if the LLM is used only for writing, editing, or formatting purposes and does not impact the core methodology , scientific rigor , or originality of the research, declaration is not required. Answer: [N/A] Justification: LLMs (Claude, Anthropic) were used only for manuscript editing, not as a component of the core methodology . This is disclosed in the Acknowledgments. 21
Original Paper
Loading high-quality paper...
Comments & Academic Discussion
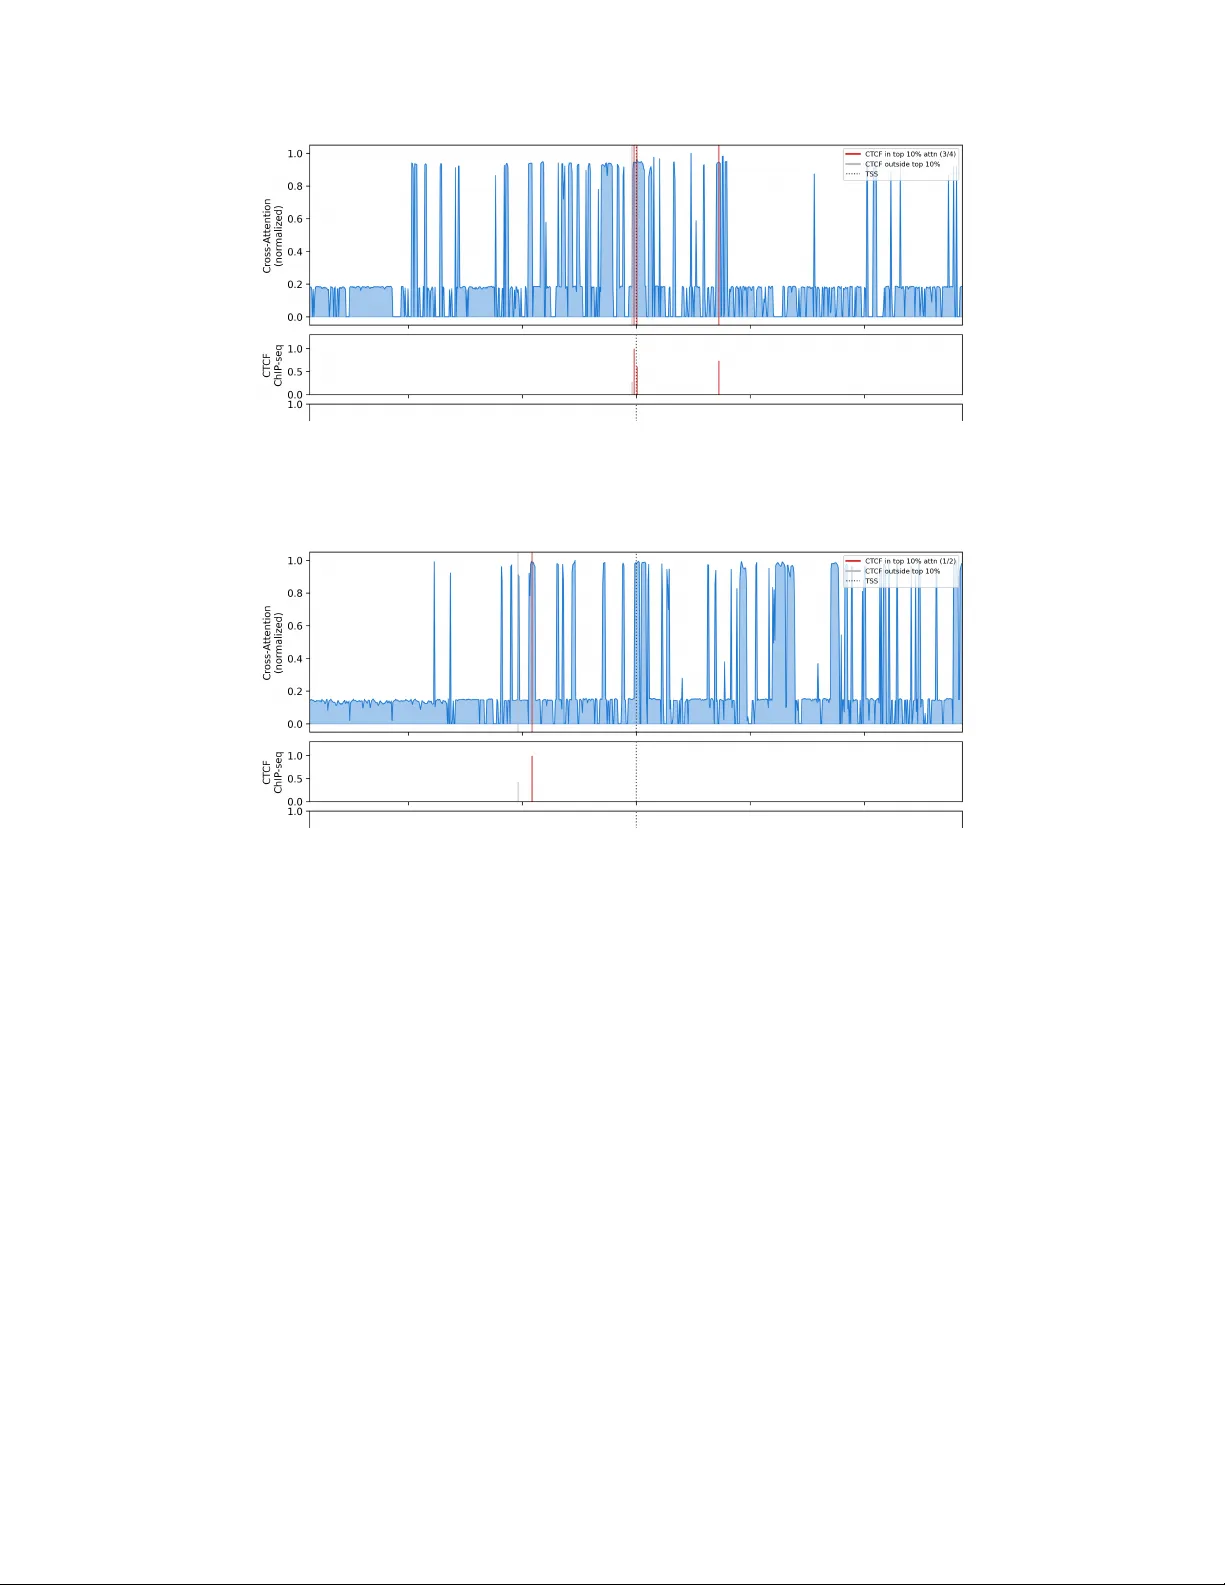
Loading comments...
Leave a Comment