Uncertainty Quantification and Risk Control for Multi-Speaker Sound Source Localization
Reliable Sound Source Localization (SSL) plays an essential role in many downstream tasks, where informed decision making depends not only on accurate localization but also on the confidence in each estimate. This need for reliability becomes even mo…
Authors: Vadim Rozenfeld, Bracha Laufer Goldshtein
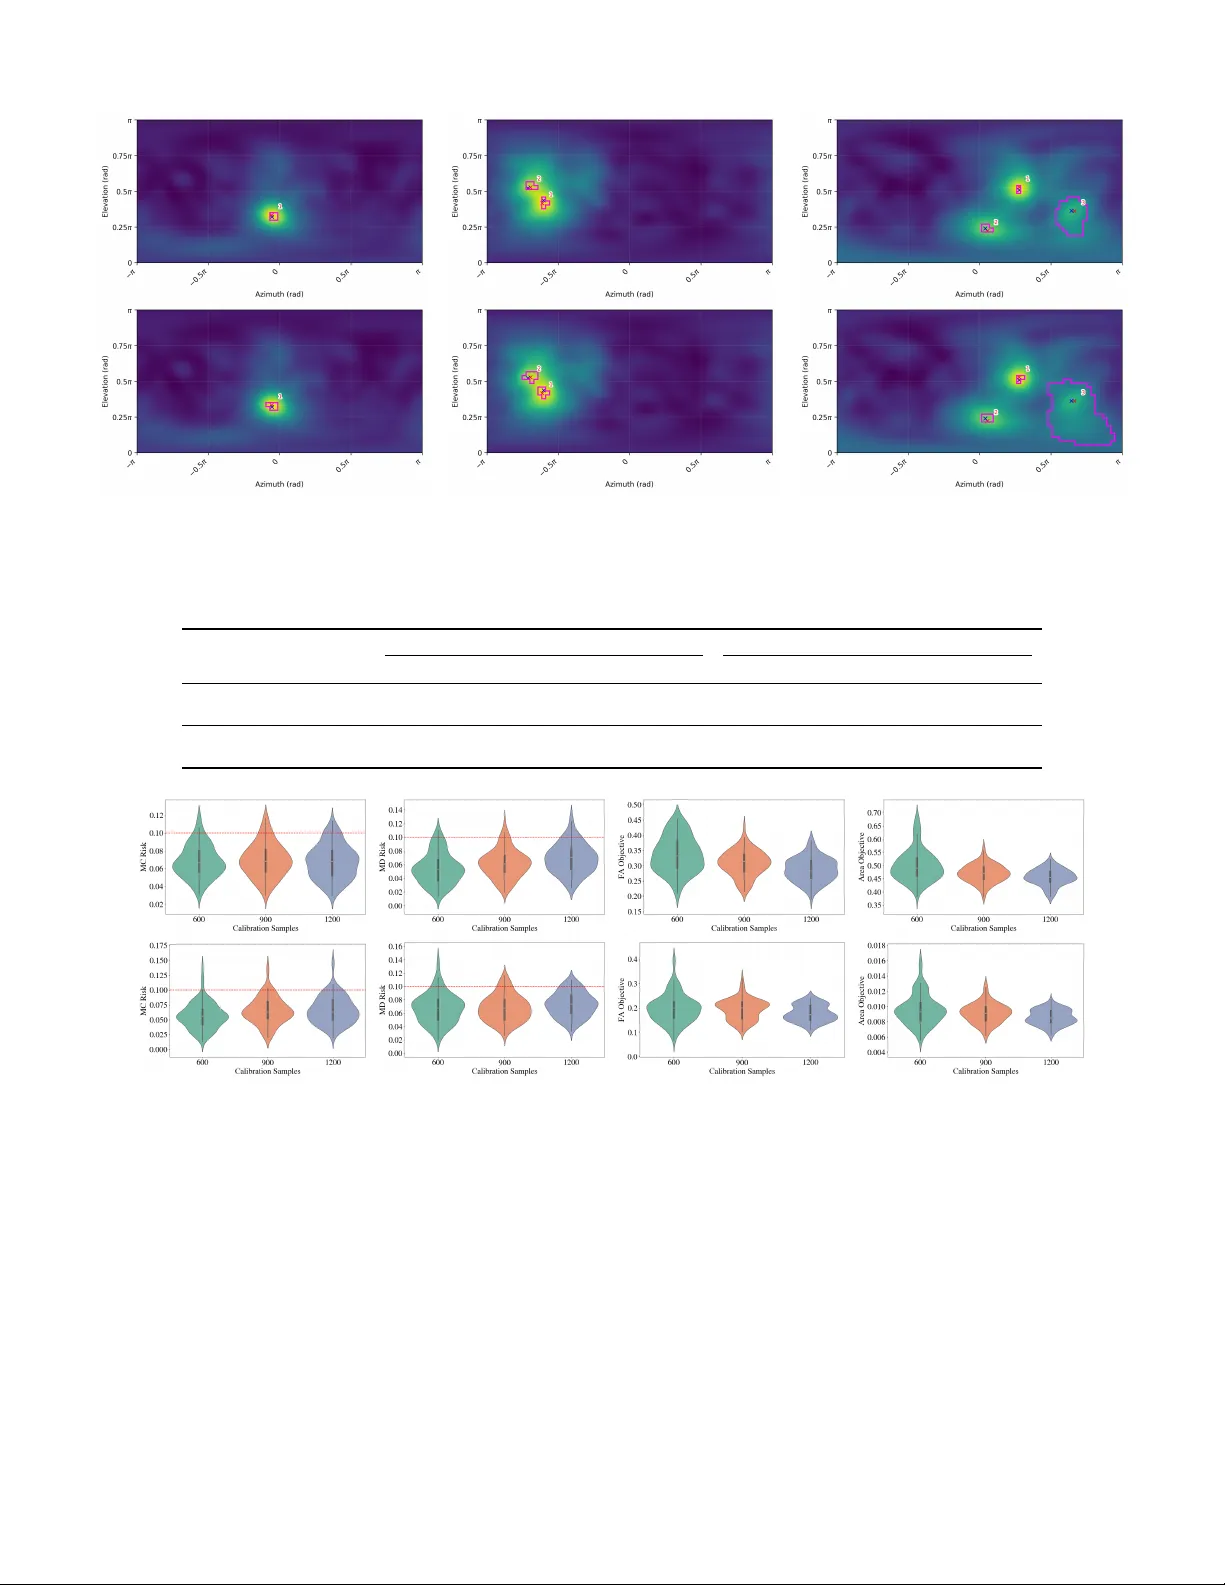
JOURNAL OF L A T E X CLASS FILES, VOL. 14, NO. 8, A UGUST 2021 1 Uncertainty Quantification and Risk Control for Multi-Speaker Sound Source Localization V adim Rozenfeld , Bracha Laufer Goldshtein Abstract —Reliable Sound Source Localization (SSL) plays an essential role in many do wnstream tasks, where inf ormed decision making depends not only on accurate localization but also on the confidence in each estimate. This need for reliabil- ity becomes e ven more pr onounced in challenging conditions, such as r everberant en vironments and multi-source scenarios. Howev er , existing SSL methods typically provide only point estimates, offering limited or no Uncertainty Quantification (UQ). W e lev erage the Conformal Pr ediction (CP) framework and its extensions f or controlling general risk functions to develop two complementary UQ approaches for SSL. The first assumes that the number of active sources is known and constructs prediction regions that cover the true sourc e locations. The second addr esses the more challenging setting where the source count is unknown, first r eliably estimating the number of active sources and then forming corresponding prediction regions. W e evaluate the proposed methods on extensive simulations and real-w orld recordings across varying re verberation levels and source configurations. Results demonstrate reliable finite-sample guarantees and consistent performance for both known and unknown sour ce-count scenarios, highlighting the practical utility of the proposed frameworks for uncertainty-aware SSL. Index T erms —Sound Source Localization, Conformal Predic- tion, Uncertainty Quantification, Risk-Control. I . I N T RO D U C T I O N A CCURA TE Sound Source Localization (SSL) is a fundamental component in a wide range of acoustic and audio signal processing systems, including robot audition [1], camera steering [2], and speech enhancement and separation [3]. In these applications, determining the Direction of Arriv al (DOA) or positions of one or more activ e sources enables downstream modules such as beamforming, source separation, diarization, or navigation, to operate reliably . The demand for robust SSL has only intensified as systems encounter increasingly complex acoustic en vironments with reverberation, noise, and multiple sources. A large body of work has focused on developing algorithms capable of estimating SSL under challenging acoustic condi- tions. Several classical approaches generate likelihood maps ov er a predefined spatial grid. These include Steered-Response Power with Phase T ransform (SRP-PHA T) [4] and Expectation Maximization (EM)-based methods [5], which exploit T ime- Difference of Arriv als (TDO As) between microphone pairs, as well as subspace-based techniques such as Multiple Signal Classification (MUSIC) [6] and Estimation of Signal Parame- ters via Rotational In variance T echniques (ESPRIT) [7]. More recently , Deep Neural Network (DNN)-based models have The authors are with The School of Electrical & Computer Engi- neering, T el-A viv University , T el-A viv 6139001, Israel (e-mail: vadim- roz@mail.tau.ac.il; blaufer@tauex.tau.ac.il) been proposed and often demonstrate improved performance by learning complex patterns that are difficult to capture with traditional signal processing techniques [8]. Many of these approaches produce spatial likelihood maps by imitating classical localization methods [9], [10], [11], or by formulating the SSL problem as a classification task over a set of classes obtained by discretizing the region of interest [12], [13], [14]. Despite notable progress, most SSL systems operate in a strictly point estimation manner , meaning they output a single estimated location for each detected source, without quanti- fying the reliability of these estimates. Howe ver , errors are unav oidable since noise, rev erberation, and interfering signals fundamentally distort the spatial cues on which SSL methods rely . Without a principled measure of UQ, downstream com- ponents must either trust the SSL output blindly or rely on heuristic thresholds that provide no statistical guarantees. Few recent approaches have proposed extracting reliability measures for SSL estimates to detect low-confidence estimates and out-of-distribution samples [12], [14]. In [12], Gaussian label smoothing is used during training, and the predicted peak value is treated as a proxy for reliability , while [14] models output uncertainty via a Dirichlet distribution. Both approaches provide useful reliability indicators, albeit without formal statistical guarantees. A widely used UQ approach that provides distribution- free finite-sample guarantees is CP [15], [16], [17], which constructs Prediction Intervals (PIs) that contain the true value with a user-specified probability . Few recent attempts were made to apply CP for SSL. For the single-source case, [18] applied CP using several uncertainty surrogates, including Monte-Carlo dropout, model ensembles, and quantile regression. Our prior work combined manifold- based SSL based on Gaussian process regression [19] with CP to efficiently obtain statistically valid PIs [20]. This kernel-based localization approach was replaced by a graph neural network in [21], while constructing valid PIs using an alternativ e Jackknife+ formulation [22]. In the multi-source setting, [23] assumes a known number of sources and models the conditional multi-source DOA distribution using a Gaussian mixture model parameterized by a neural network (NN), and CP is then applied to obtain PIs from its outputs. These pre vious works [18], [20], [21], [23] heavily rely on classical CP, which is tailored exclusi vely to the binarized Mis-Coverage (MC) loss, namely , the probability that the true value lies outside the PI. Y et, multi-source setups introduce additional and potentially competing losses be- yond MC. For instance, errors may arise from failing to detect an existing speaker at all, or from declaring a speaker that does not exist. Moreover , classical CP is suited to calibrating JOURNAL OF L A T E X CLASS FILES, VOL. 14, NO. 8, A UGUST 2021 2 only a single hyperparameter , such as a detection threshold, whereas practical systems inv olve multiple hyperparameters that must be tuned jointly . In addition, prior UQ frameworks are typically optimized for specific localization methods and do not generalize readily to alternati ve approaches. This work addresses these gaps by leveraging recent advances in the CP literature, enabling principled UQ for complex, multi-objectiv e settings that classical CP cannot accommodate. W e propose a general UQ frame work applicable to any multi-source localization method that produces a likelihood map over a grid of candidate positions. W e consider both scenarios in which the number of sources is known or unknown. The ke y idea is to associate each position estimate with an interpretable confidence information, expressed as prediction region, on a 2D spatial likelihood map that contains the true source location with high probability . When the number of sources is unknown, the framew ork further enables controlled detection of the correct number of sources. Extensiv e experimental studies demonstrate the effecti veness of the proposed framew ork across a wide range of conditions. Our main contributions are summarized as follows: • Our proposed framew orks operate on spatial likelihood maps from any classical or DNN-based localization method, yielding finite-sample, statistically v alid prediction regions containing the true source location with high probability . • W e introduce a method for constructing contiguous predic- tion regions around each SSL estimate that adapt to the local likelihood landscape, without imposing any geometric or distributional assumptions on the region shape. The size of this re gion directly quantifies uncertainty , with lar ger regions indicating lower confidence and vice versa. Such informa- tion can naturally inform downstream decision-making. • For the unknown-source case, beyond classical MC risk control, we additionally provide principled simultaneous control over the risk of failing to detect an existing speaker , while discouraging spurious detections and minimizing the size of the prediction region. • W e ev aluate the proposed framew orks on single- and multi-source tasks with both known and unknown number of sources. W e consider both classical and DNN-based like- lihood maps obtained for simulated en vironments, and real- world recordings. Our code is publicly av ailable on GitHub . 1 The remainder of the paper is organized as follows. Section II formulates the multi-source localization problem. Section III revie ws SSL methods based on constructing spatial likelihood maps. Section IV provides background on CP and risk control extensions. Section V presents the proposed ap- proaches for risk control in settings with known and unknown numbers of sources. Section VI describes experimental setup and results, and Section VII concludes the paper . I I . P RO B L E M F O R M U L A T I O N W e consider a rev erberant acoustic enclosure with K static sources, 1 ≤ K ≤ K max , where K is unkno wn but K max is known. Let { p ∗ k } K k =1 denote the 2D DO As of the sources, 1 https://github .com/vadimroz/UQ in multi SSL where p ∗ k = [ ϕ k , θ k ] T , with ϕ i ∈ [0 , π ] and θ k ∈ [ − π , π ] denoting the elev ation and azimuth angles, respecti vely . The signal receiv ed at the m -th microphone in the Short-Time Fourier Transform (STFT) domain is expressed as X m ( t, f ) = K X k =1 A m ( f , p ∗ k ) S k ( t, f ) + U m ( t, f ) , (1) where t ∈ { 1 , . . . , T } and f ∈ { 1 , . . . , F } denote the frame and frequency indices, respectively . Here, S k ( t, f ) is the k -th source signal, A m ( f , p ∗ k ) is the Room Impulse Response (RIR) relating the k -th source at p k and the m -th microphone, and U m ( t, f ) is an additiv e noise. Our framework builds on existing SSL methods that produce 2D spatial likelihood maps, from which the DO As are estimated. W e consider both classical approaches, such as SRP-PHA T [4], and neural network–based models [9], [10], [11], [12], [13]. Gi ven a generic spatial likelihood map, our goal is to enable principled UQ and risk control by constructing prediction regions that cover the true source locations with high probability . When the number of sources is unkno wn, we additionally wish to control the error of incorrectly estimating the source count. I I I . B AC K G RO U N D O N S O U N D S O U R C E L O C A L I Z ATI O N This section revie ws two representativ e localization methods that produce 2D spatial likelihood maps: the classical SRP-PHA T method [4] and the learning-based SRP-DNN [10]. Importantly , our frameworks seamlessly generalize to any method capable of producing analogous maps, e.g., [6], [7], [9], [11]. A. SRP-PHAT V arious SSL methods rely on TDOA estimation between pairs of microphones. A prominent example is SRP-PHA T [4], which steers the microphone array over a set of hypothesized phases defined on a spatial grid. This process yields a spatial likelihood map, whose peaks correspond to potential source directions. T o construct this map, the phase-normalized cross- correlation is ev aluated for each microphone pair ( m, m ′ ) at ev ery time-frequency (T -F) bin. Ψ mm ′ ( t, f ) = X m ( t, f ) X ∗ m ′ ( t, f ) | X m ( t, f ) X ∗ m ′ ( t, f ) | , (2) where | · | denotes the magnitude of a complex-number . The normalization enforces unit magnitude across frequencies, leaving only phase differences. Then, given a hypothesized direction p = [ ϕ, θ ] T , the expected TDOA between a pair of microphones m and m ′ is τ mm ′ ( p ) = ( m m − m m ′ ) T u ( p ) c , (3) where m m and m m ′ are the microphone positions, u ( p ) = [sin( ϕ ) cos( θ ) , sin( ϕ ) sin( θ ) , cos( ϕ )] T is the unit vector pointing toward the source and c is the speed of sound. JOURNAL OF L A T E X CLASS FILES, VOL. 14, NO. 8, A UGUST 2021 3 The SRP likelihood map at direction p is computed using M ( M − 1) / 2 non-redundant microphone pairs with m ′ > m as Φ SRP − PHA T ( p ) = (4) 2 M ( M − 1) 1 T F X m ′ ,m F X f =1 T X t =1 ℜ n Ψ mm ′ ( t, f ) e − j ω f τ mm ′ ( p ) o . where ℜ{·} denotes the real part, and ω f = 2 π f . Multiplying by e − j ω f τ mm ′ ( p ) virtually steers the microphone pair ( m, m ′ ) tow ards candidate direction. A veraging across T -F bins and mi- crophone pairs produces a spatial likelihood map Φ SRP − PHA T whose peaks indicate the most probable source directions. B. SRP-DNN Classic SSL algorithms often struggle when multiple sources are simultaneously activ e, as interference can lead to less pronounced spatial peaks, peak merging, or even spurious responses. Rev erberation and ambient noise further exacerbate these issues, making accurate source detection and localization increasingly difficult. T o this end, the SRP-DNN [10] uses a deep learning model designed to suppress acoustic interference and estimate the direct-path Inter-Channel Phase Dif ferences (IPDs) for each microphone pair ( m, m ′ ) , gi ven by: IPD mm ′ ( f ; p ∗ ) = e j ω f τ mm ′ ( p ∗ ) . (5) Note that in anechoic, noise-free rooms, the phase-normalized cross-correlation defined in (2) satisfies Ψ mm ′ ( t, f ) = IPD mm ′ ( f ; p ∗ ) for a true source located at p ∗ . Consequently , the likelihood in (4) is maximized whenever p = p ∗ . At its core, SRP-DNN adopts a Con volutional Recurrent Neural Network (CRNN) to extract IPDs from noisy and rev erberant microphone signals. Let r mm ′ ( p ∗ ) ∈ R 2 F × 1 denote the real-valued vector form of the direct-path IPD r mm ′ ( p ∗ ) = cos( ω 1 τ mm ′ ( p ∗ )) , sin( ω 1 τ mm ′ ( p ∗ )) , . . . , cos( ω F τ mm ′ ( p ∗ )) , sin( ω F τ mm ′ ( p ∗ )) T . (6) The model is trained to estimate a summed direct-path IPD representation encoding the contributions of all K sources R mm ′ ( t ) = K X k =1 π k ( t ) r mm ′ ( p ∗ k ) , (7) where π k ( t ) ∈ [0 , 1] denotes the activity probability of the k -th source at the t -th frame. The SRP-DNN model is optimized by minimizing the mean squared error (MSE) between the prediction b R mm ′ ( t ) and the training target at (7). Analogously to (4), the spatial likelihood map is giv en by Φ SRP - DNN ( p ) = 2 M ( M − 1) 1 T F T X t =1 X m ′ ,m b R mm ′ ( t ) T r mm ′ ( p ) . (8) C. Source Localization fr om the Likelihood Map W e no w describe ho w to extract source position estimates from a gi ven spatial likelihood map (e.g., as defined in (4) Algorithm 1 Iterativ e Source Detection and Localization Input: Spatial grid G , likelihood maps Φ( p ) for p ∈ G ; Stopping threshold β TH and maximum count K max or known count K ; Minimum separation d , and method ∈ { SRP-PHAT , SRP-DNN } . Output: Detected DOAs { ˆ p 1 , . . . , ˆ p k } and the corresponding likelihood maps { Φ (1) , . . . , Φ ( k ) } 1: Initialize Φ (1) ( p ) ← Φ( p ) 2: Initialize F 1 ← G 3: for k ← 1 to K max do ▷ or K loops at known count 4: ˆ p k ← arg max p ∈F k Φ ( k ) ( p ) 5: if Φ ( k ) ( ˆ p k ) < β TH then ▷ only for unknown count 6: break 7: end if 8: ˆ β k ← Φ ( k ) ( ˆ p k ) 9: if method = SRP-PHAT then 10: Ψ ( k +1) mm ′ ( t, f ) ← Ψ ( k ) mm ′ ( t, f ) − ˆ β k · e j ω f τ mm ′ ( ˆ p k ) 11: else if method = SRP-DNN then 12: b R mm ′ ← b R mm ′ − ˆ β k · r mm ′ ( ˆ p k ) 13: end if 14: U P D A T E Φ ( k +1) ▷ Eq. (4) or (8) 15: F k +1 ← p ∈ G : | ϕ − ˆ ϕ i | ≥ d ∧ | θ − ˆ θ i | ≥ d, ∀ i < k 16: end for 17: return { ˆ p 1 , . . . , ˆ p k } , { Φ (1) , . . . , Φ ( k ) } and (8)). In the single-source case, the estimated position can be simply determined by the peak of the likelihood map ˆ p = arg max p ∈G Φ( p ) , (9) where G denotes a grid of candidate directions. In practice, ov erlapping sources and adverse acoustic conditions make the estimator in (9) unsuitable for directly recov ering multiple ac- tiv e sources. An alternativ e approach, as explored in [10], [24], [25], [26], is to iterativ ely detect the dominant source from the likelihood map Φ using (9), suppress its spatial contribution, and then re-estimate the map to uncov er ne w sources. Since the true number of sources is often unkno wn, stopping criterion becomes an essential design component. For example, in [10], the process halts when the global maximum of the likelihood map falls below a predefined threshold, whereas [24] uses a sparsity-based criterion deriv ed from the GCC function, ter - minating the procedure when the kurtosis v alue becomes suf- ficiently small. Howe ver , the exact stopping threshold is often determined heuristically without any performance guarantees. W e adopt a standard iterati ve detection–localization procedure [10], as summarized in Algorithm 1. When the source count is known the algorithm stops exactly after K iterations, while in the unknown case, the termination is based on thresholding. In Section V, we show that this threshold can be selected through a principled risk controlling framework. W e note that although Algorithm 1 is presented in the con- text of SRP-type methods, the UQ framew orks developed in this paper are general. They can be readily adapted, with only minor modifications, to any SSL approach yielding a sequence of detected DOAs and their corresponding likelihood maps. JOURNAL OF L A T E X CLASS FILES, VOL. 14, NO. 8, A UGUST 2021 4 D. Uncertainty Quantification A ke y limitation of many SSL methods is that they yield only point estimates, offering no indication of confidence. Incorporating UQ is therefore highly beneficial, as it enables more informed downstream decisions by quantifying the confidence in each localization result. In the context of SSL, uncertainty can be naturally expressed using prediction regions constructed directly on top of the spatial likelihood map. In particular, a more compact region indicates higher confidence in the corresponding localization estimate. When the number of sources is unknown, we would like to account also for the uncertainty in detecting the correct number of sources. T o enable statistical guarantees for prediction cov erage and reliable control over missed detections, our framew ork relies on CP and its extensions. The following section provides a detailed background on these methods. I V . B A C K G RO U N D O N C O N F O R M A L P R E D I C T I O N A. Overview In recent years, CP [15], [16], [17] has gained popularity as it provides a distribution-free framework for constructing predictiv e intervals with finite-sample guarantees, independent of the underlying model or data distribution. Its appeal stems from being a generic post-hoc approach that requires only data exchangeability , i.e., the joint distribution of data samples is in variant under any permutation. This generality has enabled successful applications primarily in computer vision [27], [28] and natural language processing [29], [30], and more recently in speech processing [18], [20], [21], [23]. Split CP [16], [31] is a practical variant of CP that employs a simple data-splitting scheme. The av ailable samples are divided into a training set, used to fit a predictive model ˆ f , and a separate calibration set D cal = { ( X i , Y i ) } n i =1 , ( X i , Y i ) ∼ P , where P is an arbitrary distribution on X × Y . In this context, X i ∈ X denotes a feature v ector and Y i ∈ Y the corresponding response. Giv en a fresh test pair ( X n +1 , Y n +1 ) ∼ P , the goal is to construct a statistically valid PI, i.e., C ( X n +1 ) , that contains the unobserved response Y n +1 with high probability . T o this end, a nonconformity score function s ( x, y ) ∈ R is used to measure the agreement between y and x based on a trained model ˆ f . Better consistency leads to a smaller score. The choice of the nonconformity score is task-dependent, but a common choice for regression problems is the residual error function s ( x, y ) = y − ˆ f ( x ) . Let s i = s ( X i , Y i ) denote the score associated with the i -th calibration sample, the prediction interval for an unseen feature vector X n +1 is C ( X n +1 ) = [ ˆ f ( X n +1 ) − ˆ q 1 − α , ˆ f ( X n +1 ) + ˆ q 1 − α ] , (10) where ˆ q 1 − α is the (1 − α )(1 + 1 /n ) -quantile of the calibra- tion scores { s 1 , . . . , s n } . Under the sole assumption that the calibration and test samples { ( X i , Y i ) } n +1 i =1 are exchangeable, split CP [16] provides a finite-sample coverage guarantee: P ( Y n +1 ∈ C ( X n +1 )) ≥ 1 − α. (11) By the law of total expectation, this is equi valent to E [ 1 { Y n +1 / ∈ C ( X n +1 } ] ≤ α with an expectation over the MC loss 1 { Y n +1 / ∈ C ( X n +1 ) } . B. Conformal Risk Contr ol While CP controls the MC loss, it may not be the most natural choice for many tasks. Conformal Risk Control (CRC) [32] extends CP to arbitrary bounded loss functions L ( λ ) that are non-increasing in a tuning parameter λ ∈ Λ ⊂ R ∪ {±∞} , meaning L ( λ 2 ) ≤ L ( λ 1 ) for λ 1 < λ 2 . Subsequently , the associated risk function is defined as R ( λ ) = E [ L ( λ )] , λ ∈ Λ , (12) assuming the existence of λ min ∈ Λ such that R ( λ min ) = 0 . Let the random variables L i : Λ → ( −∞ , B ] for i = 1 , . . . , n + 1 be defined by L i ( λ ) = L ( X i , Y i ; λ ) and define the corresponding empirical risk over the calibration data as b R n ( λ ) = 1 n n X i =1 L i ( λ ) . (13) Giv en a target risk tolerance α ∈ ( −∞ , B ) , the CRC proce- dure selects the threshold ˆ λ = inf n λ : b R n ( λ ) ≤ α − B − α n o , (14) which controls the risk on unseen data as stated in the following Theorem. Theorem 1 (Conformal Risk Control [32]) . Suppose L i ( λ ) is non-incr easing in λ , right-continuous, satisfying L i ( C λ max ) ≤ α for λ max = sup Λ ∈ Λ and sup λ L i ( λ ) ≤ B < ∞ almost sur ely . Then E [ L n +1 ( ˆ λ )] ≤ α . C. Advanced Risk-Contr ol Methods CRC controls monotonic risks at lev el α , but a stronger version would provide high-probability risk control P ( R ( λ ) ≤ α ) ≥ 1 − δ. (15) meaning that with at least 1 − δ probability , any drawn cal- ibration set D cal yields an expected loss that does not exceed the risk limit α . Indeed, Risk-Controlling Prediction Set (RCPS) [33], [34] offers a rigorous method for constructing prediction functions that achiev es the property at (15). Learn Then T est (L TT) [35] extends RCPS by removing the mono- tonicity requirement on the risk and enabling the calibration of multi-dimensional threshold configurations, λ = ( λ 1 , . . . , λ D ) defined over a continuous space Λ = Λ 1 × · · · × Λ D . This allows simultaneous control of multiple risks, R ℓ ≤ α ℓ for ℓ = 1 , . . . , N c . The key idea is to cast the configuration selection as a Multiple Hypothesis T esting (MHT) procedure, testing a finite set of configurations Λ g ⊆ Λ . For each configuration λ j ∈ Λ g consider the null hypothesis H j : ∃ ℓ ∈ { 1 , . . . , N c } such that R ℓ ( λ j ) > α ℓ . (16) By construction, rejecting H j certifies that, for configuration λ j , all risks are controlled, i.e., R ℓ ( λ j ) ≤ α ℓ for ev ery ℓ . Let Λ rej ⊆ Λ g denote the true rejection set. The L TT framew ork provides a principled method for determining an estimated rejection set ˆ Λ rej ⊆ Λ g based on calibration data. Importantly , it controls the Family-W ise Error Rate (FWER) at level δ , meaning that the probability of making at least one false rejection among all tested hypotheses is bounded by δ . JOURNAL OF L A T E X CLASS FILES, VOL. 14, NO. 8, A UGUST 2021 5 For constructing the rejection set, we first need to deriv e a finite-sample valid p -value p , i.e., P ( p ≤ u ) ≤ u for u ∈ [0 , 1] under H j (see Appendix A-A for further details). For a gi ven configuration λ j and risk tolerance α ℓ , let p ( { L ℓ i ( λ j ) } i ∈D cal ; α ℓ ) denote the p -v alue of the j -th null hypothesis H j,ℓ : R ℓ ( λ j ) > α ℓ associated with the l -th loss. The p -value of the aggregated null hypothesis in (16) can be computed as [35] p cal j = max ℓ =1 ,...,N c p ( { L ℓ i ( λ j ) } i ∈D cal ; α ℓ ) , λ j ∈ Λ g . (17) Then, whene ver p cal j < δ , we declare that all risks R ℓ ( λ j ) , ℓ = 1 , . . . , N c , are simultaneously controlled. Giv en valid p -values, a rejection set ˆ Λ rej is constructed by applying an FWER-controlling algorithm A : [0 , 1] | Λ g | → 2 Λ g . In essence, the algorithm A takes as input the collection of p -values and returns a set of rejected configurations ˆ Λ rej = A ( p cal 1 , . . . , p cal | Λ g | ) , while ensuring that the FWER does not exceed δ . Formally , L TT has the following guarantees. Theorem 2. Suppose P ( p cal j ≤ u ) ≤ u, u ∈ [0 , 1] for all j under H j . Let A be an FWER-contr olling algorithm at level δ . Then ˆ Λ rej = A ( p cal 1 , . . . , p | Λ g | cal ) , satisfies the following P sup ˆ λ ∈ ˆ Λ rej {R ℓ ( ˆ λ ) } ≤ α ℓ ! ≥ 1 − δ, ℓ = 1 , . . . , N c . (18) D. Efficient Risk Contr ol via P ar eto-T esting The L TT framework relies on the choice of FWER- controlling algorithm. A simple option is the Bonferroni correction, A ( p cal 1 , . . . , p cal | Λ g | ) = { λ j ∈ Λ g : p cal j < δ / | Λ g |} , which becomes increasingly conservati ve as | Λ g | grows, thereby reducing its statistical power , i.e., the ability to reject when null hypothesis is false. Advanced testing methods exploit prior knowledge of the structure of the configuration space to identify promising configurations that are likely to control the risks. For example, Fixed Sequence T esting (FST) [35] orders configurations from the most to the least promising and tests them sequentially until a null hypothesis fails to be rejected. Howe ver , the statistical po wer of methods such as FST still depends critically on correctly identifying promising configurations and determining an effecti ve testing order , tasks that become challenging when the configuration space | Λ g | is large and possibly lacking structure. The difficulty intensifies further in settings that in volve both constrained objectives to be controlled and unconstrained objectiv e to be optimized. Building on the L TT framework, Pareto-T esting [36] de- liv ers a computationally and statistically efficient FWER- controlling algorithm that satisfies (18) and simultaneously achiev es strong performance on multiple additional objectiv e functions. The core idea is to partition the calibration set into two disjoint subsets, D cal = D opt ∪ D tst , where D opt is used to define an ordered sequence of candidate configurations, and D tst is used to perform hypothesis testing. Assume N objectiv e functions {R 1 , . . . , R N } , where the first N c are constrained and the remaining N − N c are unconstrained. The set D opt is employed to construct the Pareto frontier with respect to all objective functions {R 1 , . . . , R N } . This frontier , denoted by Λ par , consists of configurations that are not dominated by any other configuration. Formally , for any λ , λ ′ ∈ Λ g , we say that λ ′ dominates λ (denoted as λ ′ ≺ λ ) if R ℓ ( λ ′ ) ≤ R ℓ ( λ ) for all ℓ and R ℓ ( λ ′ ) < R ℓ ( λ ) for at least one ℓ . The Pareto frontier is defined as Λ par = n λ ∈ Λ : { λ ′ ∈ Λ : λ ′ ≺ λ , λ ′ = λ } = ∅ o . (19) In practice, the Pareto frontier may be obtained using standard Pareto optimization methods, including brute- force grid search (see Algorithm 5 in Appendix A-B) or multi-objective Bayesian optimization algorithms [37]. The configurations in Λ par are ranked in ascending order according to their estimated p -values computed on D opt , after which FST is applied to the ordered set using D tst . As long as p tst j < δ , the hypothesis H j is rejected, and the corresponding configuration λ j is added to ˆ Λ rej . This procedure halts at the configuration for which the null hypothesis cannot be rejected. In a final step, a refined set of admissible configurations is obtained by filtering the Pareto optimal configurations over ˆ Λ rej , this time considering only the free objecti ve functions {R N c +1 , . . . , R N } . The resulting subset, denoted by Λ ∗ , contains all validated configurations that are Pareto-optimal with respect to the free objecti ve functions. V . P RO P O S E D A P P R OAC H This section introduces our complementary methods, which address the multiple-source localization problem of Section II. Both methods combine generic spatial likelihood maps with risk-controlling selection methods to provide principled UQ. The first method assumes a known number of sources and uses CRC (Section IV -B) to construct tight prediction regions around each estimated position, which quantify localization uncertainty under a user-specified coverage le vel. The second method handles the unknown-source count setting by jointly performing source detection and localization using Pareto- T esting (Section IV -D). In this case, the objectiv es extend to accurately estimating the true number of activ e sources and constructing their corresponding prediction regions, while minimizing false detections and the total prediction area. An illustration of both methods is presented in Fig. 1. A. Known-source count Let { p ∗ i, 1 , . . . , p ∗ i,K } denote the (unordered) set of true source DOAs for sample i . Assume that a set of K pre- dicted directions { ˆ p i, 1 , . . . , ˆ p i,K } , together with their spatial likelihood maps { Φ (1) i , . . . , Φ ( K ) i } , is av ailable. W e employ a greedy sequential matching procedure that assigns each pre- dicted position, in order , to its nearest unmatched true position, yielding the pairs ( ˆ p i, 1 , p ∗ i, 1 ) , . . . , ( ˆ p i,K , p ∗ i,K ) . For notational simplicity indices are kept unchanged, though the k -th predic- tion is not necessarily matched to the k -th source. Note that al- ternativ e matching mechanisms may also be used, without af- fecting the risk-controlling framew ork proposed in the sequel. For the k -th detected source in sample i , a prediction region C λ k ( ˆ p i,k ) is constructed using a threshold λ k ∈ Λ MC k . JOURNAL OF L A T E X CLASS FILES, VOL. 14, NO. 8, A UGUST 2021 6 Fig. 1: Overvie w of the proposed UQ framew orks. For known-source count K , calibration samples with K DO As and their likelihood maps are used, and CRC-SSL-N calibrates thresholds ( λ 1 , . . . , λ K ) to control individual MC risks at lev el α MC . For unknown-source count, calibration samples across detection thresholds β yield b K ( β ) detections and likelihood maps, and PT - SSL-U jointly calibrates ( λ 1 , . . . , λ K max , β TH ) to control MC and MD risks at levels α MC and α MD with high probability 1 − δ . Each prediction region is defined as a spatially connected region of grid points p ∈ G surrounding ˆ p i,k . Starting from ˆ p i,k , the set is iteratively e xpanded by including any grid point that is adjacent to the current set and satisfies Φ ( k ) i ( p ) ≥ λ k . Algorithm 2 provides a summary of this process. Importantly , this formulation differs from the standard construction of CP sets or intervals. Using classification-based CP, each azimuth–ele vation pair on the likelihood map can be treated as a class and included in the prediction set whenev er its likelihood exceeds a threshold λ k . Howe ver , the resulting prediction region may be non-contiguous due to spurious peaks arising from noisy and echoic environments. Moreov er , in multi-source scenarios, standard CP yields only a single joint region, making it unclear how to split the region into individual sources. Alternativ ely , using a regression formulation, a prediction region could be defined as a fixed 2D geometric shape centered at ˆ p k (e.g., a circle or a square). Howe ver , this would impose an unrealistic assumption that the likelihood landscape follows a particular geometric structure. A MC occurs whene ver the true DO A p ∗ i,k is not included in the associated prediction region. Formally , for the k -th source, define the exchangeable random variables L MC i,k : Λ MC k → { 0 , 1 } for i = 1 , . . . , n + 1 , L MC i,k ( λ k ) = 1 p ∗ i,k / ∈ C λ k ( ˆ p i,k ) . (20) The corresponding empirical MC risk is b R MC n,k ( λ k ) = 1 n n X i =1 L MC i,k ( λ k ) , k = 1 , . . . , K . (21) For each source k , we aim to construct C ˆ λ k that guarantees the MC risk on unseen data is at most α , namely E L MC n +1 ,k ( ˆ λ k ) ≤ α, k = 1 , . . . , K . (22) In this setting, smaller thresholds produce larger prediction regions: for any λ 1 < λ 2 , C λ 2 ⊆ C λ 1 , implying L ( λ 1 ) ≤ L ( λ 2 ) since the MC loss can only decrease as regions expand. Therefore, L ( λ ) is monotone non-decreasing in λ and bounded by 1, satisfying the requirements of the CRC Theorem (1), up to reversed monotonicity relation. Accordingly , we obtain the following CRC selection rule for Algorithm 2 Construction of the prediction regions C λ ( ˆ p ) Input: Predicted DOA ˆ p ; likelihood map Φ( p ) ; threshold λ Output: prediction region C λ ( ˆ p ) 1: Initialize C λ ( ˆ p ) ← { ˆ p } 2: Initialize a queue Q ← [ ˆ p ] 3: while Q is not empty do 4: Pop a point p ′ from Q 5: for each grid point p ∈ G adjacent to p ′ do 6: if p / ∈ C λ ( ˆ p ) and Φ( p ) ≥ λ then 7: Add p to C λ ( ˆ p ) 8: Push p to Q 9: end if 10: end f or 11: end while 12: return C λ ( ˆ p ) ˆ λ k (in re verse direction relativ e to (14)): ˆ λ k = sup n λ k ∈ Λ MC k : b R MC n,k ( λ k ) ≤ α − 1 − α n o . (23) This establishes our ‘CRC-SSL-N’ framework, denoting CRC for SSL in the known source count setting. Finally , we define the (relativ e) Prediction Area (P A) incurred by source k ∈ { 1 , . . . , K } for samples i = 1 , . . . , n + 1 as L P A i,k ( λ k ) = C λ k ( ˆ p i,k ) |G | , (24) where |C λ k ( ˆ p i,k ) | denotes the area of the prediction region on the likelihood map, whose total spatial support is |G | . The ov erall empirical P A is gi ven by b R P A n,k ( λ k ) = 1 n n X i =1 L P A i ( λ k ) , (25) where small areas correspond to confident predictions, and vice versa, thereby directly quantifying predictive uncertainty . B. Unknown-source Count Assuming that the true number of sources K is unknown but satisfies 1 ≤ K ≤ K max , we denote by { p ∗ i, 1 , . . . , p ∗ i,K } the (unordered) true source DOAs of the i -th sample. JOURNAL OF L A T E X CLASS FILES, VOL. 14, NO. 8, A UGUST 2021 7 Follo wing Algorithm 1, for each sample and every threshold β ∈ Λ MD , the number of estimated sources is b K i ( β ) = max n k : Φ ( j ) i ( ˆ p i,j ) ≥ β , ∀ j ≤ k o , (26) with the conv ention that b K i ( β ) = 0 if the set is empty . In this setting, we introduce additional loss functions aimed at reliably identifying the exact number of sources, depending on the threshold β . W e define the Mis-Detection (MD) loss that quantifies the number of undetected sources. Let Λ = Λ MC 1 × · · · × Λ MC K max × Λ MD denote an augmented configuration space, and define the sequence of random variables L MD i : Λ → { 0 , . . . , K } for i = 1 , . . . , n + 1 , counting the number of missed sources among the K true sources L MD i ( λ ) = max n 0 , K − b K i ( β ) o (27) In addition, we define the False Alarm (F A) loss as the sequence of random variables L F A i : Λ → { 0 , . . . , K max − K } for i = 1 , . . . , n + 1 counting the number of spurious peaks among the detected sources L F A i ( λ ) = max n 0 , b K i ( β ) − K o . (28) Accordingly , we refine the definition of the MC loss since measuring coverage is meaningful only for true detected sources. Thus, we consider only predicted peaks whose likeli- hood exceeds the detection threshold β . For a gi ven threshold configuration λ , the MC loss for the k -th source is defined as L MC i,k ( λ ) = 1 n p ∗ i,k / ∈ C λ k ˆ p i,k ∧ Φ ( k ) i ( ˆ p i,k ) ≥ β o , (29) and the overall MC loss is obtained by summing ov er all true detected sources L MC i λ = min { K, b K i ( β ) } X k =1 L MC i,k λ . (30) The P A loss of the i -th sample is defined as the av erage area ov er all detected source L P A i λ = 1 b K i ( β ) b K i ( β ) X k =1 1 |G | C λ k ˆ p i,k . (31) For b K i ( β ) = 0 , the loss is set to L P A i ( λ ) = 0 by con vention. W ith loss functions in place, the unknown-source count setting is cast into the following constrained Multi-Objective Optimization (MOO) problem: ˆ λ = arg min λ ∈ Λ R F A ( λ ) , R P A ( λ ) s.t. P R MD ( λ ) ≤ α MD ≥ 1 − δ, P R MC ( λ ) ≤ α MC ≥ 1 − δ. (32) Namely , the goal is to identify configurations ˆ λ ∈ Λ such that, with high probability 1 − δ , the MD and MC risks on unseen data are controlled while minimizing the P A and F A losses. T o ward this end, Pareto-T esting procedure is employed. Giv en a calibration set D cal , it is partitioned into disjoint subsets D cal = D opt ∪ D tst . Using the optimization subset D opt , all four objectiv e functions (both constrained and un- Algorithm 3 PT -SSL-U: Pareto-T esting for SSL, unkno wn K Input: Calibration set D cal ; Discrete configuration set Λ g ; Risk tolerance α = ( α MD , α MC ) ; Error significance δ . Output: Optimal risk controlling set Λ ∗ 1: ( D opt , D tst ) ← S P L I T ( D cal ) // Optimization: 2: { b R x n ( λ ) } x ∈{ MD , MC , F A , P A } , λ ∈ Λ g ← R I S K S ( Λ g , D opt ) 3: Λ par ← P A R E T O { b R x n ( λ ) } x ∈{ MD , MC , F A , P A } , λ ∈ Λ g 4: p opt j ← max x ∈{ MC , MD } p { L x i ( λ j ) } i ∈D opt ; α x , ∀ λ j ∈ Λ par 5: Λ sort ← λ j : j = argsort λ q ∈ Λ par p opt q ▷ Ascending order // Hypothesis T esting: 6: p tst j ← max x ∈{ MC , MD } p ( { L x i ( λ j ) } i ∈D tst ; α x ) , ∀ λ j ∈ Λ sort 7: J ← min 1 ≤ j ≤ | Λ sort | : p tst j > δ ▷ FST procedure 8: ˆ Λ rej ← { λ j : j < J } 9: { b R x n ( λ ) } x ∈{ MD , MC , F A , P A } , λ ∈ ˆ Λ rej ← R I S K S ( ˆ Λ rej , D tst ) 10: Λ ∗ ← P A R E T O { b R x n ( λ ) } x ∈{ F A , P A } , λ ∈ ˆ Λ rej 11: return Λ ∗ constrained) are ev aluated ov er a discretized configuration space Λ g ⊆ Λ . W e recover the Pareto frontier (19) using Algorithm 5 (Appendix A-B), yielding the set Λ par ⊆ Λ g of promising configurations. Using (17), the estimated p -value associated with configuration λ j is computed by p opt j = max x ∈{ MC , MD } p { L x i ( λ j ) } i ∈D opt ; α x (33) Since neither loss function is bounded by 1 , the p - values are ev aluated using the W audby-Smith–Ramdas (WSR) bound [38] defined in (39) (see Appendix A-A). T o identify the rejection set ˆ Λ rej ⊆ Λ sort , MHT procedure is performed on the testing subset D tst . For each configuration λ j ∈ Λ sort , the null hypothesis H j : R MD ( λ j ) > α MD ∨ R MC ( λ j ) > α MC (34) is tested using a p -value p tst j defined analogously to (33), but ev aluated on D tst . The FST procedure is applied, stopping at the first index j such that p tst j > δ , yielding the rejection set ˆ Λ rej . Finally , a secondary filtering step is applied to ˆ Λ rej with respect to the free objective functions (F A and P A) producing the final validated Pareto-optimal set Λ ∗ ⊆ ˆ Λ rej . Algorithm 3 summarizes the complete procedure, termed ‘PT -SSL-U’ (Pareto-T esting for SSL with unknown source count). As Pareto-T esting satisfies (18) by design, e very configuration λ ∈ Λ ∗ simultaneously controls the MC and MD risks with high probability and thus constitutes a plausible solution to (32). A practitioner can then choose any λ ∈ Λ ∗ , for example by minimizing P A, F A, or a weighted combination of the two. V I . E X P E R I M E N TA L S T U DY W e ev aluate the proposed approaches on simulated data as well as real-world recordings, using the classical SRP-PHA T algorithm and the SRP-DNN model to generate 2D spatial JOURNAL OF L A T E X CLASS FILES, VOL. 14, NO. 8, A UGUST 2021 8 likelihood maps. Experiments include div erse reverberation times and varying numbers of sources, under both known and unknown source-count settings. A. Datasets Throughout the experiments, we employ a 12 -element pseudo-spherical microphone array , consistent with the array configuration used in the LOCA T A challenge [39]. Each detected source is characterized by its two-dimensional DO A p i = [ ϕ i , θ i ] T , where ϕ i = 0 and θ i = 0 align with the positi ve z - and x -axes, respectively . The 2D DO A grid is discretized with an angular resolution of 5 ◦ in both dimensions. The SRP-DNN model is trained following [10], using randomized room dimensions, microphone-array positions, rev erberation times, and Signal-to-Noise Ratio (SNR) levels. Below , we describe the data used for calibration and ev alu- ation. All signals are analyzed in the STFT domain using a Hann windo w with 512 frequency bins and 50 % frame o verlap. 1) Synthetic: This dataset is used for both calibration and testing. Clean speech utterances are randomly drawn from the LibriSpeech corpus [40]. RIRs are generated based on the image-source method implemented in [41]. T wo simulated rooms were considered, with reverberation time set to T 60 ∈ { 400 , 700 } ms and fixed dimensions of 6 m × 6 m × 2 . 5 m . The microphone signals are obtained by conv olving each speech signal with the corresponding RIR, while adding Additiv e White Gaussian Noise (A WGN) with SNR of 15 dB . The maximum number of sources is set to K max = 3 , with a minimum inter-source angular separation of 15 ◦ in both azimuth and elev ation. For the kno wn-source count, we use 400 calibration samples and 100 test samples per source-count K ∈ { 1 , . . . , K max } . F or the unknown-source count, we generate 1500 samples ( 500 for each source-count condition K ∈ { 1 , 2 , 3 } ) and partition them into 1200 calibration samples and 300 test samples, allocated equally across the three K values. 2) LOCAT A: W e use real-world speech recordings from the LOCA T A challenge dataset [39] for ev aluation only in the unknown-source count setting. Calibration is carried out using LOCA T A-matched synthetic data (described below). The recordings were collected in a room of size 7 . 1 m × 9 . 8 m × 3 m and a measured rev erberation time of T 60 = 550 ms . W e consider a single ev aluation test set comprising both T ask-1, which contains recordings of a single active source, and T ask-2, which includes scenarios with two static sources. Accordingly , the maximum number of sources is K max = 2 . Due to the limited number of two-source static scenarios in T ask-2, additional samples are generated by mixing single-source recordings from T ask-1. The test set consists of 20 LOCA T A recordings, comprising 10 single-source and 10 two-source scenarios. 3) LOCAT A-Matched Synthetic: This dataset serves two purposes. It is used for calibration prior to ev aluation on real-world LOCA T A recordings, and it acts as a synthetic baseline for comparativ e performance assessment. It mirrors the LOCA T A recording environment with K max = 2 . W e use 400 samples for calibration and optimization in the Pareto- T esting procedure. B. Calibration Pr ocess Giv en a set of true DO As { ( p ∗ i, 1 , . . . , p ∗ i,K ) } n i =1 , a cor- responding acoustic scene is simulated for each realization. The SRP-PHA T or SRP-DNN models are then applied to generate an initial 2D spatial likelihood map Φ i . W e describe the calibration process in each setting. 1) Known-source count: W ith K known, the calibration process tar gets the cov erage metric and is performed separately for each source k ∈ { 1 , . . . , K } . Algorithm 1 is run for exactly K iterations, yielding the estimated directions together with their associated likelihood maps. The calibration set for the k th detected source in the K -source scenario is defined as D ( k ) cal ,K = n (Φ ( k ) i , ˆ p i,k ) , p ∗ i,k o i ∈D cal ,K . (35) For each source k , the threshold space Λ MC k = [0 , 1] is discretized into 100 equally spaced values. Prediction regions C λ k ( ˆ p i,k ) are constructed using Algorithm 2, and the optimal threshold ˆ λ k is selected according to (23). 2) Unknown-source count: Here, we perform joint detec- tion and localization, with the objective of selecting configura- tions ˆ λ = ( ˆ λ 1 , . . . , ˆ λ K max , ˆ β ) that solve the constrained MOO defined in (32). Assume that K i denotes the number of active sources in the i th recording. The corresponding calibration sample consists of K max pairs of predicted source locations and their associated spatial likelihood maps, together with the ground-truth source locations D cal ,K max = n { (Φ ( k ) i , ˆ p i,k ) } K max k =1 , { p ∗ i,k } K i k =1 o i ∈D cal . (36) Similarly to the known-source-count case, for each detected peak, prediction regions are constructed iteratively using Algorithm 2. Since the scale of Φ v aries across recordings due to noise realizations and speech variability , each map is linearly normalized to the interval [0 , 1] . W e define a discrete configuration grid Λ g ⊂ [0 , 1] K max +1 , using N = 15 values per dimension for K max = 3 and N = 35 for K max = 2 , resulting in N K max +1 candidate configurations. Finally , we note that performing calibration on the LOCA T A-matched synthetic dataset and ev aluating on LOCA T A real recordings requires care, as the two are not exchangeable, violating a ke y assumption of CRC and L TT, as discussed in Appendix B-A. This induces a distribution shift in detected peak v alues, as shown in Fig. 4. While methods for handling non-exchangeable settings in CP ha ve been proposed [42], [43], they are beyond the scope of this work. Instead, we adopt a simpler mitigation strategy that aligns the peak likelihood distributions (see Appendix B-A). C. Experiments and P erformance Evaluation W e present the results for each scenario, where metrics are averaged over 100 random splits for optimization (for Pareto-T esting only), calibration, and test sets. 1) Known-source count: In this setting, the objectiv e is to control the MC risk at a prescribed level α MC , as defined in (22), separately for each source k ∈ { 1 , . . . , K } . W e JOURNAL OF L A T E X CLASS FILES, VOL. 14, NO. 8, A UGUST 2021 9 T ABLE I: ‘CRC-SSL-N’ results for known K ∈ { 1 , 2 , 3 } multi-source localization, using SRP-PHA T and SRP-DNN. Localization Method T 60 [ms] α MC K = 1 K = 2 K = 3 Source 1 Source 1 Source 2 Source 1 Source 2 Source 3 MC P A % MC P A % MC P A % MC P A % MC P A % MC P A % SRP-PHA T 400 0.100 0 . 102 0 . 15 0 . 098 0 . 16 0 . 105 18 . 89 0 . 097 0 . 16 0 . 100 4 . 25 0 . 098 57 . 63 0.050 0 . 048 0 . 21 0 . 048 0 . 21 0 . 052 45 . 79 0 . 047 0 . 23 0 . 048 25 . 09 0 . 048 79 . 30 700 0.100 0 . 094 0 . 19 0 . 097 0 . 20 0 . 106 31 . 43 0 . 094 0 . 22 0 . 096 12 . 66 0 . 101 67 . 17 0.050 0 . 048 0 . 30 0 . 049 0 . 29 0 . 052 61 . 57 0 . 047 0 . 28 0 . 048 45 . 69 0 . 048 85 . 58 SRP-DNN 400 0.100 0 . 097 0 . 09 0 . 092 0 . 09 0 . 101 0 . 15 0 . 096 0 . 09 0 . 098 0 . 12 0 . 101 1 . 62 0.050 0 . 052 0 . 12 0 . 044 0 . 12 0 . 051 0 . 19 0 . 045 0 . 13 0 . 047 0 . 17 0 . 049 12 . 17 700 0.100 0 . 097 0 . 12 0 . 093 0 . 12 0 . 098 0 . 19 0 . 098 0 . 11 0 . 093 0 . 17 0 . 098 3 . 87 0.050 0 . 047 0 . 17 0 . 049 0 . 18 0 . 051 0 . 29 0 . 050 0 . 14 0 . 045 0 . 23 0 . 048 13 . 81 consider significance levels α MC ∈ { 0 . 1 , 0 . 05 } , corresponding to target cov erage lev els of 90% and 95% , respectiv ely . T able I summarizes the results obtained by applying CRC to spatial likelihood maps generated by SRP-PHA T and SRP-DNN. For both methods, the empirical cov erage closely matches the prescribed nominal lev els across all source counts and room conditions. A consistent trend is observed whereby higher target coverage (from 90% to 95% ) and larger T 60 values lead to systematically larger regions, reflecting increased uncertainty under stricter reliability requirements and more challenging acoustic conditions. This effect is most pronounced for SRP-PHA T. While the first detected source is localized with high confidence and compact regions, later detected sources show expanding prediction regions as rev erberation increases, indicating a substantial loss of local- ization certainty . In contrast, SRP-DNN exhibits more stable behavior: prediction regions remain largely compact, with only mild growth as coverage lev el and reverberation increase. Even in challenging multi-source settings, region expansion is limited, highlighting SRP-DNN’ s robustness to rev erberation and source interference and its ability to maintain low localization uncertainty under stricter coverage requirements. Fig. 2 shows the cov erage regions obtained with the CRC method applied to SRP-DNN likelihood maps for K ∈ { 1 , 2 , 3 } activ e sources under T 60 = 700 ms and SNR = 15dB . The dominant source in each case has the strongest energy and an estimated DOA very close to the ground truth, yielding a highly compact prediction region. In contrast, the third source in the K = 3 scenario receiv es a noticeably larger region, despite appearing well localized in this sample, reflecting its weaker energy and the influence of residual errors from earlier source removals. Additional experimental results are pro vided in Appendix B. In Appendix B-B, the CRC procedure is applied jointly across all room settings (i.e., different rev erberation le vels), rather than on a per-room basis. This strategy is particularly relev ant when only limited calibration data are available per room, or when the target room conditions are unkno wn and cannot be matched to a specific calibration set. In Appendix B-C, the CRC method is replaced by the Pareto-T esting procedure in the known source-count setting, providing stronger perfor- mance guarantees with high probability . 2) Unknown-source count: Performance is ev aluated at δ = 0 . 1 with risk tolerances α MC = α MD = 0 . 1 . After calibration, we select, among all feasible solutions in Λ ∗ , the configuration that minimizes the F A objective. Next, Algorithm 1 is run on the test set with the selected detection threshold β TH = ˆ β , and prediction regions are constructed for each detected source us- ing Algorithm 2 and the selected thresholds ( ˆ λ 1 , . . . , ˆ λ K max ) . W e report both the empirical average of each objective across trials, as well as, the risk violation rates P MC and P MD , defined as the percentage of trials (i.e. dif ferent data splits) in which the corresponding risk exceeds its prescribed limit α MC and α MD , respecti vely , which should remain below δ . T able II reports the results for both the synthetic and LOCA T A datasets. For the synthetic data, we achie ve simul- taneous control of the MC and MD risks, i.e., the proportion of trials in which b R MC ( ˆ λ ) > α MC or b R MD ( ˆ λ ) > α MD remains below δ . This confirms that the theoretical guarantees of our framew ork hold across different acoustic scenes and model types. Both methods, howe ver , are conservati ve relativ e to the nominal risk targets when compared to CRC, as Pareto-T esting provides high-probability control over two risks, whereas CRC enforces control in expectation over a single risk. Moreov er , compared to SRP-PHA T, SRP-DNN produces more distinct peaks, leading to lower F A rates and smaller P As. Similarly to the synthetic dataset, for the LOCA T A dataset both MD and MC risks are simultaneously controlled, albeit at more conservati ve lev els, likely due to residual distrib ution shift effects discussed in Appendix B-A. In addition, since lar ge calibration datasets are often dif ficult to obtain, we study the impact of the calibration set size on the performance by comparing n cal ∈ { 600 , 900 , 1200 } , with n cal = 1200 used in the main results. Fig. 3 summarizes the results. For all calibration sizes, both MC and MD risks remain properly controlled. With n cal = 600 , the proportion of the points exceeding the risk thresholds is generally smaller than for n cal = 1200 , indicating more conservati ve behavior with fewer calibration samples. As n cal decreases, the mean F A and P A increase slightly but remain largely stable, suggesting that using smaller calibration sets is acceptable. Howe ver , their distributions become more dispersed, reflecting increased v ariance due to reduced calibration data. JOURNAL OF L A T E X CLASS FILES, VOL. 14, NO. 8, A UGUST 2021 10 Fig. 2: ‘CRC-SSL-N’ prediction regions applied to SRP-DNN likelihood maps at 90 % (top) and 95 % (bottom) cov erage, for T 60 = 700 ms, and SNR = 15 dB. Blue and red Xs mark true and detected sources, respectiv ely , ordered by detection. Brighter colors indicate higher likelihood. Regions expand adaptively along likelihood contours rather than fixed geometric shapes. T ABLE II: ‘PT -SSL-U’ results, with MC and MD controlled at α MC = α MD = 0 . 1 with significance lev el δ = 0 . 1 . Dataset K max T 60 [ms] SRP-PHA T SRP-DNN P MC MC P MD MD F A P A% P MC MC P MD MD F A P A% Synthetic 3 400 0 . 09 0 . 06 0 . 08 0 . 07 0 . 28 15 . 60 0 . 08 0 . 07 0 . 09 0 . 06 0 . 19 0 . 41 700 0 . 09 0 . 08 0 . 07 0 . 07 0 . 33 19 . 18 0 . 07 0 . 07 0 . 06 0 . 07 0 . 26 0 . 51 LOCA T A 2 550 0 . 03 0 . 05 0 . 09 0 . 06 0 . 26 10 . 20 0 . 05 0 . 05 0 . 09 0 . 05 0 . 02 0 . 25 Synthetic 0 . 07 0 . 07 0 . 09 0 . 07 0 . 35 6 . 10 0 . 08 0 . 08 0 . 04 0 . 06 0 . 08 0 . 33 Fig. 3: ‘PT -SSL-U’ results for varying calibration-set sizes with risk tolerances α MC = α MD = 0 . 1 (dashed lines) and significance le vel δ = 0 . 1 . T op: SRP-PHA T. Bottom: SRP-DNN. V I I . C O N C L U S I O N In this work, we presented frame works that provide finite- sample guarantees for UQ in SSL. For the kno wn-source case, we employed CRC to construct prediction regions with controlled MC. For the unknown-source scenario, we used Pareto-T esting to obtain a statistically efficient risk-controlling configuration selection with simultaneous control of MC and MD, while encouraging minimal F A and smallest P As among admissible configurations. Experiments on both synthetic and real-world recordings demonstrate that these guarantees are reliably maintained across div erse acoustic conditions and models. Overall, the proposed frameworks offer a practical and statistically principled approach to provide calibrated reliability for SSL systems. A P P E N D I X A M A T H E M A T I C A L D E TA I L S A. Computation of V alid p -V alues A con venient way to compute p -v alues is through concentra- tion inequalities, but their tightness depends on the underlying loss function. For binary loss functions (e.g, MC defined in (30)), the Binomial tail bound is tight. For loss function bounded in [0 , 1] , the Hoef fding–Bentkus (HB) bound [33] provides finite-sample guarantees with strong empirical effecti veness, but for more general loss functions it yields valid p -values only asymptotically . Moreover , HB does not adapt JOURNAL OF L A T E X CLASS FILES, VOL. 14, NO. 8, A UGUST 2021 11 Algorithm 4 WSR P -V alue Evaluation Input: Collection of n i.i.d. random v ariables L i ∈ [ A, B ] ; error significance δ ; risk tolerance α . Output: V alid p -value for the null hypothesis H : b R n > α 1: for i = 1 , . . . , n do 2: ˆ µ i ← 1 2 + P i j =1 L j 1 + i 3: ˆ σ 2 i ← 1 4 + P i j =1 ( L t − ˆ µ t ) 2 1 + i 4: ν i ← min 1 B − A , r 2 log(1 /δ ) n ˆ σ 2 i − 1 5: K i ← i Y t =1 1 − ν t ( L t − α ) 6: end for 7: p ← min i =1 ,...,n 1 K i . 8: return p to the (unkno wn) loss variance, leading to a loose bound. The WSR bound [38], originally developed for random variables supported on [0 , 1] , adapts to the empirical variance and can be seamlessly extended to arbitrary finite intervals [ A, B ] [34]. For completeness, we outline the deri vation of v alid p -v alues based on the WSR bound. Let L i ( λ ) ∈ [0 , 1] , i = 1 , . . . , n , be i.i.d. random variables, and consider testing the null hypothe- sis R ( λ ) > α . Under the paradigm of testing-by-betting [44], sequential bets are placed against the null, and substantial growth of the resulting capital serves as evidence against it. Define the capital process, initialized at unit wealth, by K i ( λ , α ) = i Y t =1 1 − ν t L t ( λ ) − α , i = 1 , . . . , n, (37) where ν t denotes the betting strategy , which depends on past loss observ ations L 1 ( λ ) , . . . , L t − 1 ( λ ) and error significance δ . Under H 0 , the process {K i } is a nonnegati ve supermartingale with E [ K i ] ≤ 1 . By V ille’ s inequality [45] it follows that P max i =1 ,...,n K i ( λ , α ) ≥ 1 δ ≤ δ. (38) Thus, under H 0 and for any betting strategy , the probability that the capital process ever exceeds 1 /δ is at most δ . Thus, observing K i ( λ , α ) ≥ 1 /δ for some i constitutes strong evidence against H 0 and justifies its rejection at lev el δ . Since V ille’ s inequality in (38) can be expressed as P min i 1 K i ( λ ,α ) ≤ δ ≤ δ , the corresponding p -value is p ( λ , α ) = min i =1 ,...,n 1 K i ( λ , α ) . (39) Algorithm 4 summarizes the procedure for computing WSR p -values, following [34]. B. Recovering the P ar eto Optimal F r ont Algorithm 5 describes the filtering procedure used to recov er the Pareto-optimal set. Algorithm 5 Recover Pareto-Optimal Set Input: Discrete space Λ g ; Objectiv e functions {R 1 , . . . , R r } Output: Pareto-optimal set Λ par 1: Λ o ← Λ g 2: for λ ∈ Λ g do 3: if ∃ λ ′ ∈ Λ g \ { λ } s . t . ( ∀ i : R i ( λ ′ ) ≤ R i ( λ )) then 4: Λ o ← Λ o \ { λ } 5: end if 6: end for 7: return Λ par (a) K = 1 , k = 1 (b) K = 1 , k = 2 (noise) (c) K = 2 , k = 1 (d) K = 2 , k = 2 Fig. 4: Estimated PDFs of β peak values for K max = 2 . A P P E N D I X B A D D I T I O NA L E X P E R I M E N TA L D E TA I L S & R E S U L T S A. Mitigating Simulation–Real Distribution Shifts Despite closely matching the acoustic conditions of the LOCA T A-matched synthetic dataset used for calibration with those of the real-world LOCA T A recordings used for testing, a noticeable distribution shift persists in the detected peak statistics, as shown in Fig. 4. Although non-exchangeablity remains, we partially mitigate this shift using an affine trans- formation that preserves the spatial structure of the likelihood map. Specifically , the i -th calibration map is normalized as ˜ Φ ( k ) i = Φ ( k ) i − q 0 . 5 D Φ cal q 0 . 99 D Φ cal − q 0 . 5 D Φ cal . (40) where q τ ( · ) denotes the τ -quantile and D Φ cal = { Φ ( k ) i } K max k =1 } i ∈D cal . An analogous normalization is applied to the test likelihood maps using the test set statistics. As illustrated in Fig. 4, this normalization substantially improv es alignment between the calibration and test distrib utions. B. MC Risk Contr ol Acr oss Multiple Rooms Controlling the MC risk simultaneously across multiple rooms is important for practical deployment, as acoustic conditions v ary and per -room recalibration is often impractical. T o allow robustness to such variability , we employ unified calibration and test sets spanning multiple room conditions. JOURNAL OF L A T E X CLASS FILES, VOL. 14, NO. 8, A UGUST 2021 12 T ABLE III: ‘CRC-SSL-N’ controlled simultaneously across multiple rooms ( T 60 ∈ { 400 , 550 , 700 } ms, SNR = 15 dB). α MC K = 1 K = 2 K = 3 Source 1 Source 1 Source 2 Source 1 Source 2 Source 3 MC P A % MC P A % MC P A % MC P A % MC P A % MC P A % SRP- PHA T 0.100 0 . 098 0 . 18 0 . 099 0 . 18 0 . 101 27 . 15 0 . 095 0 . 19 0 . 101 8 . 26 0 . 097 63 . 68 0.050 0 . 047 0 . 27 0 . 045 0 . 25 0 . 050 55 . 66 0 . 043 0 . 27 0 . 051 37 . 78 0 . 049 80 . 82 SRP- DNN 0.100 0 . 094 0 . 10 0 . 096 0 . 11 0 . 097 0 . 17 0 . 091 0 . 10 0 . 093 0 . 15 0 . 103 2 . 78 0.050 0 . 051 0 . 14 0 . 046 0 . 14 0 . 045 0 . 25 0 . 042 0 . 13 0 . 046 0 . 20 0 . 047 13 . 64 T ABLE IV: ‘PT -SSL-N’ results in known-source count. α MC = δ = 0 . 1 . T 60 [ms] SRP-PHA T SRP-DNN K = 1 K = 2 K = 3 K = 1 K = 2 K = 3 P MC P A% P MC P A% P MC P A% P MC P A% P MC P A% P MC P A% 400 0.08 0.31 0.10 23.19 0.05 44.80 0.09 0.12 0.06 0.22 0.05 5.07 700 0.10 0.32 0.10 35.20 0.04 54.20 0.10 0.16 0.10 0.32 0.08 5.69 Specifically , the calibration and test sets comprise three sim- ulated rooms with fixed dimensions and constant SNR, while varying the rev erberation time T 60 ∈ { 400 , 550 , 700 } ms. The results are reported in T able III. As shown, the empirical cov erage remains very close to the nominal le vel across all source counts, indicating effecti ve control of MC risk under heterogeneous acoustic conditions. The P A falls reasonably between the values obtained for T 60 = 400 ms and T 60 = 700 ms reported in T able I. Note, howe ver , that this approach provides only marginal coverage guarantees over the mixture distribution of rooms, whereas room-specific calibration yields cov erage guarantees tailored to each setup individually . C. P ar eto-T esting for known-source count W e propose an alternativ e to the ‘CRC-SSL-N’ framew ork of Section V -A using Pareto-T esting, as in the unknown source count case; we refer to this variant as ‘PT -SSL-N’. The goal is to select a configuration λ = ( λ 1 , . . . , λ K ) by solving the following constrained optimization problem ˆ λ = arg min λ ∈ Λ R P A ( λ ) s.t. P R MC ( λ ) ≤ α MC ≥ 1 − δ, (41) where Λ = Λ MC 1 × · · · × Λ MC K . Here, we aggregate the MC and P A measures across sources, in contrast to CRC, where they are defined per source. Note also that while both approaches aim to control the MC risk at level α MC , Pareto- T esting provides high-probability guarantees, whereas CRC ensures risk control only in expectation, as formalized in The- orem (1). Results for the Pareto-T esting approach are reported in T able IV. The nominal cov erage lev el is never violated across re verberation times or localization methods. Compared to the CRC results in T able I, Pareto-T esting yields more conservati ve MC control and slightly larger P As, reflecting the stronger (high-probability) guarantees it enforces. R E F E R E N C E S [1] C. Rascon and I. Meza, “Localization of sound sources in robotics: A revie w , ” Robotics and Autonomous Sys- tems , v ol. 96, pp. 184–210, 2017. [2] J. Benesty , “ Adapti ve eigen value decomposition algo- rithm for passi ve acoustic source localization, ” J . Acous- tical Society of America , vol. 107, pp. 384–391, 2000. [3] M. I. Mandel, R. J. W eiss, and D. P . W . Ellis, “Model- based expectation-maximization source separation and localization, ” IEEE T ransactions on Audio, Speech, and Language Pr ocessing , vol. 18, no. 2, pp. 382–394, 2010. [4] J. H. DiBiase, H. F . Silverman, and M. S. Brand- stein, “Robust localization in reverberant rooms, ” in Micr ophone arrays: signal pr ocessing techniques and applications , Springer, 2001, pp. 157–180. [5] O. Schwartz and S. Gannot, “Speaker tracking using recursiv e EM algorithms, ” IEEE/A CM T ransactions on Audio, Speec h, and Languag e Pr ocessing , vol. 22, no. 2, pp. 392–402, 2013. [6] R. O. Schmidt, “Multiple emitter location and signal parameter estimation, ” IEEE T ransactions on Antennas and Pr opagation , vol. 34, no. 3, pp. 276–280, 1986. [7] R. Roy and T . Kailath, “ESPRIT-estimation of signal parameters via rotational in variance techniques, ” IEEE T ransactions on Acoustics, Speech and Signal Pr ocess- ing , v ol. 37, no. 7, pp. 984–995, 1989. [8] P .-A. Grumiaux, S. Kiti ´ c, L. Girin, and A. Gu ´ erin, “A surve y of sound source localization with deep learning methods, ” The Journal of the Acoustical Society of America , v ol. 152, no. 1, pp. 107–151, 2022. [9] J. M. V era-Diaz, D. Pizarro, and J. Macias-Guarasa, “T o wards Domain Independence in CNN-based Acous- tic Localization using Deep Cross Correlations, ” in 28th Eur opean Signal Pr ocessing Confer ence (EUSIPCO) , 2021, pp. 226–230. [10] B. Y ang, H. Liu, and X. Li, “SRP-DNN: Learn- ing Direct-Path Phase Difference for Multiple Mov- ing Sound Source Localization, ” in IEEE International Confer ence on Acoustics, Speech and Signal Pr ocessing (ICASSP) , 2022, pp. 721–725. [11] E. Grinstein, T . V an W aterschoot, M. Brookes, and P . A. Naylor, “The Neural-SRP Method for Positional Sound Source Localization, ” in 57th Asilomar Confer ence on Signals, Systems, and Computers , 2023, pp. 1318–1323. [12] B. Shaybet, V . T ourbabin, and B. Rafaely, “SRP-PHA T -NET : A Reliability-Driv en DNN for Rev erberant Speaker Localization, ” arXiv pr eprint arXiv:2510.22682 , 2025. [13] S. Chakrabarty and E. A. P . Habets, “Multi-Speaker DO A Estimation Using Deep Conv olutional Networks T rained W ith Noise Signals, ” IEEE Journal of Selected T opics in Signal Processing , vol. 13, pp. 8–21, 2019. [14] R. Pi and X. Y u, “Uncertainty Estimation for Sound Source Localization With Deep Learning, ” IEEE T rans- actions on Instrumentation and Measurement , vol. 74, pp. 1–12, 2025. [15] A. Gammerman, V . V ovk, and V . V apnik, “Learning by transduction, ” in Pr oceedings of the F ourteenth Con- fer ence on Uncertainty in Artificial Intelligence (U AI) , vol. 14, 1998, pp. 148–155. [16] V . V ovk, A. Gammerman, and G. Shafer, Algorithmic learning in a random world . Springer, 2005. JOURNAL OF L A T E X CLASS FILES, VOL. 14, NO. 8, A UGUST 2021 13 [17] A. N. Angelopoulos, R. F . Barber, and S. Bates, “The- oretical foundations of conformal prediction, ” arXiv pr eprint arXiv:2411.11824 , 2024. [18] I. D. Khurjekar and P . Gerstoft, “Uncertainty quantifica- tion for direction-of-arriv al estimation with conformal prediction, ” The Journal of the Acoustical Society of America , v ol. 154, no. 2, pp. 979–990, 2023. [19] B. Laufer-Goldshtein, R. T almon, and S. Gannot, “Semi-Supervised Source Localization on Multiple- Manifolds with Distrib uted Microphones, ” IEEE/ACM T ransactions on Audio, Speech, and Language Pr ocess- ing , v ol. 25, no. 7, pp. 1477–1491, 2017. [20] V . Rozenfeld and B. L. Goldshtein, “Conformal Pre- diction for Manifold-based Source Localization with Gaussian Processes, ” in IEEE International Confer ence on Acoustics, Speech and Signal Pr ocessing (ICASSP) , 2025, pp. 1–5. [21] O. Michael and B. Laufer -Goldshtein, “Semi-supervised gnn for sound source localization with prediction inter- vals, ” in IEEE International Confer ence on Acoustics, Speech, and Signal Pr ocessing (ICASSP) , 2026, pp. 1–5. [22] R. F . Barber , E. J. Candes, A. Ramdas, and R. J. T ibshirani, “Predictive inference with the Jackknife+, ” The Annals of Statistics , vol. 49, pp. 486–507, 2021. [23] I. D. Khurjekar and P . Gerstoft, “Multi-source doa estimation with statistical cov erage guarantees, ” in IEEE International Confer ence on Acoustics, Speech and Sig- nal Pr ocessing (ICASSP) , 2024, pp. 5310–5314. [24] L. W ang, T .-K. Hon, J. D. Reiss, and A. Cavallaro, “An Iterativ e Approach to Source Counting and Localization Using T wo Distant Microphones, ” IEEE/ACM T rans- actions on Audio, Speech, and Language Pr ocessing , vol. 24, no. 6, pp. 1079–1093, 2016. [25] A. Brutti, M. Omologo, and P . Svaizer, “Multi- ple source localization based on acoustic map de- emphasis, ” EURASIP Journal on Audio, Speech, and Music Pr ocessing , vol. 2010, no. 1, p. 147 495, 2010. [26] D. Diaz-Guerra and J. R. Beltran, “Source cancellation in cross-correlation functions for broadband multisource doa estimation, ” Signal Pr ocessing , p. 107 442, 2020. [27] A. N. Angelopoulos, S. Bates, M. Jordan, and J. Malik, “Uncertainty Sets for Image Classifiers using Confor- mal Prediction, ” in The Ninth International Confer ence on Learning Representations (ICLR) , 2021. [28] J. Silv a-Rodr ´ ıguez, I. Ben A yed, and J. Dolz, “Con- formal Prediction for Zero-Shot Models, ” in Computer V ision and P attern Recognition Confer ence (CVPR) , 2025, pp. 19 931–19 941. [29] A. Fisch, T . Schuster, T . S. Jaakkola, and R. Barzilay, “Efficient Conformal Prediction via Cascaded Inference with Expanded Admission, ” in The T enth International Confer ence on Learning Representations, (ICLR) , 2021. [30] V . Quach et al., “Conformal Language Modeling, ” in The T welfth International Conference on Learning Rep- r esentations (ICLR) , 2024. [31] H. Papadopoulos, K. Proedrou, V . V ovk, and A. Gam- merman, “Inductive confidence machines for regres- sion, ” in Machine Learning: Eur opean Conference on Machine Learning (ECML) , 2002, pp. 345–356. [32] A. Angelopoulos, S. Bates, A. Fisch, L. Lei, and T . Schuster , “Conformal Risk Control, ” in The T welfth International Conference on Learning Repr esentations (ICLR) , 2024. [33] S. Bates, A. Angelopoulos, L. Lei, J. Malik, and M. Jor- dan, “Distribution-free, risk-controlling prediction sets, ” Journal of the ACM , vol. 68, no. 6, pp. 1–34, 2021. [34] B.-S. Einbinder, L. Ringel, and Y . Romano, “Semi- supervised risk control via prediction-powered infer- ence, ” IEEE T ransactions on P attern Analysis and Ma- chine Intelligence , vol. 47, no. 12, pp. 11 080–11 090, 2025. [35] A. N. Angelopoulos, S. Bates, E. J. Cand ` es, M. I. Jordan, and L. Lei, “Learn then test: Calibrating predic- tiv e algorithms to achie ve risk control, ” The Annals of Applied Statistics , vol. 19, no. 2, pp. 1641–1662, 2025. [36] B. Laufer-Goldshtein, A. Fisch, R. Barzilay , and T . S. Jaakkola, “Efficiently Controlling Multiple Risks with Pareto T esting, ” in The Eleventh International Confer- ence on Learning Representations (ICLR) , 2023. [37] M. Lindauer et al., “SMA C3: A versatile Bayesian optimization package for hyperparameter optimization, ” Journal of Machine Learning Researc h , vol. 23, no. 54, pp. 1–9, 2022. [38] I. W audby-Smith and A. Ramdas, “V ariance-adaptive confidence sequences by betting, ” arXiv preprint arXiv:2010.09686 , 2020. [39] H. W . L ¨ ollmann et al., “The LOCA T A challenge data corpus for acoustic source localization and tracking, ” in 2018 IEEE 10th sensor array and multichannel signal pr ocessing workshop (SAM) , 2018, pp. 410–414. [40] V . Panayotov , G. Chen, D. Povey, and S. Khudanpur , “Librispeech: An ASR corpus based on public do- main audio books, ” in IEEE international conference on acoustics, speech and signal pr ocessing (ICASSP) , 2015, pp. 5206–5210. [41] D. Diaz-Guerra, A. Miguel, and J. R. Beltran, “gpuRIR: A python library for room impulse response simulation with GPU acceleration, ” Multimedia T ools and Appli- cations , v ol. 80, no. 4, pp. 5653–5671, 2021. [42] R. J. Tibshirani, R. Foygel Barber, E. Candes, and A. Ramdas, “Conformal prediction under cov ariate shift, ” Advances in neural information pr ocessing systems (NeurIPS) , v ol. 32, 2019. [43] A. Farinhas, C. Zerva, D. Ulmer, and A. Martins, “Non- exchangeable conformal risk control, ” in The T welfth International Conference on Repr esentation Learning (ICLR) , 2024. [44] A. Ramdas and R. W ang, “Hypothesis T esting with E- values, ” F oundations and T r ends® in Statistics , vol. 1, no. 1-2, pp. 1–390, 2025, I S S N : 2978-4212. [45] J. L. Doob, “Jean ville, ´ etude critique de la notion de collectif, ” 1939.
Original Paper
Loading high-quality paper...
Comments & Academic Discussion
Loading comments...
Leave a Comment