Training-free Detection of Generated Videos via Spatial-Temporal Likelihoods
Following major advances in text and image generation, the video domain has surged, producing highly realistic and controllable sequences. Along with this progress, these models also raise serious concerns about misinformation, making reliable detect…
Authors: Omer Ben Hayun, Roy Betser, Meir Yossef Levi
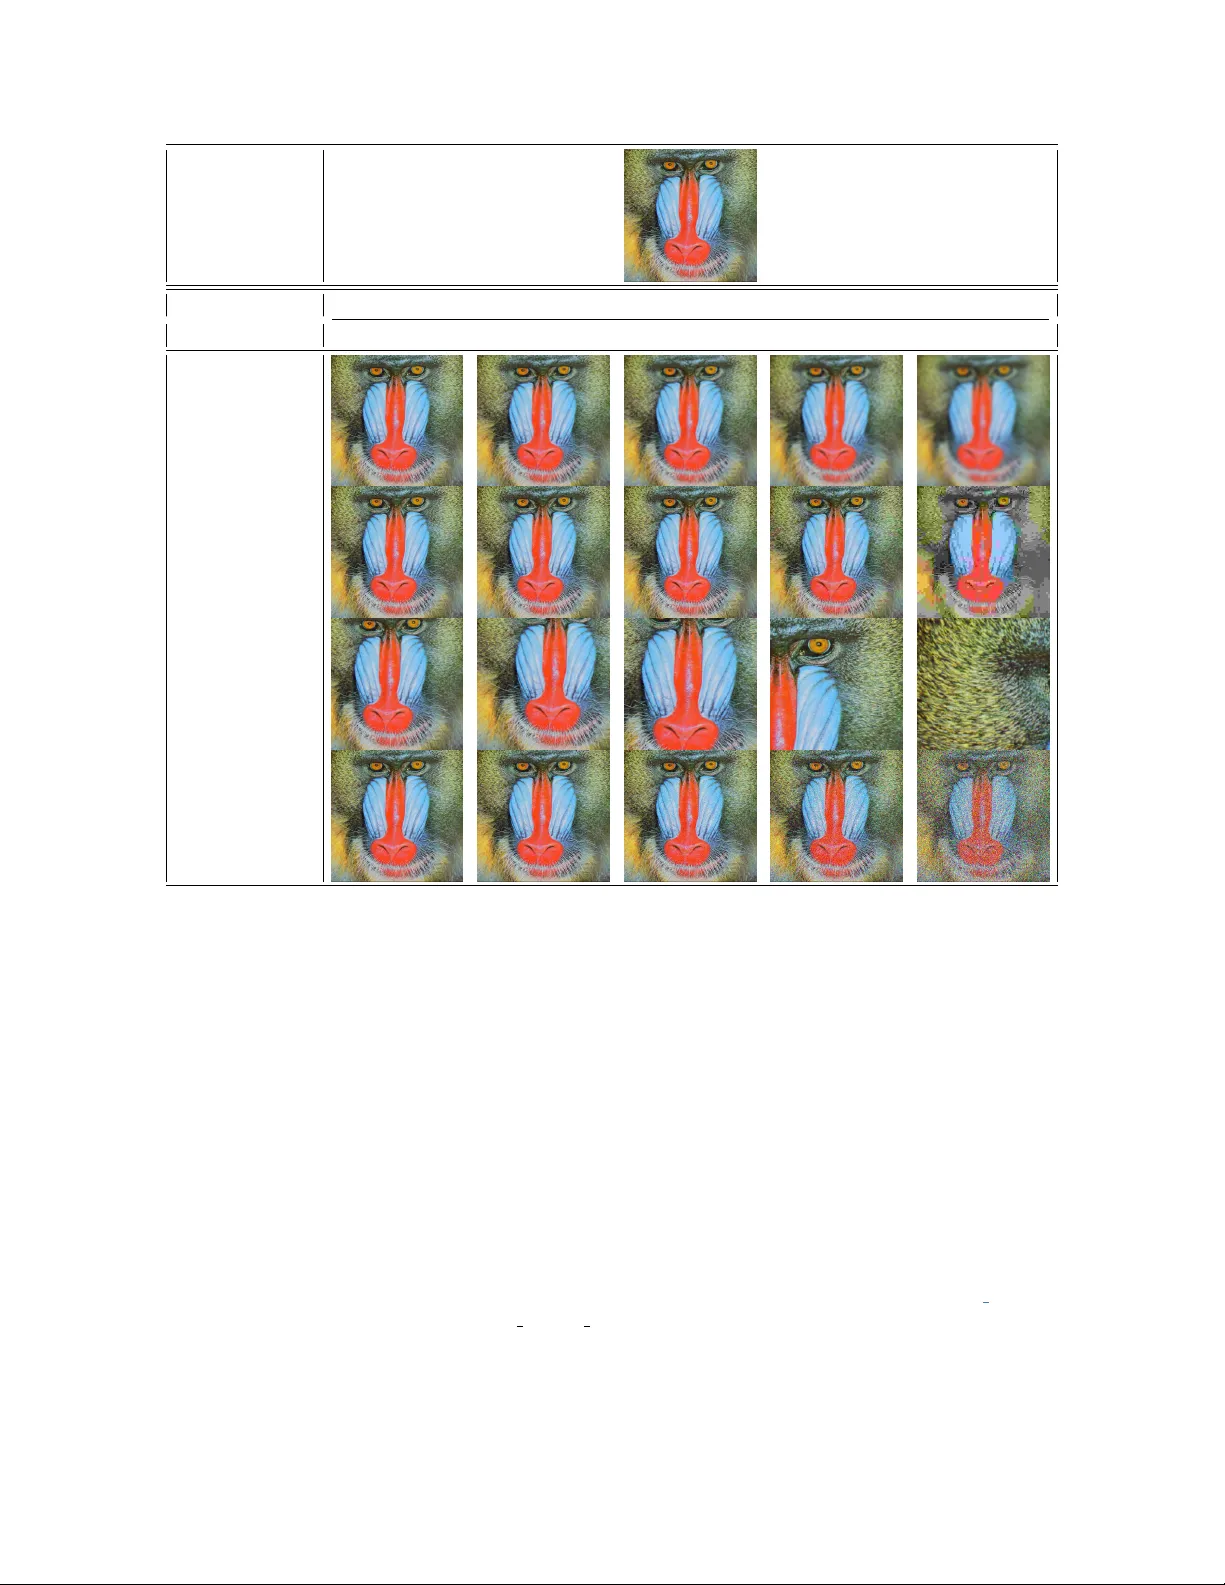
T raining-fr ee Detection of Generated V ideos via Spatial-T emporal Likelihoods Omer Ben Hayun, Roy Betser , Meir Y ossef Le vi, Levi Kassel, Guy Gilboa T echnion – Israel Institute of T echnology , Haifa, Israel { omerben,roybe,me.levi,kassellevi } @campus.technion.ac.il; guy.gilboa@ee.technion.ac.il Figure 1. Spatio-temporal likelihoods per video. Blue: real; red: fake (ComGenV id). Joint spatio-temporal likelihoods clearly separate real and fake videos; e xamples illustrate high/low spatial likelihood (frame realism) and temporal likelihood (motion naturalness). Abstract F ollowing major advances in text and image generation, the video domain has sur ged, pr oducing highly r ealistic and contr ollable sequences. Along with this pr ogr ess, these models also raise serious concerns about misinformation, making reliable detection of synthetic videos increasingly crucial. Image-based detectors are fundamentally limited because they operate per frame and ignor e temporal dy- namics, while supervised video detectors generalize poorly to unseen generators, a critical drawbac k given the rapid emer gence of new models. These challenges motivate zer o- shot appr oaches, which avoid synthetic data and instead scor e content a gainst r eal-data statistics, enabling training- fr ee, model-agnostic detection. W e intr oduce ST ALL , a simple, training-fr ee, theoretically justified detector that pr ovides likelihood-based scoring for videos, jointly mod- eling spatial and temporal evidence within a pr obabilistic frame work. W e evaluate ST ALL on two public benchmarks and intr oduce ComGenV id , a new benchmark with state-of- the-art generative models. ST ALL consistently outperforms prior ima ge- and video-based baselines. Code and data ar e available her e . 1. Introduction Generativ e modeling has progressed rapidly across modali- ties, enabling powerful text and image-generation capabili- ties built on lar ge language models and diffusion-based im- age synthesizers [ 17 , 44 , 67 , 69 , 73 ]. After major break- throughs in text and image generation, the video domain has undergone a sharp leap forward in the past few years, with highly realistic, controllable video generation models pro- ducing long, high-fidelity sequences [ 24 , 38 , 78 ]. These ad- vances unlock strong benefits for creativ e workflows, con- tent production, and media automation [ 30 , 74 ]. At the same time, synthetic videos can be misused for misinfor- mation, fraud, impersonation, and intellectual-property vio- lations [ 4 , 43 , 52 ], prompting platforms and regulators to re- quire disclosure of AI-generated content and underscoring the urgenc y of reliable detection [ 49 , 53 ]. Unlike deepfake detection, which focuses on manipulation of real content, we address a different problem: detecting fully generated videos, where ev ery frame is synthetic. In the image domain, early studies mainly relied on su- pervised classifiers, typically CNN-based models trained to distinguish real from synthetic images using large, labeled datasets [ 7 , 11 , 26 ]. While effecti ve on known generators, these methods require continuous retraining as new gener- 1 ativ e models emerge and thus generalize poorly to unseen ones [ 33 ]. T o reduce dependence on synthetic training data, later works explored unsupervised and semi-supervised ap- proaches, leveraging large pretrained models [ 27 , 61 ]. Re- cently , zero-shot image detectors hav e emerged, showing improv ed robustness and generalization [ 14 , 28 , 42 , 68 ]. In this context, zero-shot means no additional training and no generated content avail able. Howe ver , when applied to videos, image detectors assess authenticity only on a per- frame basis. As a result, they ignore temporal dependencies and miss artifacts that emerge across time, such as motion inconsistencies, that are in visible in any single frame. In the video domain, progress has been more limited. Recent methods predominantly use supervised training to detect generated videos [ 5 , 23 , 48 , 76 , 92 ], but they inherit the same limitations as supervised image detectors: they re- quire lar ge labeled datasets and generalize poorly to unseen generators. The first zero-shot detector for generated videos is D3 [ 93 ], introduced only recently . It analyzes transitions between consecuti ve frames and relies solely on temporal cues, while ignoring per -frame visual content and spatial in- formation. Moreover , it lacks principled theoretical founda- tions, relying primarily on empirical hypotheses about real video dynamics. Therefore, a critical gap remains: the need for a mathematically grounded video detector that jointly analyzes spatial content and temporal dynamics. T o address this gap, we introduce ST ALL, a zero-shot video detector that accounts for both spatial and temporal dimensions when determining whether a video is real or generated (see illustration in Figure 1 ). Our method le ver- ages a probabilistic image-domain approach [ 8 ] and uses DINOv3 [ 71 ] to compute image likelihoods. W e extend this approach with a temporal likelihood term that captures the consistency of transitions between frames. Unlike prior approaches that are supervised, rely solely on spatial cues (image detectors), or focus exclusi vely on temporal dynam- ics [ 93 ], our formulation jointly models both aspects and detects inconsistencies that emerge from their interaction (see Figure 2 for qualitati ve examples). ST ALL assumes ac- cess to a collection of real videos in its pre-processing stage, termed the calibration set . W ith the abundance of publicly av ailable videos, this is a very mild requirement. The ap- proach is training-free and requires no access to generated samples from any model. The core of the algorithm is based on a new spatio-temporal likelihood model of real videos. This yields a principled measure of ho w well a video aligns with real-data statistics in space and time. Our method achiev es state-of-the-art performance on two established benchmarks [ 23 , 40 ] and on our newly introduced dataset comprising videos from recent high- performing generators [ 36 , 62 ]. W e curate this dataset to reflect the newest wa ve of high-fidelity video mod- els, enabling ev aluation on frontier systems. The method is lightweight and efficient, operating without training, and is thus suitable for real-time or lar ge-scale screening pipelines. Across all e xperiments, it remains rob ust to com- mon image perturbations, v ariations in frames-per-second (FPS), and ranges of hyperparameter settings. Our main contributions are as follo ws: • T emporal likelihood. W e extend spatial (image-domain) likelihoods to temporal frame-to-frame transitions. • Theory-grounded zero-shot video detector . A detector deriv ed from a well-defined theory , which we empirically validate. This provides a principled, measurable tool for analyzing and debugging edge cases. • State-of-the-art across benchmarks. W e achiev e state- of-the-art results on three challenging benchmarks and perform extensiv e ev aluations demonstrating robustness and consistent performance across settings. • New benchmark. W e release ComGenV id , a curated benchmark featuring recent high-fidelity video generators (e.g., Sora, V eo-3) to support future research. 2. Background and Related w ork Generated image detection. Early work trained supervised CNNs on labeled real and synthetic datasets, sometimes emphasizing hand-crafted artifacts, but generalization to unseen generators was limited [ 6 , 7 , 11 , 33 , 57 , 80 , 85 , 94 ]. Few-shot and semi or unsupervised v ariants improved data efficienc y by lev eraging pretrained features, yet typically retained some dependence on synthetic data or generator assumptions [ 26 , 27 , 61 , 70 , 91 ]. Zero-shot methods avoid synthetic content exposure by comparing an image to trans- formed or reconstructed variants [ 14 , 28 , 42 , 68 ]. Howe ver , these image-only approaches are confined to per -frame spa- tial cues and ignore cross-frame temporal consistency , lea v- ing them blind to anomalies that only manifest in motion or inter-frame transitions. Generated video detection. Unlike deepfakes , which edit real footage (e.g., face swaps or lip-sync), we target fully generated content, where the video is synthesized from scratch. Supervised detectors train on labeled real and synthetic videos and report strong in-domain results but struggle in unseen models regime [ 5 , 76 ]. Recent work also couples ne w benchmarks with architectures: GenV ideo with the DeMamba module [ 23 ]; V ideoFeedback, which also presents V ideoScore (human-aligned automatic scor - ing) [ 40 ]. P arallel efforts explore MLLM-based supervised detectors that provide rationales but still require curated training data and tuning [ 35 , 87 ]. D3, the first zer o-shot video detector , relies on second-order temporal dif ferences, focusing on motion cues [ 93 ]. A similar first-order ap- proach is presented in [ 15 ]. In contrast, our approach is directly probabilistic and jointly scores spatial (per-frame) and temporal (inter-frame) likelihoods, addressing both ap- pearance and dynamics in a single framew ork. 2 Figure 2. Qualitative comparison of ZED, D3, and our method (ST ALL). Each row shows a video clip with natural or unnatural spatial and temporal behavior , together with the corresponding predictions. ZED (spatial-only) misses in cases dominated by temporal inconsistency; D3 (temporal-only) fails when spatial realism is misleading. ST ALL fuses spatial and temporal likelihoods, yielding robust detection when either modality alone is insufficient. Additional examples with more details are gi ven in Supp. D.7. Gaussian embeddings and likelihood approximation. Modern visual encoders such as CLIP [ 66 ] learn high- dimensional embedding spaces with rich semantic struc- ture. Empirical studies have characterized geometric phe- nomena in CLIP representations, including the modal- ity gap , narrow-cone concentration [ 55 ], and a double- ellipsoid structure [ 54 ]. Recent work demonstrates that CLIP embeddings are well-approximated by Gaussian dis- tributions, enabling closed-form image likelihood approx- imation using whitening without additional training [ 10 ]. Whitening has also been shown effecti ve for LLM activ a- tions [ 65 ]. From a theoretical angle, the Maxwell–Poincar ´ e lemma implies that uniform normalized high-dimensional features have approximately Gaussian projections [ 31 ]. This principle has recently been lev eraged to show that the InfoNCE objective asymptotically induces Gaussian struc- ture in learned embeddings [ 9 ]. Motiv ated by both em- pirical evidence and theoretical guarantees, we introduce a normalization step in the temporal embedding space to promote Gaussian statistics and compute f aithful likelihood estimates. Additionally , this Gaussian modeling approach extends to other vision encoders [ 47 , 71 ] and forms the ba- sis of our spatio-temporal video likelihood score. 3. Preliminaries W e now introduce the mathematical tools and notations used throughout the paper . These concepts form the ba- sis of our likelihood formulation and will be applied in the method section (Section 4 ). 3.1. Whitening transf orm and Gaussian likelihood Notation. Let X = { x i } N i =1 ⊂ R d and let X ∈ R d × N be the column-stacked matrix. Define the sample mean µ = 1 N P N i =1 x i and centered vectors ˆ x i = x i − µ , with ˆ X = [ ˆ x 1 , . . . , ˆ x N ] . The empirical cov ariance is Σ = 1 N ˆ X ˆ X ⊤ . Whitening transf orm. W e seek a linear transform W ∈ R d × d that admits: W ⊤ W = Σ − 1 . (1) The whitening matrix is not unique : if W satisfies Equa- tion ( 1 ), then so does RW for an y orthogonal R . A common choice is PCA-whitening. Let the eigen-decomposition be Σ = V Λ V ⊤ with eigen vectors V and eigenv alues Λ = diag( λ 1 , . . . , λ d ) . The PCA-whitening matrix is W PCA = Λ − 1 2 V ⊤ . (2) Giv en a vector x , the whitened representation is y = W ( x − µ ) and the whitened data matrix is Y = W ˆ X . (3) Whitened embeddings ha ve zero mean and identity cov ari- ance. Likelihood approximation. Under the zero-mean and identity-cov ariance properties, if the whitened coordinates follow a Gaussian distribution, then y ∼ N (0 , I d ) . Giv en this isotropic Gaussian model, the log-likelihood is: ℓ ( y ) = log p ( y ) = − 1 2 d log (2 π ) + ∥ y ∥ 2 2 , (4) where ∥ y ∥ 2 2 = y ⊤ y . Given an embedding x , the whitened norm ∥ W ( x − µ ) ∥ 2 2 thus provides a closed-form lik elihood proxy when the Gaussian assumption holds. 3.2. Asymptotic Gaussian projections When vectors are uniformly distributed on the unit sphere in R d , their coordinates behave approximately Gaussian. The 3 Figure 3. Method overview . A video is split into frames and encoded into embeddings. The spatial branch scores the likelihood of each frame embedding; the temporal branch normalizes inter-frame differences and scores their lik elihood analogously . The two scores are then fused into a unified measure that separates AI-generated from real videos. Algorithm 1 ST ALL (Generated video detector) Require: Encoder E , calibration set C , test video v = { f t } T t =1 Calibration (pre-pr ocessing) 1: From C : extract all frames per video, encode { x i,t } . 2: Compute spatial statistics ( µ, W ) ( Equation ( 2 )), using a sin- gle frame per video. 3: Compute the temporal statistics ( µ ∆ , W ∆ ) ( Equation ( 2 )) us- ing all normalized inter-frame dif ferences for each video. 4: Record calibration distributions of s C sp and s C temp . Inference (test-time) 1: Compute x t = E ( f t ) ; for frames { f t } T t =1 of v . 2: y t ← W ( x t − µ ) ; for t ∈ { 1 , · · · , T } 3: z t ← W ∆ x t +1 − x t ∥ x t +1 − x t ∥ − µ ∆ ; for t ∈ { 1 , · · · , T − 1 } 4: s sp ← max ( { ℓ ( y t ) } T t =1 ) ( ℓ ( y t ) computed by Equation ( 4 )). 5: s temp ← min ( { ℓ ( z t ) } T − 1 t =1 ) ( ℓ ( z t ) follows Equation ( 4 )). 6: retur n s video ← 1 2 p erc( s sp ) + p erc( s temp ) . Maxwell-Poincar ´ e lemma [ 31 , 32 ] formalizes this: if u ∼ Unif ( S d − 1 ) , then for each coordinate, √ d u j − − − → d →∞ N (0 , 1) . (5) More generally , for high-dimensional v ectors with nearly uniform directions and concentrated norms, any fixed low- dimensional linear projection is well-approximated by a Gaussian. Supplementary Material (Supp.) Section B.3 de- tails the lemma and con vergence rates. 4. Method: ST ALL W e propose ST ALL ( S patial- T emporal A ggregated L og- L ikelihoods), a zero-shot detector that jointly scores videos via a spatial likelihood over per-frame embeddings and a temporal likelihood over inter-frame transitions. A high- lev el ov erview of the method is shown in Figure 3 , and Al- gorithm 1 summarizes the procedure. Detailed algorithms for all method steps are provided in Supp. Section A.1. Notation. Let C = { c ( i ) } N i =1 denote a collection of videos. A video c ∈ C consists of T frames, written as c = { f t } T t =1 . Each frame f t is mapped to a d -dimensional embedding us- ing a vision encoder E , yielding x t = E ( f t ) ∈ R d . 4.1. Spatial likelihood Prior work [ 8 ] in the image domain observed that whitened CLIP embeddings are well-approximated by standard Gaus- sian coordinates, as verified on MSCOCO [ 56 ], using An- derson–Darling (AD) and D’Agostino–Pearson (DP) nor- mality tests [ 2 , 29 ]. Therefore, the norm in the whitened space correlates with the likelihood of an image. W e ex- tend this result to the video setting by extracting frame- lev el embeddings from real video datasets. W e apply the whitening procedure discussed abov e (Section 3.1 ), and as- sess Gaussianity with the same tests, ev aluating multiple en- coders. Under this Gaussian assumption, per-frame spatial likelihoods follow the closed-form log-likelihood in Equa- tion ( 4 ). Details and results are in Supp. Section B.1. W e estimate spatial likelihood statistics using a calibra- tion set of n real videos (see Section 4.4 ). This step in volves no training and is computed a priori only once. It con- sists of estimating real-data statistics, which remain fixed throughout inference. At inference time, for a test video v = { f t } T t =1 , each frame f t is encoded as x t = E ( f t ) , whitened to y t using Equation ( 3 ), and assigned a log- likelihood ℓ ( y t ) according to Equation ( 4 ). 4.2. T emporal likelihood Spatial likelihoods score frames independently; they do not assess how transitions ev olve across time. T o capture motion consistency , we examine the embedding space and model frame-to-frame differences, ∆ t = x t +1 − x t . Normalization Induces Gaussianity . Empirically , the raw transition vectors ∆ t are not well modeled by a Gaussian distribution (see Supp. Section B.1). W e observe that these high-dimensional transitions exhibit tw o k ey properties: (1) 4 (a) Pearson correlation (b) Spearman correlation Figure 4. Correlations among spatial and temporal aggrega- tion methods. V alues computed on V A TEX [ 82 ], which is not used in our e valuations. When all individual likelihood detectors perform reasonably well on the evaluated benchmarks (see Supp. Section D.2), lower correlations are desirable. V ariable magnitudes ; their norms v ary substantially across samples; and (2) Random directions ; their orientations are approximately spanned in a uniform manner , since the un- derlying video motions are arbitrary and thus lack any pre- ferred direction; see Supp. Section B.1 for empirical val- idation. In high-dimensional spaces, uniformly distributed directions on the sphere behav e similarly to Gaussian sam- ples when projected onto any axis, as established by the Maxwell–Poincar ´ e lemma [ 31 , 32 ] (Section 3.2 ). T o obtain a stable probabilistic model, we normalize each transition vector as ˜ ∆ t = ∆ t ∥ ∆ t ∥ , placing all transition directions on the unit sphere. Empirically , these normalized transitions exhibit Gaussian-like behavior , see illustration in Figure 5 and quantitativ e results in Supp. Section B.1. Corner case: if two consecutive frames are identical ( x t +1 = x t ), their transition v ector is ∆ t = x t +1 − x t = 0 . Such transitions carry no temporal information and are de- terministically discarded from the temporal likelihood com- putation. If all frames in a video are identical, i.e., f 1 = f 2 = · · · = f T , the input effecti vely degenerates to a single image. In this case no temporal score is defined and the de- tector falls back to the spatial likelihood s spatial ( V ) , which analyzes the image domain. Using the calibration set of real videos, we collect all nor- malized transition vectors { ˜ ∆ t } and compute their empir- ical mean µ ∆ and cov ariance Σ ∆ . At inference time, in a manner analogous to the spatial likelihood, we whiten the normalized transitions, z t , using Equation ( 3 ), and compute their log-likelihoods ℓ ( z t ) according to Equation ( 4 ). This yields the temporal log-likelihood of each transition in the video. Generated videos often e xhibit unnatural motion, re- sulting in transitions with low lik elihood under this model. 4.3. Unified score W e compute likelihood scores for each frame (spatial) and each frame-to-frame transition (temporal). W e first aggre- gate each list separately and then combine the two aggre- gates into a single video-le vel score. W e ev aluate standard Figure 5. T emporal embedding coordinates. Raw coordinates of temporal embeddings (frame differences) are not Gaussian; af- ter normalization, each coordinate is approximately Gaussian (full histogram comparison in Supp. B.2.1). aggregation operators: minimum, maximum, and mean, on a set of real videos and measure the cross-domain corre- lations induced by each choice (Figure 4 ). Combining the minimum of one domain with the maximum of the other yields the lo west correlation, indicating complementary in- formation. Accordingly , we use the minimal temporal like- lihood and the maximal spatial likelihood per video. The method is robust to this selection; detection results for all combinations are reported in Supp. Section D.2. Per centile scoring. Because spatial and temporal likeli- hoods lie on different scales, we av oid raw magnitudes and compare each score relativ e to real data, so decisions re- flect ho w typical a video is under the calibration distribu- tion. W e set aside the spatial and temporal scores from the calibration set and, at inference, con vert a test score s into a r ank-based per centile by counting ho w many cali- bration scores s 1 , . . . , s n satisfy s i ≤ s and dividing by n : p erc( s ) = 1 n { i : s i ≤ s } . W e compute these per- centiles separately for the spatial and temporal scores. Unified video score. The final video score aggreg ates the percentile-normalized components: s video ( v ) = 1 2 perc sp ( v ) + perc temp ( v ) . (6) Percentile normalization makes both terms scale-free and less sensiti ve to extreme OOD values. In Section 5.3 , we ablate each component (spatial/temporal) alone and cross- component fusion (av erage vs. product) and find rob ustness across choices. Each component is individually discrimina- tiv e, and the unified score performs best. 4.4. Calibration set W e use a calibration set of real videos to compute whiten- ing statistics and percentile ranges, aligning with zero-shot detection: no generated samples are used at any point, and “in-distribution” is defined solely by real data. The calibra- tion set is disjoint from all ev aluation benchmarks and any 5 T able 1. Zero-shot detection results. Comparison of image- and video-based detectors on three benchmarks. Best in each ro w is bold ; second best is underlined. Our method achieves the highest average performance on all benchmarks and leads on most generators individually . It is also the only method that detects consistently across all models, maintaining A UC > 0 . 5 . Benchmark Model Image Detectors V ideo Detectors AER OBLADE [ 68 ] RIGID [ 42 ] ZED [ 28 ] D3 (L2) [ 93 ] D3 (cos) [ 93 ] ST ALL (Ours) A UC AP A UC AP A UC AP A UC AP A UC AP A UC AP V ideoFeedback [ 40 ] AnimateDiff [ 37 ] 0 . 57 0 . 55 0.73 0.74 0 . 65 0 . 62 0 . 49 0 . 49 0 . 61 0 . 57 0.83 0.86 Fast-SVD [ 12 ] 0 . 52 0 . 51 0 . 54 0 . 56 0 . 45 0 . 48 0 . 76 0 . 77 0.80 0.79 0.89 0.89 L VDM [ 41 ] 0.88 0.90 0 . 65 0 . 57 0 . 76 0 . 70 0 . 42 0 . 49 0 . 31 0 . 41 0.86 0.89 LaV ie 0 . 50 0 . 50 0.71 0.73 0 . 29 0 . 37 0 . 51 0 . 47 0 . 49 0 . 46 0.81 0.83 ModelScope [ 79 ] 0 . 60 0 . 56 0 . 66 0.62 0.69 0 . 59 0 . 51 0 . 52 0 . 42 0 . 46 0.81 0.83 Pika [ 64 ] 0 . 44 0 . 46 0 . 54 0 . 54 0 . 39 0 . 47 0.83 0.84 0.81 0.81 0 . 78 0 . 80 Sora [ 62 ] 0 . 65 0 . 62 0 . 43 0 . 44 0 . 56 0.62 0 . 62 0 . 56 0.67 0 . 58 0.81 0.82 T ext2V ideo[ 51 ] 0 . 67 0 . 63 0.70 0.68 0 . 55 0 . 49 0 . 15 0 . 33 0 . 22 0 . 36 0.83 0.83 V ideoCrafter2 [ 24 ] 0 . 60 0 . 58 0.80 0 . 76 0 . 53 0 . 50 0 . 69 0 . 71 0 . 80 0.79 0.93 0.94 ZeroScope [ 20 ] 0.78 0.78 0 . 65 0 . 59 0 . 70 0 . 62 0 . 35 0 . 45 0 . 35 0 . 44 0.78 0.81 Hotshot-XL [ 46 ] 0 . 20 0 . 34 0 . 51 0 . 58 0 . 44 0 . 45 0.64 0.67 0 . 60 0 . 62 0.79 0.80 A verage 0 . 58 0 . 58 0.63 0.62 0 . 54 0 . 54 0 . 54 0 . 57 0 . 55 0 . 57 0.83 0.85 GenV ideo [ 23 ] Crafter [ 22 ] 0 . 64 0 . 65 0 . 71 0 . 66 0 . 55 0 . 56 0.79 0.82 0 . 76 0 . 79 0.82 0.80 Gen2 [ 34 ] 0 . 56 0 . 59 0 . 70 0 . 67 0 . 51 0 . 58 0.88 0.90 0.88 0.90 0.88 0 . 89 Lavie [ 84 ] 0 . 58 0 . 59 0.77 0.76 0 . 39 0 . 42 0 . 68 0 . 68 0 . 67 0 . 68 0.85 0.84 ModelScope [ 79 ] 0 . 60 0 . 60 0 . 62 0 . 59 0 . 61 0 . 57 0.63 0.64 0 . 60 0 . 63 0.78 0.78 MorphStudio [ 59 ] 0.74 0.73 0.74 0 . 69 0 . 60 0 . 60 0 . 66 0 . 71 0 . 64 0 . 69 0.83 0.84 Show 1 [ 90 ] 0 . 48 0 . 50 0 . 53 0 . 52 0 . 45 0 . 47 0.76 0.80 0 . 75 0 . 79 0.82 0.80 Sora [ 62 ] 0 . 73 0 . 70 0 . 49 0 . 48 0 . 71 0.79 0.75 0 . 75 0 . 74 0 . 74 0.79 0.80 W ildScrape [ 86 ] 0 . 49 0 . 53 0 . 61 0 . 59 0 . 55 0 . 57 0.65 0.69 0 . 64 0.69 0.72 0 . 68 HotShot-XL [ 46 ] 0 . 31 0 . 39 0.64 0.65 0 . 47 0 . 46 0 . 56 0 . 64 0 . 54 0 . 62 0.79 0.78 MoonV alley [ 58 ] 0 . 75 0 . 78 0 . 72 0 . 66 0 . 63 0 . 72 0.81 0.82 0.81 0.82 0 . 72 0 . 75 A verage 0 . 59 0 . 61 0 . 65 0 . 63 0 . 55 0 . 57 0.72 0.74 0 . 70 0 . 74 0.80 0.80 ComGenV id (ours) Sora [ 62 ] 0.72 0.67 0 . 53 0 . 55 0 . 58 0 . 59 0 . 68 0 . 65 0 . 68 0 . 65 0.84 0.85 VEO3 [ 36 ] 0 . 67 0 . 62 0 . 62 0 . 63 0 . 52 0 . 55 0.79 0 . 76 0.79 0.78 0.86 0.87 A verage 0 . 69 0 . 64 0 . 57 0 . 59 0 . 55 0 . 57 0.73 0.71 0.73 0.71 0.85 0.86 All Benchmarks A verage 0 . 62 0 . 61 0 . 61 0 . 59 0 . 57 0 . 58 0.64 0.65 0.64 0.65 0.82 0.82 other data used else where in this paper , ensuring no ov er- lap or leakage. This is not a limitation: ev ery detector must define a decision boundary , and real-only calibration pro- vides a principled, data-driven anchor for both spatial and temporal likelihoods. Ablations are provided in Sec. 5.3 . 5. Evaluations 5.1. Experimental settings Datasets. W e ev aluate our detector on two benchmarks spanning real and generated videos. V ideoF eedback [ 40 ] contains ∼ 33k generated videos from 11 text-to-video mod- els [ 12 , 16 , 20 , 24 , 37 , 41 , 46 , 51 , 64 , 79 , 84 ] and ∼ 4k real videos dra wn from two datasets [ 3 , 25 ]. GenV ideo [ 23 ] (test set) comprises ∼ 8.5k generated videos from 10 gen- erativ e sets [ 16 , 22 , 34 , 45 , 58 , 59 , 79 , 84 , 90 ] and ∼ 10k real videos from a single dataset [ 88 ]. Across both bench- marks, the generati ve models constitute a di verse collection of diffusion-based text-to-video systems. Additionally , we present ComGenV id , a set of ∼ 3.5k generated videos from recent commercial models V eo3 and Sora [ 36 , 62 ], designed to stress cross-model generalization. W e pair these with ∼ 1.7k real videos sampled from [ 21 ]. For all e valuations, we subsample to use equal numbers of real and generated videos (determined by the smaller class in each split) to en- sure fair metric comparisons. A complete breakdown of generativ e models, video counts, and dataset composition 6 (a) Latency comparison. (b) Performance comparison. (c) Calibration set ablation. Figure 6. Comparison of detectors and calibration data. W e compare our method against six detectors: three image-based [ 28 , 42 , 68 ] and three video-based [ 1 , 5 , 93 ], for performance and efficiency . (a) Inference latency per video. (b) A verage A UC across all three benchmarks; our method is both high-performing and ef ficient. (c) GenV ideo [ 23 ] results using different datasets as the calibration set, showing that same-distrib ution calibration is only slightly better, indicating rob ustness to the calibration choice (see Supp. D.6.6). (a) Calibration set size ablation. (b) Image perturbations. Figure 7. Robustness to calibration set size and image pertur- bations. (a) V arying calibration-set size between 1k to 34k; each size is resampled 5 times and we report mean A UC ± standard de- viation. (b) Rob ustness to four common image perturbations ap- plied randomly to frames at fi ve sev erity levels; our method main- tains high separation across perturbation type and intensity . Both experiments are performed on GenV ideo [ 23 ]. is giv en in Supp. Section C. Metrics. W e report Area Under the ROC Curve (A UC) and A verage Precision (AP). A UC measures the ability of the detector to separate real and generated videos by inte- grating the R OC curve (true-positi ve-rate vs. false-positi ve- rate across thresholds), while AP summarizes the preci- sion–recall trade-off for the positi ve (generated) class. Implementation details. W e use av ailable official imple- mentations for baselines: AER OBLADE [ 68 ] and D3 (both L2 and cosine similarity variants, see Supp. Section A.4), and the supervised detectors T2VE [ 1 ] and AIGVdet [ 5 ] (of- ficial weights and code). For RIGID [ 42 ] and ZED [ 28 ], we reimplemented the authors’ methods following the paper’ s specifications (see Supp. Section A.2). Image detectors op- erate per-frame, and we report the mean score ov er frames. In all experiments we encode frames using DINOv3 [ 71 ] for our method, and use a fixed calibration set that is built from 33k real videos from V A TEX [ 82 ]. This dataset is completely separate from any data used for ev aluations. W e conduct ablations on calibration set size and dataset, en- coder model and method components in the next section. Data curation and evaluation protocol. Follo wing stan- dard protocols [ 5 , 93 ], we standardize inputs to 8 or 16 frames. For fair comparison, we sample all ev aluated videos at 8 FPS and 2 s duration (16 frames). The only exceptions are HotShot-XL and MoonV alley [ 46 , 58 ], which generate 1 s videos; for these we compare against real 1 s videos at 8 FPS (8 frames). Image detectors operate per frame and the av erage score over all frames is ev aluated. W e report results under this default setting (Supp. A.3) and pro vide an ablation on FPS/duration sensitivity in the ne xt section. 5.2. Results Benchmark evaluations. T able 1 reports zero-shot results across all three benchmarks. Our method achie ves the high- est a verage performance on each benchmark and attains the best per-generator results in most cases; when not the top method, it remains competiti ve. Notably , all other meth- ods produce A UC values belo w 0.5 for some generators, indicating an in verted decision boundary; detectors that fit one model misclassify many examples from others. Our method does not exhibit this failure mode and maintains consistent separation between real and generated samples. In Figure 6b we also include supervised video detectors; our zero-shot method still outperforms them, e ven though they are partially trained on the e valuated generators. Efficiency . W e measure each method’ s inference time, measured per video (16 frames input), results are reported in Figure 6a . ST ALL, together with D3 [ 93 ] and RIGID [ 42 ] are the fastest methods with 0.49s, 0.5s and 0.6s respec- tiv ely . ZED [ 28 ] and T2VE [ 1 ] show double latency (0.92s, 0.97s) while AER OBLADE [ 68 ] and AIGVdet [ 5 ] demonstrate increased latency . Our method is relatively lightweight (Supp. Section E) making it highly ef ficient. 5.3. Ablation study Calibration set. W e study the effect of calibration set size and dataset. W e examine different datasets as the source of the calibration set in Figure 6c . W e compare 7 (a) Step size ablation. (b) Length of video ablation. (c) FPS ablation. Figure 8. T emporal ablations. Our method remains rob ust under all temporal variations: (a) temporal ste p size for lik elihood computation; (b) video length; (c) frame rate (FPS). V A TEX [ 82 ] with a combination of Kinetics-400 and PE datasets [ 13 , 50 ], samples from the real data of V ideoFeed- back and samples from the real data of Gen video (dif ferent samples than the ev aluation set). W e add a combination of all four options. Using data from the same distrib ution as tested (GenV ideo) results in only a slightly higher per- formance. Other options remain competitiv e, demonstrat- ing robustness to dataset selection. W e then vary the cal- ibration set size (using V A TEX [ 82 ]) between 1k and 34k and report mean A UC and standard deviation over 5 sam- pling iterations. Results are in Figure 7a showing that only at very small sizes (less than 5k) results drop significantly . For whitening, we use one frame per video and all frame-to- frame transitions. W e test using a single transition per video and find that results remain identical (Supp. Section D.3). Embedder comparison. W e ev aluate our detector with multiple vision encoders: DINOv3 [ 71 ], lightweight Mo- bileNet [ 47 ], and ResNet-18 [ 39 ], as well as video encoders V ideoMAE [ 75 ] and V iCLIP [ 83 ]. V ideo encoders produce a single embedding per video , and we compute likelihood directly on this vector . T able 2 shows that image encoders perform strongly , ev en with older , lightweight backbones like MobileNet and ResNet-18. V ideo encoders, by con- trast, perform poorly . Collapsing an entire video to a single embedding discards frame-wise and transition statistics, un- dermining both spatial and temporal likelihood modeling. T able 2. Backbone encoder ablation. Image encoders V ideo encoders DINOv3 [ 71 ] MobileNet-v3 [ 47 ] ResNet-18 [ 39 ] ViCLIP-L/14 [ 83 ] VideoMAE [ 75 ] A UC 0.81 0.82 0.79 0.59 0.61 Robustness analysis. W e test robustness by applying stan- dard image corruptions to video frames: JPEG compres- sion, Gaussian blur , resized crop, and additiv e noise, at five sev erity lev els. Perturbations are applied only at inference while keeping the calibration set unchanged. Results in Fig- ure 7b show strong robustness across perturbation types up to the highest intensity le vels; implementation details and examples in Supp. Section D.5. W e also e valuate robust- ness to temporal perturbations in Supp. Section D.4. W e further vary the input FPS and the temporal step size between frames ( ∆ t ) to assess sensiti vity to motion sparsity and sampling rate, and also test different video durations. Results in Figure 8 sho w that our method remains rob ust across all temporal settings. Evaluations settings of these experiments are in Supp. Section D.6. Finally , we assess performance using higher-order temporal differences: while temporal transitions capture first-order changes, higher orders model more complex motion dy- namics. As shown in Supp. Section D.1, all orders exhibit high correlation and yield nearly identical results. Component analysis. W e assess three v ariants: (i) spatial- only , (ii) temporal-only , and (iii) the full model combining both. For each, we report results with raw likelihoods and with percentile-ranked scores. W e also test standard aggre- gations (min, max, mean). Results sho w that either single- domain detector performs well, the combined detector per- forms best, and performance is robust to the choice of ag- gregation (see Supp. Section D.2). 6. Conclusion W e introduce ST ALL, a zero-shot detector for fully gen- erated videos that fuses spatial (per-frame) and temporal (inter-frame) likelihoods in a single probabilistic frame- work. Our method is training-free, uses no generated sam- ples, and relies solely on real videos to define reference dis- tributions for both spatial and temporal statistics. Across multiple benchmarks, including recent frontier models such as Sora and V eo3, our approach consistently outperforms prior supervised and zero-shot image/video detectors. It is also efficient and robust to spatial and temporal per- turbations, calibration data size and source, and aggrega- tion choices. As this field continues to develop rapidly , there remains room for improvement; nevertheless, our re- sults highlight that modeling the statistical structure of real videos is a promising path for robust detection. 8 Acknowledgments W e would like to ackno wledge support by the Israel Science Foundation (Grant 1472/23) and by the Ministry of Inno va- tion, Science and T echnology (Grant 8801/25). References [1] 1129ljc. T2ve: T ext-vision embedding for generalized ai- generated video detection. https : / / github . com / 1129ljc/T2VE , 2025. GitHub repository . 7 , 16 , 33 , 34 [2] Theodore W Anderson and Donald A Darling. A test of goodness of fit. Journal of the American statistical asso- ciation , 49(268):765–769, 1954. 4 , 18 [3] Lisa Anne Hendricks, Oli ver W ang, Eli Shechtman, Josef Sivic, T revor Darrell, and Bryan Russell. Localizing mo- ments in video with natural language. In Pr oceedings of the IEEE international confer ence on computer vision , pages 5803–5812, 2017. 6 , 16 , 25 , 31 , 32 [4] Gil Appel, Juliana Neelbauer , and David A. Schweidel. Gen- erativ e ai has an intellectual property problem. Harvard Busi- ness Revie w , April 7, 2023, 2023. 1 [5] Jianfa Bai, Man Lin, Gang Cao, and Zijie Lou. Ai-generated video detection via spatial-temporal anomaly learning. In Chinese Confer ence on P attern Recognition and Computer V ision (PRCV) , pages 460–470. Springer , 2024. 2 , 7 , 16 , 33 , 34 [6] Quentin Bammey . Synthbuster: T owards detection of dif fu- sion model generated images. IEEE Open Journal of Signal Pr ocessing , 2023. 2 [7] Samah S Baraheem and T am V Nguyen. Ai vs. ai: Can ai detect ai-generated images? Journal of Imaging , 9(10):199, 2023. 1 , 2 [8] Roy Betser , Meir Y ossef Levi, and Guy Gilboa. Whitened clip as a likelihood surrogate of images and captions. In 42nd International confer ence on machine learning , 2025. 2 , 4 [9] Roy Betser, Eyal Gofer , Meir Y ossef Levi, and Guy Gilboa. Infonce induces gaussian distribution. In International Con- fer ence on Learning Representations (ICLR) , 2026. 3 [10] Roy Betser , Omer Hofman, Roman V ainshtein, and Guy Gilboa. General and domain-specific zero-shot detection of generated images via conditional likelihood. In Proceed- ings of the IEEE/CVF W inter Confer ence on Applications of Computer V ision , pages 7809–7820, 2026. 3 [11] Jordan J Bird and Ahmad Lotfi. Cifake: Image classifica- tion and explainable identification of ai-generated synthetic images. IEEE Access , 2024. 1 , 2 [12] Andreas Blattmann, T im Dockhorn, Sumith Kulal, Daniel Mendelevitch, Maciej Kilian, Dominik Lorenz, Y am Levi, Zion English, V ikram V oleti, Adam Letts, et al. Stable video diffusion: Scaling latent video diffusion models to large datasets. arXiv preprint , 2023. 6 , 25 [13] Daniel Bolya, Po-Y ao Huang, Peize Sun, Jang Hyun Cho, Andrea Madotto, Chen W ei, T engyu Ma, Jiale Zhi, Jathushan Rajasegaran, Hanoona Rasheed, et al. Perception encoder: The best visual embeddings are not at the output of the net- work. arXiv preprint , 2025. 8 , 25 , 26 , 31 [14] Jonathan Brokman, Amit Giloni, Omer Hofman, Roman V ainshtein, Hisashi Kojima, and Guy Gilboa. Manifold in- duced biases for zero-shot and few-shot detection of gener- ated images. In International Confer ence on Learning Rep- r esentations , 2025. 2 [15] Jonathan Brokman, Oren Rachmil, Omer Hofman, Roy Betser , Amit Giloni, Roman V ainshtein, and Hisashi Kojima. T raining-free detection of text-to-video generations via over- coherence. In Pr oceedings of the IEEE/CVF W inter Confer- ence on Applications of Computer V ision , pages 3993–4003, 2026. 2 [16] Tim Brooks, Bill Peebles, Connor Holmes, W ill DePue, Y ufei Guo, Li Jing, David Schnurr , Joe T aylor, Troy Luh- man, Eric Luhman, et al. V ideo generation models as world simulators. OpenAI Blog , 1(8):1, 2024. 6 , 24 [17] T om Brown, Benjamin Mann, Nick Ryder , Melanie Sub- biah, Jared D Kaplan, Prafulla Dhariwal, Arvind Neelakan- tan, Pranav Shyam, Girish Sastry , Amanda Askell, et al. Lan- guage models are few-shot learners. Advances in neural in- formation pr ocessing systems , 33:1877–1901, 2020. 1 [18] Sheng Cao, Chao-Y uan W u, and Philipp Kr ¨ ahenb ¨ uhl. Loss- less image compression through super-resolution, 2020. 16 [19] Mathilde Caron, Hugo T ouvron, Ishan Misra, Herv ´ e J ´ egou, Julien Mairal, Piotr Bojanowski, and Armand Joulin. Emerg- ing properties in self-supervised vision transformers. In Pr o- ceedings of the IEEE/CVF international confer ence on com- puter vision , pages 9650–9660, 2021. 16 [20] Cerspense. Zeroscope v2 (576 w). https : / / huggingface . co / cerspense / zeroscope _ v2_576w , 2024. 6 , 25 [21] David Chen and W illiam B Dolan. Collecting highly paral- lel data for paraphrase ev aluation. In Proceedings of the 49th annual meeting of the association for computational linguis- tics: human langua ge technologies , pages 190–200, 2011. 6 , 24 [22] Haoxin Chen, Menghan Xia, Y ingqing He, Y ong Zhang, Xiaodong Cun, Shaoshu Y ang, Jinbo Xing, Y aofang Liu, Qifeng Chen, Xintao W ang, et al. V ideocrafter1: Open diffusion models for high-quality video generation. arXiv pr eprint arXiv:2310.19512 , 2023. 6 , 25 [23] Haoxing Chen, Y an Hong, Zizheng Huang, Zhuoer Xu, Zhangxuan Gu, Y aohui Li, Jun Lan, Huijia Zhu, Jianfu Zhang, W eiqiang W ang, et al. Demamba: Ai-generated video detection on million-scale gen video benchmark. arXiv pr eprint arXiv:2405.19707 , 2024. 2 , 6 , 7 , 17 , 19 , 22 , 24 , 25 , 26 , 28 , 29 , 30 , 31 , 32 [24] Haoxin Chen, Y ong Zhang, Xiaodong Cun, Menghan Xia, Xintao W ang, Chao W eng, and Y ing Shan. V ideocrafter2: Overcoming data limitations for high-quality video diffu- sion models. In Pr oceedings of the IEEE/CVF Conference on Computer V ision and P attern Recognition , pages 7310– 7320, 2024. 1 , 6 , 25 [25] Tsai-Shien Chen, Aliaksandr Siarohin, Willi Menapace, Ekaterina Deyneka, Hsiang-wei Chao, Byung Eun Jeon, Y uwei Fang, Hsin-Y ing Lee, Jian Ren, Ming-Hsuan Y ang, et al. Panda-70m: Captioning 70m videos with multiple cross-modality teachers. In Pr oceedings of the IEEE/CVF 9 Confer ence on Computer V ision and P attern Recognition , pages 13320–13331, 2024. 6 , 16 , 25 , 31 , 32 [26] Dario Cioni, Christos Tzelepis, Lorenzo Seidenari, and Ioannis Patras. Are clip features all you need for uni- versal synthetic image origin attribution? arXiv pr eprint arXiv:2408.09153 , 2024. 1 , 2 [27] Davide Cozzolino, Giov anni Poggi, Riccardo Corvi, Matthias Nießner, and Luisa V erdoliva. Raising the bar of ai-generated image detection with clip. In Pr oceedings of the IEEE/CVF Confer ence on Computer V ision and P attern Recognition , pages 4356–4366, 2024. 2 [28] Davide Cozzolino, Giovanni Poggi, Matthias Nießner , and Luisa V erdoliva. Zero-shot detection of ai-generated images. In Eur opean Conference on Computer V ision , pages 54–72. Springer , 2024. 2 , 6 , 7 , 16 , 33 , 34 [29] Ralph D’agostino and Egon S Pearson. T ests for departure from normality . empirical results for the distributions of b 2 and √ b . Biometrika , 60(3):613–622, 1973. 4 , 18 [30] TOI T ech Desk. Ai-assisted content creation will lower the barrier to creati vity but raise quality: Adobe’ s govind bal- akrishnan. The T imes of India, “ AI-assisted content creation will lower the barrier to creati vity . . . ”, 2025. 1 [31] Persi Diaconis and David Freedman. Asymptotics of graph- ical projection pursuit. The annals of statistics , pages 793– 815, 1984. 3 , 4 , 5 , 19 [32] Persi Diaconis and Da vid Freedman. A dozen de finetti-style results in search of a theory . In Annales de l’IHP Probabilit ´ es et statistiques , pages 397–423, 1987. 4 , 5 , 19 [33] David C Epstein, Ishan Jain, Oliv er W ang, and Richard Zhang. Online detection of ai-generated images. In Pr oceed- ings of the IEEE/CVF International Confer ence on Com- puter V ision , pages 382–392, 2023. 2 [34] Patrick Esser, Johnathan Chiu, Parmida Atighehchian, Jonathan Granskog, and Anastasis Germanidis. Structure and content-guided video synthesis with diffusion models. In Pr oceedings of the IEEE/CVF international conference on computer vision , pages 7346–7356, 2023. 6 , 25 , 29 , 30 [35] Y ifeng Gao, Y ifan Ding, Hongyu Su, Juncheng Li, Y unhan Zhao, Lin Luo, Zixing Chen, Li W ang, Xin W ang, Y ixu W ang, et al. David-xr1: Detecting ai-generated videos with explainable reasoning. arXiv preprint , 2025. 2 [36] DeepMind / Google. V eo 3: Google deepmind’ s third- generation text-to-video model. Online technical report, 2025. 2 , 6 , 24 [37] Y uwei Guo, Ceyuan Y ang, Anyi Rao, Zhengyang Liang, Y aohui W ang, Y u Qiao, Maneesh Agrawala, Dahua Lin, and Bo Dai. Animatediff: Animate your personalized text- to-image diffusion models without specific tuning. arXiv pr eprint arXiv:2307.04725 , 2023. 6 , 25 [38] Y oav HaCohen, Nisan Chiprut, Benny Brazo wski, Daniel Shalem, Dudu Moshe, Eitan Richardson, Eran Levin, Guy Shiran, Nir Zabari, Ori Gordon, et al. Ltx-video: Realtime video latent diffusion. arXiv preprint , 2024. 1 [39] Kaiming He, Xiangyu Zhang, Shaoqing Ren, and Jian Sun. Deep residual learning for image recognition. In Proceed- ings of the IEEE confer ence on computer vision and pattern r ecognition , pages 770–778, 2016. 8 , 30 [40] Xuan He, Dongfu Jiang, Ge Zhang, Max Ku, Achint Soni, Sherman Siu, Haonan Chen, Abhranil Chandra, Ziyan Jiang, Aaran Arulraj, Kai W ang, Quy Duc Do, Y uansheng Ni, Bo- han L yu, Y aswanth Narsupalli, Rongqi Fan, Zhiheng L yu, Y uchen Lin, and W enhu Chen. V ideoscore: Building auto- matic metrics to simulate fine-grained human feedback for video generation. ArXiv , abs/2406.15252, 2024. 2 , 6 , 16 , 24 , 25 , 31 , 32 [41] Y ingqing He, Tian yu Y ang, Y ong Zhang, Y ing Shan, and Qifeng Chen. Latent video diffusion models for high-fidelity long video generation. arXiv preprint , 2022. 6 , 25 [42] Zhiyuan He, Pin-Y u Chen, and Tsung-Y i Ho. Rigid: A training-free and model-agnostic framework for ro- bust ai-generated image detection. arXiv preprint arXiv:2405.20112 , 2024. 2 , 6 , 7 , 16 , 33 [43] European Union Intellectual Property Helpdesk. Deepfake – a global crisis. EUIPO, August 28, 2024, 2024. 1 [44] Jonathan Ho, Ajay Jain, and Pieter Abbeel. Denoising dif- fusion probabilistic models. Advances in neural information pr ocessing systems , 33:6840–6851, 2020. 1 [45] HotshotCo. Hotshot-xl. https: // huggingface . co / hotshotco/Hotshot- XL , 2023. 6 [46] HotshotCo. Hotshot-xl. https : / / github . com / hotshotco/hotshot- xl , 2023. 6 , 7 , 24 , 25 , 26 [47] Andrew Ho ward, Mark Sandler, Grace Chu, Liang-Chieh Chen, Bo Chen, Mingxing T an, W eijun W ang, Y ukun Zhu, Ruoming Pang, V ijay V asudev an, et al. Searching for mo- bilenetv3. In Pr oceedings of the IEEE/CVF international confer ence on computer vision , pages 1314–1324, 2019. 3 , 8 , 30 [48] Christian Intern ` o, Robert Geirhos, Markus Olhofer , Sunny Liu, Barbara Hammer, and David Klindt. Ai-generated video detection via perceptual straightening. arXiv preprint arXiv:2507.00583 , 2025. 2 [49] Aditya Kalra and Munsif V engattil. India proposes strict rules to label ai content citing growing risks of deepfakes. Reuters , 2025. 1 [50] Will Kay , Joao Carreira, Karen Simonyan, Brian Zhang, Chloe Hillier , Sudheendra V ijayanarasimhan, Fabio V iola, T im Green, T revor Back, Paul Natse v , et al. The kinetics hu- man action video dataset. arXiv preprint , 2017. 8 , 25 , 26 , 32 [51] Levon Khachatryan, Andranik Movsisyan, V ahram T ade- vosyan, Roberto Henschel, Zhangyang W ang, Shant Nav asardyan, and Humphrey Shi. T ext2video-zero: T ext- to-image dif fusion models are zero-shot video generators. In Pr oceedings of the IEEE/CVF International Confer ence on Computer V ision , pages 15954–15964, 2023. 6 , 25 [52] Kevin LaCroix. The growing threat of ai deepfake attacks. Dando and O’Malley , August 19, 2025, 2025. 1 [53] Olivia Le Poide vin. Un report urges stronger measures to detect ai-driv en deepfakes. Reuters, July 11, 2025, 2025. 1 [54] Meir Y ossef Levi and Guy Gilboa. The double ellipsoid ge- ometry of clip. In Pr oceedings of the 42nd International 10 Confer ence on Machine Learning , V ancouver , Canada, 2025. PMLR. 3 [55] V ictor W eixin Liang, Y uhui Zhang, Y ongchan Kwon, Ser- ena Y eung, and James Y Zou. Mind the gap: Understanding the modality gap in multi-modal contrastive representation learning. Advances in Neural Information Pr ocessing Sys- tems , 35:17612–17625, 2022. 3 [56] Tsung-Y i Lin, Michael Maire, Serge Belongie, James Hays, Pietro Perona, Dev a Ramanan, Piotr Doll ´ ar , and C La wrence Zitnick. Microsoft coco: Common objects in context. In Computer V ision–ECCV 2014: 13th Eur opean Confer ence, Zurich, Switzerland, September 6-12, 2014, Pr oceedings, P art V 13 , pages 740–755. Springer , 2014. 4 [57] Fernando Martin-Rodriguez, Rocio Garcia-Mojon, and Monica Fernandez-Barciela. Detection of ai-created images using pixel-wise feature extraction and conv olutional neural networks. Sensors , 23(22):9037, 2023. 2 [58] MoonV alley. Moonv alley . https://moonvalley.ai/ , 2022. 6 , 7 , 24 , 25 , 26 [59] MorphStudio. Morphstudio. https : / / www . morphstudio.com/ , 2023. 6 , 25 [60] Bolin Ni, Houwen Peng, Minghao Chen, Songyang Zhang, Gaofeng Meng, Jianlong Fu, Shiming Xiang, and Haibin Ling. Expanding language-image pretrained models for gen- eral video recognition, 2022. 17 [61] Utkarsh Ojha, Y uheng Li, and Y ong Jae Lee. T owards uni- versal fake image detectors that generalize across genera- tiv e models. In Proceedings of the IEEE/CVF Confer ence on Computer V ision and P attern Recognition , pages 24480– 24489, 2023. 2 [62] OpenAI. V ideo generation models as world simulators – in- troducing sora. Online technical report, 2024. 2 , 6 , 17 , 24 , 25 , 30 [63] Adam Paszke, Sam Gross, Francisco Massa, Adam Lerer , James Bradbury , Gregory Chanan, T revor Killeen, Zeming Lin, Natalia Gimelshein, Luca Antiga, et al. Pytorch: An im- perativ e style, high-performance deep learning library . Ad- vances in neural information pr ocessing systems , 32, 2019. 33 [64] Pika Labs. Pika. https://pika.art/ , 2023. 6 , 25 [65] Oren Rachmil, Roy Betser , Itay Gershon, Omer Hofman, Ni- tay Y akoby , Y uval Meron, Idan Y ankelev , Asaf Shabtai, Y u- val Elovici, and Roman V ainshtein. T raining-free policy vio- lation detection via acti vation-space whitening in llms. arXiv pr eprint arXiv:2512.03994 , 2025. 3 [66] Alec Radford, Jong W ook Kim, Chris Hallacy , Aditya Ramesh, Gabriel Goh, Sandhini Agarwal, Girish Sastry , Amanda Askell, P amela Mishkin, Jack Clark, et al. Learning transferable visual models from natural language supervi- sion. In International confer ence on machine learning , pages 8748–8763. PmLR, 2021. 3 [67] Colin Raffel, Noam Shazeer, Adam Roberts, Katherine Lee, Sharan Narang, Michael Matena, Y anqi Zhou, W ei Li, and Peter J Liu. Exploring the limits of transfer learning with a unified te xt-to-text transformer . Journal of machine learning r esearc h , 21(140):1–67, 2020. 1 [68] Jonas Ricker , Denis Luko vnikov , and Asja Fischer . Aer - oblade: Training-free detection of latent diffusion images using autoencoder reconstruction error . In Pr oceedings of the IEEE/CVF Confer ence on Computer V ision and P attern Recognition , pages 9130–9140, 2024. 2 , 6 , 7 , 16 , 33 , 34 [69] Robin Rombach, Andreas Blattmann, Dominik Lorenz, Patrick Esser , and Bj ¨ orn Ommer . High-resolution image synthesis with latent diffusion models. In Pr oceedings of the IEEE/CVF conference on computer vision and pattern r ecognition , pages 10684–10695, 2022. 1 [70] Zeyang Sha, Zheng Li, Ning Y u, and Y ang Zhang. De-fake: Detection and attribution of fake images generated by text- to-image generation models. In Pr oceedings of the 2023 A CM SIGSAC Conference on Computer and Communica- tions Security , pages 3418–3432, 2023. 2 [71] Oriane Sim ´ eoni, Huy V . V o, Maximilian Seitzer, Federico Baldassarre, Maxime Oquab, Cijo Jose, V asil Khalidov , Marc Szafraniec, Seungeun Y i, Micha ¨ el Ramamonjisoa, Francisco Massa, Daniel Haziza, Luca W ehrstedt, Jianyuan W ang, Timoth ´ ee Darcet, Th ´ eo Moutakanni, Leonel Sentana, Claire Roberts, Andrea V edaldi, Jamie T olan, John Brandt, Camille Couprie, Julien Mairal, Herv ´ e J ´ egou, Patrick La- batut, and Piotr Bojanowski. Dinov3, 2025. 2 , 3 , 7 , 8 , 15 , 17 , 18 , 19 , 21 , 22 , 26 , 30 [72] Nikolai V Smirnov . On the estimation of the discrepancy between empirical curves of distribution for two independent samples. Bull. Math. Univ . Moscou , 2(2):3–14, 1939. 18 [73] Y ang Song and Stefano Ermon. Generative modeling by esti- mating gradients of the data distrib ution. Advances in neural information pr ocessing systems , 32, 2019. 1 [74] Michael Stelzner . Using ai to simplify content marketing workflo ws. Social Media Examiner , “Using AI to Simplify Content Marketing W orkflows”, 2023. 1 [75] Zhan T ong, Y ibing Song, Jue W ang, and Limin W ang. V ideomae: Masked autoencoders are data-efficient learners for self-supervised video pre-training. Advances in neural information processing systems , 35:10078–10093, 2022. 8 , 30 [76] Danial Samadi V ahdati, T ai D Nguyen, Aref Azizpour , and Matthew C Stamm. Be yond deepfake images: Detecting ai-generated videos. In Pr oceedings of the IEEE/CVF Con- fer ence on Computer V ision and P attern Recognition , pages 4397–4408, 2024. 2 [77] Aad W V an der V aart. Asymptotic statistics . Cambridge uni- versity press, 2000. 20 [78] T eam W an, Ang W ang, Baole Ai, Bin W en, Chaojie Mao, Chen-W ei Xie, Di Chen, Feiwu Y u, Haiming Zhao, Jianx- iao Y ang, et al. W an: Open and advanced large-scale video generativ e models. arXiv preprint , 2025. 1 [79] Jiuniu W ang, Hangjie Y uan, Dayou Chen, Y ingya Zhang, Xiang W ang, and Shiwei Zhang. Modelscope text-to-video technical report. arXiv pr eprint arXiv:2308.06571 , 2023. 6 , 25 , 30 [80] Sheng-Y u W ang, Oliver W ang, Richard Zhang, Andrew Owens, and Alex ei A Efros. Cnn-generated images are surprisingly easy to spot... for now . In Pr oceedings of the IEEE/CVF conference on computer vision and pattern r ecognition , pages 8695–8704, 2020. 2 11 [81] W enhao W ang and Y i Y ang. V idprom: A million-scale real prompt-gallery dataset for text-to-video diffusion models. 2024. 24 [82] Xin W ang, Jiawei W u, Junkun Chen, Lei Li, Y uan-Fang W ang, and W illiam Y ang W ang. V atex: A large-scale, high- quality multilingual dataset for video-and-language research. In Pr oceedings of the IEEE/CVF international conference on computer vision , pages 4581–4591, 2019. 5 , 7 , 8 , 18 , 19 , 20 , 21 , 23 , 25 , 26 , 29 , 30 , 31 , 32 [83] Y i W ang, Y inan He, Y izhuo Li, Kunchang Li, Jiashuo Y u, Xin Ma, Xinhao Li, Guo Chen, Xinyuan Chen, Y aohui W ang, et al. Internvid: A large-scale video-text dataset for multimodal understanding and generation. arXiv pr eprint arXiv:2307.06942 , 2023. 8 , 30 [84] Y aohui W ang, Xinyuan Chen, Xin Ma, Shangchen Zhou, Ziqi Huang, Y i W ang, Ceyuan Y ang, Y inan He, Jiashuo Y u, Peiqing Y ang, et al. Lavie: High-quality video generation with cascaded latent dif fusion models. International J ournal of Computer V ision , 133(5):3059–3078, 2025. 6 , 25 , 29 [85] Zhendong W ang, Jianmin Bao, W engang Zhou, W eilun W ang, Hezhen Hu, Hong Chen, and Houqiang Li. Dire for diffusion-generated image detection. In Pr oceedings of the IEEE/CVF International Conference on Computer V ision , pages 22445–22455, 2023. 2 [86] Y ujie W ei, Shiwei Zhang, Zhiwu Qing, Hangjie Y uan, Zhi- heng Liu, Y u Liu, Y ingya Zhang, Jingren Zhou, and Hong- ming Shan. Dreamvideo: Composing your dream videos with customized subject and motion, 2023. 6 , 25 , 29 , 30 [87] Haiquan W en, Y iwei He, Zhenglin Huang, Tianxiao Li, Zi- han Y u, Xingru Huang, Lu Qi, Baoyuan W u, Xiangtai Li, and Guangliang Cheng. Busterx: Mllm-powered ai-generated video forgery detection and explanation. arXiv preprint arXiv:2505.12620 , 2025. 2 [88] Jun Xu, T ao Mei, Ting Y ao, and Y ong Rui. Msr-vtt: A large video description dataset for bridging video and language. In Pr oceedings of the IEEE conference on computer vision and pattern reco gnition , pages 5288–5296, 2016. 6 , 17 , 24 , 25 , 28 , 29 , 30 , 31 , 32 [89] Runhao Zeng, Xiaoyong Chen, Jiaming Liang, Huisi W u, Guangzhong Cao, and Y ong Guo. Benchmarking the rob ust- ness of temporal action detection models against temporal corruptions. In IEEE Conference on Computer V ision and P attern Recognition , 2024. 28 [90] David Junhao Zhang, Jay Zhangjie Wu, Jia-W ei Liu, Rui Zhao, Lingmin Ran, Y uchao Gu, Difei Gao, and Mike Zheng Shou. Show-1: Marrying pixel and latent dif fusion models for text-to-video generation. International Journal of Com- puter V ision , 133(4):1879–1893, 2025. 6 , 25 [91] Mingxu Zhang, Hongxia W ang, Peisong He, Asad Malik, and Hanqing Liu. Exposing unseen gan-generated image us- ing unsupervised domain adaptation. Knowledge-Based Sys- tems , 257:109905, 2022. 2 [92] Shuhai Zhang, Zihao Lian, Jiahao Y ang, Daiyuan Li, Guox- uan Pang, Feng Liu, Bo Han, Shutao Li, and Mingkui T an. Physics-dri ven spatiotemporal modeling for ai-generated video detection. In Advances in Neur al Information Pr o- cessing Systems , 2025. 2 [93] Chende Zheng, Ruiqi Suo, Chenhao Lin, Zhengyu Zhao, Le Y ang, Shuai Liu, Minghui Y ang, Cong W ang, and Chao Shen. D3: Training-free ai-generated video detection using second-order features. In Pr oceedings of the IEEE/CVF In- ternational Confer ence on Computer V ision , pages 12852– 12862, 2025. 2 , 6 , 7 , 16 , 17 , 33 , 34 [94] Nan Zhong, Y iran Xu, Zhenxing Qian, and Xinpeng Zhang. Rich and poor texture contrast: A simple yet effecti ve ap- proach for ai-generated image detection. arXiv preprint arXiv:2311.12397 , 2023. 2 12 T raining-fr ee Detection of Generated V ideos via Spatial-T emporal Likelihoods — Supplementary Material — Omer Ben Hayun, Roy Betser , Meir Y ossef Levi, Le vi Kassel, Guy Gilboa V iterbi Faculty of Electrical and Computer Engineering T echnion – Israel Institute of T echnology , Haifa, Israel { omerben,roybe,me.levi,kassellevi } @campus.technion.ac.il; guy.gilboa@ee.technion.ac.il Abstract In this supplementary material document, we pr ovide additional implementation details to ensure the full r eproducibility of ST ALL. W e also pr esent extended explanations of the statistical tests used to assess the normality of embeddings and the uniformity of the temporal repr esentation featur es. Furthermor e, we include additional experiments and experimental details on all experiments. Next, we pr ovide further details on the newly intr oduced synthetic dataset, ComGenV id , and important details on the other used benchmarks. W e conclude with an ef ficiency analysis, comparing our method to other zer o-shot and supervised methods. The sour ce code, dataset, and pr e-computed whitening parameters ar e publicly available her e . A. Reproducibility (Section A ). B. Statistical tests (Section B ). C. Datasets (Section C ). D. Experimental details and additional results (Section D ). E. Efficiency analysis (Section E ). A. Reproducibility A.1. Detailed algorithms T o ensure complete reproducibility , we provide full implementation details, including detailed algorithms for whitening (Algorithm 2 ), scores (Algorithm 3 ), (Algorithm 4 ), calibration (Algorithm 5 ), and inference (Algorithm 6 ). A.1.1. Notation • C = { c ( i ) } N c i =1 : Calibration set of N c real videos • c ( i ) = { f ( i ) t } T t =1 : Calibration video i consisting of T frames. • v = { f t } T t =1 : query video with T frames. • E : R H × W × 3 → R d : Image vision encoder . • x t = E ( f t ) ∈ R d : Embedding of frame f t . • ∆ t = x t +1 − x t : T emporal difference between consecuti ve embeddings. • ˜ ∆ t = ∆ t / ∥ ∆ t ∥ 2 : ℓ 2 -normalized temporal difference. • µ, W : Mean and whitening matrix for spatial embeddings • µ ∆ , W ∆ : Mean and whitening matrix for temporal embeddings • s spat , s temp spatial and temporal scores. 13 A.1.2. Algorithms Algorithm 2 Compute Whitening T ransform Require: Embeddings X = { x i } N i =1 ⊂ R d 1: µ ← 1 N P N i =1 x i 2: ˆ x i ← x i − µ for i = 1 , . . . , N 3: ˆ X ← [ ˆ x 1 , . . . , ˆ x N ] 4: Σ ← 1 N ˆ X ˆ X ⊤ 5: Eigendecomposition: Σ = V Λ V ⊤ 6: W ← Λ − 1 / 2 V ⊤ 7: return µ, W Algorithm 3 Compute Spatial Score Require: Frame embeddings { x t } T t =1 , parameters ( µ, W ) 1: y t ← W ( x t − µ ) for t = 1 , . . . , T 2: ℓ spat ( t ) ← − 1 2 ( d log (2 π ) + ∥ y t ∥ 2 2 ) for t = 1 , . . . , T 3: s spat ← max { ℓ spat ( t ) } T t =1 4: return s spat Algorithm 4 Compute T emporal Score Require: Frame embeddings { x t } T t =1 , parameters ( µ ∆ , W ∆ ) 1: ∆ t ← x t +1 − x t for t = 1 , . . . , T − 1 ▷ T emporal differences 2: ˜ ∆ t ← ∆ t ∥ ∆ t ∥ 2 for t = 1 , . . . , T − 1 ▷ Normalization 3: z t ← W ∆ ( ˜ ∆ t − µ ∆ ) for t = 1 , . . . , T − 1 4: ℓ temp ( t ) ← − 1 2 ( d log (2 π ) + ∥ z t ∥ 2 2 ) for t = 1 , . . . , T − 1 5: s temp ← min { ℓ temp ( t ) } T − 1 t =1 6: return s temp 14 Algorithm 5 ST ALL Calibration Require: Calibration set C = { c ( i ) } N c i =1 of N c videos, each with T frames, encoder E 1: Encode all frames fr om calibration set: 2: for i = 1 to N c do 3: x ( i ) t ← E ( f ( i ) t ) for t = 1 , . . . , T i 4: end for 5: Compute spatial whitening parameters: 6: X spat ← ∅ 7: for i = 1 to N c do 8: Sample one frame: x ∼ Uniform ( { x ( i ) t } T i t =1 ) 9: X spat ← X spat ∪ { x } 10: end for 11: ( µ, W ) ← C O M P U T E W H I T E N I N G T R A N S F O R M ( X spat ) ▷ Algorithm 2 12: Compute temporal whitening parameters: 13: X temp ← ∅ 14: for i = 1 to N c do 15: for t = 1 to T i − 1 do 16: ∆ t ← x ( i ) t +1 − x ( i ) t 17: ˜ ∆ t ← ∆ t ∥ ∆ t ∥ 2 18: X temp ← X temp ∪ { ˜ ∆ t } 19: end for 20: end for 21: ( µ ∆ , W ∆ ) ← C O M P U T E W H I T E N I N G T R A N S F O R M ( X temp ) ▷ Algorithm 2 22: Compute calibration scor e distributions: 23: for i = 1 to N c do 24: s ( i ) spat ← C O M P U T E S PA T I A L S C O R E ( { x ( i ) t } T i t =1 , µ, W ) ▷ Algorithm 3 25: s ( i ) temp ← C O M P U T E T E M P O R A L S C O R E ( { x ( i ) t } T i t =1 , µ ∆ , W ∆ ) ▷ Algorithm 4 26: end for 27: S spat ← { s ( i ) spat } N c i =1 28: S temp ← { s ( i ) temp } N c i =1 29: return µ, W, µ ∆ , W ∆ , S spat , S temp Algorithm 6 ST ALL Inference Require: T est video v = { f t } T t =1 , encoder E , calibration parameters µ, W, µ ∆ , W ∆ , S spat , S temp 1: // Encode all frames fr om test video 2: x t ← E ( f t ) for t = 1 , . . . , T 3: Compute spatial and temporal scor es: 4: s spat ← C O M P U T E S PA T I A L S C O R E ( { x t } T t =1 , µ, W ) ▷ Algorithm 3 5: s temp ← C O M P U T E T E M P O R A L S C O R E ( { x t } T t =1 , µ ∆ , W ∆ ) ▷ Algorithm 4 6: Compute percentile r anks from calibr ation distributions: 7: perc spat ← 1 N c |{ s ∈ S spat : s ≤ s spat }| 8: perc temp ← 1 N c |{ s ∈ S temp : s ≤ s temp }| 9: Combine percentiles for final detection scor e: 10: s video ← 1 2 ( perc spat + perc temp ) 11: return s video A.2. Implementation details All of our e xperiments are conducted using Intel Core i9-7940X CPU and NVIDIA GeForce R TX 3090 GPU. For our method we use DINOv3 [ 71 ] as our encoder, av ailable at DINOv3 repository . For all competing methods, we rely on the of ficial 15 implementations when av ailable, otherwise, we implement the corresponding baselines. For AEROBLADE [ 68 ], we use the official implementation available at AER OBLADE repository . Since no official im- plementation is a vailable for RIGID [ 42 ], we implement the method using the DINO [ 19 ] model. As there is no official implementation for ZED [ 28 ] either, we follow the lossless compression setup based on SReC [ 18 ]. ZED introduces four separate criteria, and we report results for the ∆ 01 criterion. For AIGVDet [ 5 ] and T2VE [ 1 ], we use the official code and pretrained weights released by the authors, a vailable at AIGVDet repository and T2VE repository , respecti vely . For D3 [ 93 ], we rely on the official implementation at D3 repository , and use DINOv3 as the encoder . A.3. Comparison Methodology A.3.1. V ideo Preprocessing In all of our e valuations, we filter out videos that are shorter than 2 seconds or hav e a frame rate belo w 8 FPS to ensure sufficient temporal co verage and quality . After filtering, we subsample frames to achieve a tar get frame rate of 8 FPS. Gi ven an original frame rate f orig and target rate f target = 8 FPS, we compute the sampling ratio r = f orig /f target and select e very r -th frame (approximately). Specifically , we maintain a continuous position that advances by r at each step, selecting the frame at the rounded position: i 0 = 0 , i j = round ( r · j ) , j = 1 , 2 , . . . subject to i j < N , where N is the total number of frames of the original video. When f orig is perfectly divisible by f target (i.e., r is an integer), this reduces to uniform sampling of every r -th frame. For non-integer ratios, this approach selects frames with approximately uniform temporal spacing that best approximates the target frame rate. The corresponding Python implementation is provided belo w: def downsample_frames(num_frames, current_fps, target_fps=8): """Downsample frame indices to achieve target fps.""" ratio = current_fps / target_fps indices = [] j = 0 while True: frame_idx = round (ratio * j) if frame_idx >= num_frames: break indices.append(frame_idx) j += 1 return indices Unless stated otherwise, all videos in our e xperiments were sampled at 8 FPS and truncated to 2 seconds, yielding 16 frames per video. A.3.2. Pairwise Comparison Pr otocol W e conduct systematic pairwise comparisons between synthetic videos from each generativ e model and authentic videos. T o ensure fair metric comparisons and to address data imbalance, we implement a balanced sampling procedure where we use equal numbers of real and generated videos, determined by the smaller class in each split. For each generati ve model M i with N i synthetic videos, we sample exactly N i authentic videos from our real video datasets. Specifically , in the V ideofeedback benchmark [ 40 ], the real videos are drawn from tw o datasets [ 3 , 25 ]. T o pre vent bias from ov er-representation of any specific real dataset source, we sample an equal number of videos from both sources such that their total equals N i . A.4. D3 Baseline Evaluation W e identified two systematic dif ferences between D3’ s [ 93 ] official ev aluation protocol and ours that explain the performance gap reported in the main paper . 16 A.4.1. Unbalanced test set When fewer than 1000 synthetic videos are av ailable, 1000 real videos are compared against fewer synthetic samples (on GenV ideo [ 23 ], this is most notably the case with Sora [ 62 ], which contains only 56 samples). A verage Precision (AP) is sensitiv e to class imbalance and tends to inflate. Our pairwise comparison protocol (Section A.3.2 ) uses equal numbers of real and generated videos to ensure unbiased ev aluation. A.4.2. FPS upsampling by frame duplication In the GenV ideo [ 23 ] benchmark, the MSR-VTT [ 88 ] real videos provided on ModelScope are stored at only 3 FPS. D3’ s official code brings these to 8 FPS by duplicating frames. This duplication applies exclusiv ely to real videos, because the generated videos in GenV ideo are already at 8 FPS or higher . The resulting temporal redundancy inflates detection scores for methods that rely on inter-frame differences. In our ev aluation, we download high-frame-rate MSR-VTT videos and uniformly downsample them to 8 FPS, which remo ves this artifact. for more details, see Sections A.3.1 and C.2 . A.4.3. D3 Ablation Results In our main e xperiments, we ev aluated D3 using the same embedder as our method (DinoV3 [ 71 ]) for consistency . F or completeness, we no w report D3 results using X-CLIP16 [ 60 ] as embedder , as conducted in the original D3 implementation, which yields a small performance increase. T able 3 sho ws how D3 mean AP on GenV ideo varies across e valuation settings: choice of embedder, test-set balancing and sampling. Each protocol difference individually inflates AP , and their combination produces a large gap relati ve to our e valuation. T able 3. D3 [ 93 ] mean AP across ev aluation settings on GenV ideo. The two protocol dif ferences (class imbalance and FPS duplication) each inflate AP; together they fully e xplain the gap between D3’ s reported numbers and our ev aluation. Real video Sampling Downsample Upsample (Duplication) FPS ∼ 27 → 8 3 → 8 Embedder Balanced Unbalanced Balanced Unbalanced X-CLIP16 [ 60 ] 0.78 0.85 0.97 0.98 DinoV3 [ 71 ] 0.74 0.83 0.94 0.96 17 B. Normality measures and tests B.1. Normality and unif ormity tests T o assess whether the embeddings are approximately Gaussian, we apply tw o classical normality tests, Anderson–Darlin [ 2 ] and D’Agostino–Pearson [ 29 ], performed on each coordinate of the embeddings independently . Each test measures the normality of the one-dimensional vector input. Below we elaborate on each test and present results. B.1.1. Anderson-Darling normality test The Anderson-Darling (AD) test [ 2 ] can be viewed as a refinement of the classical K olmogorov-Smirnov (KS) goodness-of-fit test [ 72 ], designed to put more weight on discrepancies in the tails of the distribution. Giv en a sample X = { x 1 , x 2 , . . . , x n } and a target cumulativ e distribution function (CDF) of F (in our case, a normal CDF with parameters estimated from the data), the AD statistic is defined as A 2 = − n − n X i =1 2 i − 1 n ln F ( x i ) + ln 1 − F ( x n +1 − i ) , (7) where x 1 ≤ · · · ≤ x n are the ordered sample values, F ( x ) is the CDF of the reference normal distribution, and n is the sample size. Larger values of A 2 indicate stronger de viations from normality . these values are compared to tabulated critical values to decide whether to reject the Gaussian assumption.In our setting, we follow the con ventional threshold A 2 < 0 . 752 as evidence to accept normality . T o preform this test, we used stats.anderson function from scipy python package. B.1.2. D’Agostino-Pearson T est The D’Agostino-Pearson (DP) test [ 29 ] ev aluates departures from normality by combining information about sample ske w- ness and kurtosis. Let X = { x 1 , x 2 , . . . , x n } be a univ ariate sample and let µ = 1 n P n i =1 x i denote its mean. Let m i = 1 n P n j =1 ( x j − µ ) i be the i -th centeral moment. The ske wness g 1 and kurtosis g 2 are defined as: g 1 = m 3 m 3 / 2 2 = 1 n P n i =1 ( x i − µ ) 3 1 n P n i =1 ( x i − µ ) 2 3 / 2 (8) g 2 = m 4 m 2 2 − 3 = 1 n P n i =1 ( x i − µ ) 4 1 n P n i =1 ( x i − µ ) 2 2 − 3 (9) These tw o statistics are then transformed into approximately standard normal variables Z 1 and Z 2 , and the DP test statistic is K 2 = Z 2 1 + Z 2 2 . (10) Under the null hypothesis of normality , K 2 approximately follows a chi square distribution with two degrees of freedom, so the p -value is p = 1 − F χ 2 2 ( K 2 ) , (11) where F χ 2 2 is the cumulativ e distribution function of χ 2 2 . Positive g 1 indicates right-ske wed data and negati ve g 1 left-ske wed data, while positi ve g 2 corresponds to heavy tails and negati ve g 2 to light tails. As g 1 and g 2 approach zero, the test statistic K 2 decreases and the p -v alue increases, which is consistent with normality; in practice we treat p > 0 . 05 as compatible with a Gaussian distribution. W e performed this test using the stats.normaltest function from the scipy Python package. B.1.3. Results T o obtain stable estimates of normality , we randomly sample 40 independent groups of 250 embeddings each from the V A TEX [ 82 ] calibration set, for both frame embeddings and frame embedding dif ferences. As described and used in the main paper, we employ DINOv3 [ 71 ] as the frame lev el embedder , whose embedding space is 1024 dimensional. For ev ery group and ev ery coordinate, we apply the Anderson Darling (AD) and D’Agostino Pearson (DP) normality tests. W e then aggregate the outcomes in two separate ways: (i) we av erage the test statistics across all coordinates and groups, and (ii) we compute the fraction of coordinates whose av erage statistic satisfies the normality thresholds ( A 2 < 0 . 752 for AD, p > 0 . 05 for DP). As summarized in T able 4 , raw frame embeddings x t show high proportions of coordinates passing both tests, and whitening further increases these fractions. In contrast, raw temporal dif ferences ∆ t are strongly non-Gaussian, with essentially no coordinates passing either criterion. After ℓ 2 normalization, temporal differences ˜ ∆ t exhibit high pass rates, and an additional whitening step z t yields almost all coordinates satisfying both normality thresholds. 18 T able 4. Normality tests. Results of Anderson Darling (AD) and D’Agostino Pearson (DP) normality tests for different representations on the V A TEX [ 82 ] calibration set. “ A vg Score” is the mean test statistic across embedding coordinates and groups, “Threshold” specifies the acceptance condition for normality , and “Normal Features” is the percentage of coordinates satisfying that condition. Representation T est A vg Score Threshold Normal Features ( ↑ ) approximately gaussian? Raw embeddings x t AD 0.4750 < 0 . 752 96.3% ✓ DP 0.3931 > 0 . 05 99.2% ✓ Whitened embeddings y t AD 0.5034 < 0 . 752 98.2% ✓ DP 0.3207 > 0 . 05 99.3% ✓ T ransition vector ∆ t = x t +1 − x t AD 3.3992 < 0 . 752 0.0% ✗ DP 0.0093 > 0 . 05 0.0% ✗ ℓ 2 Normalized transition vector ˜ ∆ t AD 0.4134 < 0 . 752 98.4% ✓ DP 0.4752 > 0 . 05 99.9% ✓ Whitened ℓ 2 normalized transition vector z t AD 0.4119 < 0 . 752 99.6% ✓ DP 0.4648 > 0 . 05 100.0% ✓ B.2. Histogram comparisons B.2.1. Raw vs. normalized temporal differences T o qualitati vely illustrate these findings, Figure 9 presents histograms of temporal differences for the first four embedding dimensions of DINOv3 [ 71 ], computed from all adjacent frame pairs in the V A TEX [ 82 ] calibration set. The left column shows raw temporal dif ferences (Raw ∆ t ), which exhibit significant deviations from the ov erlaid Gaussian distributions. In contrast, the right column shows ℓ 2 -normalized temporal differences (Normalized ∆ t ), which align closely with their corre- sponding Gaussian fits. This visual demonstration confirms the quantitative results in T able 4 : ℓ 2 normalization transforms non-Gaussian temporal differences into approximately Gaussian distrib utions. B.2.2. Real and AI-generated videos embeddings T o further illustrate the statistical properties of the embedding space, we visualize the univ ariate feature distrib utions of em- beddings e xtracted from real and generated videos. Figure 10 sho ws histograms for the first four dimensions of DINOv3 [ 71 ] embeddings, computed from randomly sampled frames from real and generated videos in the GenV ideo [ 23 ] dataset. For each dimension, we ov erlay a Gaussian distribution fitted using the empirical mean and v ariance of the data (i.e., a moment-matched Gaussian). The empirical distributions closely follow the corresponding Gaussian curves for both real and generated samples. While the means and variances differ slightly between real and generated content, the overall shapes remain approximately Gaussian. These visualizations provide additional qualitativ e support for modeling the embedding dimensions using Gaussian statistics, which underlies the likelihood formulation used in our method. B.3. Maxwell Poincar e Lemma Lemma 1 (Maxwell-Poincar ´ e [ 31 ]) . Let U d be uniform on S d − 1 and fix k ∈ N . Then √ d ( U d, 1 , . . . , U d,k ) ⇒ N (0 , I k ) ( d → ∞ ) . (12) The rate at which this con vergence occurs w as quantified by Diaconis and Freedman [ 32 ]: Theorem 2 (Maxwell-Poincar ´ e con vergence rate[ 32 ]) . If 1 ≤ k ≤ d − 4 , then d TV √ d ( U d, 1 , . . . , U d,k ) , Z ≤ 2( k + 3) d − k − 3 , (13) wher e Z ∼ N (0 , I k ) . Note that both Lemma 1 and Theorem 2 extend naturally to arbitrary coordinate selections, or more generally to an y k - dimensional orthonormal projection of U d . When norms exhibit concentration behavior , an analogous result can be estab- lished: 19 Lemma 3 (Maxwell–Poincar ´ e with norm concentration) . Let U d be as in Lemma 1 and fix k ∈ N . Let z d = r d U d with r d ≥ 0 . If r d P − − − → d →∞ r 0 , then r d √ d ( U d, 1 , . . . , U d,k ) ⇒ N 0 , r 2 0 I k ( d → ∞ ) . (14) This is obtained by combining the Maxwell–Poincar ´ e limit with radial concentration and applying Slutsky’ s theorem [ 77 ]. Figure 11 visualizes the distribution of the first coordinate of U d , a random vector uniformly distrib uted on S d − 1 , for sev eral dimensions d . As d increases, this distribution approaches the standard normal distrib ution. Figure 12 sho ws histograms of cosine similarities ov er all unordered pairs of 3 k 0 randomly sampled normalized temporal differences ˜ ∆ t ⊂ R 1024 from the V A TEX [ 82 ] calibration set and of 3 k points drawn uniformly from S 1023 . 20 Figure 9. Raw vs. Normalized T emporal Difference Histograms. Histogram comparison of raw temporal differences (Raw ∆ t , left) versus normalized temporal dif ferences (Normalized ∆ t , right) for the first four dimensions of DINOv3 [ 71 ] embeddings, computed from all adjacent frame pairs in the V A TEX [ 82 ] calibration set. Red curves show Gaussian distributions fitted using the empirical mean and variance of the data (i.e., a moment-matched Gaussian). Even under this moment-matched fit, raw differences exhibit clear de viations from Gaussianity , while normalized differences closely match Gaussian distributions across all dimensions. 21 Figure 10. Real and AI-generated videos embeddings. Histograms of selected embedding dimensions from DINOv3 [ 71 ] features extracted from randomly sampled frames in the GenV ideo [ 23 ] dataset. The left column corresponds to real videos, and the right column corresponds to generated videos. Red curves show Gaussian distributions fitted using the empirical mean and variance of each feature dimension. 22 Figure 11. Uniformity on the sphere and Gaussian distribution. Histograms of the first coordinate of U d , where U d is uniformly distributed on the d -dimensional unit sphere S d − 1 , shown for se veral v alues of d and overlaid with the N (0 , 1) density . Figure 12. Uniformity on the sphere. Cosine similarity distributions over all unordered pairs of 3 k randomly sampled normalized temporal differences ˜ ∆ t from the V A TEX [ 82 ] calibration set and 3 k points drawn uniformly from the unit sphere. 23 C. Datasets C.1. ComGenV id benchmark for full statistics of our ComGenV id benchmark, refer to table 5 MSVD Dataset. W e obtained the complete MSVD dataset [ 21 ] from the sarthakjain004 Kaggle repository using the kaggle command line interface: kaggle datasets download -d sarthakjain004/msvd-clips --unzip W e sampled 1.7k videos with 2 seconds length from this dataset. The complete set of sampled videos is listed in msvd sampled videos.csv . Generative Model V ideos. T o ensure fair comparison, we sampled 1.7k videos from both Sora [ 16 ] and V eo3 [ 36 ] to match the MSVD dataset size. V eo3 Sampling. W e randomly selected 1.7k videos from the ShareV eo3 dataset [ 81 ], a v ailable on the W enhaoW ang Hugging Face repository , and can be do wnload with the following python script: # pip install huggingface_hub[hf_xet] from huggingface_hub import hf_hub_download for i in range (1, 51): hf_hub_download( repo_id= "WenhaoWang/ShareVeo3" , filename=f "generated_videos_veo3_tar/veo3_videos_{i}.tar" , repo_type= "dataset" ) The complete list of sampled videos is provided in veo3 sampled videos.csv . Sora Sampling. W e manually collected 1.7k videos from distinct users on the OpenAI Sora public explore feed. The complete list of sampled videos is provided in sora sampled videos.csv . T able 5. Overview of video sour ces and characteristics in the ComGenV id dataset. V ideo Source T ype Length Range Length (Mean±Std) Resolution Number of Pixels (Mean±Std) FPS (Mean±Std) T otal Count MSVD [ 21 ] Real 2-60s 9.68±6.27s 160×112-1920×1080 0.29±0.35M 29.1±8.6 1700 Sora [ 62 ] Fak e 4-20s 6.01±2.26s 480×480-720×1080 0.36±0.05M 30.0±0.0 1700 VEO3 [ 36 ] Fak e 8s 8.00±0.00s 1280×720 0.92±0.00M 24.0±0.0 1700 T otal Count - - - - - - 5100 C.2. GenV ideo W e obtained the AI-generated videos for GenV ideo [ 23 ] from the official ModelScope collection . Because the MSR- VTT [ 88 ] real videos a vailable on ModelScope are limited to 3 FPS, we do wnloaded the original MSR-VTT dataset from the khoahunhtngng Kaggle repository to access higher-frame-rate v ersions. All e v aluated videos are uniformly sampled at 8 FPS for a 2-second duration (16 frames). The only exceptions are HotShot-XL and MoonV alley [ 46 , 58 ], which produce clips shorter than 2 seconds, these are compared against real 1-second videos at 8 FPS (8 frames). Generativ e models that produce less than 2-second clips are excluded from the ablation study . Because MSR-VTT contains f ar more real videos (10k) than any generativ e model, we selected 1.4k videos from it, follo wing our pairwise comparison protocol (Section A.3.2 ). Comprehensi ve GenV ideo benchmark statistics are provided in T able 6 . C.3. V ideoFeedback W e gather the V ideofeedback [ 40 ] dataset from the official Hugging Face repository . W e ev aluate only videos that are at least 2 seconds long, e xcept for HotShot-XL [ 46 ], which generates 1 s clips and is therefore compared against real 1 s videos at 8 FPS (8 frames). in the original paper [ 40 ], each clip is assigned a dynamic-de gree score (1–4) indicating ho w clearly its 24 T able 6. Comprehensiv e statistics of the GenVideo [ 23 ] dataset used in our ev aluations. V ideo Source T ype Length Range Length (Mean±Std) Resolution Number of Pixels (Mean±Std) FPS Range FPS (Mean±Std) T otal Count MSR-VTT [ 88 ] Real 10-30s 14.80±5.04s 320×240 0.08±0.00M 10-30 27.3±3.3 1400 Crafter [ 22 ] Fake 2s 2.00±0.00s 1024×576 0.59±0.00M 8 8.0±0.0 188 Gen2 [ 34 ] Fake 4s 4.00±0.00s 896×504-1408×768 0.77±0.31M 24 24.0±0.0 1380 Lavie [ 84 ] Fake 2-3s 2.27±0.27s 512×320 0.16±0.00M 8-24 16.0±8.0 1400 ModelScope [ 79 ] Fake 4s 4.00±0.00s 448×256-1280×720 0.70±0.36M 8 8.0±0.0 700 MorphStudio [ 59 ] Fake 2s 2.00±0.00s 1024×576 0.59±0.00M 8 8.0±0.0 700 Show 1 [ 90 ] Fake 4s 3.62±0.00s 576×320 0.18±0.00M 8 8.0±0.0 700 Sora [ 62 ] Fake 9-60s 16.78±10.96s 512×512-1920×1088 1.43±0.65M 30 30.0±0.0 56 W ildScrape [ 86 ] Fake 2-251s 7.41±18.79s 256×256-2286×1120 0.48±0.41M 8-45 16.9±9.7 529 HotShot [ 46 ] Fake 1s 1.00±0.00s 672×384 0.26±0.00M 8 8.0±0.0 700 MoonV alley [ 58 ] Fake 1.82s 1.82±0.00s 1184×672 0.80±0.00M 50 50.0±0.0 626 T otal Count - - - - - - - 8379 motion can be distinguished from a static image. W e retain only the highest-scoring videos (le vels 3–4). for the full statistics of the V ideoFeedback benchmark, refer to T able 7 . T able 7. Comprehensiv e statistics for the V ideoFeedback [ 40 ] benchmark used in our evaluations. V ideo Source T ype Length Range Length (Mean±Std) Resolution Number of Pixels (Mean±Std) FPS Range FPS (Mean±Std) T otal Count DiDeMo [ 3 ] Real 3s 3.00±0.00s 352×288-640×1138 0.27±0.09M 8 8.0±0.0 1861 Panda70M [ 25 ] Real 2-3s 2.38±0.48s 384×288-640×360 0.23±0.01M 8 8.0±0.0 1861 AnimateDiff [ 37 ] Fake 2s 2.00±0.00s 512×512 0.26±0.00M 8 8.0±0.0 992 Fast-SVD [ 12 ] Fake 3s 3.00±0.00s 768×432 0.33±0.00M 8 8.0±0.0 959 L VDM [ 41 ] Fake 2s 2.00±0.00s 256×256 0.07±0.00M 8 8.0±0.0 2973 LaV ie [ 84 ] Fake 2s 2.00±0.00s 256×160-512×320 0.13±0.06M 8 8.0±0.0 2789 ModelScope [ 79 ] Fake 2s 2.00±0.00s 256×256 0.07±0.00M 8 8.0±0.0 3722 Pika [ 64 ] Fake 3s 3.00±0.00s 768×640 0.49±0.00M 8 8.0±0.0 1906 Sora [ 62 ] Fake 2-3s 2.73±0.27s 512×512-1920×1088 1.25±0.58M 8 8.0±0.0 898 T ext2V ideo [ 51 ] Fake 2s 2.00±0.00s 256×256 0.07±0.00M 8 8.0±0.0 3722 V ideoCrafter2 [ 24 ] Fake 2s 2.00±0.00s 512×320 0.16±0.00M 8 8.0±0.0 3543 ZeroScope [ 20 ] Fake 3s 3.00±0.00s 256×256 0.07±0.00M 8 8.0±0.0 2022 Hotshot-XL [ 46 ] Fake 1s 1.00±0.00s 512×512 0.26±0.00M 8 8.0±0.0 2736 T otal Count - - - - - - - 29984 C.4. V A TEX (Calibration set) W e obtained the V A TEX dataset [ 82 ] from the khaledatef1’ s Kaggle repositories. The dataset is distributed across three parts: V atex 1 , V atex 2 , and V atex 3 . W e downloaded all parts using the Kaggle command-line interface: kaggle datasets download -d khaledatef1/vatex0110 --unzip kaggle datasets download -d khaledatef1/vatex01101 --unzip kaggle datasets download -d khaledatef1/vatex011011 --unzip For the complete statistics of V A TEX [ 82 ] calibaration set, see T able 8 . T able 8. Comprehensiv e statistics of the V A TEX [ 82 ] calibration set. V ideo Source T ype Length Range Length (Mean±Std) Resolution Number of Pixels (Mean±Std) FPS Range FPS (Mean±Std) T otal Count V A TEX [ 82 ] Real 2-10s 9.68±1.10s 128×88-720×1280 0.44±0.37M 8-30 27.2±5.0 33976 T otal Count - - - - - - - 33976 C.5. Other datasets W e collected approximately 1.5k real videos from Kinetics400 [ 50 ] and PE [ 13 ]. The Kinetics400 clips were taken from the test split av ailable in the cvdfoundation repository , while the PE videos were downloaded from the Facebook PE Hugging 25 Face page. These datasets were used exclusi vely for the calibration set ablation experiment reported in Fig. 6(c) in the main paper . A detailed specification of this calibration set configuration is provided in T able 9 . A complete list of the sampled videos is provided in pe kinetics400 sampled videos.csv . T able 9. Comprehensiv e statistics of the Kinetics+PE calibration set. V ideo Source T ype Length Range Length (Mean±Std) Resolution Number of Pixels (Mean±Std) FPS Range FPS (Mean±Std) T otal Count Kinetics400 [ 50 ] Real 2-10s 9.62±1.19s 128×96-1280×720 0.55±0.38M 24-30 26.9±3.0 1496 PE [ 13 ] Real 5-60s 16.49±9.37s 608×254-608×1152 0.21±0.03M 24-60 37.7±14.5 1500 T otal Count - - - - - - - 2996 D. Additional results and experimental details Unless stated otherwise, all ablation studies are conducted on the GenV ideo [ 23 ] benchmark, restricted to generative-model videos sampled at 8 FPS and 2 seconds duration (16 frames). The only exceptions are HotShot-XL and MoonV alley [ 46 , 58 ], which generate videos shorter than 2 seconds and are therefore omitted from our ablation experiments. W e use DINOv3 [ 71 ] as the frame-lev el embedder and the V A TEX [ 82 ] dataset as the calibration set. D.1. Deri vative order ablations W e isolate the effect of higher -order temporal differences by keeping the entire ST ALL pipeline fixed and changing only the temporal deriv ative order D ∈ { 1 , 2 , 3 , 4 } . For each video v = { f t } T t =1 , we extract frame-wise embeddings E ( v ) ∈ R T × d , compute the D -th order finite-difference trajectory along time, and apply frame-wise ℓ 2 normalization. Importantly , we fit a separate whitening transform for each temporal deriv ativ e order, yielding parameters ( µ ∆= i , W ∆= i ) for e very i ∈ D , estimated on the corresponding deriv ativ e trajectories from the V A TEX [ 82 ] calibration set. The temporal log-likelihood sequence for each video is aggregated using the same statistic as in the main ST ALL score, and we then av erage this tem- poral percentile with the spatial log-likelihood percentile to obtain a single score for each deriv ativ e order . An example implementation of the deriv ativ e and normalization computation is shown belo w: def differences_vec(features): return features[:, 1:, :] - features[:, :-1, :] def temporal_diff_with_order(features, derivative_order: int ): """ Apply a temporal finite-difference operator of the given order to frame-wise embeddings and L2-normalize the result. Args: frame_embeddings: array of shape [N, T, d] derivative_order: positive integer order of the derivative Returns: Array of shape [N, T - derivative_order, d]. """ if derivative_order < 1: raise ValueError( "derivative_order must be positive" ) for _ in range (derivative_order): features = differences_vec(features) norms = np.linalg.norm(features, axis=-1, keepdims=True) + 1e-8 return features / norms Ablation results across all deri vati ve orders, including A UC, Pearson correlation, and Spearman correlation, are summarized in Figure 13 . All deri vati ve orders are strongly correlated and produce v ery similar performance. 26 (a) A UC - different deri vativ e orders. (b) Pearson correlation. (c) Spearman correlation. Figure 13. Ablations on temporal derivative order . ST ALL performance for different temporal deriv ativ e orders D ∈ { 1 , 2 , 3 , 4 } : (a) A UC across orders, (b) Pearson correlation between scores from different orders, and (c) Spearman correlation between scores from different orders. (a) AP - different components (b) A UC - different components Figure 14. Components ablation. Bar plots of spatial-only , temporal-only , and combined detectors, using both ra w scores and percentile- ranked scores. Spatial and T emporal denote single-branch detectors, and Combined refers to the fused Spatial and T emporal detector . Configurations labeled with “P” use percentile-ranked scores, where “P” stands for percentile. “ A vg” stands for average of the two scores and “Prod” stands for the product of the two scores. D.2. spatial and temporal aggr egation methods D.2.1. Components ablation W e analyze the contribution of the spatial and temporal branches by ev aluating three detector variants: a spatial-only model, a temporal-only model, and a combined model that fuses both branches. For each variant, we consider raw scores and percentile-ranked scores, and for the combined model we also test mean-based and product-based fusions of the spatial and temporal percentile scores. For every configuration, we report the av erage AP and A UC across all three benchmarks. See results in Fig. 14 . D.2.2. Aggr egation ablation T o analyze the effect of the frame-lev el aggregation operators, we fix our pipeline as defined in the main paper and vary only the frame-le vel aggregation used within each branch. W e sweep over min , mean , and max for both the spatial and temporal components. For each spatial and temporal aggreg ation pair , we compute the average A UC and AP across all three benchmarks and report the resulting scores as heatmaps in Supp. Fig. 15 . D.3. Sampling a single frame differ ence for temporal whitening In this ablation, we test whether temporal whitening requires all frame-to-frame transitions or can be reliably estimated from a single transition per video. W e keep the spatial branch (and its whitening transform) fixed, and re-compute the temporal whitening statistics ( µ ∆ , W ∆ ) twice on the calibration set: (i) using all normalized frame dif ferences from all videos, and (ii) 27 (a) AP for different spatial and temporal aggrega- tion pairs. (b) A UC for dif ferent spatial and temporal aggrega- tion pairs. Figure 15. Frame-level aggregation ablation. Heatmaps of AP and A UC, for different combinations of spatial and temporal frame-lev el aggregation operators. Rows correspond to the spatial aggregation and columns to the temporal aggregation, while all other parts of the pipeline follow the def ault configuration described in the main paper . Figure 16. T emporal scores under temporal perturbations. Each condition applies a different perturbation to 400 real MSR-VTT videos: Original (no perturbation), Re versed (frames in re verse order), Shuf fle (consecuti ve frames shuf fled), Black flash (one black frame inserted mid-video), and White flash (one white frame inserted mid-video). The temporal likelihood is largely unaf fected by rev ersal and shuf fling, since adjacent-frame difference statistics are preserved; ho wever , abrupt flash frames cause a strong drop in the score, with white flashes producing a larger de gradation than black flashes. using only one randomly sampled frame difference per video. Re-ev aluating the combined score under these two temporal- whitening calibration variants yields essentially the same performance, with av erage A UC 0.8110 and av erage AP 0.8046 for (i) and av erage A UC 0.8105 and av erage AP 0.8044 for (ii) (Pearson correlation 0.9994 , Spearman correlation 0.9992 between (i) and (ii)), indicating that our temporal whitening is robust to the number of transitions used from each video for its estimation. D.4. T emporal likelihood under temporal perturbations W e analyze the temporal likelihood under realistic perturbations: reversing frame order (rewind), shuffling consecutiv e frames, and inserting black or white frames, representing data transmission issues [ 89 ]. As shown in Figure 16 , the method is robust to reversal and shuffling, since the score depends only on statistics of adjacent-frame dif ferences, which are largely pre- served under these operations. In contrast, inserting a flash frame introduces an abrupt temporal inconsistency that strongly reduces the likelihood. The experiment is conducted on 400 real videos from MSR-VTT [ 88 ]. The temporal likelihood is stable under common temporal distortions but responds strongly to abrupt temporal anomalies. D.5. Image perturbation experiment details T o e xplore robustness to perturbations, we apply four standard image corruptions to GenV ideo [ 23 ] frames at inference time only , keeping the calibration set fixed. W e use a reduced GenV ideo subset with 250 videos per generativ e model and corrupt e very video with each perturbation type at all fiv e predefined severity lev els. W e then measure the impact of each corruption setting on detection performance. W e additionally include lev el 0, which corresponds to uncorrupted frames (no perturbation). As sho wn in Fig. 7(b) of the main paper, ST ALL maintains strong separation across all perturbation types and sev erities. 28 T able 10. Image perturbation details. These perturbations are used in the robustness ablation (Sec. D.5). Levels 1–5 span the full range of corruption strength for each type; lev el 0 corresponds to no perturbation. Perturbation Implementation Sev erity lev els (1 → 5) Gaussian blur TF.gaussian blur ( r , σ, k ) = { (1 , 0 . 5 , 3) , (2 , 1 . 0 , 5) , (3 , 1 . 5 , 7) , (5 , 2 . 5 , 11) , (10 , 5 . 0 , 21) } JPEG compression PIL.save(..., JPEG quality format="JPEG", quality) q ∈ { 80 , 50 , 30 , 10 , 1 } Random resized crop transforms.RandomResizedCrop scale ranges { (0 . 85 , 0 . 9) , (0 . 7 , 0 . 85) , (0 . 5 , 0 . 8) , (0 . 3 , 0 . 9) , (0 . 08 , 1 . 0) } Gaussian noise torch.randn like , torch.clamp σ ∈ { 0 . 02 , 0 . 05 , 0 . 1 , 0 . 2 , 0 . 5 } The specific parameter settings for each perturbation type and lev el are summarized in T ab. 10 . Gaussian blur sev erity is controlled by the blur radius r , with larger r producing stronger smoothing. JPEG compression reduces the image quality parameter , where lower quality introduces stronger compression artifacts. The random resized crop perturbation is parameter- ized by scale ranges, where a random crop is sampled at each application: sometimes remo ving more content and sometimes less. Higher sev erity lev els use wider ranges with smaller minimum scales, increasing the chance of more aggressiv e crops. Gaussian noise se verity is adjusted by increasing the standard deviation of zero-mean noise added to each frame, which progressiv ely degrades fine texture while preserving global structure. Perturbation examples can be found in Figs. 17 and 18 . D.6. Additional experimental details D.6.1. Step size ablation T o assess sensiti vity to temporal sampling rate, we vary the frame step size applied to videos already sampled at 8 FPS. For step size s ∈ { 1 , 2 , 3 , 4 } , we subsample ev ery s -th frame from all videos, reducing the effecti ve frame rate by a factor of s (yielding 8, 4, 2.67, and 2 FPS respecti vely). Specifically , this subsampling is applied uniformly to both the V A TEX [ 82 ] calibration set used to estimate the whitening transform and to the GenV ideo [ 23 ] test videos being ev aluated. W e then compute the combined spatial and temporal score using these subsampled sequences. From another perspecti ve, the setup can be vie wed as using a lar ger temporal stride of s between successi ve differences, without o verlap between stride se gments in the original video. This ablation tests whether the detector remains robust when operating at lower effecti ve frame rates, which is relev ant for computational efficienc y . The av erage A UC results are shown in Fig. 8(a) of the main paper . D.6.2. FPS ablation T o ev aluate rob ustness to different frame rates, we subsample only the inference videos while keeping the whitening transform fixed (estimated on V A TEX [ 82 ] at 8 FPS as in all other experiments). W e select videos from GenV ideo [ 23 ] that are originally at 24 FPS with at least 2 seconds duration (425 videos from Gen2 [ 34 ], 425 from Lavie [ 84 ], and 42 from WildScrape [ 86 ], and a matching number of real videos from MSR-VTT [ 88 ]), isolating the ef fect of frame rate from other factors. In contrast to our standard 8 FPS setup, in this experiment we do wnsample the videos to tar get frame rates in { 2 , 4 , 8 , 12 , 24 } FPS using exact subsampling. The downsampling factor and tar get frame rate are chosen such that current fps target fps = n ∈ N , so the do wnsampled sequence is obtained by retaining ev ery n -th frame. This ensures deterministic frame selection without approximations. The score is computed on the do wnsampled sequences. Results, summarized in Fig. 8(c) of the main paper , show that performance is essentially unchanged across this range of frame rates, indicating that our method is robust to frame rate variation and that calibrating the whitening transform at 8 FPS does not de grade inference at other frame rates. 29 Original Sev erity level 1 2 3 4 5 Gaussian blur JPEG compression Random resized crop Gaussian noise Figure 17. Perturbations example. mandrill. D.6.3. Length of video ablation T o ev aluate robustness to video length, we follow a procedure similar in nature to the FPS ablation. W e select videos from GenV ideo [ 23 ] that were originally 4 seconds in duration (1380 videos from Gen2 [ 34 ], 700 from ModelScope [ 79 ], 214 from W ildScrape [ 86 ], 56 from Sora [ 62 ], and 1400 real videos from MSR-VTT [ 88 ]), and then truncate each to { 1 , 2 , 3 , 4 } seconds. The whitening transform remains fixed throughout (estimated on V A TEX [ 82 ] at 2 seconds as in all other experi- ments). The score is then computed on these truncated videos. Results, sho wn in Fig. 8(b) of the main paper , demonstrate that our method remains robust across this range of video durations, indicating that calibrating at 2 seconds does not degrade performance on shorter or longer clips. D.6.4. Backbone encoders ablation T o assess the impact of the feature extractor , we ev aluate ST ALL with five dif ferent backbone encoders: three image- based encoders and two video-based encoders. For image encoders, we use DINOv3 [ 71 ] ( dinov3 vitl16 ), the lightweight MobileNetV3 [ 47 ] ( mobilenetv3 large 100 from timm python pacagke), and ResNet-18 [ 39 ] (from torchvision.models ). For video encoders, we test V ideoMAE [ 75 ] ( MCG-NJU/videomae-base ) and V iCLIP [ 83 ] ( OpenGVLab/ViCLIP-L-14-hf ), both from HuggingFace. All encoders are used with pretrained weights, and for im- age encoders we extract per-frame features and apply them independently to each frame in the video sequence. Results are presented in T able 2 of the main paper . 30 Original Sev erity level 1 2 3 4 5 Gaussian blur JPEG compression Random resized crop Gaussian noise Figure 18. Perturbations example. Sailboat on lake. D.6.5. Calibration set size T o e v aluate the sensitivity of our method to the size of the calibration set used for estimating the whitening transform, we systematically vary the number of videos sampled from V A TEX [ 82 ]. W e test calibration set sizes ranging from 1,000 to the full V A TEX dataset (33,976 videos) in increments of 1,000 videos, ev aluating each configuration across 5 random seeds to ensure statistical reliability . For each calibration set size, we randomly sample the specified number of videos from V A TEX, estimate the whitening parameters on this subset, and then ev aluate the resulting detector on the GenV ideo [ 23 ] benchmark. All other pipeline components remain fixed, results are presented in Fig. 7(a) of the main paper . D.6.6. Calibration set sour ces T o assess the impact of calibration set composition on detection performance, we ev aluate ST ALL using five different cali- bration sets drawn from div erse real video sources. W e test: (1) V A TEX [ 82 ] (33,976 videos), (2) GenV ideo [ 40 ] real subset from MSR-VTT [ 88 ] (8,584 videos, corresponding to all MSR-VTT clips excluded from the test set), (3) V ideoFeedback [ 23 ] combining DiDeMo [ 3 ] (1k videos) and Panda70M [ 25 ] (1k videos), (4) a combination of Kinetics400 (1,496 videos) and PE [ 13 ] (around 1,500 videos from each, see section C.5 for more details), and (5) a balanced hybrid set sampling 1k videos from each of the six sources: MSR-VTT , PE, Panda70M, DiDeMo, V A TEX, and Kinetics400. For each calibration set, we estimate the whitening transform using only videos from that set and ev aluate the resulting detector on the GenV ideo [ 23 ] benchmark. All other pipeline components remain fixed. Results are presented in Fig. 6(c) of the main paper . T able 11 further reports a verage A UC across all three benchmarks for each calibration source (2K videos each), confirming stable performance across calibration choices. 31 Benchmark V A TEX [ 82 ] Kinetics400 [ 50 ] DiDeMo [ 3 ] Panda-70M [ 25 ] MSR-VTT [ 88 ] V ideoFeedback [ 40 ] 0.82 0.82 0.86 0.76 0.73 GenV ideo [ 23 ] 0.78 0.77 0.76 0.83 0.83 ComGenV id 0.82 0.81 0.87 0.75 0.76 T able 11. A verage A UC for different calibration datasets across all three benchmarks. More broadly , the calibration set defines the reference feature statistics of the detector . If the test domain is not represented in the calibration set (e.g., surv eillance or aerial videos), performance may degrade, which is a limitation of the method. Con- versely , this also enables domain adaptiveness, as the detector can be adapted to a target domain by choosing an appropriate calibration set. W ithin the general video re gime studied here, we observe stable beha vior under calibration and test variation. D.7. Additional qualitati ve results Figure 19. Qualitative examples. Each row shows sampled frames from a video clip, with indicators marking whether its spatial and temporal behavior appears natural or unnatural. Figure 20. Qualitative examples. Each row shows sampled frames from a video clip, with indicators marking whether its spatial and temporal behavior appears natural or unnatural. 32 E. Efficiency analysis W e conducted a comprehensiv e efficiency analysis to ev aluate the computational performance of all detection methods, measuring model inference time and memory usage under controlled conditions. E.1. Infrence time analysis This experiment was performed on a fixed set of 20 videos. Each method ran inference on each video separately (without batching), and we repeated this process 5 times over the same video set to account for performance v ariability , yielding 100 total inference ev aluations per method. All methods were initialized before timing measurements to ensure a fair comparison. W e used Python’ s timeit.repeat function to measure execution times, defining the inference time of each method to include video load- ing. This design ensures that the measured times reflect realistic end-to-end performance, cov ering both data loading and inference. The complete inference time analysis is provided in T able 12 . T able 12. Inference time comparison f or all methods. Domain Method Mean [sec] Std [sec] Zero shot images AER OBLADE [ 68 ] 2.5266 0.0243 ZED [ 28 ] 1.1394 0.0067 RIGID [ 42 ] 0.4363 0.0024 Supervised video T2VE [ 1 ] 1.9950 0.0102 AIGVdet [ 5 ] 5.4216 0.0787 Zero-shot video D3 cos [ 93 ] 0.2157 0.0043 D3 L2 [ 93 ] 0.2220 0.0015 ST ALL (ours) 0.2230 0.0010 E.2. memory analysis T o comprehensi vely ev aluate the memory requirements of all methods, we conducted a profiling study that measures both model loading and inference memory consumption. Each method was executed in complete isolation within separate pro- cesses to eliminate any potential memory pollution or interference between measurements. W e distinguished between two critical phases: (1) model loading memory , which captures the one-time cost of initializing model parameters and load- ing them onto CPU and GPU, and (2) inference memory , which measures the runtime memory footprint during actual video processing. For each method, we repeated measurements across multiple videos (10 videos × 3 repetitions) to en- sure statistical reliability . Memory measurements were captured at two lev els: CPU memory was tracked using psutil to monitor RAM consumption, while GPU memory was measured using PyT orch’ s [ 63 ] CUD A memory tracking fa- cilities to capture peak memory usage. T o ensure measurement accuracy , we performed garbage collection and CUD A cache clearing between measurements ( gc.collect() ) and GPU cache clearing ( torch.cuda.empty cache() and torch.cuda.reset peak memory stats() ) performed between each measurement to ensure clean memory states , with deliberate delays to allow the system to stabilize. A detailed analysis of memory consumption appears in T able 13 . T able 13. Memory usage comparison for all methods domain method model loading cpu (MB) model loading gpu (MB) inference cpu peak (MB) inference gpu peak (MB) zero shot images AER OBLADE [ 68 ] 7875.93 141.02 9711.18 2624.43 ZED [ 28 ] 101.11 16.06 1707.72 310.08 RIGID [ 42 ] 142.41 327.30 1373.67 567.57 supervised video T2VE [ 1 ] 1852.16 1271.43 2795.96 140.96 AIGVdet [ 5 ] 488.77 182.59 1849.03 673.18 zero-shot video D3 cos [ 93 ] 315.64 1157.72 1470.08 160.30 D3 l2 [ 93 ] 315.61 1157.72 1416.19 160.30 ST ALL (ours) 321.21 1166.77 1647.60 160.30 33 The memory profiling results reveal significant variations in resource consumption across different detection approaches. Among zero-shot image methods, AER OBLADE [ 68 ] demonstrates substantially higher memory footprint during both load- ing and inference phases, while ZED [ 28 ] achiev es the most efficient performance. In the supervised video category , T2VE [ 1 ] requires notably more GPU memory for model loading compared to AIGVdet [ 5 ], though the latter exhibits higher inference-time consumption. Our proposed ST ALL method, alongside D3 [ 93 ], maintains a balanced and efficient memory profile with moderate CPU and GPU usage across both phases, demonstrating comparable efficienc y to existing temporal consistency zero-shot method while requiring significantly fewer resources than supervised alternativ es. W e note that all methods recei ve video data through CPU memory , which contributes to the observed inference CPU peak measurements across all approaches. 34
Original Paper
Loading high-quality paper...
Comments & Academic Discussion
Loading comments...
Leave a Comment