Noise-Response Calibration: A Causal Intervention Protocol for LLM-Judges
Large language models (LLMs) are increasingly used as automated judges and synthetic labelers, especially in low-label settings. Yet these systems are stochastic and often overconfident, which makes deployment decisions difficult when external ground…
Authors: Maxim Khomiakov, Jes Frellsen
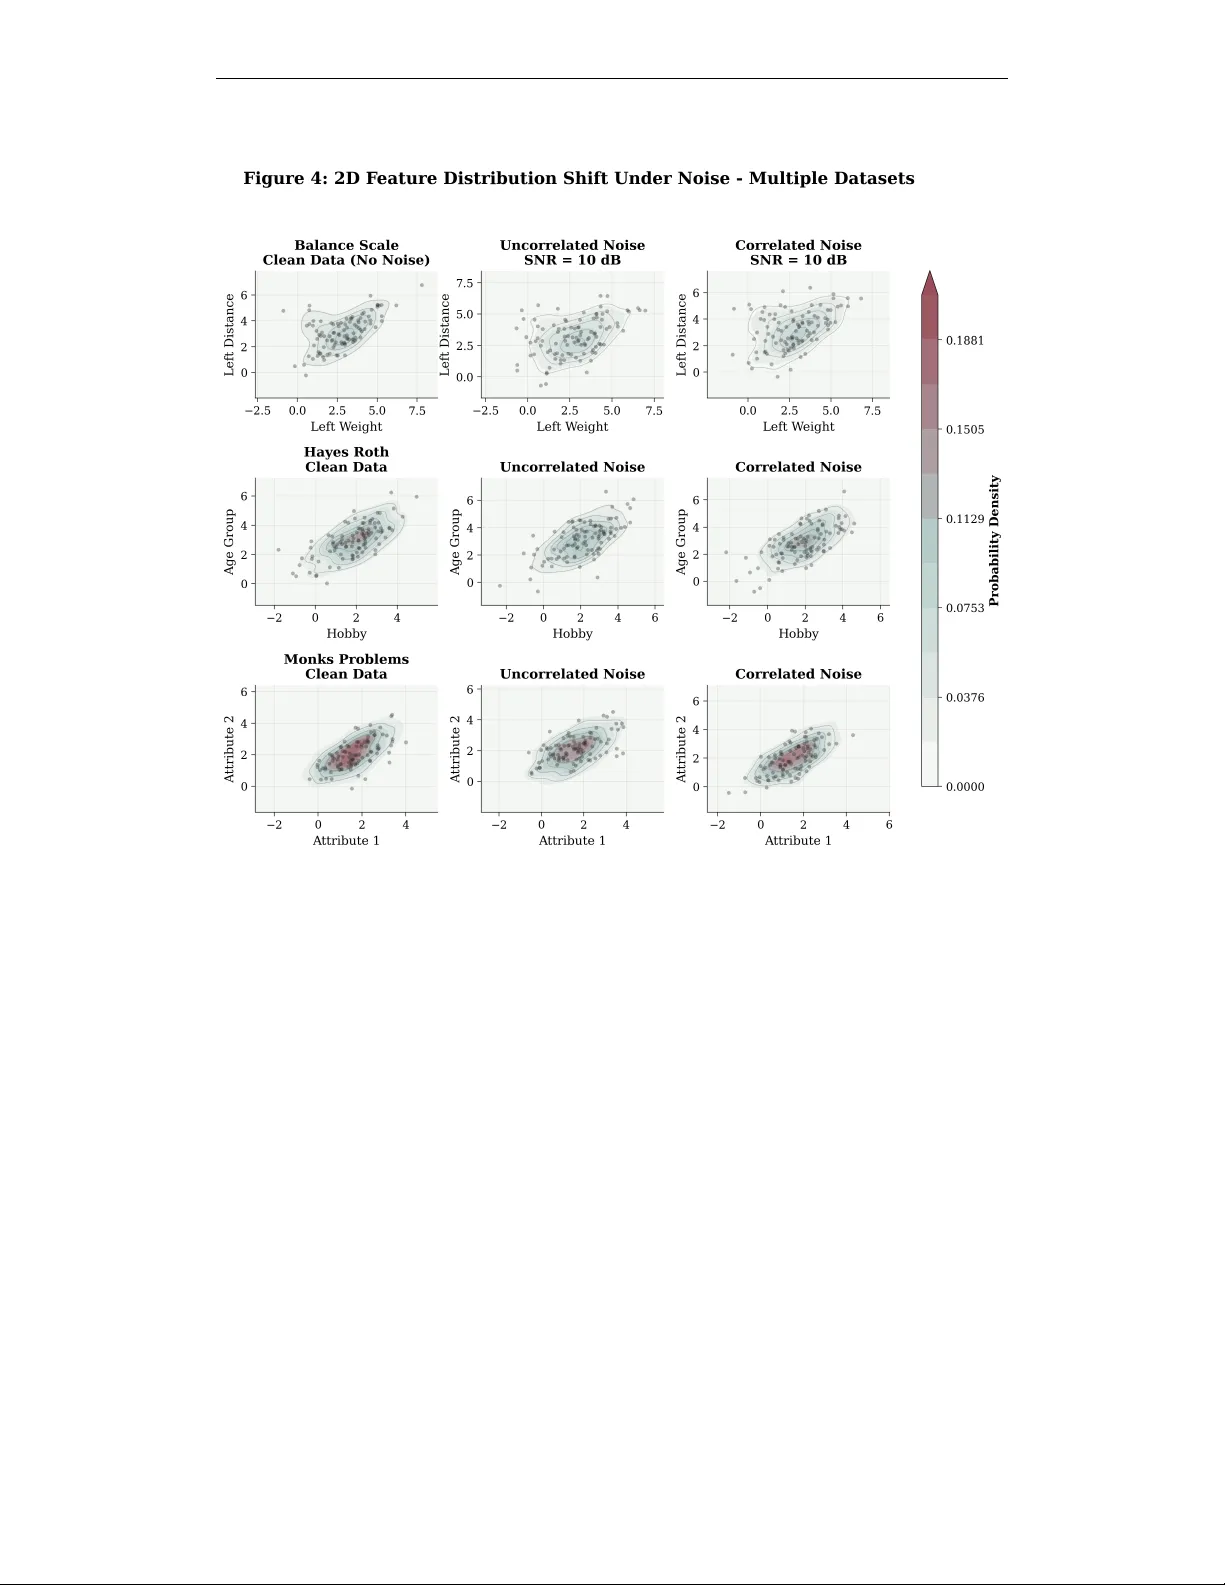
Published as a conference paper at CA O W orkshop at ICLR 2026 N O I S E - R E S P O N S E C A L I B R A T I O N : A C A U S A L I N T E R - V E N T I O N P R O T O C O L F O R L L M - J U D G E S Maxim Khomiakov 1 , 2 , 3 & Jes Fr ellsen 1 , 3 1 T echnical Uni versity of Denmark, Kgs. L yngby , Denmark 2 Normal Computing Corporation, New Y ork, NY , USA 3 Pioneer Centre for Artificial Intelligence, Copenhagen, Denmark maxim@normalcomputing.com , { maxk,jefr } @dtu.dk A B S T R A C T Large language models (LLMs) are increasingly used as automated judges and synthetic labelers, especially in low-label settings. Y et these systems are stochas- tic and often overconfident, which makes deployment decisions dif ficult when external ground truth is limited. W e propose a practical calibration protocol based on controlled input interventions: if noise se verity increases, task performance should exhibit a statistically significant deterioration trend. W e operationalize this with a slope-based hypothesis test ov er repeated trials, using signal-to-noise- ratio (SNR) perturbations for tabular data and lexical perturbations for text data. Across UCI tabular benchmarks and four te xt classification datasets, we find clear modality-dependent beha vior . Our results re veal a modality gap: while text-based judges de grade predictably , the majority of tab ular datasets show a lack of statisti- cally significant performance deterioration ev en under significant signal-to-noise reduction. Interestingly we find that model performance is lower on datasets that are insensiti ve to noise interv entions. W e present a reproducible methodology and reporting protocol for robust LLM-judge calibration under distrib ution shift. 1 I N T R O D U C T I O N High-quality labels remain costly and difficult to produce: annotation policy design, expert recruit- ment, and quality control are all substantial bottlenecks ( Gebru et al. , 2021 ; Snow et al. , 2008 ). In parallel, LLM-based pipelines now support two high-value workflows: (1) synthetic labeling, and (2) LLM-as-a-Judge decision systems for automated triage and ranking ( Liu et al. , 2023 ; Zheng et al. , 2023 ). The practical f ailure mode is not only lo w a verage quality , b ut unreliable behavior under shift: small input changes can create non-tri vial output volatility , especially when large trusted holdout labels are unav ailable ( Lin et al. , 2022 ; Huang et al. , 2025 ). Core question. Can we reject an LLM judge for a target task before deplo yment by stress-testing its response to controlled interventions? W e frame this as a causal question in the interventionist sense of Pearl ( 2009 ): apply a controlled perturbation to the input and test whether performance degrades as predicted. W e formalize a monotone-deterioration hypothesis over a calibrated noise schedule. Let P denote a task-specific performance score (e.g., accuracy for classification, R 2 for regression) measured on clean inputs, and P k the same score measured under perturbation magnitude k ∈ K , where K is ordered from weak to strong noise. Define ∆ k = P k − P . Our conceptual interv ention hypothesis is H 0 : ∃ k 1 < k 2 such that E [ P k 2 ] > E [ P k 1 ] , (1) H 1 : E [ P k 1 ] ≥ E [ P k 2 ] ∀ k 1 < k 2 , (2) with at least one strict inequality under H 1 . Here, H 0 (the null hypothesis) states that the e xpected performance is not monotone under increasing perturbation i.e., there exists at least one pair of noise magnitudes where performance improv es 1 Published as a conference paper at CA O W orkshop at ICLR 2026 despite stronger noise. H 1 (the alternativ e) encodes the expected deterioration property: as noise increases, the expected performance does not increase, and it decreases for at least one step. The expectation E [ P k ] is taken ov er the randomness in the procedure at se verity lev el k , including (i) the sampled perturbations/noise realizations and (ii) any stochasticity in the LLM inference; In practice, we operationalize this ordered alternati ve using a one-sided linear trend test (negati ve slope) as a pragmatic surrogate; thus sensitiv e indicates significant deterioration with increasing noise, which is consistent with but not equi valent to strict monotonicity . Intuitiv ely , if increasing perturbation does not induce expected deterioration, the model is either exploiting artifacts or is insuf ficiently sensitiv e to task signal, both of which reduce trust in judge- style deployment. Con versely , when the expected deterioration holds with statistical significance, we obtain a useful calibration signal about where the model can be trusted. This paper presents a reproducible methodology around this idea: a pipeline for perturbation de- sign, repeated inference, and hypothesis testing across tabular and text settings, presenting findings which indicate that employing such a methodology prior to deployment could provide an indicator of trustworthy LLM results. Overview of Contrib utions 1. W e propose a practical noise-r esponse calibration pr otocol for deciding whether an LLM judge is reliable for a specific task, based on intervention schedules and slope-based hypothesis testing. 2. W e report large-scale empirical findings spanning UCI tabular tasks and four widely used text classification datasets, performing experiments applying both correlated and uncorrelated Gaus- sian noise for tabular data and le xical noise for text. 3. W e demonstrate that for the majority of included UCI tab ular tasks, performance is lar gely insen- sitive to the tested noise schedules (i.e., it does not exhibit statistically significant deterioration as noise increases). W e discuss how this insensitivity can serve as a practical warning signal for LLM-judge deployment, complementing a verage-performance reporting. 2 R E L AT E D W O R K S Hallucination, alignment, and judge reliability . Recent work has studied hallucination mech- anisms and mitig ation strate gies in depth, including retrie val augmentation, verification, and calibration-oriented prompting ( Huang et al. , 2025 ). In parallel, alignment methods such as RLHF and constitutional training have improved instruction-follo wing behavior , but do not eliminate ro- bustness f ailures under distribution shift ( Ouyang et al. , 2022 ; Bai et al. , 2022 ). For LLM-as-a-Judge pipelines, reporting and e valuation protocol quality is itself a major source of v ariance. A central recommendation in recent methodology work is that judge results should be reported with stronger controls for prompt sensitivity , variance, and statistical uncertainty ( Lee et al. , 2026 ). Perturbation sensitivity in reasoning and NLP . Our work is closely related to perturbation-based robustness analysis. In mathematical reasoning, Mirzadeh et al. ( 2025 ) show that seemingly benign symbolic variations can induce substantial performance changes. More broadly , LLM reasoning has been shown to degrade under distractor-like or superficially irrelev ant perturbations ( Shi et al. , 2023 ). For text corruption, lexical perturbation studies demonstrate that character-le vel noise can strongly hurt model behavior ev en when semantics are mostly preserved ( Belinkov & Bisk , 2018 ; Pruthi et al. , 2019 ). Our text intervention family is inspired by this line of work but is used for trust calibration rather than adversarial training. Causal framing and benchmark context. W e adopt an intervention-based causal framing: the perturbation operator is treated as an intervention on inputs, and the downstream performance re- sponse is the measured ef fect ( Pearl , 2009 ; Peters et al. , 2017 ). This perspectiv e makes e xplicit what is being manipulated and what constitutes expected beha vior under increasing uncertainty . 2 Published as a conference paper at CA O W orkshop at ICLR 2026 Algorithm 1 Noise-response calibration protocol Require: Dataset D , noise schedule N = { n k } K k =1 , repetitions R , significance lev el α 1: Initialize LLM Judge for the prediction task and compute baseline performance P 2: for each n k ∈ N do 3: for each repetition r ∈ { 1 , . . . , R } do 4: Generate noisy inputs, query the LLM, record performance P k,r 5: end for 6: end for 7: Fit linear model P k,r = β 0 + β 1 n k + ϵ 8: Perform one-sided slope test H 0 : β 1 ≥ 0 vs. H 1 : β 1 < 0 9: Accept task-le vel trust calibration only if deterioration is significant and directionally consistent For tab ular benchmarks, we use datasets from the UCI repository ( Asuncion & Ne wman , 2007 ), one of the lar gest tabular datasets designed for ML prediction tasks, and include canonical datasets such as Iris ( Fisher , 1936 ) and Wine Quality ( Cortez et al. , 2009 ). F or text experiments we use IMDB ( Maas et al. , 2011 ), Y elp Revie w Full ( Zhang et al. , 2015 ), SST -2 ( Socher et al. , 2013 ), and Financial PhraseBank ( Malo et al. , 2014 ), datasets that all rev olve around sentiment classification tasks. 3 M E T H O D Our procedure is conceptually close to mutation testing in software engineering where one applies controlled perturbations, observes failure behavior , and decides whether a system should be trusted for deployment-critical use ( DeMillo et al. , 1978 ; Jia & Harman , 2011 ). Designing a sufficiently general noise f amily is non-tri vial and domain-dependent. The intervention f amily can miss realistic corruption patterns, so acceptance should be interpreted as conditional on the tested noise family , not as a universal robustness claim. W e treat this explicitly as a limitation and future direction (Section 6). For each dataset, we build a dynamic system prompt containing task explanation, dataset metadata, output constraints, and provide fe w shot examples as part of the input. Predictions are v alidated through a schema-constrained output parser , where one requires the answer to match the format of the label. W e present our noise-response calibration protocol in Algorithm 1. 3 . 1 T A B U L A R N O I S E V I A S N R S C H E D U L E S For tabular inputs, let X clean ∈ R N × d denote the full clean training matrix restricted to numeric cov ariates, and let x ∈ R d denote one ev aluation ro w . W e estimate the reference co v ariance once on the full clean training data, Σ signal = Cov( X clean ) , and write σ 2 j = Σ signal ,j j for the empirical vari- ance of feature j . Let D = diag( σ 2 1 , . . . , σ 2 d ) and R = Corr( X clean ) , so that Σ signal = D RD . For a target SNR dB , define α = 10 − SNR dB / 10 . This scales the noise power relati ve to the fix ed clean-data signal statistics, and we ev aluate a fixed ordered schedule from mild to strong perturbation. Our interventions operate only on numeric cov ariates; datasets with low numeric-feature coverage receiv e partial or no perturbation, and non-numeric cov ariates are preserved. W e add Gaussian noise x noisy = x + ϵ under two cov ariance structures: 1. Uncorrelated : ϵ ∼ N (0 , αD 2 ) , equiv alently ϵ ∼ N (0 , α diag( σ 2 1 , . . . , σ 2 d )) . 2. Correlated : ϵ ∼ N (0 , α Σ signal ) , equiv alently ϵ ∼ N (0 , αD RD ) . Both perturbations are zero-mean and share the same per-feature marginal variances ασ 2 j ; they dif- fer only in whether cross-feature cov ariance is suppressed (uncorrelated) or preserved according to the empirical correlation structure of the full clean training data (correlated). This lets us test whether sensitivity depends only on marginal noise scale or also on the directional structure of the perturbation. 3 Published as a conference paper at CA O W orkshop at ICLR 2026 3 . 2 T E X T D A TA S E T S W e ev aluate IMDB, Y elp Revie w Full, SST -2, and Financial PhraseBank ( Maas et al. , 2011 ; Zhang et al. , 2015 ; Socher et al. , 2013 ; W ang et al. , 2019 ; Malo et al. , 2014 ). All are classification tasks, but the y differ in domain, label granularity , and text length. Noise intervention design. For text, we focus on lexical corruption inspired by prior robust and adversarial NLP work ( Belinkov & Bisk , 2018 ; Pruthi et al. , 2019 ). While prior work primarily uses such perturbations to train or har den models against corrupted inputs, we lev erage the same mechanisms to ev aluate whether an LLM judge exhibits the expected de gradation as corruption increases. Lexical noise. Let x = ( w 1 , . . . , w T ) be a tokenized input and α ∈ [0 , 1] a sev erity control. W e define x noisy ∼ C α ( x ) , (3) where C α applies token-le vel corruptions with probability p ( α ) = αp max . (4) For each token w i , we sample whether to corrupt, then sample an operation: word dropout, adja- cent character swap, k eyboard-adjacent typo, or random insertion/deletion relativ e to the corruption sev erity level α . 3 . 3 D E T E R I O R AT I O N A N A L Y S I S For each setting (dataset × noise type/intensity), we fit an ordinary least-squares regression P k,r = β 0 + β 1 n k + ϵ k,r , (5) where k ∈ { 1 , . . . , K } indexes the noise severity le vel, r ∈ { 1 , . . . , R } indexes the independent repetition at that lev el, P k,r is the observed performance score for sev erity k and repetition r , β 0 is the intercept (expected performance at zero added noise), β 1 is the slope measuring the rate of performance change per unit of noise intensity , n k is linear in true noise intensity (for tabular data, n k = SNR max − SNR k ), and ϵ k,r iid ∼ N (0 , σ 2 ϵ ) is the residual error term. W e then test H 0 : β 1 ≥ 0 , (6) H 1 : β 1 < 0 , (7) at significance lev el α = 0 . 05 , using the standard OLS t -statistic for the slope coefficient ( Seber & Lee , 2012 ): t = ˆ β 1 SE( ˆ β 1 ) , t ∼ Student- t N − 2 under H 0 , (8) where ˆ β 1 is the OLS slope estimate, SE( ˆ β 1 ) is its standard error , and N = K × R is the total number of observations. W e reject H 0 (and label the task sensitive ) when t < t α,N − 2 , where t α,N − 2 is the critical v alue corresponding to significance le vel α for a Student’ s t -distribution with N − 2 degrees of freedom. That is when the observed slope is significantly neg ati ve at the chosen le vel. This operational test approximates the ordered alternative in Equation (1)–Equation (2) via a one-sided negati ve-trend surrogate. Thus, for all the datasets we compute a one-directional test of negati ve slope, to inform us as to whether the dataset in question proved sensitive or insensitive to the noise intervention. 4 E X P E R I M E N TA L S E T U P W e run all main experiments with OpenAI G P T- 5 - M I N I as the base judge model. For each dataset and noise le vel, we run 5 repetitions and provide 20 few-shot examples before recording the pre- dicted v alue. Our goal is to gi ve the model the best possible basis for solving the task at hand before deliberately handicapping its odds. For the prompt serialization we rely on a fairly simple approach, providing a dataset and task description, information about the label and output format constraints. Further details on the prompt lev eraged is described in Appendix Section B.2. 4 Published as a conference paper at CA O W orkshop at ICLR 2026 T able 1: Stepwise UCI exclusion flow . First filter keeps datasets with > 50% numerical cov ariates; second filter applies missing-value incomputability rules; the final row reports the subset used for per-dataset slope analyses in Appendix T able 5. Step / criterion Classification Regression Benchmark in ventory declared in this paper 222 143 After > 50% numeric feature filter 190 ( − 32 ) 127 ( − 16 ) After missing-value drop-of f 185 ( − 5 ) 125 ( − 2 ) Complete datasets included in this study 138 21 4 . 1 D A TAS E T S A N D TA S K S Our benchmark cov ers three domains: 1. UCI classification: 222 datasets. 2. UCI regression: 143 datasets. 3. T ext classification: 4 datasets (IMDB, Y elp Revie w Full, SST -2, Financial PhraseBank). All our datasets are split into train/valid/test fractions 0 . 70 / 0 . 15 / 0 . 15 , with stratified training split where applicable. Few shot e xamples are taken from the training set. 4 . 2 U C I E L I G I B I L I T Y A N D FI L T E R I N G As pre viously mentioned, we rely on additi ve Gaussian noise and therefore apply it only to numeric features. Not all datasets, howe ver , hav e sufficiently many numerical features available. W e there- fore use explicit exclusion criteria: (i) a minimum proportion of numeric features, and (ii) remov al of datapoints with missing values. If these filters leave too few observations, we skip the dataset. W e summarize the resulting dataset eligibility flow in T able 1. This filtering reflects a common practical limitation in tab ular-LLM ev aluation pipelines, where (i) numeric-only perturbations do not apply to categorical-heavy datasets and (ii) prompt-length constraints limit ho w much structured information can be provided to the model ( Fang et al. , 2024 ; Hegselmann et al. , 2023 ; Sui et al. , 2024 ). The final count of 138 classification and 21 re gression datasets reflects those for which we obtained complete experimental results across all noise le vels and repetitions. Extending coverage to the remaining eligible datasets is discussed in Section 6. Perf ormance metrics and configuration For the performance metrics we compute confusion metrics such as F1, precision and recall but rely on accuracy as the primary measure for the classifi- cation studies. Similarly , we compute Mean Squared Error, Mean Absolute Error for each regression task while relying on R 2 as the primary measure for the regression studies. Unless explicitly stated otherwise, we use n context = 20 fe w shot examples per prompt. T o control prompt length in tabular settings, we cap the number of features shown per example (10 features maximum). For each lev el of noise we repeat the experiment with fi ve independent trials. Finally , ev aluation instances are processed in batches with 500 rows for tab ular datasets and 50 examples for text. Upon concluding the experiments for each dataset, we fit a linear re gression to all performance scores P k,r and compute a one-sided t -test to decide whether to reject H 0 in Equation (7). W e then label the task as sensitive to the noise-response protocol (Algorithm 1) if we detect significant deterioration, and as insensitive otherwise. Across all statistical tests we use a significance lev el of α = 0 . 05 . 5 R E S U LT S W e present our results in Figures 1 to 3. For the UCI tabular benchmarks, we observe a heteroge- neous response to the noise interventions: 49/138 (35.5%) classification tasks reject the null hypoth- esis in Equation (7) and thus exhibit sensitivity to the noise schedule. Similarly , for the regression tasks we identify 5/21 (23.8%) tasks that react significantly to the noise schedule. One possible 5 Published as a conference paper at CA O W orkshop at ICLR 2026 Figure 1: UCI classification accuracy trajectories grouped by noise sensiti vity (Sensitive vs Insensi- tiv e). Curves are group means across datasets with 95% CI shading, shown separately for uncorre- lated and correlated noise. interpretation is that, on many tabular tasks, the LLM judge relies on shortcuts (e.g., dataset arti- facts or memorized associations) rather than rob ust feature utilization, which may contribute to poor generalization in high-stakes use-cases. Figure 1 shows aggregate accuracy v alues by sensitivity group and noise type; we see little difference between uncorrelated and correlated noise in these aggregated trajectories. T abular beha vior While our study aimed to identify tasks where the LLM judge fails under con- trolled interventions, it is notable that a large fraction of UCI tasks are not measurably influenced by the tested noise patterns. This observation is consistent with recent work suggesting that LLM performance on tabular prediction remains mixed and strongly dependent on task formulation, rep- resentation, and prompting choices ( Fang et al. , 2024 ; He gselmann et al. , 2023 ; Sui et al. , 2024 ). T ext-specific behavior W e present the per-dataset trajectories in Figure 2, and Figure 3 showing the aggre gate le xical trend. Lexical-noise sensiti vity is high across all datasets: all four text datasets show statistically significant negati ve slopes under the one-sided deterioration test. IMDB appears least sensitiv e, while Y elp Revie w Full exhibits the largest deterioration. One plausible explanation is that IMDB is a binary task, where the random-guessing floor is 0.5, whereas Y elp is a 5-class sen- timent task with a floor of 0.2, making lar ge drops in accuracy more visible under se vere corruption. W e provide an illustration of the corruption progression in Appendix Figure 6. 5 . 1 I N G RO U P V S . O U T G R O U P I N D I C AT I O N S O N T E S T - S E T Suppose that a dataset’ s sensitivity/insensiti vity label is a proxy for whether an LLM judge will generalize to unseen data; how can we validate this thesis? W e hypothesize that an LLM judge that prov ed insensitiv e to our noise-response protocol (Algorithm 1) will generalize poorly to unseen data in the same domain. T o test this, we ran an additional clean-baseline e xperiment (no additive noise) and compared baseline performance and v ariability between datasets labeled sensiti ve vs. insensi- tiv e. Due to time constraints, we limited this analysis to datasets with fe wer than 1600 examples, yielding 124 datasets total (83 insensitive, 41 sensiti ve). As before, we run 5 repetitions per dataset and include 20 n context examples from the training set in the prompt. The results are summarized in Figure 4 and T able 2. Overall, insensitive datasets tend to have lower performance; moreov er, aside from baseline accuracy , dispersion measures (standard de viation, interquartile range, and trial- to-trial variation) are equal to or more than twice as large for the sensitive group. These patterns are consistent with the interpretation that insensiti vity may reflect memorization or reliance on weak 6 Published as a conference paper at CA O W orkshop at ICLR 2026 Figure 2: Per-dataset text accuracy vs lexical noise sev erity . Curves sho w means across five repetitions, with pointwise 95% confidence inter - vals. Figure 3: Aggregate text accurac y under increas- ing lexical noise se verity . Figure 4: Clean test-set baseline comparison for classification datasets (sensitiv e vs insensitiv e): ECDFs for median accuracy , trial-to-trial standard deviation, and trial range. cues; howe ver , higher variance in the sensitiv e group can also arise when predictions are closer to the decision boundary . For additional breakdowns, see Appendix T able 5 and T able 6. 5 . 2 A B L AT I O N S A N D S E N S I T I V I T Y C H E C K S T o guide our model choice, and in particular to assess whether few-shot examples improv e per- formance, we ran model and fe w-shot ablations with { 0, 5, 10, 20 } context examples for G P T - 4 O , G P T - 4 O - M I N I , and G P T - 5 - N A N O . As sho wn in T able 2, all three models benefit from few-shot exam- ples under a paired 0-shot vs. 20-shot comparison: G P T - 4 O improv es from 0.483 to 0.523 (+4.0%), G P T - 4 O - M I N I from 0.412 to 0.443 (+3.0%), and G P T - 5 - N A N O from 0.487 to 0.515 (+2.9 %). At 20- shot, the mean-performance ordering is G P T - 4 O (0.523) > G P T - 5 - N A N O (0.515) > G P T - 4 O - M I N I (0.443), with a significant gap between G P T - 4 O and G P T - 4 O - M I N I (+8.0%). Notably , G P T - 5 - NA N O has the strongest 0-shot baseline and sho ws a smaller incremental gain from additional context than G P T - 4 O ; in this ablation, G P T - 4 O also remains competiti ve with the G P T - 5 family . W e treat these few-shot grid ablations as a methodological check, to verify that (i) few-shot conte xt helps on these tasks and (ii) performance is meaningfully model-dependent,rather than as an attempt to exhaus- tiv ely tune the final judge configuration. Accordingly , for the main noise-response study we fix a single strong setting ( G P T - 5 - M I N I with 20-shot context), aiming to operate in a regime where the judge is sufficiently capable on clean inputs so that any observed insensitivity under noise is less likely to be an artifact of inadequate baseline capacity . 7 Published as a conference paper at CA O W orkshop at ICLR 2026 T able 2: T est-set baseline comparison (classification). Sensitivity labels deriv ed from training-set perturbation. T est-set uses clean data only (5 trials/dataset). All values are medians; CIs from 10 000 bootstrap resamples. Metric Sensiti ve Insensiti ve Ratio ∆ Median 95% Bootstrap CI Accuracy 0.691 0.618 1.1 × +0 . 073 [-0.036, +0.186] Std Dev 0.0421 0.0178 2.4 × +0 . 0243 [-0.0013, +0.0394] IQR 0.0233 0.0116 2.0 × +0 . 0117 [-0.0021, +0.0490] Range 0.1121 0.0487 2.3 × +0 . 0634 [-0.0067, +0.0956] T able 3: Ablation summary (mean primary metric ± std across datasets). Model 0-shot 5-shot 10-shot 20-shot G P T - 4 O 0.483 ± 0.235 0.509 ± 0.241 0.514 ± 0.240 0.523 ± 0.245 G P T - 4 O - M I N I 0.412 ± 0.210 0.435 ± 0.209 0.440 ± 0.212 0.443 ± 0.213 G P T - 5 - NA N O 0.486 ± 0.257 0.503 ± 0.258 0.509 ± 0.263 0.515 ± 0.266 G P T - 5 - M I N I baseline – – – 0.561 ± 0.253 6 L I M I TA T I O N S A N D F U T U R E W O R K While we believe reported findings are indicativ e of our original thesis, namely , LLM Judges that show indifference to dramatic input changes is an indicator of an untrustworthy judge, sev eral methodological limits remain: Our conclusions are conditional on the chosen perturbation families, we focus on numeric-only tabular interventions and thus under-represent datasets with substantial categorical structure, meanwhile our findings are tied to one primary LLM and therefore do not yet establish cross-model inv ariance, and finally the linear slope framework fav ors interpretability but can miss non-linear deterioration regimes. An additional limitation is diagnostic depth: we identify sensitive v ersus insensitiv e regimes but do not fully explain why insensitivity appears for specific datasets. While we performed a simplistic analysis, pro viding a breakdown by categories of the UCI datasets and their findings (T able 6), a de- tailed analysis that could fully exonerate potential erroneous interpretations that may not have been fully explained by the our noise protocol. This includes ablations on prompt structure, experiments where we incorporate deniability in the model output (allowing the model to decline uncertain e xam- ples) as well as variations on noise schedules not limited by numerical cov ariates but all cov ariates in the dataset. This would allow for a more comprehensi ve understanding of the e xtent by which the model is confidently uninformed or confidently informed of the problem. Future dir ections Next steps are to expand the study across multiple LLM families to test whether trust decisions are model-in variant or model-specific, extend tabular interventions to categorical and mixed-type fea- tures for broader UCI cov erage, in addition to e xpanding to wards additional text and image datasets as well, finally we would like to add out-of-distrib ution plus counterfactual perturbations to separate true causal signal dependence from potentially spurious sensitivity . 7 C O N C L U S I O N W e introduced an intervention-based calibration protocol for LLM judges under controlled noise. The main empirical finding is a modality gap: lexical perturbations consistently degraded text per- formance, whereas additive Gaussian noise elicited a response in only 36% of UCI classification tasks and 24% of UCI regression tasks. In a post-hoc clean test-set analysis, noise-insensitive datasets tended to hav e lower median accurac y , while sensitive datasets sho wed broader trial-to- trial dispersion, suggesting that absent sensitivity may reflect brittle or weakly grounded behavior . Although preliminary , these results are consistent with noise-response sensiti vity tracking whether the LLM judge is grounded in robust, task-relev ant signal rather than weak or brittle cues, offering a principled starting point for improving the reliability and trust in LLM-based judges. 8 Published as a conference paper at CA O W orkshop at ICLR 2026 R E F E R E N C E S Arthur Asuncion and David Newman. Uci machine learning repository . Uni versity of California, Irvine, School of Information and Computer Sciences, 2007. URL https://archive.ics. uci.edu . Y untao Bai, Saurav Kadav ath, Sandipan Kundu, Amanda Askell, Jackson K ernion, Andy Jones, Anna Chen, Anna Goldie, Azalia Mirhoseini, Cameron McKinnon, Carol Chen, Catherine Ols- son, Christopher Olah, Danny Hernandez, Dawn Drain, Deep Ganguli, Dustin Li, Eli T ran- Johnson, Ethan Perez, Jamie Kerr , Jared Mueller, Jeffre y Ladish, Joshua Landau, Kamal Ndousse, Kamile Luk osuite, Liane Lo vitt, Michael Sellitto, Nelson Elhage, Nicholas Schiefer , Noemi Mer- cado, Nov a DasSarma, Robert Lasenby , Robin Larson, Sam Ringer, Scott Johnston, Shauna Krav ec, Sheer El Showk, Stanislav Fort, T amera Lanham, Timoth y T elleen-Lawton, T om Con- erly , T om Henighan, Tristan Hume, Samuel R. Bowman, Zac Hatfield-Dodds, Ben Mann, Dario Amodei, Nicholas Joseph, Sam McCandlish, T om Brown, and Jared Kaplan. Constitutional ai: Harmlessness from ai feedback, 2022. URL . Y onatan Belinkov and Y onatan Bisk. Synthetic and natural noise both break neural machine trans- lation. In Pr oceedings of ICLR , 2018. URL https://openreview.net/forum?id= BJ8vJebC- . Paulo Cortez, Ant ´ onio Cerdeira, Fernando Almeida, T elmo Matos, and Jos ´ e Reis. Modeling wine preferences by data mining from physicochemical properties. Decision Support Systems , 47(4): 547–553, 2009. doi: 10.1016/j.dss.2009.05.016. Richard A. DeMillo, Richard J. Lipton, and Frederick G. Sayward. Hints on test data selection: Help for the practicing programmer . Computer , 11(4):34–41, 1978. doi: 10.1109/C- M.1978.218136. Xi Fang, W eijie Xu, Fiona Anting T an, Jiani Zhang, Ziqing Hu, Y anjun Qi, Scott Nickleach, Diego Socolinsky , Sriniv asan H. Sengamedu, and Christos Faloutsos. Large language models (llms) on tabular data: Prediction, generation, and understanding – a survey . CoRR , abs/2402.17944, 2024. doi: 10.48550/arXi v .2402.17944. URL https://doi.org/10.48550/arXiv. 2402.17944 . Ronald A. Fisher . The use of multiple measurements in taxonomic problems. Annals of Eugenics , 7 (2):179–188, 1936. T imnit Gebru, Jamie Morgenstern, Briana V ecchione, Jennifer W ortman V aughan, Hanna W allach, Hal Daum ´ e III, and Kate Crawford. Datasheets for datasets. Commun. ACM , 64(12):86–92, Nov ember 2021. ISSN 0001-0782. doi: 10.1145/3458723. URL https://doi.org/10. 1145/3458723 . Stefan Hegselmann, Alejandro Buendia, Hunter Lang, Monica Agrawal, Xiaoyi Jiang, and David Sontag. T abllm: Few-shot classification of tab ular data with large language models. In Pr o- ceedings of The 26th International Confer ence on Artificial Intelligence and Statistics , v ol- ume 206 of Proceedings of Machine Learning Resear ch , pp. 5549–5581. PMLR, 2023. URL https://proceedings.mlr.press/v206/hegselmann23a.html . Lei Huang, W eijiang Y u, W eitao Ma, W eihong Zhong, Zhangyin Feng, Haotian W ang, Qianglong Chen, W eihua Peng, Xiaocheng Feng, Bing Qin, and Ting Liu. A surv ey on hallucination in large language models: Principles, taxonomy , challenges, and open questions. ACM T ransactions on Information Systems , 43(2):1–55, January 2025. ISSN 1558-2868. doi: 10.1145/3703155. URL http://dx.doi.org/10.1145/3703155 . Y ue Jia and Mark Harman. An analysis and surve y of the dev elopment of mutation testing. IEEE T ransactions on Softwar e Engineering , 37(5):649–678, 2011. doi: 10.1109/TSE.2010.62. Chungpa Lee, Thomas Zeng, Jongwon Jeong, Jy yong Sohn, and Kangwook Lee. How to correctly report llm-as-a-judge ev aluations, 2026. URL . Stephanie Lin, Jacob Hilton, and Owain Evans. TruthfulQA: Measuring ho w models mimic human falsehoods. In Smaranda Muresan, Preslav Nakov , and Aline V illa vicencio (eds.), Pr oceedings of the 60th Annual Meeting of the Association for Computational Linguistics (V olume 1: Long 9 Published as a conference paper at CA O W orkshop at ICLR 2026 P apers) , pp. 3214–3252, Dublin, Ireland, May 2022. Association for Computational Linguis- tics. doi: 10.18653/v1/2022.acl- long.229. URL https://aclanthology.org/2022. acl- long.229/ . Y ang Liu, Dan Iter , Y ichong Xu, Shuohang W ang, Ruochen Xu, and Chenguang Zhu. G-e v al: NLG ev aluation using GPT-4 with better human alignment, 2023. URL abs/2303.16634 . Andrew L. Maas, Raymond E. Daly , Peter T . Pham, Dan Huang, Andrew Y . Ng, and Christopher Potts. Learning word vectors for sentiment analysis. In Pr oceedings of ACL: Human Language T echnolo gies , pp. 142–150, 2011. URL https://aclanthology.org/P11- 1015/ . Pekka Malo, Ankur Sinha, Pekka Korhonen, Jyrki W allenius, and Pyry T akala. Good debt or bad debt: Detecting semantic orientations in economic texts. Journal of the Association for Informa- tion Science and T echnolo gy , 65(4):782–796, 2014. doi: 10.1002/asi.23062. Iman Mirzadeh, Kei van Alizadeh, Hooman Shahrokhi, Oncel Tuzel, Samy Bengio, and Mehrdad Farajtabar . Gsm-symbolic: Understanding the limitations of mathematical reasoning in large language models, 2025. URL . Long Ouyang, Jeff W u, Xu Jiang, Diogo Almeida, Carroll L. W ainwright, Pamela Mishkin, Chong Zhang, Sandhini Agarwal, Katarina Slama, Alex Ray , John Schulman, Jacob Hilton, Fraser Kel- ton, Luke Miller , Maddie Simens, Amanda Askell, Peter W elinder , Paul Christiano, Jan Leike, and Ryan Lowe. Training language models to follow instructions with human feedback, 2022. URL . Judea Pearl. Causality . Cambridge Univ ersity Press, 2009. Jonas Peters, Dominik Janzing, and Bernhard Scholkopf. Elements of Causal Infer ence . MIT Press, 2017. Danish Pruthi, Bhuwan Dhingra, and Zachary C. Lipton. Combating adversarial misspellings with rob ust word recognition. In Pr oceedings of A CL , pp. 5582–5591, 2019. URL https: //aclanthology.org/P19- 1561/ . George A. F . Seber and Alan J. Lee. Linear Regr ession Analysis . John Wile y & Sons, 2nd edition, 2012. doi: 10.1002/9780471722199. Nabeel Seedat, Nicolas Huynh, Boris v an Breugel, and Mihaela van der Schaar . Curated llm: Synergy of llms and data curation for tabular augmentation in low-data regimes, 2024. URL https://arxiv.org/abs/2312.12112 . Freda Shi, Xinyun C hen, Kanishka Misra, Nathan Scales, Da vid Dohan, Ed Chi, Nathanael Sch ¨ arli, and Denny Zhou. Large language models can be easily distracted by irrelev ant context, 2023. URL . Rion Snow , Brendan O’Connor , Daniel Jurafsky , and Andrew Ng. Cheap and fast – but is it good? ev aluating non-expert annotations for natural language tasks. In Pr oceedings of EMNLP , pp. 254–263, 2008. URL https://aclanthology.org/D08- 1027/ . Richard Socher , Alex Perelygin, Jean W u, Jason Chuang, Christopher D. Manning, Andre w Ng, and Christopher Potts. Recursiv e deep models for semantic compositionality over a sentiment treebank. In Pr oceedings of EMNLP , pp. 1631–1642, 2013. URL https://aclanthology. org/D13- 1170/ . Y uan Sui, Mengyu Zhou, Mingjie Zhou, Shi Han, and Dongmei Zhang. T able meets llm: Can large language models understand structured table data? a benchmark and empirical study . In Pr oceed- ings of the 17th ACM International Conference on W eb Sear ch and Data Mining , pp. 645–654, 2024. doi: 10.1145/3616855.3635752. URL https://doi.org/10.1145/3616855. 3635752 . Alex W ang, Amanpreet Singh, Julian Michael, Felix Hill, Omer Le vy , and Samuel R. Bowman. GLUE: A multi-task benchmark and analysis platform for natural language understanding. In Pr o- ceedings of ICLR , 2019. URL https://openreview.net/forum?id=rJ4km2R5t7 . 10 Published as a conference paper at CA O W orkshop at ICLR 2026 Xiang Zhang, Junbo Zhao, and Y ann LeCun. Character-le vel con volutional networks for text classi- fication. In Pr oceedings of NeurIPS , 2015. URL https://proceedings.neurips.cc/ paper/2015/hash/250cf8b51c773f3f8dc8b4be867a9a02- Abstract.html . Lianmin Zheng, W ei-Lin Chiang, Y ing Sheng, Siyuan Zhuang, Zhanghao W u, Y onghao Zhuang, Zi Lin, Zhuohan Li, Dacheng Li, Eric P . Xing, Hao Zhang, Joseph E. Gonzalez, and Ion Stoica. Judging LLM-as-a-judge with MT-bench and chatbot arena, 2023. URL https://arxiv. org/abs/2306.05685 . 11 Published as a conference paper at CA O W orkshop at ICLR 2026 T able 4: Lexical slope estimates ( β 1 ), one-sided p -values, and H 0 decisions. Dataset Lexical β 1 One-sided p Decision Financial PhraseBank -0.3687 < 10 − 10 Reject H 0 IMDB -0.2100 < 10 − 10 Reject H 0 SST -2 -0.4199 < 10 − 10 Reject H 0 Y elp Re view Full -0.4056 < 10 − 10 Reject H 0 A A D D I T I O N A L R E S U LT S A . 1 P E R - D A TA S E T T E X T L E X I C A L S L O P E S T able 4 lists per-dataset le xical slope estimates for text e xperiments. A . 2 A L L U C I P E R - DAT A S E T S L O P E S T able 5 reports UCI per-dataset slope estimates under uncorrelated and correlated noise, for both classification (accuracy) and regression ( R 2 ). This table covers the full set of datasets with complete per-dataset trajectories in the e xperiments reported in this paper . T able 5: Per-dataset UCI slope estimates ( β 1 ) from linear regression of primary metric on noise se verity ( 40 − SNR dB ), with one-sided p -values for H 1 : β 1 < 0 . Buckets are derived using the sensitiv- ity/insensitivity deterioration protocol defined in Algorithm 1. Classification (n=138): Insensitive=89, Sensitiv e (both)=32, Sensitive (corr-only)=11, Sensitive (uncorr-only)=6. Regression (n=21): Insensi- tiv e=16, Sensitiv e (both)=3, Sensitive (corr-only)=0, Sensiti ve (uncorr-only)=2. T ask Dataset β 1 (Uncorr .) p (Uncorr .) β 1 (Corr .) p (Corr .) Bucket Classification abalone -0.0002 0.1896 -0.0007 0.0119 Sensitive (corr -only) Classification acute inflammations -0.0002 0.4039 -0.0000 0.4726 Insensitive Classification adult +0.0008 0.8151 -0.0012 0.1322 Insensitive Classification android permissions +0.0000 0.7318 -0.0001 0.2699 Insensitive Classification annealing +0.0009 0.6829 +0.0023 0.8607 Insensitive Classification auction verification -0.0000 0.1738 -0.0000 0.1047 Insensitive Classification audiology +0.0002 0.6896 -0.0002 0.2878 Insensitive Classification autism screening adult -0.0002 0.2608 -0.0007 0.0130 Sensitive (corr -only) Classification autism screening children -0.0055 < 1 e − 4 -0.0049 < 1 e − 4 Sensitiv e (both) Classification automobile – – – – Insensitive Classification balance scale -0.0087 < 1 e − 4 -0.0076 < 1 e − 4 Sensitiv e (both) Classification balloons +0.0032 0.9774 -0.0014 0.1878 Insensitive Classification bank marketing -0.0001 0.2688 +0.0000 0.5582 Insensitive Classification banknote authentication -0.0009 0.0874 -0.0004 0.2470 Insensitive Classification blood transfusion -0.0001 0.4184 -0.0007 0.0709 Insensitive Classification bone marrow transplant -0.0002 0.2957 – – Insensitiv e Classification breast cancer -0.0006 0.0221 -0.0005 0.0484 Sensitive (both) Classification breast cancer coimbra -0.0002 0.3720 +0.0010 0.9478 Insensitive Classification breast cancer wisconsin diagnostic -0.0010 0.0035 -0.0007 0.0291 Sensitive (uncorr -only) Classification breast cancer wisconsin original -0.0076 < 1 e − 4 -0.0066 < 1 e − 4 Sensitiv e (both) Classification breast cancer wisconsin prognostic +0.0004 0.9005 +0.0000 0.5134 Sensitive (corr-only) Classification car evaluation -0.0005 0.3019 +0.0001 0.5493 Insensitive Classification cardiotocography +0.0000 0.5000 +0.0001 0.8262 Insensitive Classification cdc diabetes indicators -0.0003 0.3448 -0.0001 0.4114 Insensitive Classification census income -0.0024 0.0038 -0.0002 0.4092 Sensitive (uncorr -only) Classification cervical cancer behavior risk -0.0018 0.0534 -0.0015 0.0940 Sensitive (both) Classification chess king rook vs king -0.0001 0.1147 +0.0000 0.6009 Insensitive Classification chess king rook vs king pawn +0.0005 0.9968 -0.0002 0.0851 Insensitive Classification chronic kidney disease -0.0035 < 1 e − 4 -0.0037 < 1 e − 4 Sensitiv e (both) Classification cirrhosis survival -0.0036 < 1 e − 4 -0.0033 < 1 e − 4 Sensitiv e (both) Classification ckd risk factors +0.0004 0.6566 -0.0007 0.2311 Insensitive Classification connect 4 -0.0001 0.4264 +0.0010 0.8688 Insensitive Classification contraceptive method choice +0.0006 0.8752 +0.0011 0.9872 Insensitive Classification covertype +0.0002 0.7323 -0.0003 0.2363 Insensitive Classification credit approval -0.0009 0.0010 -0.0008 0.0099 Sensitive (both) Classification cylinder bands -0.0000 0.1044 +0.0000 0.6225 Insensitive Classification default credit card -0.0020 0.0818 -0.0038 0.0061 Sensitive (corr -only) Classification dermatology +0.0002 0.6595 -0.0001 0.3545 Insensitive Continued on next pag e 12 Published as a conference paper at CA O W orkshop at ICLR 2026 T able 5 continued T ask Dataset β 1 (Uncorr .) p (Uncorr .) β 1 (Corr .) p (Corr .) Bucket Classification diabetic retinopathy +0.0001 0.6208 +0.0000 0.5718 Insensitive Classification dota2 games -0.0000 0.4447 -0.0000 0.4794 Insensitive Classification drug consumption -0.0001 0.2661 +0.0000 0.5000 Insensitive Classification dry bean -0.0043 < 1 e − 4 -0.0016 0.0174 Sensitive (both) Classification early stage diabetes +0.0003 0.6591 -0.0010 0.0622 Insensitive Classification ecoli -0.0039 < 1 e − 4 -0.0028 < 1 e − 4 Sensitiv e (both) Classification eeg eye state +0.0000 0.5000 +0.0000 0.5000 Insensiti ve Classification electrical grid stability -0.0000 0.4468 -0.0000 0.2516 Insensitive Classification fertility -0.0003 0.3350 -0.0009 0.0803 Insensitive Classification flags +0.0003 0.8951 -0.0000 0.4622 Insensitive Classification garment productivity -0.0001 0.0089 -0.0001 0.0020 Sensitive (both) Classification gender by name +0.0000 0.5251 -0.0001 0.2565 Insensitive Classification glass identification -0.0036 < 1 e − 4 -0.0032 < 1 e − 4 Sensitiv e (both) Classification haberman survival -0.0018 < 1 e − 4 -0.0024 < 1 e − 4 Sensitiv e (both) Classification hayes roth -0.0049 < 1 e − 4 -0.0055 < 1 e − 4 Sensitiv e (both) Classification hcv data -0.0045 < 1 e − 4 -0.0045 < 1 e − 4 Sensitiv e (both) Classification heart disease -0.0047 < 1 e − 4 -0.0042 < 1 e − 4 Sensitiv e (both) Classification heart failure clinical records -0.0045 < 1 e − 4 -0.0041 < 1 e − 4 Sensitiv e (both) Classification hepatitis -0.0004 0.0301 -0.0005 0.0170 Sensitive (corr-only) Classification hepatitis c virus -0.0001 0.0843 +0.0000 0.7298 Insensitive Classification higher education performance +0.0002 0.6734 -0.0007 0.0295 Insensitive Classification horse colic -0.0015 0.0199 – – Sensitiv e (uncorr-only) Classification htru2 -0.0008 0.0009 -0.0012 0.0006 Sensitive (both) Classification ilpd +0.0019 1.0000 +0.0017 1.0000 Insensitive Classification image segmentation -0.0025 0.0507 -0.0044 0.0092 Sensitive (both) Classification in vehicle coupon +0.0000 0.5475 +0.0002 0.7485 Insensiti ve Classification ionosphere -0.0001 0.3138 -0.0002 0.0337 Sensitive (corr-only) Classification iranian churn +0.0003 0.8269 -0.0004 0.1692 Insensitive Classification iris -0.0092 < 1 e − 4 -0.0084 < 1 e − 4 Sensitiv e (both) Classification isolet -0.0000 0.2703 -0.0001 0.0344 Insensitive Classification japanese credit screening -0.0001 0.0504 -0.0000 0.1616 Insensitive Classification lenses -0.0012 0.1729 -0.0005 0.3867 Insensitive Classification letter recognition +0.0001 0.8953 +0.0001 0.7859 Insensiti ve Classification liver disorders -0.0010 0.0089 -0.0011 0.0328 Sensitive (both) Classification lung cancer -0.0010 0.0368 -0.0008 0.1179 Insensitive Classification lymphography -0.0003 0.3359 -0.0009 0.1317 Insensitive Classification magic gamma telescope +0.0004 0.8297 -0.0003 0.2583 Insensitive Classification mammographic mass -0.0048 < 1 e − 4 -0.0036 < 1 e − 4 Sensitiv e (both) Classification maternal health risk -0.0030 < 1 e − 4 -0.0032 < 1 e − 4 Sensitiv e (both) Classification molecular biology splice +0.0000 0.5000 +0.0000 0.5000 Insensitive Classification monks problems -0.0049 < 1 e − 4 -0.0050 < 1 e − 4 Sensitiv e (both) Classification mushroom +0.0004 0.7615 -0.0005 0.1523 Insensitive Classification musk v1 -0.0006 0.2023 +0.0009 0.9304 Insensitive Classification musk v2 +0.0005 0.8262 +0.0008 0.8238 Insensitiv e Classification myocardial infarction +0.0000 0.5767 – – Insensitiv e Classification nursery +0.0017 0.9731 -0.0015 0.0244 Sensitive (corr-only) Classification obesity levels -0.0057 0.0007 -0.0065 0.0001 Sensitive (both) Classification occupancy detection -0.0001 0.4307 -0.0003 0.2215 Insensitive Classification online shoppers intention -0.0008 0.1209 -0.0005 0.1880 Insensitive Classification optical recognition digits -0.0000 0.2442 -0.0002 0.0024 Sensitive (corr-only) Classification ozone level detection +0.0023 0.9887 -0.0001 0.4521 Insensitive Classification page blocks +0.0001 0.6251 +0.0012 0.9997 Insensitive Classification parkinsons +0.0005 0.7554 +0.0004 0.7710 Insensitive Classification pediatric appendicitis -0.0013 0.0758 – – Insensitiv e Classification pen digits -0.0001 0.3328 -0.0000 0.3256 Insensitive Classification phishing websites +0.0000 0.5562 -0.0000 0.4411 Insensitive Classification poker hand -0.0027 < 1 e − 4 -0.0034 < 1 e − 4 Sensitiv e (both) Classification polish companies bankruptcy +0.0000 0.6225 – – Insensitiv e Classification post operative patient +0.0001 0.5362 +0.0000 0.5115 Insensiti ve Classification predictive maintenance -0.0024 < 1 e − 4 -0.0016 0.0004 Sensitive (both) Classification primary tumor +0.0017 0.9950 +0.0013 0.9707 Insensitive Classification raisin +0.0006 0.8606 +0.0005 0.8196 Insensitive Classification raisin dataset -0.0009 0.0514 -0.0012 0.0052 Sensitive (corr-only) Classification rice -0.0011 0.0368 -0.0008 0.0726 Insensitive Classification room occupancy estimation -0.0022 0.0013 -0.0030 0.0010 Sensitive (both) Classification servo -0.0004 0.0990 -0.0007 0.0036 Sensitive (both) Classification shuttle landing control -0.0010 0.1451 +0.0012 0.9140 Insensitive Classification skin segmentation -0.0019 < 1 e − 4 -0.0021 < 1 e − 4 Sensitiv e (both) Classification solar flare -0.0007 0.1716 -0.0015 0.0355 Insensitive Classification sonar +0.0007 0.9702 -0.0000 0.4928 Insensitive Classification soybean large -0.0000 0.1196 +0.0000 0.7017 Insensitive Classification soybean small +0.0004 0.6823 +0.0024 0.9994 Insensitive Classification space shuttle oring +0.0000 – +0.0000 – Insensitiv e Continued on next pag e 13 Published as a conference paper at CA O W orkshop at ICLR 2026 T able 5 continued T ask Dataset β 1 (Uncorr .) p (Uncorr .) β 1 (Corr .) p (Corr .) Bucket Classification spambase +0.0029 1.0000 +0.0011 0.9846 Insensitive Classification spect heart -0.0028 0.1240 -0.0017 0.2489 Insensitive Classification spectf heart -0.0003 0.4461 +0.0008 0.6299 Insensitive Classification statlog australian credit -0.0003 0.0393 +0.0000 0.5028 Insensitive Classification statlog german credit +0.0000 0.6225 +0.0000 0.6225 Insensitive Classification statlog heart -0.0021 0.0024 -0.0008 0.1294 Sensitive (uncorr-only) Classification statlog image segmentation -0.0024 0.0008 -0.0040 < 1 e − 4 Sensitiv e (both) Classification statlog landsat -0.0003 0.1784 -0.0007 0.0112 Sensitive (corr-only) Classification statlog shuttle -0.0008 0.0230 -0.0004 0.1356 Sensitive (uncorr-only) Classification statlog vehicle -0.0004 0.0842 -0.0004 0.1355 Insensitive Classification steel plates faults +0.0000 0.5000 +0.0000 0.5000 Insensiti ve Classification student academics performance +0.0004 0.7696 +0.0001 0.5626 Insensitive Classification student performance -0.0000 0.4487 +0.0002 0.9596 Insensitive Classification taiwanese bankruptcy +0.0000 0.7339 +0.0000 0.5000 Insensitive Classification thoracic surgery +0.0000 0.5000 +0.0001 0.8999 Insensitive Classification thyroid cancer recurrence +0.0000 0.5319 +0.0004 0.7767 Insensitiv e Classification tic tac toe -0.0002 0.4207 +0.0014 0.9489 Insensitiv e Classification user knowledge modeling -0.0037 0.0010 -0.0038 < 1 e − 4 Sensitiv e (both) Classification vertebral column -0.0029 0.0079 -0.0015 0.0986 Insensiti ve Classification voting records -0.0001 0.3331 +0.0001 0.7549 Insensitive Classification waveform -0.0001 0.2656 -0.0003 0.0547 Insensitive Classification website phishing -0.0005 0.2208 -0.0012 0.0251 Insensiti ve Classification wine -0.0034 0.0300 -0.0014 0.1969 Insensitive Classification wine quality -0.0002 0.2812 -0.0003 0.1623 Insensitive Classification yeast -0.0003 0.1673 -0.0008 0.0107 Sensitive (corr-only) Classification youtube spam -0.0006 0.3147 -0.0020 0.0435 Insensitive Classification zoo -0.0033 0.0129 +0.0016 0.9152 Sensitive (uncorr-only) Regression abalone -0.0021 0.0397 +0.0016 0.8358 Insensitive Regression air quality +0.0113 0.9515 -0.0027 0.1011 Insensiti ve Regression airfoil self noise +0.0005 0.7006 +0.0002 0.7177 Insensitive Regression appliances energy -0.0003 0.1510 -0.0050 0.1116 Insensitiv e Regression auto mpg -0.0062 < 1 e − 4 -0.0015 0.2315 Sensitive (uncorr-only) Regression bike sharing -0.0005 0.2273 +0.0014 0.9350 Insensitiv e Regression combined cycle power plant -0.0018 0.0934 +0.0009 0.7330 Insensitiv e Regression computer hardware -0.0202 0.0018 -0.0099 0.0893 Sensiti ve (both) Regression concrete compressive strength +0.0000 0.5064 -0.0008 0.0383 Insensitive Regression concrete slump -0.0000 0.3550 -0.0002 0.3203 Insensiti ve Regression energy efficiency -0.0023 0.0549 -0.0028 0.0593 Insensiti ve Regression forest fires +0.0003 0.9083 +0.0003 0.8783 Insensitive Regression gas turbine emission +0.0001 0.6587 +0.0001 0.5411 Insensitive Regression heart failure -0.0004 0.2455 -0.0002 0.1847 Insensiti ve Regression parkinson telemonitoring -0.0028 0.0002 -0.0041 0.0071 Sensitive (both) Regression power consumption tetouan +0.0007 0.9513 -0.0000 0.4605 Insensitiv e Regression seoul bike sharing -0.0033 0.0232 -0.0017 0.1423 Sensitive (uncorr-only) Regression servo -0.0005 0.1800 +0.0004 0.6813 Insensitive Regression student performance -0.0008 0.0918 -0.0007 0.1364 Insensiti ve Regression superconductivity -0.0000 0.2025 -0.0001 0.2004 Sensitive (both) Regression wine quality -0.0008 0.0941 +0.0002 0.6447 Insensitiv e A . 3 N O I S E - I N D U C E D D A TA P O I N T S H I F T V I S U A L I Z A T I O N Figure 5 illustrates how perturbations shift point clouds and density structure under increasing noise. Rows correspond to representati ve datasets; columns compare clean data to uncorrelated and corre- lated noise at matched SNR. A . 4 B R E A K D O W N O F U C I R E S U L T S B Y A D D I T I O N A L L E V E L S In T able 6 we present a breakdown of the results in our study broken do wn by several categories of interest. For the variety of datasets employed in our UCI study , there is little indication of domain or dataset size dependence. Howe ver , we do note possible indications of dependency relativ e to large sets of features, which may stem from our deliberate limitation of only employing 10 numerical fea- tures to mitigate challenges with token length. Similarly it is important to note prompt serialization, for which we have taken a simple approach of dataset description, metadata and cov ariate distri- butions in addition to raw numerical v alues, comparable to studies such as CLLM ( Seedat et al. , 2024 ). 14 Published as a conference paper at CA O W orkshop at ICLR 2026 Figure 5: 2D datapoint and density-shift illustration under noise perturbations Left: clean baseline. Middle: uncorrelated Gaussian noise. Right: correlated Gaussian noise. B I M P L E M E N TA T I O N A N D R E P RO D U C I B I L I T Y D E T A I L S B . 1 I M D B L E X I C A L P E R T U R B A T I O N P RO G R E S S I O N In Figure 6 below we show a single IMDB revie w example and the resulting lexical corruption sequence at four sev erities from 0 to 1. 15 Published as a conference paper at CA O W orkshop at ICLR 2026 Breakdown (Count) Factor / Le vel T ask N Sens. Sensitive % Both Corr . Unc. Ar ea of Application Biology C 14 8 57.1 3 3 2 R 1 0 0.0 0 0 0 Business C 13 3 23.1 2 1 0 R 2 1 50.0 0 0 1 Comp. Science C 20 6 30.0 5 1 0 R 7 2 28.6 2 0 0 Health/Medicine C 43 17 39.5 13 2 2 R 1 0 0.0 0 0 0 Physics/Chem C 17 4 23.5 2 1 1 R 3 1 33.3 1 0 0 Social Science C 14 5 35.7 2 2 1 R 3 0 0.0 0 0 0 Dataset Size (Samples) ≤ 500 C 54 23 42.6 17 3 3 R 4 2 50.0 1 0 1 501 − 1 , 000 C 20 8 40.0 5 2 1 1 , 001 − 5 , 000 C 26 6 23.1 4 2 0 > 5 , 000 C 38 12 31.6 6 4 2 R 10 3 30.0 2 0 1 F eature Count ≤ 10 C 48 23 47.9 18 4 1 R 9 2 22.2 1 0 1 11 − 20 C 40 18 45.0 13 2 3 21 − 50 C 33 7 21.2 1 4 2 > 50 C 17 1 5.9 0 1 0 R 2 1 50.0 1 0 0 Class Count (Classification Only) 2 C 70 21 30.0 12 6 3 3–5 C 33 12 36.4 10 1 1 6–10 C 22 12 54.5 7 3 2 > 10 C 12 4 33.3 3 1 0 T able 6: Sensitivity analysis: Relationship between dataset characteristics and performance deterio- ration. Bars represent relativ e sensitivity (%). (C: Classification, R: Regression) Severity 0.00 (clean) I rank OPERA as one of the better Argento films. Plot holes and inconsistencies? Sure, but I don’t think they impair this film as much as many other reviewers seem to. A lot of elements that are in many of Severity 0.33 (light lexical noise) Ir ank [MASK] npe npe [MASK] bette [MASK] iflms. [MASK] oel snad inconsistenicesb? utI tihnk imapirt his fiml a ass many [MASK] reviewers [MASK] A elemenst th atare in of Severity 0.67 (medium lexical noise) I rank [MASK] yoles [MASK] iconsitsneices? Sure ,It hnik hnik film film [MASK] as as A [MASK] Severity 1.00 (maximum lexical noise) [MASK] hte and [MASK] [MASK] [MASK] kto [MASK] Figure 6: Lexical perturbation progression for a random IMDB sample ( test 022423 , label: positiv e), generated with the same corruption pipeline used in the experiments. As severity increases, token-le vel corruption and masking rapidly erase lexical signal. 16 Published as a conference paper at CA O W orkshop at ICLR 2026 B . 2 P R O M P T C O N S T R U C T I O N A N D R U N S E T U P Prompt template & Execution System prompt Each request starts with dynamic dataset context, task definition, label space (or regression target), and e xplicit output-format constraints. User prompt The user message contains few-shot examples as ( X , y ) pairs, followed by e valuation ro ws as X only . For tabular settings, inputs are restricted to at most 10 numeric features to control context length. Run protocol Each dataset × noise setting is run for fi ve independent trials using fixed random seeds. T ext experiments apply the lexical corruption at the requested sev erity; tabular experiments apply Gaussian perturbations under correlated or uncorrelated cov ariance structure. Output schema Model outputs are schema-validated against task-specific constraints (label set for classifica- tion, numeric parsing for regression). In valid schema/parse outputs are retried up to 3 times; otherwise counted missing. C A C K N O W L E D G E M E N T S W e thank Jan Ole Ernst and Lars Holdijk for helpful discussions and thoughtful conv ersations related to this work. 17
Original Paper
Loading high-quality paper...
Comments & Academic Discussion
Loading comments...
Leave a Comment