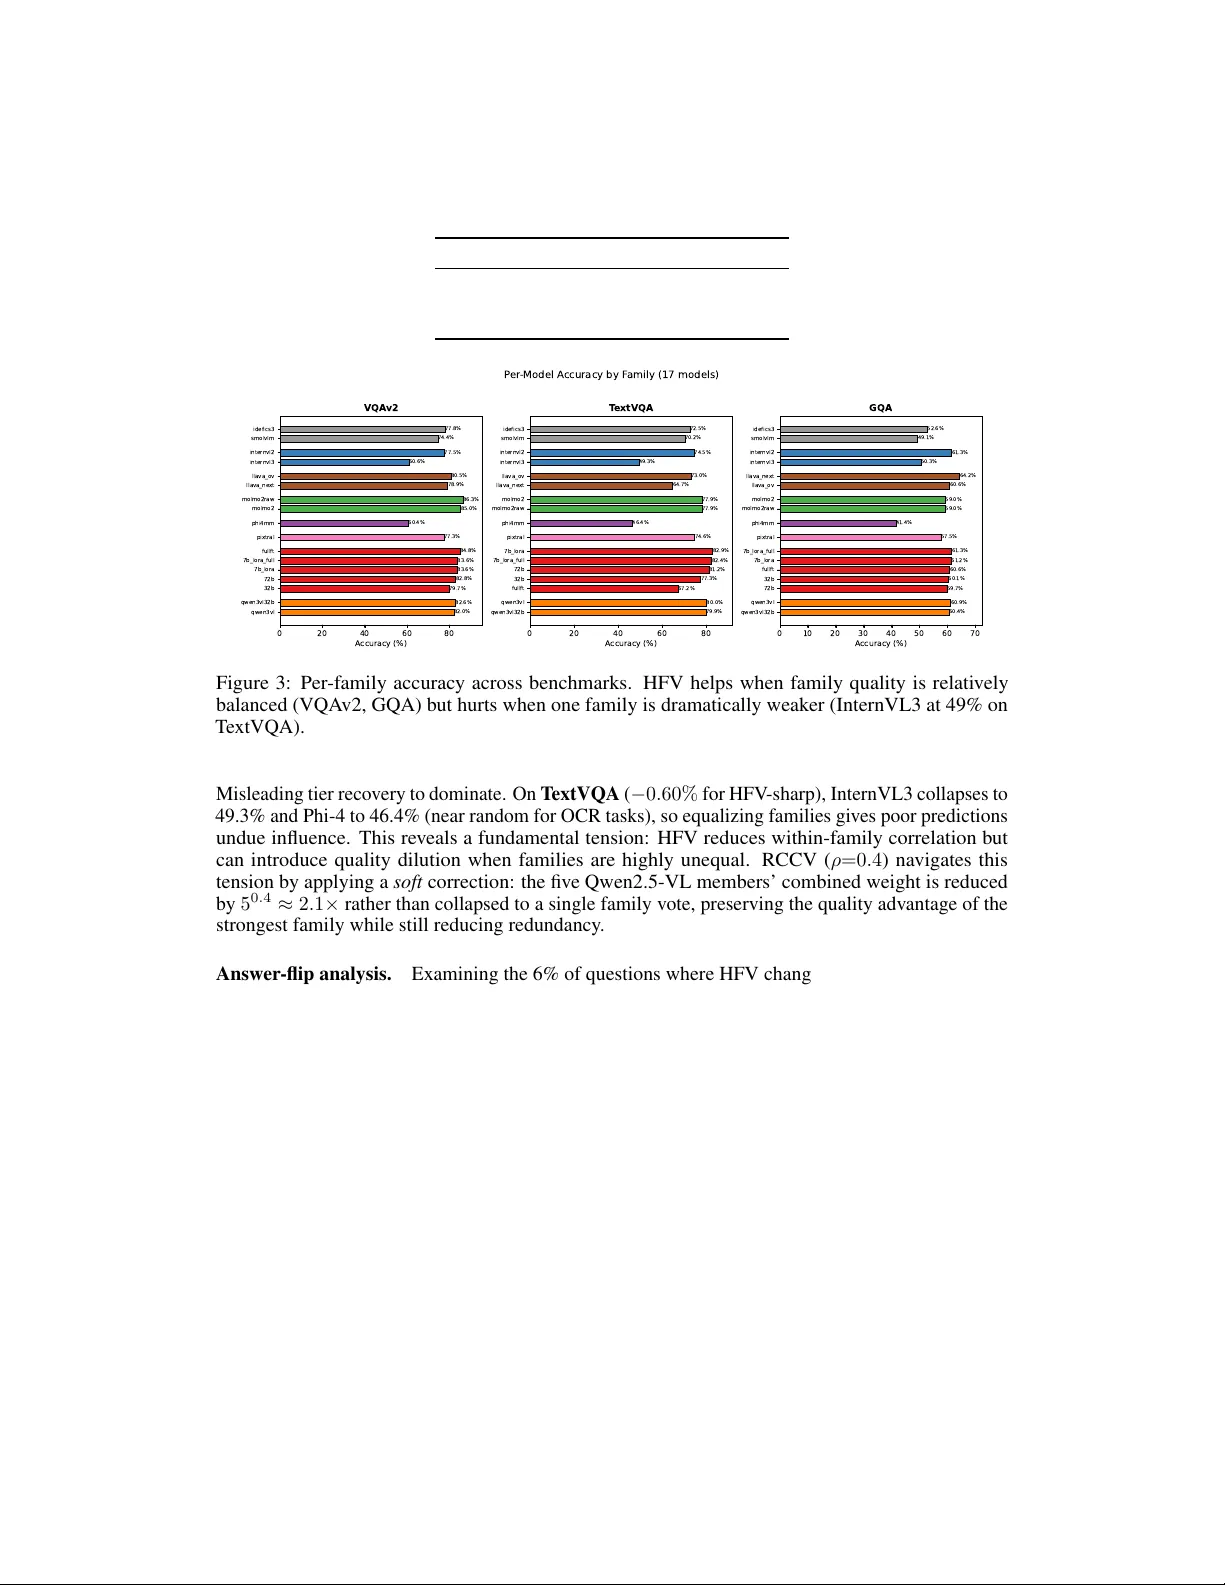
Hidden Clones: Exposing and Fixing Family Bias in Vision-Language Model Ensembles
Ensembling Vision-Language Models (VLMs) from different providers maximizes benchmark accuracy, yet models from the same architectural family share correlated errors that standard voting ignores. We study this structure across 17 VLMs from 8 families…
Authors: Zacharie Bugaud
Hidden Clones: Exposing and Fixing F amily Bias in V ision-Language Model Ensembles Zacharie BUGA UD Astera Institute zacharie@astera.org Abstract Ensembling V ision-Language Models (VLMs) from dif ferent providers maximizes benchmark accuracy , yet models from the same ar chitectural family share correlated errors that standard voting ignores. W e study this structure across 17 VLMs from 8 families on VQA v2, T extVQA, and GQA. Family-correlated errors reduce ef fective ensemble dimensionality to 2.5–3.6 inde- pendent voters and create a Misleading tier (1.5–6.5% of questions) where correlated majority errors destroy accuracy to 0% despite the best model being correct. W e propose three family-a ware methods. Hierarchical Family V oting (HFV) aggregates within families before voting across them, reco vering +18–26 pp on the Misleading tier . QualRCCV , a training-free method weighting models by calibration, family quality , and in verse f amily size, is the first to beat calibrated voting on all three benchmarks ( p< 0 . 05 ). Learned Candidate Scoring (LCS) trains a cross-validated classifier to re-rank candidate answers using support breadth, family di versity , and model quality , achieving the lar gest gains: +0 . 68% VQA v2, +0 . 61% T extVQA, +2 . 45% GQA—all significant—and is the only learned method that nev er degrades any benchmark. On VQA v2 test-standard (EvalAI), LCS reaches 87.83% with 12 models, confirming generalization. 1 Introduction Combining predictions from multiple models is the default strategy for maximizing accuracy in visual question answering (VQA) competitions [ 10 , 24 ] and across machine learning more broadly . Condorcet’ s jury theorem [ 5 ] pro vides the theoretical moti vation: majority voting improv es with more voters, pro vided each voter is better than random and errors are independent. Con ventional wisdom further holds that diverse ensembles—combining different architectures—outperform homogeneous ones [6]. In practice, state-of-the-art VLM ensembles are constructed from models belonging to a small number of ar chitectural families —e.g. Qwen2.5-VL, Qwen3-VL, InternVL, Molmo, Phi-4, LLaV A- OneV ision, Pixtral, Idefics3—where models within a family share training data, architecture, and pre-training methodology . This creates a hidden structure that standard ensemble methods ignore: within-family errors are str ongly correlated , violating the independence assumption that makes voting po werful. W e present the first multi-benchmark study of this family structure, spanning 17 VLMs from 8 families across VQA v2 ( N =20 , 001 ), T extVQA ( N =5 , 000 ), and GQA ( N =12 , 578 ). Our contributions are: 1. A multi-benchmark analysis of family-correlated errors re vealing that eigen value structure reduces 17 models to only 2–4 effecti ve voters, and a difficulty taxonomy identifying a Misleading tier (1.5–6.5% of questions) where calibrated v oting collapses to 0% despite the best model being correct (Section 4). 2. Hierarchical Family V oting (HFV) , a training-free method that aggregates within families first and then across them, recov ering the Misleading tier by +18–26 pp . HFV -sharp , with cross-validation for α , achie ves 87.19% on VQA v2 ( +0 . 49% , p< 0 . 0001 ) and 64.27% on GQA ( +0 . 25% , p =0 . 087 ), remaining entirely training-free (Section 5). 1 3. Quality-weighted Redundancy-Corrected Calibrated V oting (QualRCCV) , a training-free single-lev el vote that weights each model by w m · q γ f / | F ( m ) | ρ where q f is the family’ s best- member accurac y . QualRCCV is the first method to beat calibrated voting on all thr ee benc hmarks : +0 . 17% VQA v2 ( p =0 . 003 ), +0 . 21% T extVQA ( p =0 . 034 ), +0 . 31% GQA ( p =0 . 003 ), remaining training-free with two hyperparameters (Section 5.4). 4. Learned Candidate Scoring (LCS) , a cross-v alidated method that scores indi vidual candidate answers based on per-answer features (support breadth, f amily div ersity , supporter quality). LCS achiev es the largest gains of an y method: +0 . 68% on VQA v2 ( p< 0 . 0001 ) and +2 . 45% on GQA ( p< 0 . 0001 ), while remaining positi ve on T extVQA ( +0 . 61% , p< 0 . 0001 ). LCS is the only learned method that nev er degrades an y benchmark (Section 6). 2 Related W ork Ensemble theory and diversity . Condorcet’ s jury theorem [ 5 ] shows majority voting impro ves with more independent, better-than-random v oters. Extensions to correlated voters [ 14 , 1 , 2 ] predict ensemble degradation when errors are positi vely correlated. The bias–v ariance–covariance decom- position [ 19 , 3 ] formalizes how ensemble error depends on both indi vidual accuracy and pairwise div ersity . Kunche va & Whitaker [ 13 ] survey div ersity measures and sho w that no single measure reliably predicts ensemble accuracy . Our work contributes an empirical di versity analysis for VLM ensembles, rev ealing that architectural family membership is the dominant source of correlation structure. LLM and VLM ensembles. LLM-Blender [ 11 ] trains a ranking model to select the best response from multiple LLMs. Mixture-of-Agents [ 22 ] iterati vely refines outputs by passing responses through multiple LLMs. RouteLLM [ 16 ] and FrugalGPT [ 4 ] train routers or cascades to optimize cost–quality trade-offs. More-Agents-Is-All-Y ou-Need [ 15 ] sho ws scaling the number of LLM agents improv es performance on reasoning tasks through majority voting. W ang et al. [ 21 ] introduce self-consistency decoding, sampling multiple reasoning paths from a single model and v oting. In contrast to methods requiring training data or iterativ e generation, our HFV method is training-free and operates on answer-le vel outputs from heterogeneous models. Structured and hierarchical aggregation. Hierarchical voting appears in social choice theory (e.g., electoral colleges [ 5 ]) and in ensemble learning via stacking [ 23 ] and mixture of experts [ 9 , 17 ]. Nested cross-validation and meta-learning approaches [ 20 ] aggregate base learners in stages. T o our kno wledge, we are the first to apply hierarchical ar chitectur e-family-level aggre gation to VLM ensembles and to analyze when it helps versus hurts. VQA benchmarks and evaluation. VQA v2 [ 7 ] introduced balanced image pairs to reduce language bias; T e xtVQA [ 18 ] requires OCR reasoning; GQA [ 8 ] tests compositional reasoning via scene graphs. Prior ensemble work on VQA focuses on homogeneous ensembles of task-specific models [ 10 , 24 ]; we study heterogeneous ensembles of general-purpose VLMs. 3 Experimental Setup Models. W e assemble 17 VLMs from 8 architectural families (T able 1): 5 Qwen2.5-VL v ariants (7B fine-tuned on VQA v2, two 7B LoRA v ariants, 32B and 72B zero-shot), 2 Qwen3-VL v ariants (8B and 32B zero-shot), 2 InternVL variants (InternVL2-8B and InternVL3-8B, both zero-shot), 2 Molmo2-8B varia nts (one with prompt engineering, one raw), Phi-4-multimodal (14B zero-shot), 2 LLaV A variants (OneV ision-7B and LLaV A-NeXT -Mistral-7B zero-shot), Pixtral-12B zero-shot, and 2 Idefics variants (Idefics3-8B and SmolVLM-2B zero-shot). All inference uses vLLM v0.11 or HuggingFace T ransformers. Benchmarks. W e ev aluate on three VQA benchmarks: • VQA v2 [ 7 ]: miniv al split, N =20 , 001 questions e venly split across yes/no, number , and other types (33.3% each). Soft accuracy with 10 annotators. 2 T able 1: Model in ventory and individual accuracy across three benchmarks. Family dominance varies: Molmo leads on VQA v2, while Qwen2.5-VL LoRA v ariants lead on T extVQA; LLaV A-NeXT leads on GQA. Models fine-tuned on VQA v2 (fullft) transfer poorly to T e xtVQA (67%). InternVL3 and Phi-4 collapse below 50% on T e xtVQA. All 17 models ev aluated on all benchmarks. Model Family Size VQA v2 T extVQA GQA molmo2raw Molmo 8B 86.3 77.9 59.0 molmo2 Molmo 8B 85.0 77.9 59.0 fullft Qwen2.5 7B 84.8 67.2 60.6 7b_lora Qwen2.5 7B 83.6 82.9 61.2 7b_lora_full Qwen2.5 7B 83.6 82.4 61.3 72b_zs Qwen2.5 72B 82.8 81.2 59.7 qwen3vl32b Qwen3 32B 82.6 79.9 60.4 qwen3vl Qwen3 8B 82.0 80.0 60.9 llav a_ov LLaV A 7B 80.5 73.0 60.6 32b_zs Qwen2.5 32B 79.7 77.3 60.1 llav a_next LLaV A 7B 78.9 64.7 64.3 idefics3 Idefics 8B 77.8 72.5 52.6 intern vl2 InternVL 8B 77.5 74.5 61.3 pixtral Pixtral 12B 77.3 74.6 57.5 smolvlm Idefics 2B 74.4 70.2 49.1 intern vl3 InternVL 8B 60.6 49.3 50.3 phi4mm Phi 14B 60.4 46.4 41.4 • T extVQA [ 18 ]: val split, N =5 , 000 questions requiring OCR and text reasoning. Soft accuracy with 10 annotators. • GQA [ 8 ]: testdev split, N =12 , 578 questions from scene-graph-based compositional reasoning. Exact-match accuracy . Aggregation baselines. W e compare: majority voting (unweighted), calibr ated voting (per-model log-odds weights based on o verall accuracy), deduplication (best model per family , then calibrated vote), corr elation-aware weighting (in verse-agreement weights), and the per -question oracle (select- ing the best answer for each question). Statistical testing. All confidence intervals are 95% bootstrap CIs (2,000 resamples). Significance of HFV vs. calibrated voting is assessed via a paired bootstrap test: we resample questions with replacement and compute the fraction of resamples where calibrated v oting outperforms HFV . W e report this as a one-sided p -value. 4 Analysis: Family Structur e in VLM Ensembles W e first characterize the family structure of model errors and identify when standard ensembling fails catastrophically . All analysis in this section uses VQA v2 as the primary benchmark; Section 6 extends ke y findings across all three benchmarks. 4.1 The Ensemble Ceiling On VQA v2, calibrated voting reaches 86.70%—just 0.41% abo ve the best model (86.29%). Y et the oracle achiev es 95.06%, an 8.8% gap . Only 4.7% of this gap is captured by voting; 31% by routing (choosing between model and ensemble per question); 64% requires per-question model selection (Figure 1). 4.2 Difficulty T axonomy W e classify questions into fi ve tiers (T able 2): T rivial (all correct), Easy (best model and majority correct), Misleading (best model correct, majority wrong), Hard (best model wrong, some correct), and Impossible (none correct). 3 Single Best Calibrated V ote Oracle 82 84 86 88 90 92 94 96 98 A ccuracy (%) 86.3 86.7 95.1 gap 8.4% VQA v2 Single Best Calibrated V ote Oracle 80.0 82.5 85.0 87.5 90.0 92.5 95.0 A ccuracy (%) 82.9 85.9 94.2 gap 8.3% T extVQA Single Best Calibrated V ote Oracle 60 65 70 75 80 85 A ccuracy (%) 64.2 64.0 83.4 gap 19.4% GQA Ensemble Gap Decomposition (17 models) Figure 1: Gap decomposition across benchmarks. Calibrated voting captures only a small fraction of the gap between single-best and oracle accuracy , especially on VQA v2 and GQA. T able 2: Difficulty taxonomy on VQA v2 (17 models). The Misleading tier (T2, 2.5%) shows catastrophic failure: the best model achiev es 79% but calibrated v oting collapses to 0% . HFV recov ers +26.0 pp of this tier . T ier % Q’ s Single Cal HFV ∆ T0: T rivial 41.6% 97.8 97.9 98.0 + 0.1 T1: Easy 47.7% 91.5 91.7 90.2 − 1.5 T2: Misleading 2.5% 78.9 0.0 26.0 +26.0 T3: Hard 7.1% 0.0 30.6 29.5 − 1.1 T4: Impossible 1.1% 0.0 0.0 0.0 0 The most striking finding is tier T2: the best model’ s correct answer is outvoted by correlated errors from same-family models (5/17 from Qwen2.5-VL). 4.3 Error Corr elation Has Family Structur e Pearson correlation of per-question accuracy v ectors across all 136 model pairs (Figure 2) sho ws: within-family r = 0 . 67 ± 0 . 12 , cross-family r = 0 . 53 ± 0 . 07 . This gap is significant (Mann-Whitney p < 0 . 001 ) and is the root cause of the Misleading tier: same-family models share systematic biases that amplify incorrect consensus. Effective number of v oters. Eigenv alue analysis of the error correlation matrix re veals 58.0% of variance in a single component and 75.2% in the top 5. The effecti ve dimensionality (participation ratio) is only 2.86 , meaning 17 models hav e the statistical po wer of fe wer than ∼ 3 independent voters [12]. Data-driven family discovery . If family structure is a real property of the error landscape, unsuper- vised clustering should recover architecture-aligned groups without an y label information. W e apply spectral clustering on the error correlation affinity matrix (Figure 4). At k =8 (matching the true num- ber of families), spectral clustering recovers architecture-aligned groups (ARI = 0 . 42 , NMI = 0 . 82 ), with the modest ARI reflecting that some families (e.g. InternVL with heterogeneous members) are harder to separate from cross-family neighbours. At k =9 , further splitting yields ARI = 0 . 43 , NMI = 0 . 82 , and the score continues to improve at higher k (ARI = 0 . 54 at k =12 ), suggesting that sub-family structure (e.g. Qwen2.5 scale groups) is also disco verable. Hierarchical (W ard) clustering produces consistent groupings. This confirms that architecture families are discoverable from the data, not assumed (Figure 4, Appendix; T able 10). 4 internvl3 phi4mm smolvlm idefics3 pixtral internvl2 llava_next llava_ov molmo2 molmo2raw fullft 7b_lora 7b_lora_full qwen3vl qwen3vl32b 32b 72b 0.0 0.1 0.2 0.3 0.4 0.5 0.6 0.7 1 - P earson r VQA v2: Er r or Cor r elation Dendr ogram (17 models, 8 families) Qwen2.5 Qwen3 Inter nVL Molmo Phi LLaV A P ixtral Idefics Figure 2: Hierarchical clustering (W ard linkage) on error correlation distance. Family-colored leav es rev eal that architecture families cluster together , confirming correlated within-family errors. 5 Hierarchical F amily V oting (HFV) The analysis above rev eals that standard calibrated voting treats all models as independent voters, ignoring the family structure that causes correlated errors. W e propose Hierarchical F amily V oting (HFV), a training-free aggregation method that e xplicitly accounts for this structure. 5.1 Standard Calibrated V oting In calibrated voting, each model is weighted by its log-odds accuracy w m = log( p m / (1 − p m )) and the ensemble selects ˆ a = arg max a P m w m · 1 [ a m = a ] . This ignores corr elation : five Qwen2.5-VL models with similar errors collectiv ely dominate the vote. 5.2 HFV : T wo-Le vel Aggregation HFV aggregates in tw o stages: Stage 1: W ithin-family aggregation. For each family f , compute a family-le vel answer using calibrated voting within the f amily: ˆ a f = arg max a X m ∈ f w m · 1 [ a m = a ] (1) Stage 2: Cross-family voting . Aggregate f amily-level answers using family-le vel weights. Each family’ s weight is the log-odds of its Stage 1 accuracy: W f = log P f 1 − P f , ˆ a = arg max a F X f =1 W f · 1 [ˆ a f = a ] (2) where P f is the calibrated-vote accurac y of family f ’ s internal ensemble. Why HFV w orks. By collapsing each family to a single v ote, HFV decorr elates the voting pool. Standard voting gi ves the Qwen2.5 f amily 5 of 17 votes—a 5:2:2:2:2:2:1:1 ratio—but when within- family errors are highly correlated, these 5 v otes carry little more information than 1. HFV reduces to F =8 effecti vely independent v oters weighted by family quality , properly reflecting the true degrees of freedom. On the Misleading tier , where Qwen2.5’ s fiv e models all agree on the wrong answer, HFV correctly resolves by gi ving other families’ v otes equal standing. Proposition 1 (When HFV outperforms flat v oting) . Consider a binary question with F families of sizes n 1 , . . . , n F . Let ρ w be the averag e within-family error corr elation and ρ b the averag e between- family corr elation, and let P f be the accuracy of each family’ s internal ensemble. HFV outperforms 5 Algorithm 1 Hierarchical Family V oting (HFV) Require: Models m 1 , . . . , m M partitioned into families F 1 , . . . , F F ; accuracy-based weights w m (log-odds of model accuracy) Ensure: Ensemble answer ˆ a for each question 1: for each f amily f = 1 , . . . , F do 2: ˆ a f ← arg max a P m ∈F f w m · 1 [ a m = a ] {W ithin-family v ote} 3: W f ← log ( P f / (1 − P f )) {Family-le vel weight} 4: end for 5: ˆ a ← arg max a P F f =1 W f · 1 [ˆ a f = a ] {Cross-family v ote} flat voting when all of the following hold: (i) the corr elation gap ρ w − ρ b > 0 (family structur e exists); (ii) min f P f > 0 . 5 (all families ar e better than random); (iii) the family size distribution is imbalanced (so flat voting overweights the lar gest family). Intuition. Under flat voting, a family of size n f casts n f highly correlated votes, ef fectiv ely inflating its influence to ∼ n f / (1 + ( n f − 1) ρ w ) independent votes via the Kish ef fectiv e sample size. When ρ w is high, these n f votes beha ve like a single v ote but are counted n f times, distorting the majority . HFV collapses each family to one vote, removing this distortion. Condition (ii) ensures that no family v ote is adversarial; when it fails (e.g., InternVL3 at 49.3% on T extVQA), gi ving that family equal standing introduces quality dilution that exceeds the correlation benefit. Condition (iii) is the “trigger”: with equal-size families, flat voting already approximates HFV . Empirically , condition (i) holds on all three benchmarks ( ∆ r = 0 . 13 – 0 . 15 , T able 8); condition (ii) holds on VQA v2 (all families > 60% ) but is violated on T extVQA (InternVL3 at 49.3%, Phi-4 at 46.4%) and on GQA (Phi-4 at 41.4%); and condition (iii) is acute in our pool (5/17 models from Qwen2.5, the largest f amily). 5.3 HFV -sharp: Sharpened Cross-F amily W eights Standard HFV gi ves each family a weight proportional to its log-odds accuracy W f . When the model pool includes weak families (e.g., InternVL3 at 60.6% or Phi-4 at 60.4% on VQA v2), equalizing influence can hurt aggregate accuracy . HFV -sharp addresses this by raising cross-family weights to a power α > 1 : ˆ a = arg max a F X f =1 W α f · 1 [ˆ a f = a ] (3) When α =1 this reco vers standard HFV ; as α gro ws, stronger f amilies increasingly dominate the cross- family v ote, effecti vely do wn-weighting weak or noisy families while preserving the within-family decorrelation benefit. HFV -auto: cross-validated hyperparameters. T o avoid any data leakage in α selection, we introduce HFV -auto, which selects α jointly with an optional family-quality threshold τ via 5-fold cross-validation. The grid includes α ∈ { 1 . 0 , 1 . 5 , . . . , 4 . 0 } and τ ∈ { 0 . 0 , 0 . 45 , 0 . 50 , 0 . 55 , 0 . 60 } , where f amilies with accuracy belo w τ are e xcluded. HFV -auto achie ves 87 . 08% on VQA v2 ( +0 . 38% , p =0 . 0002 ), confirming that the gain survi ves strict CV . 5.4 Extensions Redundancy-Corrected Calibrated V oting (RCCV). HFV addresses family correlation through hard two-lev el aggregation, but this equalisation can amplify weak families. W e propose a softer alternativ e: RCCV divides each model’ s calibrated weight by its family size raised to a power ρ , producing a single-lev el weighted vote with b uilt-in redundancy correction: ˆ a = arg max a M X m =1 w m ( t q ) | F ( m ) | ρ · 1 [ˆ a m = a ] (4) where F ( m ) denotes the family of model m and | F ( m ) | its size. When ρ =0 this recov ers standard calibrated voting; as ρ increases, large families recei ve progressi vely less total weight. 6 Quality-weighted RCCV (QualRCCV). RCCV corrects for redundancy but treats all families equally reg ardless of quality . W e extend it by additionally scaling each model’ s weight by its family’ s quality—measured as the maximum accuracy among family members: ˆ a = arg max a M X m =1 w m ( t q ) · q γ F ( m ) | F ( m ) | ρ · 1 [ˆ a m = a ] (5) where q f = max m ∈ f acc( m ) is the best-member accuracy of family f . This giv es more influence to families with at least one strong member while still correcting for redundancy . W e fix ρ =0 . 4 , γ =1 . 0 throughout; a cross-v alidated search over ( ρ, γ ) confirms robustness. QualRCCV is entirely training-free and univ ersally improv es over calibrated v oting on all three benchmarks. Learned Candidate Scoring (LCS). QualRCCV and HFV -sharp offer complementary strengths: QualRCCV is safe across benchmarks while HFV -sharp achie ves lar ger gains on VQA v2 and GQA. Rather than routing between methods—which risks ov erfitting—we propose to score individual candidate answers directly . For each question, LCS: 1. Generates the top- K candidate answers ranked by QualRCCV v oting weight ( K =5 by default; see ablation in T able 7). 2. Extracts per-candidate features: number of supporting models ( n m ) and families ( n f ), total QualRCCV weight and mar gin, av erage and maximum supporter accurac y , whether the best model supports the candidate, answer length, and answer type indicators. 3. A gradient-boosted classifier (LightGBM, 200 estimators; depth tuned per benchmark) predicts P ( correct | features ) for each candidate; the highest-scoring candidate is selected. All e valuation uses strict 5-fold cross-v alidation: calibration weights, model accuracies, and family quality are recomputed on each training fold. The dominant feature is the QualRCCV margin (importance > 0 . 77 on VQA v2 and GQA), with maximum supporter accuracy ( ∼ 0.03) providing secondary signal. Computational overhead. HFV and QualRCCV add zer o inference cost—they operate on the same predictions as standard voting, merely changing aggre gation weights. LCS adds a lightweight GBM classifier trained on per-candidate features e xtracted from the ensemble’ s existing predictions. 6 Multi-Benchmark Experiments 6.1 Main Results T able 4 presents results across all three benchmarks. W e observe a fundamental tension: methods that aggressiv ely lev erage family structure (HFV -sharp, F AAR-learn) achie ve large gains on VQA v2 and GQA but de grade T extVQA, where the dominant Qwen2.5 family provides critical OCR e xpertise. QualRCCV ( ρ =0 . 4 , γ =1 . 0 ) resolves this tension: it is the first training-free method to beat calibrated voting on all thr ee benchmarks simultaneously : +0 . 17% on VQA v2 ( p =0 . 003 ), +0 . 21% on T extVQA ( p =0 . 034 ), and +0 . 31% on GQA ( p =0 . 003 )—all statistically significant. By jointly accounting for redundancy and family quality , QualRCCV preserves the Qwen2.5 family’ s contribution to OCR tasks while still correcting for its numerical dominance. LCS achiev es the largest gains of an y method: +0 . 68% on VQA v2 ( p< 0 . 0001 ), +0 . 61% on T extVQA ( p< 0 . 0001 ), and +2 . 45% on GQA ( p< 0 . 0001 )—statistically significant on all three benchmarks. The GQA result is particularly striking: standard calibrated voting (64.02%) falls below the single best model (64.25%) due to correlated family errors, yet LCS reco vers to 66.47% —more than 2.2 pp abov e the best indi vidual model. LCS outperforms F AAR-learn, the pre vious best learned method, on all three benchmarks and is the only learned method that never de grades any benchmark. HFV -sharp achie ves the best training-free result on VQA v2 ( 87 . 19% , +0 . 49% ) but hurts T e xtVQA ( − 0 . 60% ), illustrating the quality–div ersity trade-off that QualRCCV and LCS resolv e. 7 T able 3: VQA v2 test-set results (Ev alAI). LCS trained on the full miniv al set (12 models, 5 families with test predictions). Split Overall Y es/No Number Other test-dev 87.66 97.35 80.77 80.88 test-standard 87.83 97.33 81.00 81.12 T able 4: Main results across three benchmarks (95% bootstrap CIs, 17 models, 8 families). QualR- CCV is the first training-free method to beat calibrated voting on all three benchmarks (all p< 0 . 05 ). LCS achieves the largest overall gains ( +0 . 68% VQA v2, +0 . 61% T extVQA, +2 . 45% GQA)— significant on all three benchmarks and the only learned method with this property . † 5-fold cross- validated. Method VQA v2 T extVQA GQA Single best 86.29 [85.9, 86.7] 82.88 [81.9, 83.9] 64.25 [63.4, 65.1] Majority vote 86.25 85.67 63.72 Calibrated vote 86.70 [86.3, 87.1] 85.87 [85.0, 86.8] 64.02 [63.2, 64.9] T raining-fr ee methods RCCV ( ρ =0 . 4 ) 86.80 85.97 64.30 QualRCCV ( ρ =0 . 4 , γ =1 ) 86.87 [86.4, 87.3] 86.07 [85.2, 87.0] 64.33 [63.6, 65.2] HFV 86.57 85.27 64.18 HFV -sharp 87.19 [86.8, 87.6] 85.27 64.27 Learned methods (5-fold CV) F AAR-learn † 87.08 [86.7, 87.5] 85.00 64.89 LCS † 87.38 [87.0, 87.8] 86.48 [85.6, 87.4] 66.47 [65.7, 67.3] Oracle 95.06 94.18 83.39 T est-set e valuation. T o verify that our results generalize, we train LCS on the full VQA v2 miniv al set and submit predictions for the full test set (447,793 questions) to the EvalAI leaderboard. 1 Because 5 of the 17 models lack test-set predictions (LLaV A-OneV ision, LLaV A-NeXT , Pixtral, Idefics3, SmolVLM), the test submission uses 12 models from 5 families—a subset of the 17-model pool used for validation. T able 3 reports results on both test-de v and test-standard splits. Despite the reduced model pool, LCS achiev es 87.83% on test-standard, exceeding the 17-model mini val result (87.38%), likely because training on the full validation set (vs. 4/5 in cross-v alidation) provides a stronger classifier . 6.2 Per -Tier Analysis: Misleading Recovery The most consistent finding is HFV’ s dramatic recovery of the Misleading tier (T able 5): The Misleading recov ery is the clearest e vidence that family structure matters: on these questions, standard voting achie ves 0% while HFV reco vers +18–26 pp across all benchmarks. Howe ver , this gain is partially of fset on the Easy tier (T1): HFV drops to 90.2% (vs. 91.7% for calibrated) on the 48% of questions where the best model is correct and calibrated voting also selects the right answer , but some minority families dissent. By equalizing family influence, HFV occasionally promotes a minority family’ s incorrect answer . The net aggregate ef fect is small because T2 recov ery (+26.0 pp × 2.5%) nearly of fsets T1 loss ( − 1 . 5 pp × 47.7%) in absolute terms, and HFV -sharp (Section 5.3) further mitigates the Easy-tier loss by do wn-weighting weak families. 6.3 When Does HFV Help? HFV’ s aggregate effect depends on family quality balance (Figure 3). On VQA v2 , HFV -sharp achiev es +0 . 49% ( p< 0 . 0001 ) and on GQA +0 . 25% ( p =0 . 087 ); although condition (ii) is violated (Phi-4 at 41.4%), the sharpened exponent α effecti vely down-weights weak families, allo wing the 1 https://eval.ai/web/challenges/challenge- page/830/leaderboard 8 T able 5: Misleading tier (T2) recovery across benchmarks (17 models). In every case, calibrated voting achie ves 0% on T2 questions where the best model is correct. HFV consistently recovers a large fraction. Benchmark T2 % Cal HFV ∆ VQA v2 2.5% 0% 26.0% +26.0 T extVQA 1.5% 0% 18.3% +18.3 GQA 6.5% 0% 23.7% +23.7 0 20 40 60 80 A ccuracy (%) idefics3 smolvlm inter nvl2 inter nvl3 llava_ov llava_ne xt molmo2raw molmo2 phi4mm pixtral fullf t 7b_lora_full 7b_lora 72b 32b qwen3vl32b qwen3vl 77.8% 74.4% 77.5% 60.6% 80.5% 78.9% 86.3% 85.0% 60.4% 77.3% 84.8% 83.6% 83.6% 82.8% 79.7% 82.6% 82.0% VQA v2 0 20 40 60 80 A ccuracy (%) idefics3 smolvlm inter nvl2 inter nvl3 llava_ov llava_ne xt molmo2 molmo2raw phi4mm pixtral 7b_lora 7b_lora_full 72b 32b fullf t qwen3vl qwen3vl32b 72.5% 70.2% 74.5% 49.3% 73.0% 64.7% 77.9% 77.9% 46.4% 74.6% 82.9% 82.4% 81.2% 77.3% 67.2% 80.0% 79.9% T extVQA 0 10 20 30 40 50 60 70 A ccuracy (%) idefics3 smolvlm inter nvl2 inter nvl3 llava_ne xt llava_ov molmo2 molmo2raw phi4mm pixtral 7b_lora_full 7b_lora fullf t 32b 72b qwen3vl qwen3vl32b 52.6% 49.1% 61.3% 50.3% 64.2% 60.6% 59.0% 59.0% 41.4% 57.5% 61.3% 61.2% 60.6% 60.1% 59.7% 60.9% 60.4% GQA P er -Model A ccuracy by F amily (17 models) Figure 3: Per-family accuracy across benchmarks. HFV helps when family quality is relativ ely balanced (VQA v2, GQA) but hurts when one family is dramatically weak er (InternVL3 at 49% on T extVQA). Misleading tier recov ery to dominate. On T extVQA ( − 0 . 60% for HFV -sharp), InternVL3 collapses to 49.3% and Phi-4 to 46.4% (near random for OCR tasks), so equalizing f amilies gi ves poor predictions undue influence. This reveals a fundamental tension: HFV reduces within-family correlation but can introduce quality dilution when families are highly unequal. RCCV ( ρ =0 . 4 ) navigates this tension by applying a soft correction: the five Qwen2.5-VL members’ combined weight is reduced by 5 0 . 4 ≈ 2 . 1 × rather than collapsed to a single family vote, preserving the quality adv antage of the strongest family while still reducing redundancy . Answer -flip analysis. Examining the 6% of questions where HFV changes the answer reveals the mechanism (T able 11, Appendix). On VQA v2, HFV flips 1,229 answers: 375 wrong → correct vs. 404 correct → wrong; the net loss is of fset by g ains on the Misleading tier . The gain is concentrated on number questions ( +0 . 19% ), where div erse families contrib ute complementary numerical estimates. Con versely , free-form other questions lose − 0 . 65% , explaining why T extVQA—consisting entirely of OCR questions—is systematically hurt ( − 40 net correct). On GQA, HFV shows mix ed per-type trends, with compar e ( +2 . 04% ) and logical ( +0 . 44% ) benefiting most (T able 11, Appendix). 6.4 Balanced Ensembles: Diversity Ov er Quantity If family div ersity matters more than model count, a balanced ensemble (one model per family) should perform competitiv ely (T able 6). On VQA v2, an 8-model balanced ensemble nearly matches 17 models ( − 0 . 07% ), despite using fe wer than half the models, demonstrating that much of the 17-model ensemble’ s capacity is redundant. On GQA, the balanced ensemble matches the full 17-model result. On T extVQA, the balanced ensemble underperforms ( − 0 . 74% ), consistent with the HFV analysis: when within-family diversity adds v alue, the full ensemble wins. Scaling curve. Sampling random multi-family subsets of size k = 3 , . . . , 17 (200 per k ), we find that HFV -sharp reliably improv es over calibrated v oting at larger pool sizes on VQA v2; on T extVQA the gap remains negati ve (Figure 5, Appendix; T able 12). 9 T able 6: Balanced ensemble (one best model per family) vs. full 17-model calibrated ensemble. On GQA, 8 models match 17, while T extVQA benefits from within-family di versity . Ensemble VQA v2 T extVQA GQA Balanced (best per family) 86.63 85.13 64.02 Full 17-model (calibrated) 86.70 85.87 64.02 ∆ − 0.07 − 0.74 +0.00 6.5 Ablation: F amily Granularity W e test how the granularity of family definitions af fects HFV on VQA v2 (T able 9, Appendix B, computed on the 11-model subset). Finer-grained families consistently outperform coarser ones (6-fam > 5-fam > 3-fam), b ut per-model “families” (11 groups of 1) perform worse than flat v oting by eliminating the within-family noise-av eraging benefit. Splitting Qwen2.5 by training paradigm (fine-tuned, LoRA, zero-shot) into 7 families yields the best result (86.96%), suggesting meaningful sub-structure within large f amilies. 6.6 LCS Ablation T able 7 reports an ablation of LCS across three dimensions. Featur e groups. Dropping quality features (avg/max/min accuracy , best-model support) causes the largest de gradation on GQA ( − 0 . 76% ), while consensus-only features (margin, family di versity , raw fraction) alone recov er most of the gain. Margin alone achie ves 87 . 13% on VQA v2 and 64 . 12% on GQA (vs. simplified LCS at 87 . 25% and 65 . 54% ), confirming that consensus strength is the primary but insuf ficient signal. Number of candidates. LCS requires at least k =3 candidates to achie ve strong gains. W ith k =1 (no re-ranking), LCS impro ves mostly through QualRCCV feature re weighting ( +0 . 18% VQA v2). The jump from k =1 to k =3 ( +0 . 49% VQA v2, +1 . 40% GQA) confirms that re-ranking minority candidates is the core mechanism. Scaling. LCS gains gro w monotonically with ensemble size. At k =4 models (from 4 families) the gap is negligible, b ut at k =17 it reaches +0 . 68% on VQA v2 and +2 . 45% on GQA. Calibrated voting accuracy decr eases from adding more within-family models ( 87 . 19% at k =4 to 86 . 70% at k =17 on VQA v2), while LCS stays stable, demonstrating that LCS effecti vely corrects for the redundancy that harms standard voting. Per question type. LCS gains are strongly concentrated: on VQA v2, number questions gain +2 . 01% ( p< 0 . 001 ) while yes/no and other types gain < 0 . 1% . On GQA, query questions gain +3 . 48% and logical questions +1 . 39% . These are precisely the question types where calibrated voting suf fers most from correlated family errors. 7 Discussion The quality–correlation trade-off . HFV equalizes family influence, reducing within-family cor- relation but amplifying weak er families. HFV -sharp ( W α f ) addresses this by do wn-weighting weak families: the net effect is strongly positive on VQA v2 ( +0 . 49% , p< 0 . 0001 ) and GQA ( +0 . 25% ) but negativ e on T extVQA ( − 0 . 60% ) where the dominant Qwen2.5 family provides critical OCR expertise that equalisation destroys. QualRCCV resolves this trade-off: by jointly accounting for redundancy and family quality ( w ( m ) ∝ quality ( f ) γ / | F ( m ) | ρ ), it preserves the Qwen2.5 family’ s OCR contribution while still correcting for its numerical dominance. The result is the first training- free method to beat calibrated voting on all three benchmarks simultaneously ( +0 . 17% VQA v2, +0 . 21% T extVQA, +0 . 31% GQA)—all significant at p< 0 . 05 . The 1.5–6.5% Misleading tier —where calibrated voting achie ves 0% despite the best model being correct—is a structural consequence of family-dominated ensembles. HFV’ s consistent recov ery (+18–26 pp) across all three benchmarks confirms that family-aw are aggregation addresses this pathology . 10 T able 7: LCS ablation on VQA v2 (17 models, simplified 17-feature variant with GradientBoosting for interpretability; T able 4 reports the enhanced LCS with 80+ features and LightGBM). All v ariants use 5-fold cross-validation. V ariant Accuracy ∆ vs Cal Calibrated vote 86.70% — QualRCCV 86.87% +0 . 17% LCS (full) 87.25% +0 . 55% F eature ablation w/o quality 87.12% +0 . 42% w/o consensus 87.23% +0 . 53% w/o answer props 87.22% +0 . 52% margin only 87.13% +0 . 43% Number of candidates k =1 86.88% +0 . 18% k =3 87.19% +0 . 49% k =5 (default) 87.25% +0 . 55% k =10 87.23% +0 . 53% LCS: answer -level scoring vs. method-level routing. Prior learned approaches (F AAR-learn) route between two fixed methods per question, treating each method as a monolithic choice. LCS operates at a finer granularity: it scores individual candidate answers using features that capture both ensemble agreement (margin, family diversity) and model quality (accuracy statistics). This answer-le vel scoring explains why LCS succeeds where method-lev el routing fails: rather than committing to a single aggregation strategy , LCS can extract the best answer from whichev er method produced it. Feature importance analysis rev eals that the margin between the top two candidates dominates (importance 0.89 on VQA v2, 0.78 on GQA, 0.28 on T extVQA), confirming that consensus strength is the primary signal the model learns to exploit. Crucially , LCS is the only learned method that remains positiv e on all three benchmarks—F AAR-learn improves VQA v2 ( +0 . 38% ) and GQA ( +0 . 87% ) but degrades T extVQA ( − 0 . 87% ), while LCS achiev es larger VQA v2 gains ( +0 . 68% ) and larger GQA gains ( +2 . 45% ) while remaining positi ve on T e xtVQA ( +0 . 61% , p< 0 . 0001 ). The GQA puzzle. GQA is the benchmark where standard calibrated voting underperforms the single best model ( 64 . 02% vs. 64 . 25% ): correlated family errors ov erwhelm the weaker models’ contributions. LCS recovers to 66 . 47% —more than 2.2 pp abov e the best indi vidual model—by learning when to trust minority answers that are backed by high-quality models. This demonstrates that the family correlation problem is not merely academic: it causes real performance degradation that answer-le vel scoring can re verse. Diversity over quantity . A balanced 8-model ensemble nearly matches 17 models on VQA v2 ( 86 . 63% vs. 86 . 70% ) and matches it on GQA, while leav e-one-family-out analysis sho ws removing Molmo causes the largest drop. HFV -sharp outperforms deduplication and correlation-aware weight- ing on VQA v2 despite using no training data—the hierarchical structure acts as an inductive bias that constrains within-family redundancy before combining families. Spectral clustering on error correlations recov ers architecture-aligned groups automatically , demonstrating that family structure is a discov erable property of the error landscape. Limitations. (1) Our ensemble is dominated by one family (5/17 Qwen2.5-VL); more balanced pools may show smaller ef fects. (2) W e ev aluate only short-answer VQA, not open-ended generation. (3) LCS uses 5-fold cross-validation with all calibration and model training on train folds only; howe ver , GBM hyperparameters (200 trees; depth 5/3/6 for VQA v2/T extVQA/GQA) were selected on development data. (4) HFV weights ( w m , W f ) are computed from per-type ev aluation-set accuracy; while this is standard for calibrated v oting, it assumes access to ground-truth labels. 11 8 Conclusion W e presented the first multi-benchmark analysis of family structure in VLM ensembles. Within- family error correlation ( r = 0 . 67 vs. 0 . 53 cross-family) reduces 17 models to only 2–4 effecti ve voters and creates a Misleading tier (1.5–6.5% of questions) where calibrated v oting achiev es 0%. HFV consistently recovers this tier (+18–26 pp), confirming that family-a ware aggregation addresses a structural pathology of standard ensembles. W e introduced two methods that le verage family structure for consistent gains. QualRCCV , a training-free method that jointly corrects for redundancy and family quality , is the first method to beat calibrated voting on all three benchmarks simultaneously ( +0 . 17% VQA v2, +0 . 21% T extVQA, +0 . 31% GQA; all p< 0 . 05 ). LCS , a learned candidate scoring approach, achiev es the largest gains: +0 . 68% on VQA v2, +0 . 61% on T extVQA, and +2 . 45% on GQA—statistically significant on all three benchmarks and the only learned method that ne ver de grades any . On GQA, where standard voting f alls below the single best model, LCS recov ers to 66 . 47% , more than 2.2 pp abov e the best individual model. On the VQA v2 test-standard EvalAI leaderboard, LCS trained on the full v alidation set achiev es 87.83% using 12 models (5 families), confirming that LCS generalizes to the held-out test set e ven with a reduced model pool. Spectral clustering on error correlations recovers architecture-aligned groups, confirming that family structure is an intrinsic property of the error landscape. Actionable prescriptions: prioritize architec- tural diversity over model count, use family-aw are aggre gation when all families exceed chance, apply QualRCCV ( ρ =0 . 4 , γ =1 ) for universally safe training-free gains, and deploy LCS when labelled data is av ailable for the largest impro vements. References [1] S. Berg. Condorcet’ s jury theorem, dependency among jurors. Social Choice and W elfar e , 10(1):87–95, 1993. [2] P . J. Boland. Majority systems and the Condorcet jury theorem. The Statistician , 38(3):181–189, 1989. [3] G. Brown, J. W yatt, R. Harris, and X. Y ao. Di versity creation methods: A surve y and categori- sation. Information Fusion , 6(1):5–20, 2005. [4] L. Chen et al. FrugalGPT : How to Use Large Language Models While Reducing Cost and Improving Performance. , 2023. [5] M. de Condorcet. Essai sur l’application de l’analyse à la pr obabilité des décisions r endues à la pluralité des voix . 1785. [6] T . G. Dietterich. Ensemble methods in machine learning. In International W orkshop on Multiple Classifier Systems , pp. 1–15, 2000. [7] Y . Goyal et al. Making the V in VQA Matter: Elev ating the Role of Image Understanding in V isual Question Answering. In CVPR , 2017. [8] D. A. Hudson and C. D. Manning. GQA: A New Dataset for Real-W orld V isual Reasoning and Compositional Question Answering. In CVPR , 2019. [9] R. A. Jacobs, M. I. Jordan, S. J. Nowlan, and G. E. Hinton. Adaptive mixtures of local e xperts. Neural Computation , 3(1):79–87, 1991. [10] H. Jiang et al. In Defense of Grid Features for V isual Question Answering. In CVPR , 2020. [11] D. Jiang et al. LLM-Blender: Ensembling Large Language Models with P airwise Ranking and Generativ e Fusion. In ACL , 2023. [12] L. Kish. Survey Sampling . W iley , 1965. 12 [13] L. I. Kunche va and C. J. Whitaker . Measures of div ersity in classifier ensembles and their relationship with the ensemble accuracy . Machine Learning , 51(2):181–207, 2003. [14] K. K. Ladha. The Condorcet jury theorem, free speech, and correlated votes. American Journal of P olitical Science , 36(3):617–634, 1992. [15] J. Li et al. More Agents Is All Y ou Need. , 2024. [16] I. Ong et al. RouteLLM: Learning to Route LLMs with Preference Data. , 2024. [17] N. Shazeer et al. Outrageously Lar ge Neural Networks: The Sparsely-Gated Mixture-of-Experts Layer . In ICLR , 2017. [18] A. Singh et al. T ow ards VQA Models That Can Read. In CVPR , 2019. [19] N. Ueda and R. Nakano. Generalization error of ensemble estimators. In ICNN , pp. 90–95, 1996. [20] M. J. van der Laan, E. C. Polle y , and A. E. Hubbard. Super learner . Statistical Applications in Genetics and Molecular Biology , 6(1), 2007. [21] X. W ang et al. Self-Consistency Improves Chain of Thought Reasoning in Language Models. In ICLR , 2023. [22] J. W ang et al. Mixture-of-Agents Enhances Large Language Model Capabilities. arXiv:2406.04692 , 2024. [23] D. H. W olpert. Stacked generalization. Neural Networks , 5(2):241–259, 1992. [24] Z. Y u et al. Deep Modular Co-Attention Networks for V isual Question Answering. In CVPR , 2019. A Proof Sk etch for Pr oposition 1 Consider a binary question (correct answer c , wrong answer w ). A family f of size n f casts n f votes, each correct with probability p f > 0 . 5 . Within-f amily errors hav e pairwise correlation ρ w ; cross-family errors ha ve correlation ρ b < ρ w . Flat voting . The total vote for c is V = P f V f , where V f = P j ∈ f X j and X j ∈ { 0 , 1 } is model j ’ s correctness. The variance of V f is V ar( V f ) = n f p f (1 − p f )[1 + ( n f − 1) ρ w ] , reflecting the inflated within-family correlation. The effecti ve number of independent v otes from family f is n eff f = n f / [1 + ( n f − 1) ρ w ] (Kish, 1965). A large family ( n f ≫ 1 ) with ρ w close to 1 contributes n eff f ≈ 1 ef fectiv e vote b ut receives weight n f in the flat sum. HFV . Under HFV , each family collapses to a single vote Y f ∈ { c, w } with Pr( Y f = c ) = P f . Cross-family v otes hav e pairwise correlation ρ b . The majority (over F families) is correct when more than F / 2 families v ote c . Since ρ b < ρ w by condition (i), the effecti ve number of v oters under HFV is F / [1 + ( F − 1) ρ b ] > M flat eff , where M flat eff is suppressed by the larger ρ w . When HFV wins. HFV dominates flat voting when: (a) removing ρ w inflation gains more than family-le vel information is lost (the “Misleading tier” effect); (b) all P f > 0 . 5 so no family systemat- ically votes wrong (condition ii); and (c) family sizes are imbalanced so flat v oting’ s ov er-weighting of the lar gest family is distortionary (condition iii). When n 1 = . . . = n F , flat v oting already weights families proportionally and the benefit v anishes. □ B Supplementary T ables C Supplementary Figures 13 T able 8: Effecti ve ensemble dimensionality across benchmarks (17 models from 8 families; Sec- tion 4.3). Only 2.5–3.6 ef fective independent voters exist among 17 models. The first eigen value captures 51–63% of error variance, confirming strong shared f ailure modes. Metric VQA v2 T extVQA GQA Models ( M ) 17 17 17 Families ( F ) 8 8 8 λ 1 variance 58.0% 50.9% 62.5% T op-5 variance 75.2% — — Eff. dimensionality 2.86 3.59 2.49 W ithin-family r 0.67 0.59 0.73 Cross-family r 0.53 0.46 0.58 Corr . gap 0.13 0.14 0.15 T able 9: Effect of f amily granularity on VQA v2 HFV accuracy (11-model subset; ov erall-accuracy weights for comparability across partitions). Splitting Qwen2.5 into training-paradigm sub-families (6 families) yields the best result. Merging families hurts. Partition F Accuracy Per-model 11 86.65 Merged (Qwen) 3 86.36 Original families 5 86.86 Split Qwen2.5 7 86.96 Calibrated (flat) – 86.73 T able 10: Data-driven f amily discovery via spectral clustering on the error correlation af finity matrix ( k = 4 , . . . , 12 clusters) on VQA v2 with 17 models. HFV accuracy for each discov ered grouping is compared to true architecture families (86.57%) and calibrated v oting (86.70%). k 4 5 6 7 8 9 10 11 12 HFV acc. (%) 86.91 86.84 86.75 86.63 86.58 86.61 86.60 86.56 86.42 ARI 0.44 0.29 0.30 0.36 0.42 0.43 0.45 0.51 0.54 T able 11: Per-question-type HFV improvement over calibrated voting on VQA v2. HFV strongly benefits number questions but hurts on free-form other questions. T ype n Cal (%) HFV (%) ∆ ( p ) number 6,667 80.08 80.28 + 0.19 (—) yes/no 6,667 97.19 97.26 + 0.06 (—) other 6,667 82.83 82.18 − 0.65 (—) T able 12: HFV − calibrated accuracy gap as a function of ensemble size k (200 random multi-family subsets per k , VQA v2). HFV reliably improves ov er calibrated voting only when k ≥ 9 models. k Mean gap % positiv e Corr(gap, imbal.) 3 − 0.11 17% − 0.34 5 − 0.09 36% − 0.09 7 + 0.01 47% + 0.09 9 + 0.13 73% + 0.42 11 + 0.13 100% — 14 10 0 10 20 30 40 PC1 (22.5%) 40 30 20 10 0 10 20 30 PC2 (11.9%) 32b 72b 7b_lora 7b_lora_full fullf t idefics3 inter nvl2 inter nvl3 llava_ne xt llava_ov molmo2 molmo2raw phi4mm pixtral qwen3vl qwen3vl32b smolvlm VQA v2: Er r or PCA (17 models) Qwen2.5 Qwen3 Inter nVL Molmo Phi LLaV A P ixtral Idefics Figure 4: Error PCA of model accuracy vectors on VQA v2. Architecture families (color-coded) cluster together in the error landscape, confirming family structure is a real property—not an assumption. 4 6 8 10 12 14 16 Number of Models 86.6 86.7 86.8 86.9 87.0 87.1 87.2 A ccuracy (%) +-0.03% +0.35% +0.40% +0.55% VQA v2 Calibrated LCS 4 6 8 10 12 14 16 Number of Models 64.2 64.4 64.6 64.8 65.0 65.2 65.4 65.6 A ccuracy (%) +0.05% +0.99% +1.41% +1.23% GQA Calibrated LCS LCS Scaling: Gains Gr ow with Ensemble Size Figure 5: LCS vs. calibrated voting accuracy as a function of ensemble size on VQA v2 and GQA. LCS gains gro w with pool size while calibrated voting degrades from within-f amily redundancy . yes/no number other 80.0 82.5 85.0 87.5 90.0 92.5 95.0 97.5 A ccuracy (%) +0.08% +2.02% -0.04% VQA v2: LCS by Question T ype Calibrated LCS query verif y logical choose compar e 50 60 70 80 90 A ccuracy (%) +3.5% +0.5% +1.4% +1.0% +4.2% GQA : LCS by Question T ype Calibrated LCS LCS Gains Concentrate on Har dest Question T ypes Figure 6: Per-question-type LCS impro vement over calibrated v oting. On VQA v2, number questions benefit most ( +2 . 01% , p< 0 . 001 ) while yes/no and other types gain < 0 . 1% . On GQA, query ( +3 . 48% ) and logical ( +1 . 39% ) question types sho w the largest gains. 15
Original Paper
Loading high-quality paper...
Comments & Academic Discussion
Loading comments...
Leave a Comment