Learning to Present: Inverse Specification Rewards for Agentic Slide Generation
Automated presentation generation remains a challenging task requiring coherent content creation, visual design, and audience-aware communication. This work proposes an OpenEnv-compatible reinforcement learning environment where LLM agents learn to r…
Authors: Karthik Ragunath An, a Kumar, Subrahmanyam Arunachalam
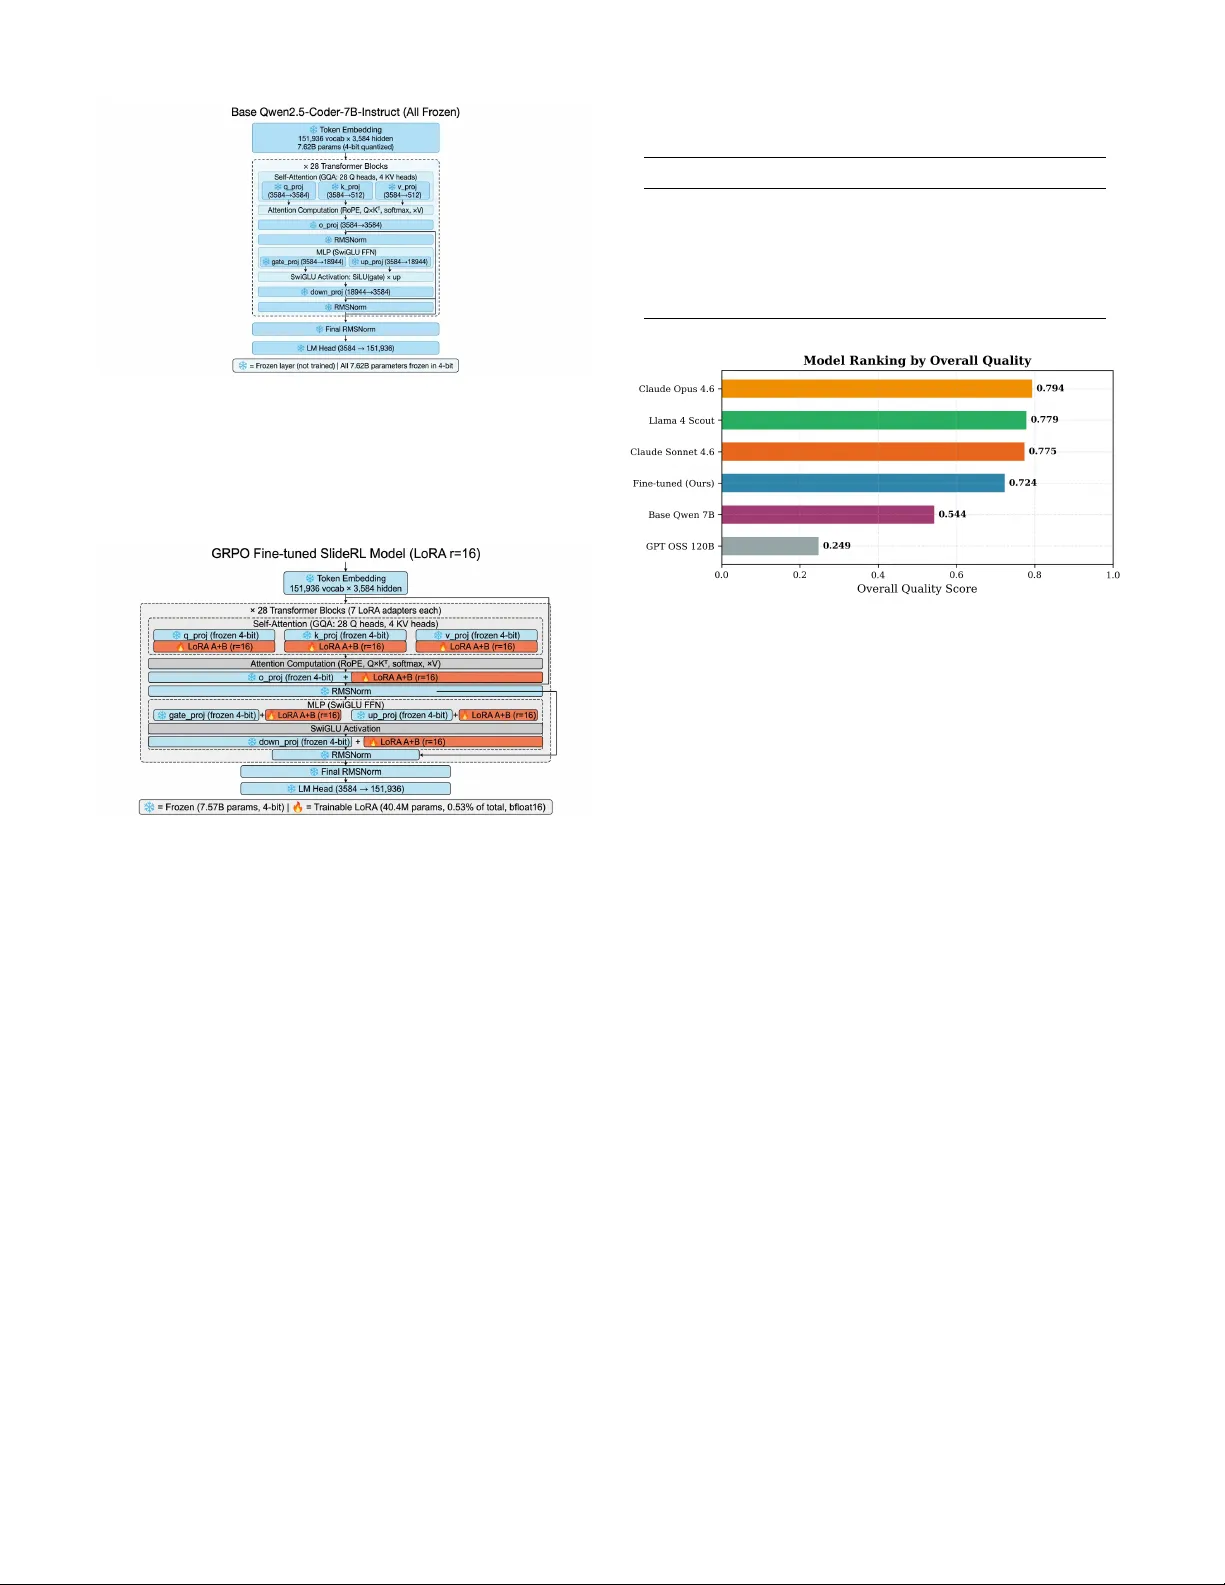
Learning to Present: In v erse Specification Re w ards for Agentic Slide Generation Karthik Ragunath Ananda Kumar * , T avus Inc., Uni versity of T exas at Dallas and Subrahmanyam Arunachalam * , T exas A&M Univ ersity * Equal contribution Abstract —A utomated presentation generation remains a challenging task requiring coher ent content creation, visual design, and audience-aware communication. This work pr oposes an OpenEn v-compatible reinf orcement learning en vironment where Large Language Model (LLM) agents learn to research topics, plan content, and generate professional HTML slide presentations thr ough tool use. W e intr oduce a multi-component reward system combining structural validation, render quality assessment, LLM-based aesthetic scoring, content quality metrics, and an in v erse specification reward that measures how faithfully generated slides con vey their intended purpose. The inverse specification reward, an “in verse task” where an LLM attempts to recov er the original presentation specification from generated slides, pro vides a holistic quality signal. Our approach fine-tunes a Qwen2.5-Coder -7B model via GRPO, training only 0.5% of parameters on prompts derived from expert demonstrations collected using Claude Opus 4.6. Experiments on 48 di verse business presentation briefs across six models, including Claude Opus 4.6, Claude Sonnet 4.6, Llama 4 Scout, GPT OSS 120B, and base Qwen 7B, demonstrate that our fine-tuned 7B model achieves 91.2% of Claude Opus 4.6’ s quality while improving 33.1% over the untuned base model. The six-model comparison r eveals that instruction adher ence and tool-use compliance, rather than raw parameter count, determine agentic task performance. The divide-and-conquer reward architectur e provides interpretable quality assessment acr oss six dimensions, supporting targeted impro vements in agentic presentation generation. W e contribute SlideRL, an open-source dataset of 288 multi-turn rollout trajectories across all six evaluated models, publicly available at https://huggingface.co/datasets/KarthikRagunathAnandaKumar/ sliderl- multi- turn- r ollouts . Code is a vailable at https://github .com/pushing- the- frontier/slide- f orge- llm . Index T erms —Reinfor cement Learning, Large Language Mod- els, Presentation Generation, In verse T ask Rewards, T ool Use, GRPO, Policy Gradient Methods, Low-Rank Adaptation I . I N T RO D U C T I O N The creation of professional presentations is a ubiquitous task in business, education, and research conte xts. Despite advances in generative AI, automated slide generation remains challenging because it requires topic research, content struc- turing, visual design, and audience-aw are communication, all coordinated through a multi-step workflo w . Recent work in LLM agents has shown strong results in tool use and multi-step reasoning [ 1 ], [ 2 ]. Howe ver , training agents for complex creativ e tasks like presentation generation poses distinct challenges: (1) the action space is large—the agent must select from 14 tools and specify their parameters, (2) quality assessment requires multiple orthogonal criteria, Fig. 1. Architecture of the proposed system. The LLM agent working in the training loop generates tool calls that are executed in the en vironment, with multi-component re wards guiding policy optimization. (3) the task demands both factual accuracy and aesthetic appeal, and (4) slides must follow a coherent narrativ e arc with logical sequencing and temporal flow across the deck. W e address these challenges with a reinforcement learning environment that frames presentation generation as a sequential decision-making problem. The en vironment exposes 14 tools organized into 5 categories—research ( web_search , fetch_url ), content planning ( create_outline , revise_outline ), design ( generate_slide , edit_slide , set_theme ), deck structure ( get_slide_content , delete_slide , reorder_slides , duplicate_slide , insert_slide ), and meta ( review_deck , finalize )—through which the agent progresses across fiv e phases: research, planning, generation, refinement, and finalization. As illustrated in Fig. 1 , this decomposition divides the complex task into manageable phases while employing a re ward architecture that ev aluates quality across six dimensions. Our key contributions are: 1) OpenEnv [ 3 ]-Compatible RL Envir onment : A rein- forcement learning environment with 14 tools across 5 categories, supporting the full presentation creation workflo w from research to finalization. 2) Multi-Component Reward System : A reward architec- ture combining six quality dimensions with configurable weights, allo wing interpretable and targeted quality as- sessment. 3) Inv erse Specification Reward (Novel) : A ne w “inv erse task” re ward formulation in which an LLM attempts to reconstruct the original specification from the gen- erated slides alone. T o our knowledge, this is the first application of input-reconstruction as a rew ard signal for ev aluating holistic coherence and faithfulness in the context of automated slide and presentation generation. 4) Dense Step Rewards : Quality-delta based step rewards that provide dense training signals rather than sparse episode-end rew ards. 5) Multi-Format Output via T ool Use : The fine-tuned model learns to trigger appropriate tool calls that pro- duce presentations in multiple output formats (HTML slide decks and PPTX files), enabling downstream con- sumption across web rendering and traditional presenta- tion software without format-specific training. 6) Expert T rajectory Generation : A pipeline using Claude Opus 4.6 [ 4 ], [ 5 ] to generate high-quality tra- jectories for GRPO fine-tuning of smaller models. 7) SlideRL Dataset : W e open-source a multi- turn rollout dataset of 288 complete trajectories (48 briefs × 6 models) with per-turn tool calls, en vironment observations, step re wards, and quality scores, publicly av ailable at https://huggingface. co/datasets/KarthikRagunathAnandaKumar/ sliderl- multi- turn- rollouts . I I . R E L A T E D W O R K A. LLM Agents and T ool Use Recent work on LLM agents has demonstrated ef fective tool use across a range of tasks [ 1 ], [ 2 ], [ 6 ]. ReAct [ 6 ] introduced the pattern of interleaving reasoning and acting, while T oolformer [ 2 ] showed that LLMs can learn to use tools through self-supervised learning. Our work extends these approaches to presentation generation, where tool use must be coordinated across research, content creation, and design phases. B. Reinforcement Learning for LLMs RLHF [ 7 ] established the use of human feedback to align LLMs. Subsequent work has explored alternatives including DPO [ 8 ], GRPO [ 9 ], and v arious reward modeling approaches. Our work employs GRPO for its efficienc y in fine-tuning with relativ e rewards, combined with a multi-component reward architecture tailored to this domain. C. Automated Pr esentation Generation Prior work on automated presentation generation has fo- cused on extracti ve slide generation [ 10 ], document-to-slide pipelines [ 11 ], and learning-based content selection [ 12 ]. Re- cent general-purpose LLM systems [ 13 ] show strong genera- tiv e capability , but presentation-oriented methods still typically lack the structured rew ard signals needed for systematic im- prov ement. Our work fills this gap with a multi-component rew ard architecture. T ABLE I T OO L C ATE G O R IE S A ND D E S CR I P T IO N S . Category T ools Description Research web_search , fetch_url Info gather- ing Content create_outline , revise_outline Planning Design generate_slide , edit_slide , set_theme Slide creation Structure get_slide_content , delete_slide , reorder_slides , duplicate_slide , insert_slide Deck ops Meta review_deck , finalize Quality con- trol D. LLM-as-Judge for Quality Assessment Recent work has shown that LLMs can serve as reliable ev aluators for generated content [ 14 ], [ 15 ]. Our approach extends this idea through the in verse specification reward, which uses an LLM to assess holistic quality by attempting to recover the original task specification from the generated output. I I I . E N V I RO N M E N T D E S I G N A. Overview The en vironment implements the OpenEn v [ 3 ] interface with standard reset() and step() methods. The envi- ronment maintains state across an episode, tracking research context, outline structure, generated slides, and workflow phase. Episode Lifecycle: 1) RESEARCH : Agent gathers information via web_search , fetch_url 2) PLAN : Agent structures content via create_outline , revise_outline 3) GENERA TE : Agent creates slides via generate_slide 4) REFINE : Agent improv es via edit_slide , review_deck 5) DONE : Agent calls finalize to end the episode B. Action Space The action space consists of 14 tools organized into 5 cat- egories, as shown in T able I . Each action is specified as a JSON object with tool name and parameters. The following examples, drawn from actual agent trajectories, illustrate tool calls across the four workflow phases: Research: {"tool": "web_search", "query": "electric vehicle market size 2026 global sales projections statistics"} T ABLE II E N VI RO N M E NT S TA T E R E P R ES E N T A T I O N . Field T ype Description brief SlideBrief T ask configuration research_context list[dict] Accumulated research outline list[dict] Slide structure slides_html list[str] Generated HTML slides_png list[bytes] Rendered PNGs theme str V isual theme phase str W orkflow phase edit_mode bool Edit task flag original_slides_html list[str] Pre-edit HTML Planning: {"tool": "create_outline", "sections": [ {"title": "Q4 2025 Financial Results", "bullet_points": [ "$142.3M revenue, 23% YoY growth", "ARR reaching $156.8M with 118% NRR", "Net income of $18.7M at 13.1% margin " ]}, {"title": "Revenue & Profitability", "bullet_points": ["..."]} ]} Generation: {"tool": "generate_slide", "slide_idx": 0, "title": "Q4 2025 Financial Results", "sections": [ {"heading": "Revenue Milestone", "body": "$142.3M in Q4 revenue -- up 23% YoY."}, {"heading": "ARR & Retention", "body": "ARR: $156.8M | NRR: 118% | Churn: 4.2%."} ]} Refinement: {"tool": "edit_slide", "slide_idx": 0, "title": "Q4 2025 Financial Results", "sections": [ {"heading": "Revenue Milestone", "body": "$142.3M in Q4 revenue -- up 23% YoY."}, {"heading": "ARR & Retention", "body": "ARR: $156.8M | NRR: 118% | Churn: 4.2%. Deep customer stickiness."} ]} C. State Representation The en vironment state captures the task-rele vant information needed for decision-making and re ward computation, as sho wn in T able II . T ABLE III O B SE RV ATI O N S PAC E FI E L DS . Field T ype Description result str T ool e xecution result success bool Action succeeded current_slide_count int Slides created phase str W orkflow phase slide_previews list[str] Base64 PNG thumbnails T ABLE IV R E W A R D C O MP O N E NT W E I GH T S A N D D E S CR I P T IO N S . Component W eight Description code_rules 1.0 Structural validation render_quality 2.0 Render success, HTML valid- ity aesthetic_html 1.5 HTML design quality aesthetic_visual 1.5 V isual screenshot quality content_quality 2.0 T opic relev ance, grounding spec_reconstruction 2.0 In verse specification faithful- ness The implementation additionally tracks episode metadata (episode ID, step count, step budget, termination flag, accu- mulated rew ard) for environment bookkeeping; these are not part of the state representation exposed to the agent’ s policy . D. Observation Space After each action, the agent receives an observation con- taining the fields listed in T able III . The LLM agent receives a text rendering of this observation at each step: Tool result (success={success}): {result} State: phase={phase}, slides={count}/{target}, turns remaining={budget} T ool results are concise confirmations. For example, generate_slide returns "Slide 3 generated and rendered (3 sections)." The agent relies on its con- versation history to track progress across the episode. The en vironment returns the standard RL signals (step rew ard, termination flag, and step index) alongside the observation, follo wing the Gymnasium (obs, reward, terminated, info) conv ention. I V . M U LT I - C O M P O N E N T R E W A R D S Y S T E M The multi-component reward architecture ev aluates presen- tation quality across six dimensions. Rather than attempting to capture quality in a single metric, we decompose it into interpretable components that can be independently assessed and optimized. A. Rewar d Components T able IV lists the six rew ard components with their weights. The aggregate rew ard is computed as: R aggregate = P i w i · r i P i w i (1) where w i is the weight and r i ∈ [0 , 1] is the score for component i . B. Code Rules Rewar d The structural validation re ward scores adherence to pre- sentation conv entions. For each slide, the score is computed as: r code = 1 N N X j =1 0 . 25 · 1 title ,j + s sec ,j + 0 . 25 · min( w j , w t ) max( w j , w t ) + 0 . 25 · n filled ,j n total ,j (2) where s sec ,j scores section count adherence: 0 . 25 if the section count of slide j matches the target exactly , 0 . 10 partial credit if sections exist but the count differs, and 0 otherwise. The individual checks are: • Title pr esent (0.25): .title element exists with text. • Section count (0.25/0.10): 0.25 if exact match to target sections per slide; 0.10 partial credit if sections exist but count differs. • W ord count (0.25): 0 . 25 × min( w , w t ) / max( w , w t ) , ratio of actual to target. • Non-empty sections (0.25): 0 . 25 × ( n filled /n total ) , fraction of sections containing text. C. Render Quality Rewar d This component assesses technical rendering success via three sub-components: r render = 0 . 4 · min n slides n target , 1 + 0 . 3 · n rendered n slides + 0 . 3 · v html (3) where n slides is the number of slides created, n target is the target slide count from the brief, n rendered is the number of slides successfully rendered to PNG, and v html ∈ { 0 , 1 } indicates whether required HTML elements are present. D. Aesthetic Rewar ds W e employ LLM-based e valuation (Claude Opus 4.6) for aesthetic assessment. Each slide is scored independently from 0.0 to 1.0, then av eraged across the deck. Results are cached by content hash to ensure deterministic scoring on repeated ev aluations. HTML Structure Scoring ( aesthetic_html ): An LLM ev aluates the ra w HTML/CSS of each slide across four equally weighted dimensions (0.25 each): (1) layout and structure, including clear title/section hierarchy and logical organization; (2) content balance and appropriate density; (3) visual styling with modern CSS, color harmon y , and typog- raphy; (4) professional polish with executi ve-ready , consistent formatting. V isual Scoring ( aesthetic_visual ): For rendered PNG screenshots (produced by Playwright), an LLM e v aluates four equally weighted dimensions (0.25 each): (1) visual design with color harmony , contrast, and modern aesthetics; (2) layout and spacing, including whitespace, alignment, and organization; (3) typography with font hierarchy , readability , and density; (4) professional polish with executi ve-ready ap- pearance and consistency . These LLM-as-judge approaches capture design principles that are difficult to encode in rule-based metrics. E. Content Quality Rewar d Content quality is assessed across four dimensions: topic relev ance (weight 0.35, slides mentioning topic words), fac- tual grounding (0.25, overlap with research results), content uniqueness (0.20, ratio of unique slides), and narrative flo w (0.20, outline cov erage). F . Inver se Specification Rewar d The in verse specification reward measures how faithfully the generated slides con vey their intended purpose. The idea is simple: giv en only the output, can we recover the input specification? Giv en a completed slide deck, we prompt an LLM to predict the original brief: Given the slide deck, predict: { "topic": "...", "audience": "...", "num_slides": N, "key_themes": ["...", "..."] } The reconstruction score compares predictions against the actual brief: r recon = 0 . 40 · s topic + 0 . 25 · s audience + 0 . 15 · s count + 0 . 20 · s themes (4) where each sub-score measures ov erlap between predicted and actual values: • T opic similarity (0.40): W ord ov erlap between predicted and actual topic. • A udience match (0.25): Exact match, partial match, or word overlap. • Slide count accuracy (0.15): Ratio of predicted to actual count. • Theme coverage (0.20): Overlap between predicted themes and topic words. A presentation that clearly communicates its purpose will allow accurate specification reconstruction; a confused or off- topic presentation will not. V . T R A I N I N G P I P E L I N E A. Expert T rajectory Generation W e generate expert trajectories using Claude Opus 4.6 [ 4 ], [ 5 ] as the agent. Each trajectory is a complete episode from research through finalization. The system prompt guides the expert through the workflo w phases, requiring exactly one JSON tool call per turn. Fig. 2. Expert trajectory generation pipeline. The expert LLM generates a tool call each turn, which is executed in the en vironment. Step rewards are computed as quality deltas after each action, and the con versation history accumulates until the episode terminates. B. Dense Step Rewar ds Rather than sparse episode-end rewards, we compute dense step rew ards as quality deltas: r step = ( Q new − Q old ) + r action (5) where Q is the aggregate quality score and r action provides small bonuses/penalties for action success/failure ( +0 . 01 for successful actions, +0 . 1 for successful finalization, − 0 . 02 for failed actions). This formulation corresponds to potential-based reward shaping [ 16 ], where the shaping function F ( s, s ′ ) = γ Φ( s ′ ) − Φ( s ) uses Φ( s ) = Q aggregate ( s ) as the potential function. This class of shaping is guaranteed to preserve the optimal policy while providing dense signal. Motivation for Dense Rewards. Presentation generation episodes span 20–35 turns, with the final quality only observ- able after finalize is called. Sparse episode-end re wards create a severe credit assignment problem: which of the 30+ actions contributed to success? Dense step rewards address this through: (1) immediate feedback—each action recei ves a re ward signal based on quality improvement, enabling faster learning con ver gence; (2) credit assignment—the quality delta directly attributes rew ard to the action that caused the change; (3) noise reduction—multiple smaller re ward signals partially cancel noise across steps; (4) exploration guidance—negati ve deltas discourage actions that degrade quality , while positive deltas reinforce productiv e actions. C. Rewar d Function Pr operties and Theoretical Justification Our rew ard system is both stochastic and non- differentiable . En vironment execution in volves discrete operations (HTML parsing, conditional logic), LLM-as-judge scoring requires black-box API calls, and rule-based checks in volve binary conditions. LLM scoring also exhibits slight variations across calls. This motiv ates our choice of GRPO over supervised meth- ods. The theoretical justification rests on the policy gradient theorem [ 17 ]: ∇ θ J ( θ ) = E τ ∼ π θ [ R ( τ ) · ∇ θ log π θ ( τ )] (6) where J ( θ ) is the expected rew ard, τ is a trajectory (token sequence), R ( τ ) is the scalar reward, and π θ ( τ ) is the policy probability . Critically , the gradient operator ∇ θ acts only on log π θ ( τ ) , not on R ( τ ) . The re ward passes through the gradient operator untouched; it is a scalar weight on the policy gradient, nev er differentiated through. V ariance analysis. While non-differentiable re wards pre- serve gradient correctness in expectation, they introduce vari- ance. For a group of K completions with re wards R 1 , . . . , R K , each decomposable as R i = R ∗ i + η i where η i ∼ N (0 , σ 2 η ) represents e valuation noise, the signal-to-noise ratio of the advantage estimates is: SNR = σ 2 R ∗ σ 2 η (7) where σ 2 R ∗ is the v ariance of true rew ard spread. When SNR < 1 , noise dominates and learning becomes unreliable. Our multi-component reward system mitigates this through noise diversification : giv en C independent re ward components with individual noise σ c , the aggregate noise is: σ agg = 1 W s X c w 2 c σ 2 c (8) where W = P c w c . Three of our six components (code rules, render quality , content quality) are nearly deterministic ( σ ≈ 0 ), which substantially reduces aggregate noise relativ e to the stochastic LLM-based components ( σ ≈ 0 . 10 ). With our weights, the aggregate noise ( σ agg ≈ 0 . 03 ) is an order of magnitude smaller than any indi vidual LLM-based component. Caching LLM-as-judge scores by content hash eliminates stochasticity on repeated e valuations, making rewards deter- ministic for identical inputs. D. GRPO Loss Function W e employ Group Relative Policy Optimization (GRPO) [ 9 ], implemented via the TRL library [ 18 ], which extends the PPO clipped surrogate objectiv e [ 19 ] with group-relativ e advantage normalization. The loss computation proceeds in three stages. Stage 1: Advantage computation. For each prompt, the model generates K completions. Each completion τ k is ex e- cuted in the environment and scored by the aggregate rew ard function, yielding scalar re wards R 1 , . . . , R K . Adv antages are computed via group normalization: A k = R k − µ G σ G + ϵ adv (9) µ G = 1 K K X k =1 R k , σ G = v u u t 1 K K X k =1 ( R k − µ G ) 2 Here, ϵ adv is a small numerical-stability constant. This group- mean baseline pro vides significant variance reduction: by centering rewards within each group, the advantage con verts “ev erything is good” signals into contrastive “this completion was better than that one” signals. In our configuration, K = 2 , yielding binary advantages of ± 1 after normalization. Stage 2: Per -token ratio computation. For each token a t in completion τ k , we compute the importance sampling ratio: ρ t = exp log π θ ( a t | a 1: t − 1 , x ) − log π θ old ( a t | a 1: t − 1 , x ) (10) where x is the prompt, π θ is the current model, and π θ old is the frozen snapshot from when completions were generated. The per-tok en log-probability is: log π θ ( a t | a 1: t − 1 , x ) = z a t − log X v ∈V e z v (11) where z v are the logits and V is the vocabulary . Stage 3: Clipped surrogate loss. The per -token loss applies the PPO clip: L t = − min ρ t · A k , clip( ρ t , 1 − ϵ clip , 1+ ϵ clip ) · A k (12) with ϵ clip = 0 . 2 . The full GRPO loss includes an optional KL div ergence penalty against a reference policy: L = 1 |B | X k ∈B P t L t · m t P t m t + β · D KL π θ ∥ π ref (13) where m t is a mask excluding padding tokens and β controls the strength of the KL penalty . In our configuration, β = 0 . 0 , so no reference model is loaded and the KL term v anishes. The clipping mechanism alone constrains per-step policy updates. As discussed in Section VII-D , this proved sufficient for a short training horizon (200 steps on curated data) but insuf- ficient for extended training (1000 steps on the full dataset), where cumulativ e policy drift led to mode collapse. GRPO reward function. The reward function bridges the RL objectiv e with the en vironment by extracting tool calls from model completions, executing them, and computing aggregate scores: function presentation_reward(completions, briefs): for each completion: 1. Reset environment with brief 2. Parse completion -> extract JSON 3. Score based on outcome: - No valid JSON -> -2.0 - Valid JSON, fail -> -1.0 - Valid JSON, success: -> compute aggregate_rewards( state) return scores The graduated penalty structure ( − 2 . 0 for unparseable out- put, − 1 . 0 for failed execution, positiv e for successful actions) creates a curriculum effect: the model first learns to produce valid JSON tool calls, then learns to produce calls that succeed, then optimizes for quality . T ABLE V G R PO T R A IN I N G C O NFI G U R A T I O N . Parameter V alue Base model Qwen2.5-Coder-7B-Instruct Parameters (total) 7.61B Quantization 4-bit NormalFloat LoRA rank ( r ) 16 LoRA alpha ( α ) 16 LoRA dropout 0.0 T arget modules q, k, v , o, gate, up, down proj T rainable parameters ∼ 40M ( ∼ 0.5% of total) Learning rate 5 × 10 − 5 Max sequence length 8,192 Max completion length 1,024 Num generations ( K ) 2 Clip epsilon ( ϵ clip ) 0.2 KL coef ficient ( β ) 0.0 T raining steps (selected model) 200 E. Model Arc hitectur e and P arameter-Ef ficient F ine-T uning T able V summarizes the GRPO training configuration. W e apply Lo w-Rank Adaptation (LoRA) [ 20 ] to the base Qwen2.5-Coder-7B-Instruct model [ 21 ], which consists of 28 transformer blocks with Grouped Query Attention [ 22 ] (28 query heads, 4 key-v alue heads) and SwiGLU [ 23 ] feed- forward networks. LoRA adapters are attached to seven linear projections per block, covering both the attention mechanism and the feed- forward network: Attention projections ( W Q , W K , W V , W O ): These control what contextual patterns the model attends to, what informa- tion is extracted, and how multi-head outputs are combined. Adapting these projections lets the model learn task-specific attention patterns—for example, focusing on the brief ’ s topic keyw ords when generating slide content, or attending to pre- vious tool results when planning the next action. Feed-f orward projections ( W gate , W up , W down ): The SwiGLU network controls feature detection and transformation. Adapting these projections lets the model dev elop task-specific representations, such as distinguishing between presentation phases or recognizing when to transition from research to content generation. For each adapted layer , LoRA decomposes the weight update as: W ′ = W + α r B A (14) where W ∈ R d out × d in is the frozen pre-trained weight (stored in 4-bit), A ∈ R r × d in and B ∈ R d out × r are the trainable low-rank matrices, and r = 16 is the bottleneck rank. W ith α = r = 16 , the scaling factor is unity . This yields approximately 40 million trainable parameters (0.5% of total), while the remaining 7.57 billion parameters remain frozen in 4-bit quantized format. The 4-bit quantization reduces the base model’ s memory footprint from approxi- mately 15 GB (float16) to 4 GB, enabling training on a single GPU. Frozen components. T oken embeddings ( 151 , 936 × 3 , 584 ), RMSNorm layers, rotary position embeddings (RoPE), and Fig. 3. Architecture of the base Qwen2.5-Coder-7B-Instruct model. All 7.62B parameters are frozen and stored in 4-bit quantized format. The model comprises 28 transformer decoder layers, each containing Grouped-Query Attention (28 query heads, 4 KV heads, head dim 128) and a SwiGLU feed-forward network (intermediate dim 18,944). Legend: ∗ frozen layers, ∗ trainable layers. Fig. 4. Architecture of the GRPO-finetuned SlideRL model. LoRA adapters (rank r =16 ) are injected into all 7 linear projections per layer—Q, K, V , O (attention) and gate, up, down (FFN)—adding 1.44M trainable parameters per layer (40.4M total, 0.53% of 7.62B). Base weights remain frozen in 4- bit; only the LoRA matrices (bfloat16) are updated during GRPO training. Legend: ∗ frozen layers, ∗ trainable layers. the language model head remain at their pre-trained values. These components encode general language capabilities that transfer directly to the presentation generation task without modification. V I . E X P E R I M E N T S A. Dataset W e e valuate on 48 di verse business presentation briefs spanning: financial reports (Q4 results, budget allocation), in vestor pitches (Series A/B funding), market analyses (EV , cloud computing, fintech), technical re views (c ybersecurity , MLOps, De vOps), and strate gic planning (M&A, product roadmaps). Briefs vary in target slides (6–10), audience (board, VCs, ex ecutiv es, engineers), confidence (0.3–1.0), and content type (structured data vs. open-ended topics). T ABLE VI M O DE L S E V A L UATE D . Model T ype Params Fine-tuned (Ours) LoRA Qwen2.5-7B 7B (0.5% train.) Base Qwen 7B Qwen2.5-7B-Inst. 7B Claude Opus 4.6 Proprietary Undisclosed Claude Sonnet 4.6 Proprietary Undisclosed Llama 4 Scout Open-weight 109B (17B activ e) GPT OSS 120B Open-weight 120B Fig. 5. Model ranking by overall quality . B. Evaluation Protocol W e ev aluate six models on identical briefs using the same en vironment and reward pipeline, as listed in T able VI , includ- ing Claude Opus 4.6 [ 4 ], [ 5 ] and Claude Sonnet 4.6 [ 24 ]. For each model, the protocol is: (1) load brief from ev alua- tion set, (2) run episode (max 35 turns) with the model’ s agent loop, (3) compute quality scores using the multi-component rew ard system, (4) export deck.html and deck.pptx for manual re view . The fine-tuned and base models run locally on an H100 GPU. All other models are served through hosted inference APIs. C. Results T able VII presents the aggre gate results across all 48 briefs. Fig. 5 ranks all six models by overall quality . The fine- tuned 7B model (0.724) achie ves 91.2% of Claude Opus 4.6’ s quality (0.794) while matching the smallest parameter tier in the comparison. Llama 4 Scout (0.779) emerges as a surprisingly strong baseline, approaching Claude Opus despite being a smaller open-weight model. GPT OSS 120B (0.249) performed poorly due to systematic failure to follow the required tool-call format, resulting in only 31.2% completion rate. Fig. 6 visualizes the quality–cost tradeoff. T able VIII shows per-component quality scores. Figs. 7 and 8 present radar and grouped bar comparisons of component scores. D. Analysis Impact of GRPO fine-tuning. Comparing the fine-tuned model against the base Qwen model isolates the effect of T ABLE VII A G G R EG ATE R E SU LT S O N 4 8 B U SI N E S S B R IE F S . Metric Fine-tuned (Ours) Base Qwen Claude Opus 4.6 Claude Sonnet 4.6 Llama 4 Scout GPT OSS 120B Overall quality 0.724 0.544 0.794 0.775 0.779 0.249 Completion rate 46/48 (95.8%) 34/48 (70.8%) 48/48 (100%) 48/48 (100%) 48/48 (100%) 15/48 (31.2%) A vg turns used 22.3 19.1 27.8 29.2 18.3 6.5 A vg slides created 7.0 5.2 7.3 7.3 7.3 2.2 A vg time/brief 71.6s 43.8s 393.3s 421.7s 155.4s 66.1s T ABLE VIII P E R - C O M PO N E N T Q UA LI T Y S C O R ES . Component Fine-tuned Base Qwen Claude Opus Claude Sonnet Llama 4 Scout GPT OSS 120B code_rules 0.905 0.663 0.960 0.931 0.949 0.294 render_quality 0.958 0.708 1.000 1.000 1.000 0.309 content_quality 0.783 0.604 0.878 0.884 0.903 0.270 aesthetic_html 0.658 0.492 0.761 0.727 0.660 0.241 aesthetic_visual 0.539 0.397 0.568 0.550 0.546 0.184 spec_reconstruction 0.530 0.412 0.616 0.567 0.615 0.199 Fig. 6. Quality vs. inference cost. reinforcement learning. GRPO training produced a +33 . 1 % improv ement in overall quality ( 0 . 544 → 0 . 724 ), a +25 percentage-point increase in completion rate ( 70 . 8% → 95 . 8% ), and impro ved every reward component, most dra- matically code_rules ( +36 . 5 %) and render_quality ( +35 . 3 %). Fig. 9 summarizes these operational improv ements. Model tier analysis. The six-model comparison reveals a clear tier structure: • T ier 1 ( q > 0 . 77 ): Claude Opus 4.6 (0.794), Llama 4 Scout (0.779), Claude Sonnet 4.6 (0.775)—all achiev e 100% completion. • T ier 2 ( q ≈ 0 . 72 ): Fine-tuned Qwen 7B (0.724)—95.8% completion with competitiv e structural metrics. • T ier 3 ( q ≈ 0 . 54 ): Base Qwen 7B (0.544)—70.8% completion, demonstrating the value of GRPO. • T ier 4 ( q < 0 . 25 ): GPT OSS 120B [ 25 ] (0.249)—despite Fig. 7. Reward component comparison (radar chart). 120B parameters, failed to follow the required JSON format, highlighting that parameter count alone does not determine agentic task perf ormance . Parameter efficiency . Our fine-tuned 7B model achieves 91.2% of Claude Opus quality and 93.0% of Llama 4 Scout’ s quality (0.724 vs. 0.779), despite having 15 × fe wer active parameters than Llama 4 Scout and training only 0.5% of its weights. On structural metrics, the fine-tuned model nearly matches Llama 4 Scout (code_rules 0.905 vs. 0.930, render_quality 0.958 vs. 1.000), demonstrating that GRPO fine-tuning closes most of the gap on tool-calling discipline. Llama 4 Scout’ s remaining adv antage is concentrated in con- tent_quality (0.903 vs. 0.783), attributable to its larger activ e parameter budget for content synthesis. This positions Llama 4 Scout [ 26 ] as a promising candidate for future GRPO fine- Fig. 8. Quality scores by component. Fig. 9. Operational metrics comparison. tuning. Gap to the expert model. The fine-tuned model achiev es 91.2% of Claude Opus’ s ov erall quality (0.724 vs. 0.794). The gap is concentrated in content_quality (0.783 vs. 0.878) and spec_reconstruction (0.530 vs. 0.616), suggesting limited ca- pacity for deep content synthesis at 7B parameters. Structural metrics (code_rules 0.905 vs. 0.960, render_quality 0.958 vs. 1.000) are near-parity . Head-to-head competitiveness. Against the base Qwen 7B model, the fine-tuned model wins decisiv ely (34W/2T/12L). Against T ier 1 models, losses are predominantly small-margin, indicating that the quality gap narrows on easier briefs, while wins demonstrate that a 7B model can outperform much lar ger models on specific brief types. Outright wins over all models. On 5 of 48 briefs, the fine-tuned 7B model ranks #1 outright, as shown in T able IX . On 4 of these 5 winning briefs the fine-tuned model beats Claude Opus 4.6, the same model f amily that serv es as LLM-as-judge for the aesthetic and content quality reward components. This rules out judge-bias as an explanation: if anything, using Claude Opus as both the expert trajectory generator and the ev aluator should fav or Claude Opus. Across all 48 evaluation briefs, the fine-tuned 7B model beats Claude Opus 4.6 [ 4 ], [ 5 ]—currently the state-of-the-art in code generation—on 12 briefs (25%), despite ha ving orders of magnitude fewer parameters. Areas for improvement: (1) Content depth—the con- tent_quality gap (0.783 vs. Llama 4 Scout’ s 0.903 and Claude Opus’ s 0.878) is the largest deficit; (2) brief faithfulness— reconstruction scores (0.530 vs. 0.616) indicate occasional T ABLE IX B R IE F S W H E RE T H E FI N E - T U N ED M O D EL O U TP E R F OR M S A L L C O MP E T I TO R S . Brief Ours Next Best ∆ Cloud Cost Optimization 0.836 Sonnet 4.6 (0.788) +0 . 048 Content Mark eting R OI 0.826 Opus 4.6 (0.824) +0 . 002 Customer Success Metrics 0.816 Opus 4.6 (0.807) +0 . 009 B2B Sales Automation 0.800 Opus 4.6 (0.770) +0 . 030 Edge Computing Analysis 0.792 Base Qwen (0.781) +0 . 011 T ABLE X E FF EC T O F T R AI N I N G S TE P S A N D D A TA SE T S C AL E . Run Dataset Steps Aggregate Compl. Rate Curated 3 traj. 100 0.623 71.2% Curated 3 traj. 200 0.689 82.4% Scaled 48 traj. 200 0.724 95.8% Scaled 48 traj. 300 0.0 0% Scaled 48 traj. 1000 0.0 0% topic drift; (3) aesthetic quality—HTML aesthetic scores lag behind T ier 1 models (0.658 vs. Claude Opus 0.761). E. Effect of T raining Steps and Dataset Scale T able X summarizes the effect of training steps and dataset scale. The curated run (3 high-quality expert trajectories, 200 steps) produced a viable model. The scaled run (48 trajectories, 1000 steps) achiev ed its best performance at checkpoint-200 (0.724, 95.8% completion) before exhibiting complete mode collapse at checkpoints beyond step 200 (see Section VII-D ). Notably , the scaled run at 200 steps outperformed the cu- rated run (0.724 vs. 0.689), indicating that increased dataset div ersity improves early-stage learning. Ho wev er , the same run collapsed into rew ard hacking at longer horizons. V I I . D I S C U S S I O N A. Divide and Conquer Rewar d Ar chitectur e The multi-component reward system has sev eral practical advantages: (1) interpr etability —each component measures a distinct quality dimension; (2) flexibility —weights can be adjusted to prioritize different aspects; (3) rob ustness —failure in one component does not prev ent training; (4) noise diversi- fication —as analyzed in Section V , the combination of deter- ministic and stochastic reward components reduces aggregate ev aluation noise. B. Inver se Specification as Quality Signal The in verse specification rew ard captures coherence at the presentation le vel. Unlik e component-wise metrics, it mea- sures whether the presentation as a whole communicates its intended message. This in verse-task approach has several concrete benefits: (1) end-to-end assessment that captures properties component- wise metrics miss; (2) audience awareness, implicitly reward- ing appropriate tone and complexity; (3) topic coherence, penalizing presentations that drift from the intended subject; Fig. 10. GRPO training loss curve for the scaled 48-trajectory run. The x- axis represents training steps; the y-axis represents the GRPO loss (clipped surrogate policy gradient loss). Consistent with the analysis above, the loss does not decrease monotonically—it oscillates within a narro w band due to the clip constraint, group-relativ e advantage re-centering, and online completion generation. (4) generalization to other tasks where output should faithfully reflect input specifications. C. On Non-Differ entiable Rewar ds and T raining Dynamics A distinctiv e aspect of our approach is that the GRPO training loss curve is not expected to decrease monotonically , ev en under successful con ver gence. This arises from three properties: (1) the PPO-style clip constrains the loss to a narrow band; (2) group-relativ e advantages remain zero-mean regardless of absolute quality; (3) online generation introduces batch-to-batch variation. Consequently , the appropriate con vergence indicators are the reward curves (which should trend upward and stabilize) and completion rates (which should increase), rather than the loss itself. This is consistent with the general behavior of policy gradient methods [ 19 ]. Practical variance considerations. W ith K = 2 gener- ations per prompt, the group normalization produces binary advantages ( ± 1 ), losing all magnitude information. Increasing K to 4–8 would yield richer advantage distributions at the cost of proportionally more compute. The standard error of the group mean scales as σ R / √ K , so quadrupling K halves the advantage noise. Role of the clip without KL regularization. Our con- figuration uses β = 0 . 0 . The only constraint pre venting arbitrary policy drift is the per-step clip ( ϵ clip = 0 . 2 ). While each individual step is bounded, the cumulative ef fect over many steps can mov e the policy substantially from the pre- trained initialization. As detailed in Section VII-D , scaling to 1000 steps resulted in catastrophic mode collapse, demonstrat- ing that the clip mechanism alone is insufficient for extended training and that introducing a KL coef ficient ( β > 0 ) is necessary for longer training horizons. D. Observed Rewar d Hacking and Mode Collapse W e conducted two separate GRPO training runs: (1) a curated run on 3 high-quality expert trajectories (200 steps), and (2) a scaled run on all 48 expert trajectories (1000 steps). While the scaled run produced a viable checkpoint at step 200 (selected for e valuation), it exhibited a pervasi ve failure mode at later checkpoints. At checkpoint-1000, the model called review_deck on ev ery turn (35/35), producing zero slides and 0.0 aggregate T ABLE XI T R AI N I N G R E W A R D T R AJ E C TO RY ( S C A LE D 4 8 - T RA J E C TO RY R UN ) . Steps A vg Min Max Diagnosis 0–49 − 0 . 953 − 1 . 188 − 0 . 750 Exploration 50–99 − 0 . 953 − 1 . 125 − 0 . 750 Still exploring 100–149 − 0 . 933 − 1 . 188 − 0 . 625 Early learning 150–199 − 0 . 655 − 1 . 063 − 0 . 250 Rapid improvement 200–249 − 0 . 593 − 0 . 875 − 0 . 188 Residual diversity 250–299 − 0 . 375 − 0 . 750 − 0 . 063 Degenerate emerging 300–349 − 0 . 238 − 0 . 688 0 . 000 Collapse underway 350–399 − 0 . 125 − 0 . 375 0 . 000 V ariance narro wing 400–449 − 0 . 105 − 0 . 313 0 . 000 Collapse entrenched 500+ − 0 . 08 to − 0 . 13 − 0 . 375 0 . 000 Full collapse Fig. 11. Training re ward curve for the scaled 48-trajectory GRPO run. The x-axis represents training steps; the y-axis represents the mean en vironment rew ard per step. The model exhibits consistent rew ard improvement from ≈− 1 . 0 toward 0 . 0 , demonstrating that GRPO drives meaningful policy refinement e ven in comple x agentic settings. Early-to-mid training checkpoints (steps 100–200) capture the most behaviorally di verse and useful policies before v ariance narrows in later stages. quality , while accumulating a small positi ve cumulati ve re ward of 0.35. At checkpoint-300, the model produced two initial productiv e actions before falling into the same loop for the remaining 33 turns. This represents a compound failure: reward hacking (ex- ploiting the review_deck tool’ s unconditional success sig- nal) driving mode collapse (the action distribution collapsing to a single tool). The mechanism: review_deck always returns success=True regardless of deck state, earning +0 . 01 per step. More productiv e tools carry failure risk and negati ve rew ards. T able XI shows the training reward trajectory . The reward improved steadily from − 1 . 0 to ward 0 . 0 (Fig. 11 ), confirming that GRPO produces a clear learning signal in this agentic setting. Intermediate checkpoints from the high-variance region (steps 100–300) proved particularly valuable, capturing policies that balance exploration with tool- use competence and serving as strong starting points for downstream ev aluation. A misleading diagnostic. W e initially hypothesized that high reward variance at step 300 indicated healthy behavioral div ersity . Empirical ev aluation disproved this: the apparent variance was dri ven by residual base model beha vior , not by learned div ersity . The 0 . 000 max rewards reflected successful review_deck calls (no state change), not successful slide creation. Root cause analysis. Three factors contrib uted to the col- lapse: (1) insufficient KL regularization ( β = 0 . 0 ); (2) reward misspecification—the +0 . 01 per-step success bonus created a local optimum for no-risk tools; (3) binary advantage limita- tion with K = 2 . This observ ation has direct implications for reward function design in agentic RL: tools that pro vide status information without modifying state should either carry an explicit cost or hav e diminishing returns to prev ent reward hacking via no-op loops. E. P arameter Efficiency of LoRA Adaptation The LoRA configuration adapts only 0.5% of the model’ s parameters while achieving competiti ve quality scores. This efficienc y arises from two factors: (1) the behavioral shift from general-purpose code generation to presentation-specific tool calling is well-captured by rank-16 corrections; (2) the base model already possesses strong JSON generation, HTML un- derstanding, and instruction-following capabilities that transfer directly . The frozen 4-bit base weights contribute to memory effi- ciency: the full training setup fits within a single GPU. F . Limitations 1) Computational cost of reward ev aluation : Multiple LLM API calls per training step increase w all-clock time and cost. Rew ard model distillation could substantially reduce this ov erhead. 2) Reward hacking risk : As demonstrated in Sec- tion VII-D , tools with unconditional success signals can be exploited by the policy . 3) Domain specificity : Current reward functions are cal- ibrated for business presentations; adaptation to other domains requires recalibration. 4) Group size limitation : W ith K = 2 , advantage esti- mates are binary , limiting training signal quality . G. Future W ork Ke y directions include: (1) scaling K to 4–8 for richer advantage distributions; (2) re ward model distillation for de- terministic, f ast re ward signals; (3) KL-regularized training ( β > 0 ) for drift protection; (4) mode collapse mitigation via repetition penalties, diminishing returns for read-only tools, and terminal reward dominance; (5) early stopping on reward plateau; (6) human feedback integration; (7) multi-modal generation including image synthesis; (8) curriculum learning from simple to complex briefs; (9) upgrading to Qwen3 [ 27 ] as the base model; (10) cross-domain transfer of the in verse specification rew ard paradigm. V I I I . C O N C L U S I O N W e presented a reinforcement learning approach for training LLM agents to generate professional presentations. Our multi- component reward architecture enables interpretable quality assessment across six orthogonal dimensions with configurable weights. The in verse specification reward, an inv erse task where an LLM recovers the original specification from generated output, provides a unique holistic quality signal that captures coherence properties missed by component-wise metrics. On the optimization side, we demonstrated that GRPO with non-differentiable, stochastic rew ards is theoretically sound and practically effecti ve. The policy gradient theorem guar - antees that rew ard non-differentiability does not compromise gradient correctness; the multi-component architecture pro- vides noise div ersification; and LoRA adaptation achieves competitiv e quality while training only 0.5% of parameters. Experiments on 48 di verse business briefs across six models show that our fine-tuned Qwen2.5-7B model achie ves 91.2% of Claude Opus 4.6’ s quality score (0.724 vs. 0.794) while improving 33.1% over the base model (0.544). The broader comparison reveals that Llama 4 Scout (0.779) approaches Claude Opus quality at 2 . 5 × faster inference (155s vs. 393s per brief), while GPT OSS 120B (0.249) demonstrates that raw parameter count does not guarantee agentic competence with- out instruction adherence. The divide-and-conquer approach to rew ard design offers a general framew ork applicable to other creativ e generation tasks. W e release the en vironment, rew ard functions, and training pipeline at https://github .com/pushing- the- frontier/ slide- forge- llm . W e additionally open-source SlideRL ( https: //huggingface.co/datasets/KarthikRagunathAnandaKumar/ sliderl- multi- turn- rollouts ), containing 288 full-episode trajectories (48 briefs × 6 models) with per-turn tool calls, en vironment observations, step re wards, and final quality scores. R E F E R E N C E S [1] J. W ei, X. W ang, D. Schuurmans, M. Bosma, B. Ichter, F . Xia, E. Chi, Q. V . Le, and D. Zhou, “Chain-of-thought prompting elicits reasoning in large language models, ” in Advances in Neural Information Pr ocessing Systems , 2022. [2] T . Schick, J. Dwivedi-Y u, R. Dessì, R. Raileanu, M. Lomeli, E. Hambro, L. Zettlemoyer, N. Cancedda, and T . Scialom, “T oolformer: Language models can teach themselves to use tools, ” in Advances in Neural Information Pr ocessing Systems , 2023. [3] Meta PyT orch, “OpenEn v: Agentic execution en vironments, ” GitHub, 2025, https://github .com/meta- pytorch/OpenEn v . [4] Anthropic, “Introducing Claude 4, ” Anthropic Blog, May 2025, https: //www .anthropic.com/news/claude- 4 . [5] ——, “Claude Opus 4.6 system card, ” Anthropic, Feb . 2026, https:// www .anthropic.com/claude- opus- 4- 6- system- card . [6] S. Y ao, J. Zhao, D. Y u, N. Du, I. Shafran, K. Narasimhan, and Y . Cao, “ReAct: Synergizing reasoning and acting in language models, ” in International Confer ence on Learning Representations , 2023. [7] L. Ouyang, J. W u, X. Jiang, D. Almeida, C. W ainwright, P . Mishkin, C. Zhang, S. Agarwal, K. Slama, A. Ray et al. , “Training language models to follow instructions with human feedback, ” in Advances in Neural Information Pr ocessing Systems , 2022. [8] R. Rafailov , A. Sharma, E. Mitchell, S. Ermon, C. D. Manning, and C. Finn, “Direct preference optimization: Y our language model is secretly a reward model, ” in Advances in Neural Information Processing Systems , 2023. [9] Z. Shao, P . W ang, Q. Zhu, R. Xu, J. Song, M. Zhang, Y . Li, Y . W u, and D. Guo, “DeepSeekMath: Pushing the limits of mathematical reasoning in open language models, ” arXiv preprint , 2024. [10] A. Sefid, J. W u, P . Mitra, and C. L. Giles, “ Automatic slide generation for scientific papers, ” in Proceedings of the Thir d International W orkshop on Capturing Scientific Knowledge (SciKnow), co-located with K-CAP , 2019. [11] T .-J. Fu, W . Y . W ang, D. McDuff, and Y . Song, “DOC2PPT: Automatic presentation slides generation from scientific documents, ” in Proceed- ings of the AAAI Conference on Artificial Intelligence , 2022. [12] Y . Hu and X. W an, “PPSGen: Learning-based presentation slides gener- ation for academic papers, ” IEEE T ransactions on Knowledge and Data Engineering , v ol. 27, no. 4, pp. 1085–1097, 2015. [13] OpenAI, “GPT -4 technical report, ” arXiv preprint , 2023. [14] L. Zheng, W .-L. Chiang, Y . Sheng, S. Zhuang, Z. W u, Y . Zhuang, Z. Lin, Z. Li, D. Li, E. P . Xing et al. , “Judging LLM-as-a-judge with MT - Bench and chatbot arena, ” in Advances in Neur al Information Pr ocessing Systems , 2023. [15] Y . Liu, D. Iter, Y . Xu, S. W ang, R. Xu, and C. Zhu, “G-Eval: NLG ev aluation using GPT -4 with better human alignment, ” in Pr oceedings of EMNLP , 2023. [16] A. Y . Ng, D. Harada, and S. Russell, “Policy inv ariance under reward transformations: Theory and application to reward shaping, ” in Interna- tional Confer ence on Machine Learning , 1999. [17] R. S. Sutton, D. McAllester, S. Singh, and Y . Mansour, “Policy gradient methods for reinforcement learning with function approximation, ” in Advances in Neural Information Pr ocessing Systems , 1999. [18] L. von W erra et al. , “TRL: T ransformer reinforcement learning, ” Hug- ging F ace, 2020, https://github.com/huggingf ace/trl . [19] J. Schulman, F . W olski, P . Dhariwal, A. Radford, and O. Klimov , “Prox- imal policy optimization algorithms, ” arXiv pr eprint arXiv:1707.06347 , 2017. [20] E. J. Hu, Y . Shen, P . W allis, Z. Allen-Zhu, Y . Li, S. W ang, L. W ang, and W . Chen, “LoRA: Low-rank adaptation of large language models, ” in International Conference on Learning Representations , 2022. [21] Qwen T eam, “Qwen2.5-coder technical report, ” arXiv preprint arXiv:2409.12186 , 2024. [22] J. Ainslie, J. Lee-Thorp, M. de Jong, Y . Zemlyanskiy , F . Lebrón, and S. Sanghai, “GQA: T raining generalized multi-query transformer models from multi-head checkpoints, ” arXiv preprint , 2023. [23] N. Shazeer , “GLU variants improv e transformer, ” arXiv pr eprint arXiv:2002.05202 , 2020. [24] Anthropic, “Claude Sonnet 4.6 system card, ” Anthropic, Feb. 2026, https://www .anthropic.com/claude- sonnet- 4- 6- system- card . [25] OpenAI, “gpt-oss-120b & gpt-oss-20b model card, ” arXiv preprint arXiv:2508.10925 , 2025. [26] Meta AI, “The Llama 4 herd: The beginning of a new era of natively multimodal AI innovation, ” Meta AI Blog, Apr . 2025, https://ai.meta. com/blog/llama- 4- multimodal- intelligence/ . [27] A. Y ang et al. , “Qwen3 technical report, ” arXiv preprint arXiv:2505.09388 , 2025. A P P E N D I X T able XII provides the complete tool reference. T ABLE XII C O MP L E T E TO O L R E F E RE N C E . T ool P arameters Description web_search query: str Search web fetch_url url: str Fetch URL create_outline sections: list Create outline revise_outline slide_idx, ... Edit outline generate_slide slide_idx, ... Generate slide edit_slide slide_idx, ... Edit slide set_theme theme: str Set theme get_slide_content idx: int Get slide HTML delete_slide idx: int Remov e slide reorder_slides order: list Reorder slides duplicate_slide idx: int Cop y slide insert_slide pos: int Insert slide review_deck (none) Revie w deck finalize (none) End episode T able XIII lists the visual theme color palettes. Color intensity interpolation: colors=0.0 produces grayscale; colors=1.0 produces full vivid colors. Example Brief: T ABLE XIII V I SU AL T H E ME C O LO R PAL E T T ES . Theme Bg T ext Accent Secondary default (255,255,255) (33,33,33) (41,98,255) (100,181,246) dark (30,30,30) (240,240,240) (0,200,83) (76,175,80) corporate (245,245,245) (44,62,80) (52,73,94) (149,165,166) creativ e (255,253,231) (33,33,33) (255,87,34) (255,167,38) tech (18,18,18) (224,224,224) (0,229,255) (29,233,182) { "topic": "Series B Funding Pitch - AI-Powered Supply Chain Platform", "audience": "venture capitalists", "num_slides": 10, "confidence": 1.0, "content": { "company": "ChainMind AI", "problem": "Supply chain disruptions cost $184B annually", "solution": "AI predicting disruptions 14 days ahead", "traction": {"arr": "$4.2M", "growth": "312% YoY"}, "ask": "$25M at $100M pre-money" } } T rajectory Summary: 18 turns, 10 slides created, final quality 0.847, completed successfully . The following prompt is used for the in verse specification rew ard: You are analyzing a slide deck presentation. Based ONLY on the slide content, predict what the original brief/requirements were. Return a JSON object with: { "topic": "The main topic or title", "audience": "Who this targets", "num_slides": , "key_themes": ["theme1", "theme2", "theme3"] } Return ONLY the JSON object. No explanation. The reconstruction score is computed by comparing pre- dicted values against the actual brief across four dimensions: topic similarity , audience match, slide count accuracy , and theme cov erage. Manuscript r eceived Mar ch 2026. Karthik Ragunath Ananda K umar and Subrahmanyam Arunachalam contributed equally to this work.
Original Paper
Loading high-quality paper...
Comments & Academic Discussion
Loading comments...
Leave a Comment