Dataflow-Oriented Classification and Performance Analysis of GPU-Accelerated Homomorphic Encryption
Fully Homomorphic Encryption (FHE) enables secure computation over encrypted data, but its computational cost remains a major obstacle to practical deployment. To mitigate this overhead, many studies have explored GPU acceleration for the CKKS scheme…
Authors: Ai Nozaki, Takuya Kojima, Hideki Takase
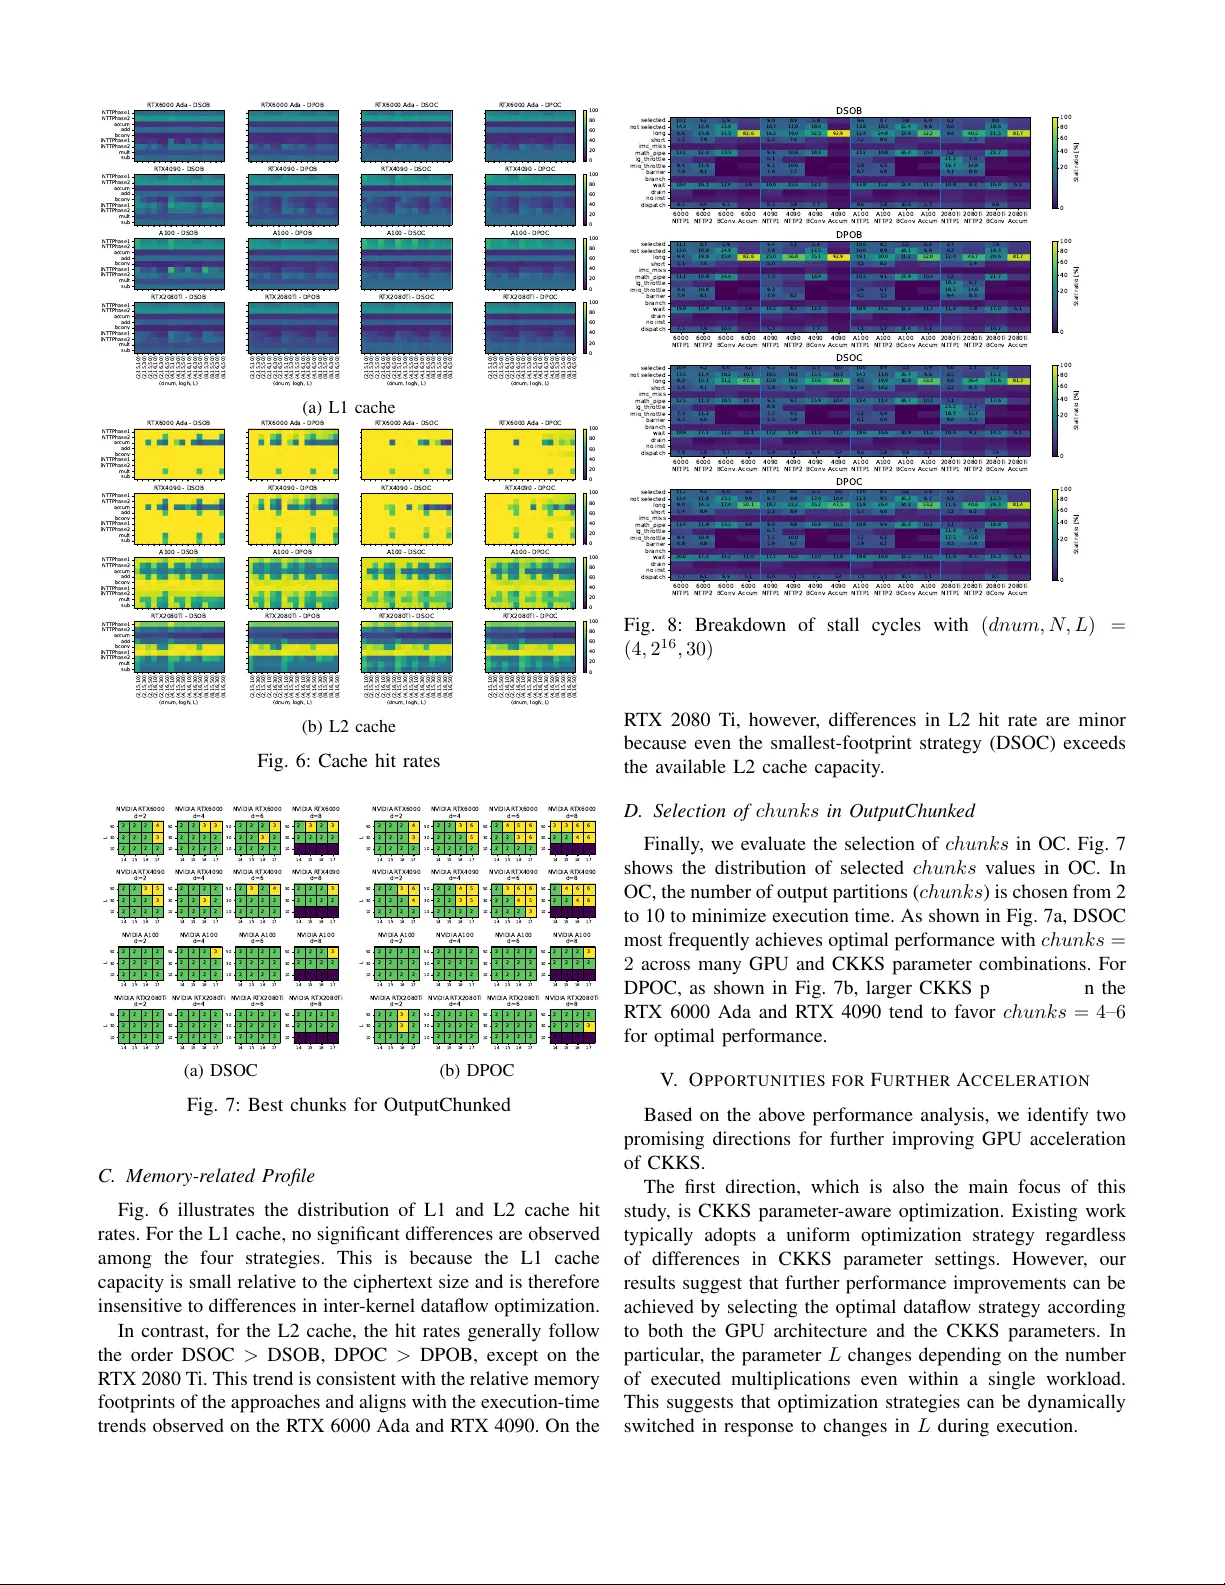
Dataflo w-Oriented Classification and Performance Analysis of GPU-Accelerated Homomorphic Encryption Ai Nozaki ∗ , T akuya K ojima † , Hiroshi Nakamura ∗ , and Hideki T akase ∗ ∗ The University of T okyo † Tsukuba University ∗ nozaki@hal.ipc.i.u-tokyo.ac.jp Abstract —Fully Homomorphic Encryption (FHE) enables se- cure computation over encrypted data, but its computational cost remains a major obstacle to practical deployment. T o mitigate this overhead, many studies ha ve explored GPU acceleration for the CKKS scheme, which is widely used for appr oximate arithmetic. In CKKS, CKKS parameters are configur ed for each workload by balancing multiplicative depth, security r e- quirements, and performance. These parameters significantly affect ciphertext size, ther eby determining how the memory footprint fits within the GPU memory hierarch y . Nevertheless, prior studies typically apply their proposed optimization methods uniformly , without considering differences in CKKS parameter configurations. In this work, we demonstrate that the optimal GPU optimization strategy for CKKS depends on the CKKS parameter configuration. W e first classify prior optimizations by two aspects of dataflows which affect memory f ootprint and then conduct both qualitativ e and quantitative performance analyses. Our analysis shows that even on the same GPU ar chitecture, the optimal strategy varies with CKKS parameters with performance differences of up to 1.98 × between strategies, and that the criteria for selecting an appropriate strategy differ across GPU architectur es. Index T erms —Fully Homomorphic Encryption, CKKS, GPU I . I N T RO D U C T I O N W ith the widespread use of cloud computing, protect- ing data confidentiality has become increasingly important. FHE enables computation directly on encrypted data without decryption. FHE supports arithmetic or logical operations ov er ciphertexts and is therefore expected to enable priv acy- sensitiv e machine learning and data analytics. Howe ver , the high computational ov erhead of FHE remains a significant barrier to its widespread adoption. In the CKKS scheme [1], which is one of the most widely adopted HE schemes, ex ecution times are 10 4 to 10 5 times longer than plaintext computations. T o mitigate this performance o verhead, man y prior studies hav e proposed GPU acceleration for CKKS. In CKKS, parameters are configured for each workload by balancing the number of supported operations, security re- quirements, and performance. W e define the CKKS parameter set as a tuple ( dnum, N , L ) . Here, N denotes the polynomial degree of a ciphertext, and L represents the maximum mul- tiplicativ e depth. Given N and L , a CKKS ciphertext can be viewed as a structure consisting of L chained polynomials of dimension N . The parameter dnum determines the number of partitions used in the Ke ySwitch operation, which accounts for approximately 70 % of the total ex ecution time in CKKS. During Ke ySwitch, the L polynomials are divided into dnum parts, and each part is referred to as a digit. These CKKS parameters are configured for each workload according to the aforementioned trade-offs. For example, workloads requiring deep computational circuits, such as machine learning infer- ence, use a larger L , which in turn necessitates a larger N to satisfy security requirements. T ypical parameter ranges are N = 2 13 to 2 17 , L = 0 to 64 , and dnum = 2 to 10 . Prior work on GPU acceleration of CKKS generally applies proposed optimization strategies uniformly , without consider- ing dif ferences in CKKS parameter configurations. Howe ver , CKKS parameters significantly affect the memory footprint, which in turn impacts the ef fectiv eness of optimizations. Furthermore, under commonly used CKKS parameter ranges, the resulting memory footprint is close to the L2 cache capacity of modern GPUs. This observ ation raises the ques- tion of whether a single optimization strategy can be ef fec- tiv e across all CKKS parameter configurations. For example, W arpDriv e [2] introduces a Parallelism-Enhanced Kernel that ex ecutes dnum independent sub-operations in K eySwitch in parallel, effectiv ely exploiting digit-level parallelism. While this approach increases parallelism, it also enlarges the mem- ory footprint, potentially causing frequent L2 cache e victions and performance degradation. For a small parameter set, e.g., ( dnum, N , L ) = (2 , 2 15 , 10) , the on-chip memory footprint of W arpDriv e’ s method is 2 × 2 15 × 10 × 8 Bytes = 5 . 12 MB , which fits within the L2 cache of modern GPUs (e.g., 40 MB in NVIDIA A100). In contrast, for a larger parameter set, e.g., (4 , 2 16 , 50) , the footprint reaches 100 MB , exceeding the L2 cache capacity of many GPUs. This observation suggests that the appropriate optimization strategy may depend on both CKKS parameters and the underlying GPU architecture. Furthermore, prior work e valuates performance using only a limited number of CKKS parameter configurations. For exam- ple, Cheddar [3] ev aluates one configuration, W arpDri ve [2] ev aluates fiv e, and Neo [4] e valuates sev en. These represent only a small subset of the possible parameter combinations. As a result, there is limited discussion on whether each optimization strategy remains effecti ve across a broader range of CKKS parameters. In this work, we demonstrate that the optimal GPU opti- mization strategy for CKKS varies according to the CKKS parameter configuration. W e classify existing optimization strategies into four categories and conduct both qualitativ e and quantitati ve performance analyses while varying CKKS parameters. W e first classify prior optimizations by two aspects of dataflow that affect memory footprint: (1) whether digit-le vel parallelism is e xploited in K eySwitch (DigitSerial or Digit- Parallel), and (2) whether output granularity in Ke ySwitch is partitioned (OutputBulk or OutputChunk ed). These tw o axes yield four distinct optimization strategies. Based on the abov e classification, we observe that prior studies have primarily focused on optimizing the total DRAM access traf fic, improving DRAM bandwidth utilization, and reducing the memory footprint. T o understand why the optimal optimization strategy changes with CKKS parameter configurations, we conduct a qualitativ e analysis of their computational characteristics. W e first estimate the on-chip memory footprint of each optimiza- tion strategy across CKKS parameter configurations. Changes in memory footprint can lead to different cache behaviors, which in turn reshapes the distribution of execution stalls. W e employ GCoM [5], a GPU performance modeling framework, to analyze how these changes in memory footprint affect the ov erall performance of each optimization strategy . Then, we perform quantitativ e performance e valuation across different CKKS parameter sets and GPU architectures. Our results show that even on the same GPU architecture, the optimal optimization strategy varies depending on CKKS parameters, with performance dif ferences up to 1.98 × between strategies. Moreo ver , the criteria for selecting the optimal strat- egy differ across GPU architectures. Overall, we demonstrate that the appropriate optimization strategy depends on the com- bination of CKKS parameters and GPU architecture. These findings suggest that CKKS parameter-a ware optimization can unlock additional performance improvements for CKKS workloads accelerated on GPUs. I I . B AC K G RO U N D A. CKKS Encryption 1) CKKS: CKKS [1] is one of the FHE schemes that enable approximate addition and multiplication over encrypted real numbers. Parameters used in CKKS are summarized in T able I. In CKKS, a message is represented as a vec- tor of N / 2 real numbers. Through the encode and encrypt procedures, the message is transformed into a ciphertext ct = ( ct 0 ( x ) , ct 1 ( x )) ∈ R 2 Q , where R Q = Z Q [ x ] / ( x N − 1) denotes a degree- N polynomial ring with coef ficients in the integer ring Z Q , and Q is the modulus. Since Q is a lar ge integer (typically around 1000 bit ), it is decomposed via the Chinese Remainder Theorem as Q = Q L − 1 i =0 q i , where each q i is a machine-word-sized modulus. As a result of this decomposition, a ciphertext has a structure consisting of L chained polynomials, which is referred to as a ciphertext at le vel- L . The level indicates the remaining multiplicativ e depth of the ciphertext, and it decreases by one after each multiplication. The homomorphic operations in CKKS are defined as follows: • HADD : Adds two ciphertexts. ct add ( ct, ct ′ ) = ct + ct ′ • HMUL : Multiplies two ciphertexts. ct mul ( ct, ct ′ ) = ( ct 0 ct ′ 0 , ct 0 ct ′ 1 + ct ′ 0 ct 1 ) + KS ( ct 1 ct ′ 1 ) • HROT : Rotates a ciphertext. ct rot ( ct, r ) = (0 , rot ( ct 1 , r )) + KS ( rot ( ct 0 , r )) Here, KS denotes the K eySwitch operation, which trans- forms a cipherte xt into a cipherte xt under a dif ferent secret k ey . In CKKS workloads, KeySwitch accounts for approximately 70 % of the total ex ecution time [6]. Accordingly , this work focuses on Ke ySwitch as the primary subject of analysis. 2) K eySwitc h: The o verall procedure of K eySwitch is il- lustrated in Fig. 1. In Ke ySwitch, the input ciphertext is first decomposed into dnum digits, each at le vel- α , where α = ( l + 1) /dnum . In the first phase, sho wn in blue, each digit is expanded to lev el l + α by performing the operations iNTT → BConv → NTT . Each digit is then multiplied by the corresponding ev aluation key , and the results are accumulated across all digits. In the second phase, shown in green, the lev el of the ciphertext is reduced back to l by again applying iNTT → BConv → NTT . Here, BConv (Base Con version) con verts a polynomial into an approximately equiv alent polynomial with a different set of moduli. NTT (Number Theoretic Trans- form) is a variant of the Fast Fourier Transform defined over integer polynomial rings. Ciphertexts are typically maintained in the NTT domain to accelerate polynomial multiplication. Howe ver , since BConv requires coefficients in the standard (non-NTT) domain, NTT and its inv erse ( iNTT ) are performed before and after BConv . Because K eySwitch expands each digit to le vel l + α , it increases both computational cost and data size. 3) CKKS P arameter Configuration: These CKKS param- eters are configured for each workload by balancing the supported multiplicative depth, security requirements, and performance. A larger Q , i.e., a larger L , enables deeper computational circuits, howe ver , it also weakens security . T o maintain a target security le vel, a larger N is required when L increases, which in turn raises the computational cost. A smaller dnum also reduces security , whereas a larger dnum increases computational ov erhead and ev aluation key size. FHE compilers incorporate CKKS parameter selection into their compilation process [7], [8]. Similarly , FHE ASIC accelerators such as BTS [9] simulate ex ecution time across a range of CKKS parameter configurations in advance to determine the supported parameter sets. B. GPU P erformance Modeling W e briefly describe the GPU performance modeling method proposed in GCoM [5]. GCoM analytically estimates the ex ecution cycles of a GPU kernel. First, GCoM assumes a representativ e warp with no re- source contention and calculates the execution c ycles con- sidering only stalls caused by data hazards. The SASS (the T ABLE I: Parameters used in CKKS Parameter Description N Degree of polynomial Q Modulus L Maximum multiplicati ve level. Q = Q L i =1 q i l Current le vel 1 ≤ l ≤ L − 1 dnum Decomposition number α ⌈ ( L + 1) /dnum ⌉ (", $) (", &) (", $) (", $ + & ) 2(", $ + & ) Data Size iNTT Decomp BConv NTT Mult Key Accum iNTT BConv NTT dnum - 1 0 Sum Reduce Fig. 1: Ke ySwitch operation instruction sequence of an NVIDIA GPU) of the representati ve warp is obtained via tracing. Then, GCoM conducts interval analysis and divides the instruction sequence into interv als where instructions can be issued continuously and intervals where ex ecution stalls due to data dependencies waiting for memory access or computational results. Using cache simu- lation, the a verage memory access latenc y is estimated. As a result of interval analysis, the stall cycles for each interval S I ntv k are deriv ed. Next, stalls caused by structural hazards among warps are considered to estimate the total ex ecution c ycles. The total kernel execution cycles are computed as follows: C ker nel = P # S M i =1 C i # S M (1) C i = P # S ubcore j =1 C i,j # S ubcor e + S i (2) where C i,j represents the execution c ycles of subcore j in SM i , and S i represents the stall cycles due to inter -subcore interference. Here, a subcore refers to the ex ecution unit associated with a GPU warp scheduler . The execution cycles per subcore, C i,j , are decomposed as: C i,j = C Activ e i,j + C I dle i,j (3) = C B ase i,j + S C omData i,j + S M emD ata i,j + C I dle i,j (4) C B ase i,j represents the ideal ex ecution c ycles assuming no stalls: C B ase i,j = W ar ps × I nstsP er W ar p I ssueRate (5) S C omData i,j and S M emD ata i,j represent stalls due to compu- tational data dependencies and memory data dependencies, respectiv ely . They are calculated by subtracting the cycles hidden by other warps from the stall c ycles S I ntv k for each interval as follows: S C om/ M emData i,j = X k ∈ I ntv s max( S I ntv k − C other , 0) (6) C other = P war p × (# W ar ps − 1) × Av gI ntr vI nsts (7) where P war p denotes the probability that other warps can issue instructions during a stall interval caused by data hazards. C I dle i,j represents idle cycles incurred while waiting for other subcores. The stall cycles due to inter-subcore interference S i are further decomposed as: S i = S C omS truct i + S M emS tr uct i + S N oC i + S DR AM i (8) S C omS truct i represents stalls due to contention for compu- tational units, and S M emS tr uct i represents stalls due to L1 cache bank conflicts. For each interval, the required cycles for each functional unit are calculated, and the difference between the maximum required c ycles and the ideal issue cycles is accumulated as stall cycles. S N oC i and S DR AM i represent stalls caused by memory access contention in the on-chip network (NoC) and DRAM, respectiv ely . They are estimated by multiplying the number of accesses (considering hit rates) by the respecti ve access latencies: S N oC i = 0 . 5 × # S M × M × L N oC (9) S DR AM i = 0 . 5 × # S M × M × L 2 M iss × L DR AM (10) M = ( M Read × L 1 M iss + M W r ite ) × # W ar ps (11) Here, M denotes the number of memory accesses issued per w arp. L DR AM and L N oC denote the DRAM and NoC access latencies, respectiv ely , which are calculated as: L DR AM = f × B lock S iz e B andw idth DR AM (12) L N oC = f × B lock S iz e B andw idth N oC (13) By computing these various stall cycles, the total kernel ex ecution cycles and their breakdown can be estimated. I I I . Q UA L I TA T I V E A N A L Y S I S In this study , we inv estigate the hypothesis that the appro- priate optimization strategy for accelerating CKKS on GPUs depends on the chosen CKKS parameter configuration. W e first classify prior optimizations by two aspects of dataflows which af fect memory footprint and then conduct qualitati ve performance analysis for each optimization strategy . A. Dataflow-Oriented Classification of CKKS Acceleration W e or ganize the dataflow-related optimization strate gies proposed in prior studies on GPU acceleration. F ocusing on the dataflow of Ke ySwitch computation, we consider the follo wing two axes: 1) Digit-le vel parallelism in KeySwitch. Ke ySwitch con- sists of dnum independent partial computations. W e Decomp iNTT BConv NTT Mult Accum iNTT BConv NTT Sum time (a) DSOB Decomp iNTT BConv NTT Mult Accum iNTT BConv NTT Sum time (b) DPOB Decomp iNTT BConv NTT Mult Accum iNTT BConv NTT Sum time (c) DSOC Decomp iNTT BConv NTT Mult Accum iNTT BConv NTT Sum time (d) DPOC Fig. 2: Ke ySwitch dataflow in the four categories. T ABLE II: Classification of prior work DigitSerial DigitParallel OutputBulk 100x [10], HE-Booster [11], FIDESlib [12], Phantom [13], CARM [14], HEonGPU [15], [16] W arpDrive [2], Cheddar [3] OutputChunked MAD [17] - refer to the method that ex ecutes these computations sequentially as DigitSerial (DS), and the method that ex ecutes them in parallel within a single kernel as DigitParallel (DP). 2) Output granularity in K eySwitch. Ke ySwitch pro- duces a cipherte xt of lev el- ( L + α ) and le vel- L poly- nomials in the first and second phases, respectively . In the first and second phases, KeySwitch generates inter- mediate polynomials at lev els l + α and l , respectively . W e refer to the method that computes all lev els at once as OutputBulk (OB), and the method that partitions the output and computes it incrementally as OutputChunked (OC). In OC, the number of output partitions is denoted by chunk s . Combining these tw o axes yields four approaches. Fig. 2 illustrates the Ke ySwitch dataflow for these approaches. In the figure, the horizontal axis represents time, indicating the ex ecution order of the internal KeySwitch steps, and the colors correspond to those used in Fig. 1. For example, in DSOB, computations are performed sequentially across digits over time (DS), and for each digit, the entire output is computed in a single pass (OB). B. Mapping of Prior W ork This subsection maps prior work to the dataflo w optimiza- tion taxonomy introduced abov e (T able II). Since this work focuses on inter -kernel dataflo w optimizations, we omit the details of intra-kernel computational optimizations (e.g., the use of T ensor Cores for NTT). DSOB follows the baseline algorithmic dataflow without special optimizations. 100x [10] is the first work to acceler- ate the full CKKS pipeline on GPUs. Identifying element- wise operations as a performance bottleneck, it introduced kernel fusion across adjacent kernels. Since k ernel fusion for element-wise operations has been adopted by nearly all subsequent studies, we exclude it from our classification and do not discuss it further . HE-Booster [11] is charac- terized by fine-grained inter -thread synchronization in NTT . FIDESlib [12] provides an OpenFHE [18]-compatible in- terface. Phantom [13] targets unified acceleration of BFV , BGV , and CKKS. CARM [14] focuses on resource-constrained en vironments such as IoT . [16] presents optimizations tailored for Intel GPUs. DPOB addresses the lo w utilization of computational re- sources in DSOB by extracting parallelism through kernel fusion across multiple digits in KeySwitch. W arpDriv e [2] is the first work to introduce DPOB. W arpDriv e also proposes concurrent use of T ensor Cores and CUDA Cores for NTT . Cheddar [3] makes a major contribution by introducing 25– 30 bit primes, and also proposes kernel fusion both inside and outside FHE operations from a dataflow perspectiv e. DSOC is proposed based on the observation that CKKS ASIC accelerators require substantial on-chip memory (e.g., 512 MB as reported in BTS [9]). MAD [17] partitions cipher- texts and reorders execution to maximize data reuse under limited on-chip memory capacity . Although primarily moti- vated by ASIC design, MAD demonstrates its effecti veness via simulation on ASICs, GPUs, and FPGAs. CiFlo w [19] proposes a similar partitioned dataflow , b ut it is not GPU- focused. DPOC is a theoretically feasible dataflow , but it has not yet been adopted in existing work. This is likely because OC w as originally proposed to reduce the required on-chip memory footprint for ASIC acceleration, whereas combining it with DP increases on-chip memory demand. Howe ver , on GPU architectures where such an on-chip memory footprint is acceptable, DPOC may become effectiv e as it conceptually lies between DPOB (high parallelism due to kernel fusion) and DSOC (high data reuse due to partitioning). Therefore, we include DPOC in our analysis. Sev eral prior works do not fall into the four approaches described abov e. T ensorFHE [20] is the first work to pro- pose using T ensor Cores, and from a dataflow perspective it improv es throughput by batching multiple FHE operations. Howe ver , as also pointed out in W arpDriv e [2], CKKS already processes N 2 real numbers in parallel within a single FHE operation, and thus workloads that can extract additional parallelism through batching are limited. W e therefore exclude batching from our classification. Neo [4], a successor to T ensorFHE [20], proposes mapping not only NTT but also other kernels to matrix multiplications to leverage T ensor Cores. Neo adopts the KLSS algorithm [21] for KeySwitch, but since this work targets the more widely used Hybrid T ABLE III: Computational characteristics (denoting dnum as d and chunk s as c ) DSOB DPOB DSOC DPOC on-chip memory footprint O ( N L ) O ( dN L ) O N L c O dN L c kernel launches O ( d ) O (1) O ( dc ) O ( c ) warps/kernel O (1) O ( d ) O 1 c O d c instructions/warp O (1) O (1) O (1) O (1) (2,15,10) (2,15,30) (2,15,50) (2,16,10) (2,16,30) (2,16,50) (4,15,10) (4,15,30) (4,15,50) (4,16,10) (4,16,30) (4,16,50) (6,15,10) (6,15,30) (6,15,50) (6,16,10) (6,16,30) (6,16,50) (8,15,10) (8,15,30) (8,15,50) (8,16,10) (8,16,30) (8,16,50) (digits, logN, L) 0 20 40 60 80 100 Data Size (MiB) R TX 2080T i L2 Cache A100 L2 Cache R TX 4090 L2 Cache R TX 6000 L2 Cache DSOB DPOB DSOC DPOC Fig. 3: Relationship between memory footprint and CKKS parameter algorithm [22], we do not include Neo in our classification. GME [23] proposes architecture-level improv ements based on AMD GPUs. It supports NoC communication across Compute Units (CUs, analogous to NVIDIA Streaming Multiprocessors) and proposes scheduling that places blocks processing the same data on the same CU across kernels. Because GME formulates scheduling as a general graph problem and does not clearly describe the resulting mapping, we exclude it from our classification. Finally , HE-Booster [11] also proposes multi- GPU execution strategies. Since this work focuses on single- GPU optimizations, we exclude multi-GPU dataflow from our classification. C. Qualitative P erformance Analysis W e qualitati vely analyze the performance of the classified approaches using the GPU performance modeling frame work introduced in Sec. II-B. T able III summarizes the differences in computational char- acteristics among the four approaches. First, memory footprint and cache behavior vary across approaches. Fig. 3 compares the memory footprint determined by the CKKS parameters with the L2 cache capacities of several GPUs. Since a ciphertext consists of L polynomials of dimension N , its size scales as O ( N L ) . In DP , the footprint increases by a factor of dnum because it concurrently processes dnum ciphertext components that are handled separately in DS. In OC, the footprint decreases by a factor of 1 /chunk s because the ciphertext is processed in chunks partitions. The DSOC footprint (sho wn in red) fits within the L2 cache for man y CKKS parameter settings, e ven on GPUs with relatively small L2 caches such as the R TX 2080 T i with 4 MB . In contrast, the DPOB footprint (shown in orange) can reach se veral tens of MB , and for some CKKS parameter settings it exceeds the L2 cache capacity even on high-end GPUs. Consequently , the cache hit rate varies depending on the relationship between the memory footprint and the L2 cache capacity . The four approaches also dif fer in kernel granularity and the number of kernel launches. In DP , the dnum kernels used in DS are merged into a single kernel. Therefore, the number of kernel launches is reduced to 1 /dnum times of that in DS. In contrast, OC divides a single kernel in OB into chunks number of smaller kernels, increasing the number of k ernel launches by a factor of chunk s . Because the total amount of computation remains identical across the four approaches, the computation per kernel scales in versely with the number of launches. Although the mapping of computations to warps within each kernel is implementation-dependent, we assume that the number of executed instructions per warp remains constant and that the number of warps is adjusted accordingly . That is, DP increases the number of warps per kernel by a factor of dnum compared with DS, while OB increases the number of warps per kernel by a factor of chunk s compared with OC, such that the product of the number of launches and the number of warps per launch remains constant. These dif ferences in computational characteristics lead to the following performance implications. • Ideal instruction execution cycles The ideal execution cycles without stalls, C B ase i,j , are identical across the four approaches. This is because I nstsP er W ar p in eq. (5) is constant, and the total number of warps ex ecuted ov er time is the same for all approaches. • Stalls due to data hazards Stalls caused by data hazards, S C omData and S M emD ata , depend on the cache hit rate and the number of con- currently executing warps. In eq. (7), a higher cache hit rate reduces the stall cycles S I ntv k incurred while waiting for memory accesses. Furthermore, a lar ger number of concurrent warps enables more ef fectiv e latency hiding, as data-hazard stalls in one warp can be ov erlapped with the ex ecution of other warps. DP and OB e xhibit a high warp density as long as the number of simultaneously resident blocks per SM remains within the architectural limit, resulting in bet- ter latency hiding. DP tends to require large memory footprint and may lo wer the cache hit rate, leading to increased stalls. Con versely , when the footprint fits within the L2 cache, DPOB can benefit from both high cache hit rates and effecti ve latency hiding due to its high warp density . • Stalls due to structural hazards Structural-hazard stalls caused by inter -subcore interfer- T ABLE IV: GPUs used in the e valuation GPU Peak INT32 L2 cache Frequency DRAM bandwidth R TX 6000 Ada 44 . 5 TOPS 96 MB 2 . 51 GHz 960 GB / s R TX 4090 41 . 3 TOPS 72 MB 2 . 52 GHz 1008 GB / s A100 19 . 5 TOPS 40 MB 1 . 41 GHz 1555 GB / s R TX 2080 T i 13 . 4 TOPS 5 . 5 MB 1 . 67 GHz 616 GB / s ence, S C omS truct and S M emS tr uct , increase with the number of concurrently executing warps. Consequently , DP incurs more such stalls than DS, and OB incurs more than OC. • Stalls due to NoC/DRAM access contention As shown in eq. (9) and eq. (10), S N oC and S DR AM in- crease with the number of concurrently ex ecuting warps. Therefore, similar to structural hazards, these stalls are larger in DP than in DS and larger in OB than in OC. In addition, these stalls increase when the L1/L2 cache hit rates are low . Hence, for approaches whose memory footprint exceeds the L2 cache capacity (as illustrated in Fig. 3), S N oC and S DR AM become more significant. W e expect the impact of the L1 cache hit rate to be limited, because dif ferences in inter-kernel dataflow do not substantially alter L1 cache utilization within each kernel. • K ernel launch overhead Since kernel launch ov erhead increases with the number of kernel launches, the overhead is larger in DSOC than in DSOB, and in DPOC than in DPOB. In summary , the four approaches exhibit distinct compu- tational characteristics, each of which may either increase or decrease execution time depending on the type of stall in volved. I V . Q U A N T I T A T I V E A N A L Y S I S A. Methodology W e next conduct a quantitati ve performance analysis of the four approaches. For the CKKS parameter configurations, we consider N ∈ { 2 14 , 2 15 , 2 16 , 2 17 } , L ∈ { 10 , 30 , 50 } , and dnum ∈ { 2 , 4 , 6 , 8 } . Note that the parameter combination ( L, dnum ) = (10 , 8) does not meet the security requirements of CKKS and is therefore excluded from the ev aluation. The GPUs used in our experiments are summarized in T able IV. W e e valuate four GPUs representing dif ferent classes of computing resources. The R TX 6000 Ada serv er is equipped with an Intel Xeon Gold 6226R CPU and 155 GB of memory . The R TX 4090 server features an Intel Xeon w9-3495X CPU and 502 GB of memory . The A100 server is equipped with an Intel Xeon Gold 6226R CPU and 187 GB of memory . The GTX 2080 Ti server features an Intel Xeon Gold 6240R CPU and 251 GB of memory . For profiling, we use NVIDIA Nsight Compute [24]. Under these experimental conditions, we measure the ex- ecution time of homomorphic multiplication ( HMUL ). Each experiment is repeated 100 times, and we report the av erage 14 15 16 17 10 30 50 L DPOB 1.18 1.48 DPOB 1.21 1.43 DPOB 1.10 1.25 DPOB 1.05 1.14 DPOB 1.17 1.30 DPOB 1.04 1.19 DPOC 1.03 1.08 DPOC 1.02 1.14 DPOB 1.06 1.18 DPOB 1.01 1.08 DPOC 1.04 1.11 DPOC 1.01 1.17 NVIDIA R TX6000 d=2 14 15 16 17 10 30 50 DPOB 1.32 1.76 DPOB 1.25 1.65 DPOB 1.07 1.32 DPOC 1.08 1.18 DPOB 1.16 1.43 DPOB 1.03 1.24 DPOC 1.10 1.15 DPOC 1.07 1.26 DPOB 1.05 1.24 DPOC 1.08 1.15 DPOC 1.08 1.20 DPOC 1.04 1.25 NVIDIA R TX6000 d=4 14 15 16 17 10 30 50 DPOB 1.31 1.98 DPOB 1.21 1.74 DPOB 1.04 1.37 DPOC 1.13 1.22 DPOB 1.14 1.49 DPOC 1.06 1.21 DPOC 1.18 1.26 DPOC 1.08 1.31 DPOB 1.02 1.27 DPOC 1.13 1.18 DPOC 1.13 1.28 DSOC 1.02 1.24 NVIDIA R TX6000 d=6 14 15 16 17 10 30 50 DPOB 1.12 1.51 DPOC 1.09 1.25 DPOC 1.21 1.28 DPOC 1.08 1.32 DPOC 1.04 1.26 DPOC 1.21 1.23 DPOC 1.15 1.33 DSOC 1.04 1.27 NVIDIA R TX6000 d=8 14 15 16 17 10 30 50 L DPOB 1.21 1.50 DPOB 1.19 1.41 DPOB 1.08 1.21 DPOC 1.00 1.06 DPOB 1.12 1.25 DPOB 1.05 1.15 DPOC 1.02 1.08 DPOC 1.02 1.13 DPOB 1.05 1.16 DPOB 1.00 1.05 DPOC 1.03 1.12 DSOC 1.01 1.10 NVIDIA R TX4090 d=2 14 15 16 17 10 30 50 DPOB 1.29 1.74 DPOB 1.22 1.55 DPOB 1.06 1.27 DPOC 1.06 1.12 DPOB 1.13 1.38 DPOC 1.00 1.16 DPOC 1.09 1.12 DPOC 1.07 1.22 DPOB 1.06 1.24 DPOC 1.06 1.12 DPOC 1.07 1.22 DSOC 1.00 1.12 NVIDIA R TX4090 d=4 14 15 16 17 10 30 50 DPOB 1.29 1.92 DPOB 1.19 1.63 DPOC 1.03 1.26 DPOC 1.14 1.17 DPOB 1.11 1.42 DPOC 1.07 1.22 DPOC 1.15 1.20 DPOC 1.02 1.20 DPOC 1.04 1.23 DPOC 1.17 1.18 DPOC 1.09 1.27 DSOC 1.03 1.15 NVIDIA R TX4090 d=6 14 15 16 17 10 30 50 DPOB 1.05 1.42 DPOC 1.10 1.24 DPOC 1.16 1.22 DSOC 1.01 1.21 DPOC 1.07 1.27 DPOC 1.19 1.21 DPOC 1.06 1.26 DSOC 1.07 1.18 NVIDIA R TX4090 d=8 14 15 16 17 10 30 50 L DPOB 1.21 1.49 DPOB 1.17 1.38 DPOB 1.12 1.25 DPOB 1.05 1.13 DPOB 1.13 1.32 DPOB 1.09 1.20 DPOB 1.04 1.09 DPOB 1.01 1.05 DPOB 1.09 1.19 DPOB 1.04 1.10 DPOB 1.02 1.05 DPOB 1.00 1.03 NVIDIA A100 d=2 14 15 16 17 10 30 50 DPOB 1.28 1.70 DPOB 1.22 1.56 DPOB 1.14 1.37 DPOB 1.07 1.18 DPOB 1.16 1.45 DPOB 1.10 1.26 DPOB 1.04 1.12 DPOB 1.04 1.07 DPOB 1.11 1.27 DPOB 1.06 1.15 DPOB 1.04 1.08 DPOB 1.02 1.03 NVIDIA A100 d=4 14 15 16 17 10 30 50 DPOB 1.29 1.89 DPOB 1.21 1.69 DPOB 1.14 1.44 DPOB 1.07 1.21 DPOB 1.15 1.52 DPOB 1.10 1.32 DPOB 1.06 1.16 DPOB 1.04 1.09 DPOB 1.10 1.35 DPOB 1.06 1.19 DPOB 1.04 1.10 DPOC 1.03 1.09 NVIDIA A100 d=6 14 15 16 17 10 30 50 DPOB 1.15 1.62 DPOB 1.11 1.37 DPOB 1.06 1.19 DPOB 1.04 1.10 DPOB 1.11 1.43 DPOB 1.06 1.21 DPOB 1.04 1.11 DPOC 1.02 1.08 NVIDIA A100 d=8 14 15 16 17 10 30 50 L DPOB 1.12 1.29 DPOB 1.09 1.18 DPOB 1.04 1.09 DPOB 1.02 1.06 DPOB 1.06 1.12 DPOB 1.04 1.08 DPOB 1.04 1.07 DPOB 1.01 1.03 DPOB 1.04 1.09 DPOB 1.03 1.06 DSOB 1.01 1.04 DPOB 1.01 1.02 NVIDIA R TX2080T i d=2 14 15 16 17 10 30 50 DPOB 1.16 1.38 DPOB 1.10 1.22 DPOB 1.07 1.13 DPOB 1.05 1.10 DPOB 1.08 1.17 DPOB 1.05 1.12 DPOB 1.03 1.07 DPOB 1.02 1.04 DPOB 1.05 1.14 DPOB 1.04 1.09 DPOB 1.03 1.05 DPOB 1.01 1.03 NVIDIA R TX2080T i d=4 14 15 16 17 10 30 50 DPOB 1.16 1.46 DPOB 1.09 1.26 DPOB 1.06 1.15 DPOB 1.05 1.12 DPOB 1.08 1.23 DPOB 1.05 1.14 DPOB 1.04 1.08 DPOB 1.02 1.04 DPOB 1.05 1.15 DPOB 1.04 1.10 DPOB 1.03 1.06 DPOB 1.01 1.03 NVIDIA R TX2080T i d=6 14 15 16 17 10 30 50 DPOB 1.07 1.23 DPOB 1.05 1.15 DPOB 1.03 1.09 DPOB 1.03 1.10 DPOB 1.05 1.17 DPOB 1.04 1.13 DPOB 1.03 1.07 DPOB 1.01 1.03 NVIDIA R TX2080T i d=8 Fig. 4: Distrib ution of the approach that achieves the best ex ecution time. For each cell, the top ro w indicates the best- performing approach, and the middle/bottom rows show the performance ratio relative to the second-best/worst-performing strategies. ex ecution time. The reported time includes the entire HMUL process, including data transfer from the CPU to the GPU. B. Execution T ime across CKKS P arameters Fig. 4 shows the distribution of optimization strate gies that achie ve the best execution time. Fig. 5 presents the detailed e xecution times and their breakdown. The stacked bars represent ex ecution time normalized to DSOB, while the line plots indicate absolute ex ecution time. On the R TX 6000 Ada and R TX 4090, the optimal strategy varies with the CKKS parameters even on the same GPU. Specifically , as the CKKS parameters increase, the best- performing strategy shifts from DPOB (orange) to DPOC (green) and then to DSOC (red). This trend corresponds to the ordering of the on-chip memory footprints of the approaches. When the L2 cache capacity becomes less than about twice the footprint, the optimal strategy tends to shift to the approach with the next smaller footprint. The maximum performance gap between the best and worst strategies reaches 1.98 × on the R TX 4090 at ( dnum, N , L ) = (6 , 2 14 , 10) . For small parameter sets (e.g., (2 , 2 15 , 30) and (4 , 2 15 , 10) ), DPOB achie ves the best performance, while DSOC exhibits significantly longer NTT and BConv execution times than the other strategies. Furthermore, kernel launch ov erhead (la- beled as CPU ) accounts for a substantial fraction of the total time relative to GPU computation, making DSOC particularly costly in these cases. In contrast, for larger parameter sets, DPOB becomes the worst-performing strategy . For example, at (4 , 2 16 , 50) and (8 , 2 16 , 50) , the execution time of DPOB in- (2,15,10) (2,15,30) (2,15,50) (2,16,10) (2,16,30) (2,16,50) (4,15,10) (4,15,30) (4,15,50) (4,16,10) (4,16,30) (4,16,50) (8,15,30) (8,15,50) (8,16,30) (8,16,50) SB PB SC PC SB PB SC PC SB PB SC PC SB PB SC PC SB PB SC PC SB PB SC PC SB PB SC PC SB PB SC PC SB PB SC PC SB PB SC PC SB PB SC PC SB PB SC PC SB PB SC PC SB PB SC PC SB PB SC PC SB PB SC PC 0.0 0.5 1.0 1.5 NVIDIA R TX6000 A da CPU NT TPhase1 NT TPhase2 accum add bconv iNT TPhase1 iNT TPhase2 mult sub (2,15,10) (2,15,30) (2,15,50) (2,16,10) (2,16,30) (2,16,50) (4,15,10) (4,15,30) (4,15,50) (4,16,10) (4,16,30) (4,16,50) (8,15,30) (8,15,50) (8,16,30) (8,16,50) SB PB SC PC SB PB SC PC SB PB SC PC SB PB SC PC SB PB SC PC SB PB SC PC SB PB SC PC SB PB SC PC SB PB SC PC SB PB SC PC SB PB SC PC SB PB SC PC SB PB SC PC SB PB SC PC SB PB SC PC SB PB SC PC 0.0 0.5 1.0 1.5 NVIDIA R TX4090 CPU NT TPhase1 NT TPhase2 accum add bconv iNT TPhase1 iNT TPhase2 mult sub (2,15,10) (2,15,30) (2,15,50) (2,16,10) (2,16,30) (2,16,50) (4,15,10) (4,15,30) (4,15,50) (4,16,10) (4,16,30) (4,16,50) (8,15,30) (8,15,50) (8,16,30) (8,16,50) SB PB SC PC SB PB SC PC SB PB SC PC SB PB SC PC SB PB SC PC SB PB SC PC SB PB SC PC SB PB SC PC SB PB SC PC SB PB SC PC SB PB SC PC SB PB SC PC SB PB SC PC SB PB SC PC SB PB SC PC SB PB SC PC 0.0 0.5 1.0 1.5 NVIDIA A100 CPU NT TPhase1 NT TPhase2 accum add bconv iNT TPhase1 iNT TPhase2 mult sub (2,15,10) (2,15,30) (2,15,50) (2,16,10) (2,16,30) (2,16,50) (4,15,10) (4,15,30) (4,15,50) (4,16,10) (4,16,30) (4,16,50) (8,15,30) (8,15,50) (8,16,30) (8,16,50) SB PB SC PC SB PB SC PC SB PB SC PC SB PB SC PC SB PB SC PC SB PB SC PC SB PB SC PC SB PB SC PC SB PB SC PC SB PB SC PC SB PB SC PC SB PB SC PC SB PB SC PC SB PB SC PC SB PB SC PC SB PB SC PC 0.0 0.5 1.0 1.5 NVIDIA R TX2080T i CPU NT TPhase1 NT TPhase2 accum add bconv iNT TPhase1 iNT TPhase2 mult sub 2000 4000 T otal [us] 2000 4000 T otal [us] 2000 4000 6000 T otal [us] 2500 5000 7500 10000 T otal [us] CKKS P arameter set (dnum, logN, L) T otal Ex ecution T ime [us] Nor malized Ex ecution T ime Fig. 5: Execution times across optimization strategies. S/P denote DigitSerial/Parallel, and B/C denote OutputBulk/Chunked. The stacked bars show the breakdo wn of execution time, normalized to DSOB. The line plots indicate the absolute execution time. creases substantially , particularly in NTTPhase2 , and DPOC achiev es the best performance. On the A100, DPOB achiev es the best execution time for most CKKS parameter settings. As shown in Fig. 5, the relativ e ordering of execution times among the four strategies is generally DPOB, DPOC < DSOB, DSOC across most parameter sets. Regardless of parameter size, DSOC tends to incur longer kernel e xecution and launch times than the other strategies. In a few cases, DPOC performs best, but the difference from the worst strategy is less than 10%, indicating only a marginal gap. On the R TX 2080 Ti, DSOB provides the best performance for most CKKS parameters. The performance dif ferences among the four strategies are smaller than on the A100, and aside from kernel launch overhead, e xecution times are nearly identical. Overall, DPOB achiev es the best e xecution time under a wide range of conditions on the A100 and R TX 2080 Ti. On the A100, we attribute this to architectural features that mitigate DPOB’ s primary drawback, which is stalls caused by DRAM access contention ( S DR AM ). Because DPOB has a lar ge on-chip footprint, it is more likely to incur DRAM accesses as a result of L2 cache misses. Indeed, Fig. 6b shows that e ven on the A100, DPOB tends to have a lower L2 cache hit rate than the other strate gies. As sho wn in eq. (10), S DR AM increases proportionally to the number of L2 cache misses, making it more pronounced for DPOB. How- ev er, S DR AM is also proportional to DRAM access latency , L DR AM = f × B lock S iz e/B andwidth DR AM , and L DR AM is smaller on the A100 than on the other GPUs. Specifically , as calculated from T able IV, the value of f / Bandwidth DR AM for the A100 is approximately one-third that of the other GPUs. Therefore, on the A100, the ne gative impact of S DR AM is reduced. At the same time, DPOB benefits from fe wer kernel launches and improv ed latency hiding due to a larger number of concurrently activ e warps, leading to the best performance across many settings. This interpretation is consistent with Fig. 8, which presents the breakdown of stall cycles for se- lected kernels under the CKKS parameter setting (4 , 2 16 , 30) . Although other GPUs exhibit a high fraction of long stalls (including S DR AM ) in DSOB, the A100 shows a smaller fraction, suggesting that DRAM access contention has a less pronounced impact on the A100. Finally , we discuss why DPOB tends to achieve the best performance on the R TX 2080 T i. Because its L2 cache capacity is small, performance differences caused by memory- access behavior are less pronounced across the four strategies. As shown in Fig. 3, the L2 cache of the R TX 2080 Ti can fully accommodate DSOC and only some configurations of DPOC/DSOB. In practice, as shown in Fig. 6b, the R TX 2080 Ti e xhibits lower L2 hit rates than the other GPUs, and the differences among the four strategies are also small. Consequently , similar to the A100, DPOB tends to perform best across many settings due to lo wer kernel-launch overhead and better utilization of parallelism. NT TPhase1 NT TPhase2 accum add bconv iNT TPhase1 iNT TPhase2 mult sub R TX6000 A da - DSOB R TX6000 A da - DPOB R TX6000 A da - DSOC R TX6000 A da - DPOC NT TPhase1 NT TPhase2 accum add bconv iNT TPhase1 iNT TPhase2 mult sub R TX4090 - DSOB R TX4090 - DPOB R TX4090 - DSOC R TX4090 - DPOC NT TPhase1 NT TPhase2 accum add bconv iNT TPhase1 iNT TPhase2 mult sub A100 - DSOB A100 - DPOB A100 - DSOC A100 - DPOC (2,15,10) (2,15,30) (2,15,50) (2,16,10) (2,16,30) (2,16,50) (4,15,10) (4,15,30) (4,15,50) (4,16,10) (4,16,30) (4,16,50) (8,15,30) (8,15,50) (8,16,30) (8,16,50) (dnum, logN, L) NT TPhase1 NT TPhase2 accum add bconv iNT TPhase1 iNT TPhase2 mult sub R TX2080T i - DSOB (2,15,10) (2,15,30) (2,15,50) (2,16,10) (2,16,30) (2,16,50) (4,15,10) (4,15,30) (4,15,50) (4,16,10) (4,16,30) (4,16,50) (8,15,30) (8,15,50) (8,16,30) (8,16,50) (dnum, logN, L) R TX2080T i - DPOB (2,15,10) (2,15,30) (2,15,50) (2,16,10) (2,16,30) (2,16,50) (4,15,10) (4,15,30) (4,15,50) (4,16,10) (4,16,30) (4,16,50) (8,15,30) (8,15,50) (8,16,30) (8,16,50) (dnum, logN, L) R TX2080T i - DSOC (2,15,10) (2,15,30) (2,15,50) (2,16,10) (2,16,30) (2,16,50) (4,15,10) (4,15,30) (4,15,50) (4,16,10) (4,16,30) (4,16,50) (8,15,30) (8,15,50) (8,16,30) (8,16,50) (dnum, logN, L) R TX2080T i - DPOC 0 20 40 60 80 100 0 20 40 60 80 100 0 20 40 60 80 100 0 20 40 60 80 100 (a) L1 cache NT TPhase1 NT TPhase2 accum add bconv iNT TPhase1 iNT TPhase2 mult sub R TX6000 A da - DSOB R TX6000 A da - DPOB R TX6000 A da - DSOC R TX6000 A da - DPOC NT TPhase1 NT TPhase2 accum add bconv iNT TPhase1 iNT TPhase2 mult sub R TX4090 - DSOB R TX4090 - DPOB R TX4090 - DSOC R TX4090 - DPOC NT TPhase1 NT TPhase2 accum add bconv iNT TPhase1 iNT TPhase2 mult sub A100 - DSOB A100 - DPOB A100 - DSOC A100 - DPOC (2,15,10) (2,15,30) (2,15,50) (2,16,10) (2,16,30) (2,16,50) (4,15,10) (4,15,30) (4,15,50) (4,16,10) (4,16,30) (4,16,50) (8,15,30) (8,15,50) (8,16,30) (8,16,50) (dnum, logN, L) NT TPhase1 NT TPhase2 accum add bconv iNT TPhase1 iNT TPhase2 mult sub R TX2080T i - DSOB (2,15,10) (2,15,30) (2,15,50) (2,16,10) (2,16,30) (2,16,50) (4,15,10) (4,15,30) (4,15,50) (4,16,10) (4,16,30) (4,16,50) (8,15,30) (8,15,50) (8,16,30) (8,16,50) (dnum, logN, L) R TX2080T i - DPOB (2,15,10) (2,15,30) (2,15,50) (2,16,10) (2,16,30) (2,16,50) (4,15,10) (4,15,30) (4,15,50) (4,16,10) (4,16,30) (4,16,50) (8,15,30) (8,15,50) (8,16,30) (8,16,50) (dnum, logN, L) R TX2080T i - DSOC (2,15,10) (2,15,30) (2,15,50) (2,16,10) (2,16,30) (2,16,50) (4,15,10) (4,15,30) (4,15,50) (4,16,10) (4,16,30) (4,16,50) (8,15,30) (8,15,50) (8,16,30) (8,16,50) (dnum, logN, L) R TX2080T i - DPOC 0 20 40 60 80 100 0 20 40 60 80 100 0 20 40 60 80 100 0 20 40 60 80 100 (b) L2 cache Fig. 6: Cache hit rates 14 15 16 17 10 30 50 L 2 2 2 2 2 2 2 3 2 2 2 4 NVIDIA R TX6000 d=2 14 15 16 17 10 30 50 2 2 2 2 2 2 2 2 2 2 3 3 NVIDIA R TX6000 d=4 14 15 16 17 10 30 50 2 2 2 2 2 2 3 2 2 2 2 3 NVIDIA R TX6000 d=6 14 15 16 17 10 30 50 -1 -1 -1 -1 2 2 2 2 2 3 2 3 NVIDIA R TX6000 d=8 14 15 16 17 10 30 50 L 2 2 2 2 2 2 2 3 2 2 3 5 NVIDIA R TX4090 d=2 14 15 16 17 10 30 50 2 2 2 2 2 2 3 2 2 2 2 2 NVIDIA R TX4090 d=4 14 15 16 17 10 30 50 2 2 2 2 2 2 2 2 2 3 2 4 NVIDIA R TX4090 d=6 14 15 16 17 10 30 50 -1 -1 -1 -1 2 2 2 2 2 2 2 3 NVIDIA R TX4090 d=8 14 15 16 17 10 30 50 L 2 2 2 2 2 2 2 2 2 2 2 2 NVIDIA A100 d=2 14 15 16 17 10 30 50 2 2 2 2 2 2 2 2 2 2 2 3 NVIDIA A100 d=4 14 15 16 17 10 30 50 2 2 2 2 2 2 2 2 2 2 2 2 NVIDIA A100 d=6 14 15 16 17 10 30 50 -1 -1 -1 -1 2 2 2 2 2 2 2 3 NVIDIA A100 d=8 14 15 16 17 10 30 50 L 2 2 2 2 2 2 2 2 2 2 2 2 NVIDIA R TX2080T i d=2 14 15 16 17 10 30 50 2 2 2 2 2 2 2 2 2 2 2 2 NVIDIA R TX2080T i d=4 14 15 16 17 10 30 50 2 2 2 2 2 2 2 2 2 2 2 2 NVIDIA R TX2080T i d=6 14 15 16 17 10 30 50 -1 -1 -1 -1 2 2 2 2 2 2 2 2 NVIDIA R TX2080T i d=8 (a) DSOC 14 15 16 17 10 30 50 L 2 2 2 2 2 2 2 3 2 2 2 4 NVIDIA R TX6000 d=2 14 15 16 17 10 30 50 2 2 2 2 2 2 2 5 2 2 3 6 NVIDIA R TX6000 d=4 14 15 16 17 10 30 50 2 2 2 2 2 2 3 6 2 4 5 6 NVIDIA R TX6000 d=6 14 15 16 17 10 30 50 -1 -1 -1 -1 2 2 4 6 3 3 6 6 NVIDIA R TX6000 d=8 14 15 16 17 10 30 50 L 2 2 2 2 2 2 2 4 2 2 3 6 NVIDIA R TX4090 d=2 14 15 16 17 10 30 50 2 2 2 2 2 2 3 5 2 2 4 5 NVIDIA R TX4090 d=4 14 15 16 17 10 30 50 2 2 2 3 2 2 4 5 2 3 6 6 NVIDIA R TX4090 d=6 14 15 16 17 10 30 50 -1 -1 -1 -1 2 2 4 6 2 4 6 6 NVIDIA R TX4090 d=8 14 15 16 17 10 30 50 L 2 2 2 2 2 2 2 2 2 2 2 2 NVIDIA A100 d=2 14 15 16 17 10 30 50 2 2 2 2 2 2 2 2 2 2 2 2 NVIDIA A100 d=4 14 15 16 17 10 30 50 2 2 2 2 2 2 2 2 2 2 2 2 NVIDIA A100 d=6 14 15 16 17 10 30 50 -1 -1 -1 -1 2 2 2 2 2 2 2 3 NVIDIA A100 d=8 14 15 16 17 10 30 50 L 2 2 2 2 2 2 3 2 2 2 3 2 NVIDIA R TX2080T i d=2 14 15 16 17 10 30 50 2 2 2 2 2 2 2 2 2 2 2 2 NVIDIA R TX2080T i d=4 14 15 16 17 10 30 50 2 2 2 2 2 2 2 2 2 2 2 2 NVIDIA R TX2080T i d=6 14 15 16 17 10 30 50 -1 -1 -1 -1 2 2 2 3 2 2 2 2 NVIDIA R TX2080T i d=8 (b) DPOC Fig. 7: Best chunks for OutputChunked C. Memory-r elated Pr ofile Fig. 6 illustrates the distrib ution of L1 and L2 cache hit rates. For the L1 cache, no significant differences are observed among the four strategies. This is because the L1 cache capacity is small relativ e to the ciphertext size and is therefore insensitiv e to differences in inter-k ernel dataflow optimization. In contrast, for the L2 cache, the hit rates generally follow the order DSOC > DSOB, DPOC > DPOB, except on the R TX 2080 T i. This trend is consistent with the relati ve memory footprints of the approaches and aligns with the e xecution-time trends observed on the R TX 6000 Ada and R TX 4090. On the 6000 NT TP1 6000 NT TP2 6000 B Conv 6000 A ccum 4090 NT TP1 4090 NT TP2 4090 B Conv 4090 A ccum A100 NT TP1 A100 NT TP2 A100 B Conv A100 A ccum 2080T i NT TP1 2080T i NT TP2 2080T i B Conv 2080T i A ccum selected not selected long short imc_miss math_pipe lg_thr ottle mio_thr ottle bar rier branch wait drain no inst dispatch 10.1 9.2 5.9 9.0 8.9 5.8 9.6 8.7 5.8 6.0 6.2 8.0 14.3 12.0 22.6 10.7 11.0 18.0 13.8 10.3 25.4 9.8 6.6 18.6 6.6 13.8 21.3 82.6 16.5 19.0 32.3 92.9 12.4 24.8 13.6 52.2 9.6 40.5 21.5 81.7 5.2 7.9 5.2 7.6 5.2 8.6 7.3 13.1 12.0 23.3 9.9 10.9 18.3 13.2 10.8 26.4 10.4 5.2 22.7 6.1 21.2 7.0 8.4 11.6 9.2 10.6 5.8 6.3 19.7 14.8 7.8 8.1 7.6 7.7 6.7 6.8 9.1 8.0 18.4 16.1 12.4 5.9 16.0 15.5 12.1 17.8 15.2 12.4 11.7 10.8 8.3 16.0 6.1 8.5 6.4 9.3 6.5 5.9 7.7 8.6 5.8 10.6 5.3 8.8 DSOB 6000 NT TP1 6000 NT TP2 6000 B Conv 6000 A ccum 4090 NT TP1 4090 NT TP2 4090 B Conv 4090 A ccum A100 NT TP1 A100 NT TP2 A100 B Conv A100 A ccum 2080T i NT TP1 2080T i NT TP2 2080T i B Conv 2080T i A ccum selected not selected long short imc_miss math_pipe lg_thr ottle mio_thr ottle bar rier branch wait drain no inst dispatch 11.1 8.7 5.9 9.4 5.1 5.4 10.6 8.2 5.2 6.0 6.7 7.9 12.0 10.8 24.9 7.8 17.5 10.6 8.9 28.1 9.8 6.3 18.3 9.4 19.8 15.4 82.6 25.0 56.8 35.1 92.9 19.1 30.0 11.2 52.0 12.0 43.7 20.6 81.7 5.1 7.6 5.0 5.1 8.2 5.4 11.1 10.8 24.4 7.3 16.9 10.2 9.1 27.9 10.4 5.2 21.7 18.5 6.7 9.6 10.8 9.3 5.6 6.1 18.5 14.6 7.9 8.1 7.6 8.2 6.5 7.2 9.4 8.3 19.8 15.4 13.8 5.9 16.5 8.7 12.3 18.9 14.5 12.2 11.7 11.6 7.8 17.0 6.1 7.5 5.9 10.3 5.3 7.7 7.1 5.2 11.4 5.2 10.2 DPOB 6000 NT TP1 6000 NT TP2 6000 B Conv 6000 A ccum 4090 NT TP1 4090 NT TP2 4090 B Conv 4090 A ccum A100 NT TP1 A100 NT TP2 A100 B Conv A100 A ccum 2080T i NT TP1 2080T i NT TP2 2080T i B Conv 2080T i A ccum selected not selected long short imc_miss math_pipe lg_thr ottle mio_thr ottle bar rier branch wait drain no inst dispatch 10.4 9.2 6.0 6.2 9.5 9.3 5.7 6.0 10.0 8.9 5.3 5.9 6.0 5.1 7.5 13.5 11.4 18.2 10.7 10.5 10.1 15.5 10.3 14.2 11.0 26.7 9.6 6.5 15.2 8.2 15.1 31.2 47.5 15.0 19.5 37.6 48.0 9.5 19.9 16.0 53.3 9.6 36.4 31.6 81.3 5.6 9.1 5.8 9.3 5.6 10.2 5.2 8.3 12.5 11.3 18.3 10.7 9.5 9.7 15.9 10.4 13.4 11.4 28.7 10.2 5.1 17.6 8.8 23.2 7.7 7.3 11.2 7.5 9.5 5.1 6.8 18.7 15.7 6.5 6.6 5.5 5.8 6.1 6.0 8.0 7.5 18.9 17.1 12.2 12.1 17.2 17.9 11.5 11.7 18.6 16.6 10.9 11.5 10.6 9.2 14.5 6.1 7.9 5.8 7.7 5.5 5.9 5.1 6.9 5.4 8.6 5.8 9.9 5.2 7.9 DSOC 6000 NT TP1 6000 NT TP2 6000 B Conv 6000 A ccum 4090 NT TP1 4090 NT TP2 4090 B Conv 4090 A ccum A100 NT TP1 A100 NT TP2 A100 B Conv A100 A ccum 2080T i NT TP1 2080T i NT TP2 2080T i B Conv 2080T i A ccum selected not selected long short imc_miss math_pipe lg_thr ottle mio_thr ottle bar rier branch wait drain no inst dispatch 11.5 9.2 6.0 6.0 10.0 8.6 5.5 6.0 11.0 8.5 5.2 5.9 6.6 7.5 12.4 11.8 23.5 9.8 9.7 9.8 17.0 10.4 11.2 9.5 26.2 9.7 6.3 15.5 8.0 14.5 17.4 50.1 18.7 22.2 35.2 47.5 15.9 26.4 14.2 53.2 11.6 40.6 29.3 81.4 5.4 8.9 5.2 8.9 5.7 9.6 5.2 6.2 11.4 11.8 23.5 9.8 9.0 9.8 16.8 10.5 10.8 9.9 26.6 10.2 5.1 18.8 6.7 21.0 7.8 8.4 10.9 7.5 10.0 5.7 6.2 17.5 15.0 6.8 6.8 5.9 6.7 5.9 6.2 8.3 7.8 20.6 17.2 14.2 11.6 17.7 16.5 13.0 11.8 19.8 16.0 12.5 11.5 11.6 8.5 16.3 6.1 7.7 6.1 9.9 5.1 6.0 5.1 7.5 5.4 7.3 5.3 10.5 5.1 8.5 DPOC 0 20 40 60 80 100 Stall ratio [%] 0 20 40 60 80 100 Stall ratio [%] 0 20 40 60 80 100 Stall ratio [%] 0 20 40 60 80 100 Stall ratio [%] Fig. 8: Breakdown of stall cycles with ( dnum, N , L ) = (4 , 2 16 , 30) R TX 2080 T i, ho wev er, differences in L2 hit rate are minor because even the smallest-footprint strategy (DSOC) exceeds the av ailable L2 cache capacity . D. Selection of chunk s in OutputChunked Finally , we ev aluate the selection of chunk s in OC. Fig. 7 shows the distrib ution of selected chunks values in OC. In OC, the number of output partitions ( chunk s ) is chosen from 2 to 10 to minimize execution time. As sho wn in Fig. 7a, DSOC most frequently achie ves optimal performance with chunk s = 2 across many GPU and CKKS parameter combinations. For DPOC, as sho wn in Fig. 7b, larger CKKS parameters on the R TX 6000 Ada and R TX 4090 tend to fav or chunk s = 4–6 for optimal performance. V . O P P O RT U N I T I E S F O R F U RT H E R A C C E L E R AT I O N Based on the abov e performance analysis, we identify two promising directions for further improving GPU acceleration of CKKS. The first direction, which is also the main focus of this study , is CKKS parameter-aw are optimization. Existing work typically adopts a uniform optimization strategy regardless of differences in CKKS parameter settings. Howe ver , our results suggest that further performance improvements can be achiev ed by selecting the optimal dataflow strategy according to both the GPU architecture and the CKKS parameters. In particular , the parameter L changes depending on the number of ex ecuted multiplications ev en within a single workload. This suggests that optimization strategies can be dynamically switched in response to changes in L during ex ecution. The second direction is to explore DPOC-based optimiza- tion. Although DPOC has not been adopted in prior work, it achieves the best execution time under certain CKKS parameter settings on the R TX 6000 Ada and R TX 4090. Designing optimization strategies that incorporate DPOC may therefore lead to further performance improv ements. V I . C O N C L U S I O N In this study , we demonstrated that in GPU acceleration of CKKS, the appropriate dataflow optimization strategy de- pends on the CKKS parameter configuration. W e classified dataflow optimization techniques proposed in existing w ork and conducted both qualitative and quantitativ e performance analyses of these approaches. Our analysis re vealed that the optimal strategy can vary depending on the CKKS parameters, and that the performance gap between different strategies can reach up to 1.98 × . In addition, we found that the criteria for selecting an appropriate optimization strategy dif fer across GPU architectures. Based on these findings, future work will work on accelerating whole CKKS workloads with parameter - aware and GPU architecture-aware optimization. R E F E R E N C E S [1] J. H. Cheon, A. Kim, M. Kim, and Y . Song, “Homomorphic encryption for arithmetic of approximate numbers, ” in Advances in Cryptology– ASIACR YPT 2017: 23rd International Confer ence on the Theory and Applications of Cryptology and Information Security , Hong K ong, China, December 3-7, 2017, Pr oceedings, P art I 23 . Springer, 2017, pp. 409– 437. [2] G. Fan, M. Zhang, F . Zheng, S. Fan, T . Zhou, X. Deng, W . T ang, L. K ong, Y . Song, and S. Y an, “ W arpDrive: GPU-Based Fully Homo- morphic Encryption Acceleration Lev eraging T ensor and CUD A Cores , ” pp. 1187–1200, 2025. [3] J. Kim, W . Choi, and J. H. Ahn, “Cheddar: A Swift Fully Homomorphic Encryption Library for CUD A GPUs, ” 2026. [Online]. A vailable: https://arxiv .org/abs/2407.13055 [4] D. Jiao, X. Deng, Z. W ang, S. F an, Y . Chen, D. Meng, R. Hou, and M. Zhang, “Neo: T owards efficient fully homomorphic encryption acceleration using tensor core, ” in Proceedings of the 52nd Annual International Symposium on Computer Ar chitectur e , ser . ISCA ’25. New Y ork, NY , USA: Association for Computing Machinery , 2025, p. 107–121. [Online]. A vailable: https://doi.org/10.1145/3695053.3731408 [5] J. Lee, Y . Ha, S. Lee, J. W oo, J. Lee, H. Jang, and Y . Kim, “Gcom: a detailed gpu core model for accurate analytical modeling of modern gpus, ” in Pr oceedings of the 49th Annual International Symposium on Computer Ar chitectur e , ser. ISCA ’22. New Y ork, NY , USA: Association for Computing Machinery , 2022, p. 424–436. [Online]. A vailable: https://doi.org/10.1145/3470496.3527384 [6] E. Lee, J.-W . Lee, J. Lee, Y .-S. Kim, Y . Kim, J.-S. No, and W . Choi, “Low-comple xity deep conv olutional neural networks on fully homomorphic encryption using multiplexed parallel conv olutions, ” in Pr oceedings of the 39th International Conference on Machine Learning , ser . Proceedings of Machine Learning Research, K. Chaudhuri, S. Jegelka, L. Song, C. Szepesvari, G. Niu, and S. Sabato, Eds., vol. 162. PMLR, 17–23 Jul 2022, pp. 12 403–12 422. [Online]. A vailable: https://proceedings.mlr .press/v162/lee22e.html [7] L. Li, J. Lai, P . Y uan, T . Sui, Y . Liu, Q. Zhu, X. Zhang, L. Xiao, W . Chen, and J. Xue, “ANT -ACE: An FHE Compiler Frame work for Automating Neural Network Inference, ” in Proceedings of the 23r d ACM/IEEE International Symposium on Code Generation and Optimization , ser . CGO ’25. New Y ork, NY , USA: Association for Computing Machinery , 2025, p. 193–208. [Online]. A vailable: https://doi.org/10.1145/3696443.3708924 [8] R. Dathathri, O. Saarikivi, H. Chen, K. Laine, K. Lauter, S. Maleki, M. Musuvathi, and T . Mytkowicz, “Chet: an optimizing compiler for fully-homomorphic neural-network inferencing, ” in Proceedings of the 40th ACM SIGPLAN conference on pro gramming language design and implementation , 2019, pp. 142–156. [9] S. Kim, J. Kim, M. J. Kim, W . Jung, J. Kim, M. Rhu, and J. H. Ahn, “Bts: An accelerator for bootstrappable fully homomorphic encryption, ” in Proceedings of the 49th Annual International Symposium on Com- puter Ar chitecture , 2022, pp. 711–725. [10] W . Jung, S. Kim, J. H. Ahn, J. H. Cheon, and Y . Lee, “Over 100x faster bootstrapping in fully homomorphic encryption through memory- centric optimization with gpus, ” IACR T ransactions on Cryptographic Har dware and Embedded Systems , pp. 114–148, 2021. [11] Z. W ang, P . Li, R. Hou, Z. Li, J. Cao, X. W ang, and D. Meng, “He- booster: An ef ficient polynomial arithmetic acceleration on gpus for fully homomorphic encryption, ” IEEE T ransactions on P arallel and Distributed Systems , vol. 34, no. 4, pp. 1067–1081, 2023. [12] C. Agullo-Domingo, O. V era-Lopez, S. Guzelhan, L. Daksha, A. E. Jerari, K. Shivdikar , R. Agrawal, D. Kaeli, A. Joshi, and J. L. Abell ´ an, “Fideslib: A fully-fledged open-source fhe library for efficient ckks on gpus, ” in 2025 IEEE International Symposium on P erformance Analysis of Systems and Software (ISP ASS) , 2025, pp. 1–3. [13] H. Y ang, S. Shen, W . Dai, L. Zhou, Z. Liu, and Y . Zhao, “Phantom: A CUDA-Accelerated W ord-Wise Homomorphic Encryption Library, ” IEEE T ransactions on Dependable and Secur e Computing , pp. 1–12, 2024. [14] S. Shen, H. Y ang, Y . Liu, Z. Liu, and Y . Zhao, “ CARM: CUD A-Accelerated RNS Multiplication in W ord-Wise Homomorphic Encryption Schemes for Internet of Things , ” IEEE T ransactions on Computers , vol. 72, no. 07, pp. 1999–2010, Jul. 2023. [Online]. A vail- able: https://doi.ieeecomputersociety .org/10.1109/TC.2022.3227874 [15] A. S ¸ ah ¨ Ozcan and E. Sav as ¸, “HEonGPU: a GPU-based fully homomorphic encryption library 1.0, ” Cryptology ePrint Archive, Paper 2024/1543, 2024. [Online]. A vailable: https://eprint.iacr .org/2024/1543 [16] Y . Zhai, M. Ibrahim, Y . Qiu, F . Boemer , Z. Chen, A. T itov , and A. L yashevsky , “ Accelerating Encrypted Computing on Intel GPUs , ” in 2022 IEEE International P arallel and Distributed Pr ocessing Symposium (IPDPS) . Los Alamitos, CA, USA: IEEE Computer Society , Jun. 2022, pp. 705–716. [Online]. A vailable: https://doi.ieeecomputersociety .org/10.1109/IPDPS53621.2022.00074 [17] R. Agrawal, L. De Castro, C. Juvekar , A. Chandrakasan, V . V aikun- tanathan, and A. Joshi, “Mad: Memory-aware design techniques for accelerating fully homomorphic encryption, ” ser . MICR O ’23, 2023. [18] A. Al Badawi, J. Bates, F . Bergamaschi, D. B. Cousins, S. Erabelli, N. Genise, S. Hale vi, H. Hunt, A. Kim, Y . Lee, Z. Liu, D. Micciancio, I. Quah, Y . Polyakov , S. R.V ., K. Rohloff, J. Saylor, D. Suponitsky , M. Triplett, V . V aikuntanathan, and V . Zucca, “Openfhe: Open- source fully homomorphic encryption library , ” in Proceedings of the 10th W orkshop on Encrypted Computing & Applied Homomorphic Cryptography , ser . W AHC’22. New Y ork, NY , USA: Association for Computing Machinery , 2022, pp. 53–63. [Online]. A vailable: https://doi.org/10.1145/3560827.3563379 [19] N. Neda, A. Ebel, B. Reynw ar, and B. Reagen, “Ciflow: Dataflow analysis and optimization of key switching for homomorphic encryp- tion, ” 2024 IEEE International Symposium on P erformance Analysis of Systems and Software (ISP ASS) , pp. 61–72, 2023. [20] S. Fan, Z. W ang, W . Xu, R. Hou, D. Meng, and M. Zhang, “T ensorfhe: Achieving practical computation on encrypted data using gpgpu, ” in 2023 IEEE International Symposium on High-P erformance Computer Ar chitectur e (HPCA) . IEEE, 2023, pp. 922–934. [21] M. Kim, D. Lee, J. Seo, and Y . Song, “ Accelerating he operations from key decomposition technique, ” in Advances in Cryptology – CRYPTO 2023: 43r d Annual International Cryptology Confer ence, CRYPT O 2023, Santa Barbara, CA, USA, August 20–24, 2023, Pr oceedings, P art IV . Berlin, Heidelber g: Springer-V erlag, 2023, p. 70–92. [22] K. Han and D. Ki, “Better bootstrapping for approximate homomorphic encryption, ” in T opics in Cryptology – CT -RSA 2020: The Cryptogra- phers’ T rack at the RSA Conference 2020, San F rancisco, CA, USA, F ebruary 24–28, 2020, Pr oceedings . Berlin, Heidelberg: Springer- V erlag, 2020, p. 364–390. [23] K. Shi vdikar, Y . Bao, R. Agra wal, M. Shen, G. Jonatan, E. Mora, A. Ingare, N. Livesay , J. L. Abell ´ AN, J. Kim, A. Joshi, and D. Kaeli, “Gme: Gpu-based microarchitectural extensions to accelerate homo- morphic encryption, ” in Proceedings of the 56th Annual IEEE/ACM International Symposium on Micr oar chitectur e , 2023, p. 670–684. [24] NVIDIA, “NVIDIA Nsight Systems, ” https://dev eloper .nvidia.com/nsight-systems, accessed: 2025-01-06.
Original Paper
Loading high-quality paper...
Comments & Academic Discussion
Loading comments...
Leave a Comment