Reasoning About Variability Models Through Network Analysis
Feature models are widely used to capture the configuration space of software systems. Although automated reasoning has been studied for detecting problematic features and supporting configuration tasks, significantly less attention has been given to…
Authors: Jose Manuel Sanchez, Miguel Angel Olivero, Ruben Heradio
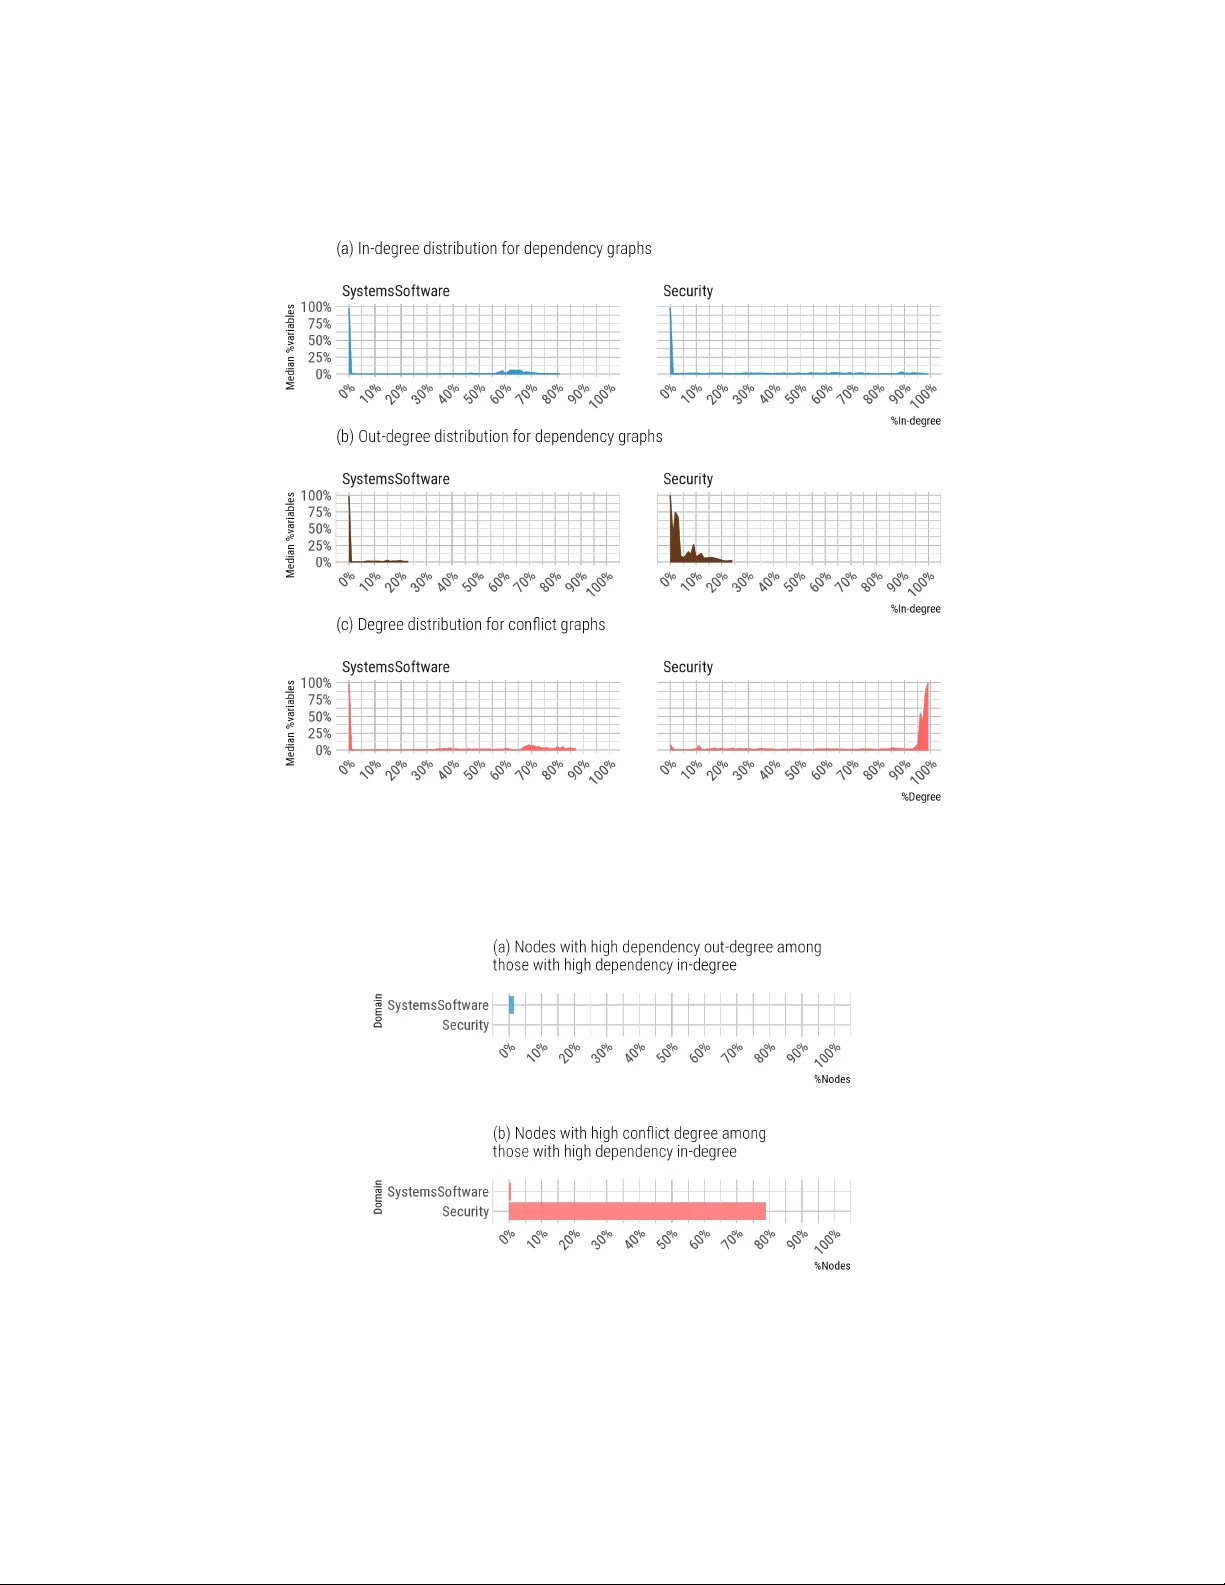
Reasoning Ab out V ariabilit y Mo dels Through Net w ork Analysis Jose Man uel Sanchez 1 [0009 − 0004 − 0436 − 5725] , Miguel Angel Oliv ero 1 [0000 − 0002 − 6627 − 3699] , Rub en Heradio 2 [0000 − 0002 − 7131 − 0482] , Luis Cam b elo 2 [0009 − 0004 − 8160 − 1365] , and Da vid F ernandez-Amoros 2 [0000 − 0003 − 3758 − 0195] 1 Univ ersidad de Sevilla, Sevilla (Spain) {jsanchez7,molivero}@us.es 2 Univ ersidad Nacional de Educación a Distancia (UNED), Madrid (Spain) {rheradio,lcambelo1,david}@issi.uned.es Abstract. F eature models are widely used to capture the configura- tion space of soft ware systems. Although automated reasoning has b een studied for detecting problematic features and supp orting configuration tasks, significantly less attention has b een given to the systematic study of the structural properties of feature mo dels at scale. The approach fills this gap by examining the mo dels’ structure through a netw ork analysis p erspective. W e fo cus on three Research Questions concerning (i) the structural patterns exhibited by these graphs, (ii) the exten t to which suc h patterns v ary across domains and mo del sources, and (iii) the use- fulness of netw ork-based indicators for understanding, maintaining, and ev olving v ariability models. T o answer these questions, w e analyze a dataset of 5,709 mo dels from 20 rep ositories, spanning multiple appli- cation domains and v arying sizes (ranging from 99 to 35,907 v ariables on their Boolean translation). T o do so, graphs of transitive dep endencies and conflicts b et ween features are computed. Our results reveal consis- ten t structural traits (e.g., the predominance of dep endency relations, the presence of highly central features, or characteristic no de degree dis- tributions) as well as notable domain-sp ecific deviations. These findings ease the iden tification of main tenance-relev an t features, opportunities for mo dular decomp osition, and indicators of structural fragility . This approac h provides a scalable, graph-based foundation for the empirical analysis of v ariability models and contributes quantitativ e evidence to supp ort future research on their structure and evolution. Keyw ords: v ariability models · configurable systems · net work analysis 1 In tro duction Ov er the last decades, feature modeling tec hniques hav e b een studied in academia and introduced in industrial con texts. Softwar e Pr o duct Lines (SPLs) are a widely adopted approach to systematically manage v ariabilit y in families of 2 J.M. Sanchez et al. related soft ware products that share assets and features [12]. F e atur e Mo dels (FMs) [14] are a common means to capture this v ariability: they describ e the set of v alid pro ducts as configurations of features that respect a hierarc hy and a set of cross-tree constraints. As rep orted by Berger et al. [7], SPL engineering prac- tices and feature mo deling hav e been adopted in a broad range of domains, in- cluding automotive, energy , en terprise systems, eCommerce, aerospace, defense, and medical devices. They also highlight that feature mo deling is p erceiv ed as v aluable for managing existing v ariabilit y , configuring pro ducts, sp ecifying re- quiremen ts, and deriving pro ducts. The analysis of FMs is crucial to support activities such as maintenance, ev olution, and p erformance optimization [3,5]. Ho wev er, as FMs gro w in size and complexit y , understanding their global structure b ecomes increasingly chal- lenging. This raises the need for complementary analysis techniques that pro vide high-lev el, structural insights into FMs. In this work, we explore the application of network analysis [10] to p erform automated analysis of FMs. The key idea is to view FMs as graphs that enco de tr ansitive str ong relationships b et ween features. Here, “transitive” refers to re- lationships that can b e formed by chaining other relationships, while “strong” indicates that these relationships hold in all configurations that adhere to the feature mo del. T o this end, we rely on a representation in which each feature is a no de, and require/exclude relationships b etw een features are captured as re- quire arcs/conflict edges, resp ectiv ely . These graphs form a data structure that enables reasoning ab out reachabilit y , influence, and structural patterns among features. Building on prior work on automated FM analysis [5,19,20], 4 artifacts are pro vided for each FM: a dep endency gr aph , a c onflict gr aph , and tw o lists con- taining the c or e and de ad features of the model (i.e., features that app ear in ev ery v alid configuration and features that do not app ear in any v alid config- uration, resp ectiv ely). Graph representations abstract aw a y from the syntactic details of the original FMs and preserves information, whic h is highly relev ant to configuration, maintenance, and ev olution tasks. They also enable the appli- cation of a wide range of net work analysis tec hniques to study the structure of FMs. W e systematically apply netw ork analysis to a large corpus of FMs. W e con- sider 5,709 FMs, av ailable as an op en dataset 3 , deriving for each of them its dep endency graph, conflict graph, and sets of core and dead features. On top of these graph-based representations, we compute and analyze structural metrics to c haracterize how real-world FMs are organized. Our goal is to inv estigate which patterns are frequen t across mo dels and what they suggest ab out the robustness, configurabilit y , and maintainabilit y of highly configurable systems. Sp ecifically , this w ork addresses the following research questions: – R Q1: What structural patterns emerge in the dep endency and conflict graphs of real-w orld FMs? 3 https://doi.org/10.5281/zenodo.17790234 Net work Analysis for V ariability Mo dels 3 – R Q2: How do these structural patterns v ary across application domains and mo del sources? – R Q3: How can net work-based indicators derived from these structural pat- terns supp ort practitioners in understanding, main taining, and evolving large FMs? The remainder of this article is structured as follo ws. Section 2 reviews fea- ture mo deling, automated analysis of FMs, and prior work on graph-based and net work-based analyses. Section 3 presents t wo FMs of different sizes to illus- trate the difficulty of understanding large mo dels and to motiv ate the need for net work-based analysis. Section 4 summarizes the process used to obtain the graph represen tations. Section 5 describes the empirical study conducted on 5,709 FMs, detailing the selected netw ork metrics, discussing the results, and summarizing the main findings. Finally , Section 6 outlines the implications of our results and sk etches directions for future work. 2 Bac kground This section recalls basic notions on feature models and automated analysis, in tro duces the semantic relations that underlie strong graphs, and briefly situates our w ork in the context of netw ork analysis applied to FMs. 2.1 F eature mo dels and automated analysis A FM defines a family of pro ducts as configurations of features that satisfy b oth a feature hierarc hy (mandatory and optional features, alternative and or-groups) and a set of constraints. Typical FM analyses include detecting anomalies (e.g., v oid models, dead features, false optional features), counting v alid configurations, and supp orting configuration and testing tasks. A common approac h is to enco de FMs as prop ositional form ulas and utilize SA T or CSP solvers to answer these analysis queries [34]. 2.2 Indirect relations and transitive strong graphs While the dir e ct require and exclude constraints b et ween features are defined, FM seman tics pro duce n umerous additional indir e ct relationships that often go unnoticed. The interpla y of hierarch y , group relations, and cross-tree constrain ts can enforce situations in whic h one feature must alwa ys b e selected if another is chosen, or it can prohibit t w o features from co-o ccurring in an y v alid con- figuration. Understanding these semantic relationships is crucial for managing FMs, as they can highligh t unin tentionally coupled features or rev eal hidden conflicts [5,19,20]. In this w ork, a feature f is said to hav e a str ong dep endency on a feature g if, in every v alid configuration that conforms to the FM, whenev er f is selected, then g is also selected. T w o features f and g are in str ong c onflict if they never app ear together in an y v alid configuration. Note that our definition in v olves 4 J.M. Sanchez et al. tr ansitivity : a strong relationship takes into accoun t chaining intermediate rela- tionships sp ecified in the FM (e.g., if according to the FM, f dep ends on g , and g dep ends on h , then there is a strong dep endency b et w een f and h ). Strong relations can b e organized as graphs. In a dep endency gr aph , no des corresp ond to features and there is a directed arc f → g whenever f strongly dep ends on g . In a c onflict gr aph , no des are again features and there is an undi- rected edge b et ween f and g whenever they are in strong conflict. Throughout the pap er, the term str ong gr aphs refers to b oth dep endency and conflict graphs. T o k eep graphs informative and manageable, trivial or redundant relations are remo ved (e.g., self-lo ops or arcs from every no de to each core feature). Section 4 describ es how the graphs are computed. 2.3 Net work analysis for softw are and FMs Net work analysis pro vides metrics to study graphs that represent complex sys- tems. These metrics hav e b een used in softw are engineering to analyze call graphs, dependency netw orks, or fault propagation, with the aim of identify- ing hotsp ots, critical comp onen ts, or structurally fragile regions. In v ariabilit y mo deling, graph-based representations of FMs hav e b een used to define metrics and assess structural properties, such as commonality and the presence of anomalies. Most existing w ork, how ev er, fo cuses on logical analysis (e.g., satisfiability , anomaly detection), do es not explore structural prop erties, and do es not analyze a large set of FMs [11,47,35]. Bo ender [9] applies graph- based representations to study and analyze the dep endencies b et ween pack ages in real Linux distributions (Debian and Mandriv a) and Eclipse. The dev elop- men t of directed graphs that represent strong dep endencies allows for a struc- tural analysis of soft ware distributions. This wa y , his w ork prop oses a formal mo del of open-source soft ware distributions with metho ds to improv e quality managemen t. Softw are pro duct lines and feature mo dels are mentioned in the conclusions of Bo ender’s study , regarding an op en wa y for the re-use and exten- sion of his results in the field of softw are pro duct lines. In contrast to the mentioned existing studies, this work systematically ap- plies standard netw ork metrics to strong dep endency and conflict graphs deriv ed from a large corpus of real-world FMs. By treating features as no des and strong relations as arcs and edges, we compute structural indicators ov er these graphs and relate them to prop erties of the underlying mo dels and their domains, com- plemen ting traditional logical analyses with a structural p ersp ectiv e. 3 T wo motiv ational examples This section presents tw o examples that illustrate how the complexity of v ari- abilit y analysis changes with the size of the mo dels. W e first use a small excerpt of the corebo ot 4.13 4 FM to illustrate that even the simplest mo dels contain indi- rect relationships that are difficult to identify without the use of strong graphs. A 4 https://www.coreboot.org/ Net work Analysis for V ariability Mo dels 5 second example featuring a larger FM, Linux 2.6.9 X86 64-bit 5 , shows how strong graphs and their asso ciated metrics b ecome essen tial when visual insp ection is no longer practical. 3.1 A tiny FM that hides some subtle indirect relationships Figure 1 sho ws a fragment of FM of corebo ot 4.13 , an op en-source firmw are for computers and em b edded systems, which comes from src/device/Kconfig and deals with v ariability in graphics initialization and framebuffer configuration. Eac h config entry declares a Bo olean feature and its dep endencies, while choice blo c ks express mutually exclusive alternatives, ensuring that exactly one option is selected. 1 c o n f i g H A V E _ V G A _ T E X T _ F R A M E B U F F E R 2 b o o l 3 d e p e n d s o n ! N O _ G F X _ I N I T 4 c o n f i g M A I N B O A R D _ F O R C E _ N A T I V E _ V G A _ I N I T 5 b o o l 6 d e p e n d s o n M A I N B O A R D _ H A S _ N A T I V E _ V G A _ I N I T | | M A I N B O A R D _ H A S _ L I B G F X I N I T 7 c h o i c e 8 p r o m p t " G r a p h i c s i n i t i a l i z a t i o n " 9 c o n f i g M A I N B O A R D _ D O _ N A T I V E _ V G A _ I N I T 10 b o o l " U s e n a t i v e g r a p h i c s i n i t " 11 d e p e n d s o n M A I N B O A R D _ H A S _ N A T I V E _ V G A _ I N I T 12 c o n f i g M A I N B O A R D _ U S E _ L I B G F X I N I T 13 b o o l " U s e l i b g f x i n i t " 14 d e p e n d s o n M A I N B O A R D _ H A S _ L I B G F X I N I T 15 c o n f i g V G A _ R O M _ R U N 16 b o o l " R u n V G A O p t i o n R O M s " 17 d e p e n d s o n P C I & & ! M A I N B O A R D _ F O R C E _ N A T I V E _ V G A _ I N I T 18 c o n f i g N O _ G F X _ I N I T 19 b o o l " N o n e " 20 d e p e n d s o n ! M A I N B O A R D _ F O R C E _ N A T I V E _ V G A _ I N I T 21 e n d c h o i c e 22 c h o i c e 23 p r o m p t " F r a m e b u f f e r m o d e " 24 c o n f i g V G A _ T E X T _ F R A M E B U F F E R 25 b o o l " L e g a c y V G A t e x t m o d e " 26 d e p e n d s o n H A V E _ V G A _ T E X T _ F R A M E B U F F E R 27 c o n f i g V B E _ L I N E A R _ F R A M E B U F F E R 28 b o o l " V E S A f r a m e b u f f e r " 29 d e p e n d s o n H A V E _ V B E _ L I N E A R _ F R A M E B U F F E R 30 e n d c h o i c e Fig. 1. An excerpt from the FM of corebo ot 4.13 . Figure 2 sho ws the strong graphs for Figure 1. In particular, Figure 2.a reveals a non-trivial indirect dep endency b et ween NO_GFX_INIT and HAVE_VBE_ LINEAR_FRAMEBUFFER , whose explanation reads as follo ws: 1. HAVE_VGA_TEXT_FRAMEBUFFER excludes NO_GFX_INIT (Line 3 in Figure 1.); 2. conflicts are symmetric, since f ⇒ g ≡ f ∨ g ≡ g ∨ f ≡ g ⇒ f . Accordingly , NO_GFX_INIT excludes HAVE_VGA_TEXT_FRAMEBUFFER ; 5 https://www.kernel.org/ 6 J.M. Sanchez et al. 3. as VGA_TEXT_FRAMEBUFFER requires HAVE_VGA_TEXT_FRAMEBUFFER (Line 29), disabling HAVE_VGA_TEXT_FRAMEBUFFER produces that VGA_TEXT_FRAMEBUFFER is disabled as w ell; 4. as VGA_TEXT_FRAMEBUFFER is disabled, and the choice in Lines 22-30 has only t wo options, the other option m ust be enabled. So, HAVE_VBE_LINEAR_FRAMEBUFFER m ust b e enabled. (b) Conf lict graph (a) Dependency graph Fig. 2. T ransitive-closure-based strong graphs for the features in Figure 1. The strong graphs also sho w that: – the feature with the highest in-degree (i.e., the most dep ended-upon feature) is HAVE_VBE_LINEAR_FRAMEBUFFER ; – the feature with the highest out-degree (i.e., the one that dep ends on the largest n umber of others) is NO_GFX_INIT ; – NO_GFX_INIT and VBE_LINEAR_FRAMEBUFFER depend on HAVE_VBE_LINEAR_FRAMEBUFFER , ev en though this is not obvious from the original Kconfig snipp et. Net work Analysis for V ariability Mo dels 7 3.2 Structural analysis of a large FM As a representativ e large mo del, w e consider the strong graphs of Linux 2.6.9 X86 64-bit , obtained from translating its Kconfig sp ecification in to prop ositional logic using KConfigReader [32]. The resulting formula con tains 7,400 Bo olean v ari- ables 6 Based on this form ula, we compute the corresp onding strong dep endency and conflict graphs, identifying core and dead features as describ ed in Section 4. Simple net work-based questions can already yield insights; for example: – What percentage of dead and core features does this mo del hav e? In this case, 19.84% of the features are dead and 5.65% are core. – Whic h non-core feature is most required b y others? The non-core feature with the highest in-degree in the dep endency graph is feature k!722 , with an in-degree of 1,432 (it is required, directly or indirectly , by features suc h as 3C359_MODULE , PCI , NET_VENDOR_3COM , etc.). T o gain a more global view of the mo del, we lo ok at aggregate net work metrics and their distributions. Figures 3, 4, and 5 illustrate some of these structural patterns for the Linux 2.6.9 X86 64-bit mo del. Figure 3 sho ws the distribution of no de in-degrees in the dep endency graph. Kno wing which features are required by man y others is useful for impact anal- ysis, since changes in these features are more likely to affect large parts of the configuration space. Most features are hardly required by others (lo w in-degree), while a small n umber of features hav e v ery high in-degree and act as structural h ubs. Random changes in most features are therefore unlikely to impact man y others, whereas mo difications to these hubs may ha ve a disproportionate effect on man y dep enden t features and configurations. Figure 4 relates in-degree and out-degree in the dependency graph. F eatures with many conflicts can b e seen as structurally constrained options whose pres- ence excludes man y alternative configurations. Highly required features tend to ha ve relatively few dep endencies themselves, and no feature is b oth highly re- quired and highly dep enden t at the same time. F eatures on which many others dep end are not, in turn, strongly constrained by large n umbers of prerequisites, whic h suggests a form of structural robustness. Finally , Figure 5 shows the distribution of no de degrees in the conflict graph. Most features are in conflict with relatively few others, and only a small num b er are incompatible with man y alternatives. F rom the point of view of conflicts, selecting a random feature in a configuration is therefore unlikely to exclude a large p ortion of the feature space. The few features with very high conflict degree corresp ond to highly constraining options whose selection drastically reduces the a v ailable configuration c hoices, and they are natural candidates to insp ect when analyzing configurability and p oten tial usability issues in configuration processes. 6 The Bo olean v ariables represent features, along with auxiliary v ariables from the T seitin Bo olean translation [31]. 8 J.M. Sanchez et al. V ery few features are highly required by others Most features are hardly required by others Fig. 3. No de in-degree distribution in the dep endency graph of Linux 2.6.9 X86 64-bit. Most features are required by few others, while a small n umber act as highly required h ubs. Highly required features have few dependencies If there were features in this zone, they would be sensitive to changes to other features (high out-degree) and their potential modification would propagate to many others (high in-degree) Fig. 4. In-degree vs. out-degree in the dep endency graph of Linux 2.6.9 X86 64-bit. Highly required features tend to ha ve few dep endencies, av oiding features that are b oth highly required and highly dep endent. Net work Analysis for V ariability Mo dels 9 V ery few features are highy incompatible with others Most features are compatible with others Fig. 5. No de degree distribution in the conflict graph of Linux 2.6.9 X86 64-bit. Most features hav e few conflicts, while a small num b er of highly constraining features are in conflict with many others. 4 Computing Strong Graphs In this section, the pro cess applied to compute strong graphs is describ ed. Strong graphs are obtained in t wo stages. 4.1 Stage 1: T ranslating FMs into Bo olean form ulas First, FMs are translated in to Bo olean form ulas [3,4,5,15] in Conjunctive Normal F orm (CNF), which is the required input for most Bo olean engines. A CNF is a conjunction of one or more clauses , and eac h clause is a disjunction of liter als , whic h can b e either a v ariable or a negated v ariable. 4.2 Stage 2: Computing strong relationships Once a FM is enco ded as a CNF formula φ , core/dead features and strong dep en- dency/conflict relations are discov ered using the backbone-based Algorithm 1. The b ackb one of a formula is the set of literals with the same truth v alue in all satisfying assignments of a formula [22,29]. Algorithm 1 returns (i) a set B with all core and dead features, and (ii) a hashmap H that, for each configurable feature, records the strong relations it has with other features. In the b eginning, the bac kb one B of the original form ula φ is computed. P ositive literals in B iden tify core features, while the complements of negative literals iden tify dead features. W e then consider all v ariables v that do not ap- p ear in B (i.e., features that are neither core nor dead). F or eac h suc h feature v , we compute the backbone B ′ of the conditioned formula φ ∧ v . Literals in B ′ describ e the consequences of selecting v : p ositiv e literals represent strong de- p endencies from v to the corresponding features, and negativ e literals represent strong conflicts b et ween v and those features. These relations are stored in the hashmap H , whic h is then used to create the string graphs. Since conflicts are 10 J.M. Sanchez et al. Algorithm 1 Extraction of strong dep endencies and conflicts Input : A satisfiable formula φ Output : (i) A set B of all core and dead options; (ii) a hashmap H mapping eac h configurable option to its strong relations 1: B ← Backbone( φ ) 2: H ← ∅ 3: V ← v ariables( φ ) \ v ariables( B ) 4: for v ∈ V do 5: B ′ ← Backbone( φ ∧ v ) 6: H [ v ] ← B ′ 7: remo ve from H rep eated conflict edges 8: return ( B , H ) symmetric, duplicate conflict edges are remov ed at the end (whic h results is con- flicts b eing represented with undirected exclude edges, while dep endencies are represen ted with directed require arcs). W e provide a C++ implemen tation 7 of Algorithm 1, which computes the bac kb one using the iter ative Algorithm 3 describ ed in [22]. Our implementa- tion relies on MiniSat 2.2.0 8 , which is called through the IP ASIR interface 9 for incremen tal SA T solving [2]. 5 Empirical Net w ork Analysis of FMs This section in vestigates the structural prop erties of a dataset with 5,709 FMs from op en-source and anonymized industrial systems. The FMs were originally published in the 20 academic sources summarized in T able 1. Nevertheless, the starting p oin t for building the strong graphs was not the FMs themselves, but rather the Bo olean formulas derived from them by: – Sundermann et al. [46] by using the translator T raV arT ( https://zenodo. org/records/11654486 ) [13]. – Kuiter et al. [32] by using the translators KMax ( https://github.com/ paulgazz/kmax ) [38] and K ConfigReader ( https://github.com/ckaestne/ kconfigreader ) [24]. – F ernandez et al. [16] by using the to ol KconfigSampler ( https://github. com/davidfa71/Sampling- the- Linux- kernel ) [16]. In line with our research questions, we aimed to: (i) characterize common structural patterns across a large num b er of FMs (RQ1); (ii) analyze ho w these patterns v ary across domains and FM sources (RQ2); and (iii) assess to what exten t netw ork-based indicators can supp ort practitioners in understanding and main taining large FMs (RQ3). 7 https://doi.org/10.5281/zenodo.17790234 8 http://minisat.se/MiniSat.html 9 https://github.com/biotomas/ipasir Net work Analysis for V ariability Mo dels 11 T able 1. Number of FMs in the dataset p er academic source. # Ref. URL of the rep ository #FMs 1 [30] https://zenodo.org/records/14884016 3,398 2 [48] https://github.com/IDEA- Research- Group/AMADEUS 1,463 3 [41] https://github.com/TUBS- ISF/soletta- case- study 292 4 [42] https://github.com/TUBS- ISF/SamplingStabiltyVaMoS21_data 248 5 [26] https://github.com/AlexanderKnueppel/is- there- a- mismatch 118 6 [8] https://gsd.uwaterloo.ca/ 116 7 [41] https://github.com/TUBS- ISF/fiasco- case- study 31 8 [36] http://www.splot- research.org/ 10 9 [37] https://gitlab.com/evolutionexplanation/evolutionexplanation 10 10 [39] https://github.com/jeho- oh/Smarch 5 11 [16] https://github.com/davidfa71/Sampling- the- Linux- kernel 5 12 [25] https://github.com/zahrakhoshmanesh/FIDUS 2 13 [1] https://wwwiti.cs.uni- magdeburg.de/iti_db/research/spl- testing/ 2 14 [40] https://wwwiti.cs.uni- magdeburg.de/~jualves/PROFilE/ 2 15 [18] https://github.com/yamizi/FeatureNet/ 2 16 [43] https://github.com/FeatureIDE/FeatureIDE 1 17 [28] https://github.com/FeatureIDE/FeatureIDE 1 18 [21] https://drive.google.com/drive/folders/1xumU6qxBesloq69jOPMbprOaiaOKDq82 1 19 [45] https://github.com/Subaro/SMT- Based- Variability- Analyses- for- FeatureIDE 1 20 [33] https://martinfjohansen.com/FMs2011/spltool/ 1 T otal: 5,709 F or each formula in the dataset, we computed its strong dep endency and strong conflict graphs. Both graphs share the same set of no des, which enables com bined interpretations of dep endency and conflict metrics. W e then computed standard net w ork measures and com bined them with core/dead information. Unless otherwise noted, all analyses were carried out at the level of individual FMs and then aggregated b y domain. 5.1 Step 1: Graphs Analysis F or each FM, w e follow ed the steps b elo w: 1. Graph construction. W e identified the core/dead features and obtained the strong graphs with the pro cedure describ ed in Section 4. 2. Structural characterization (RQ1). Using the igraph 10 library for net- w ork analysis [27], we computed the distributions of no de in-degrees, out- degrees, conflict-degrees, and ratios of require vs. exclude links. 3. Domain-based comparison (RQ2). FMs were group ed by domain. F or eac h group, we computed descriptive statistics (i.e., medians and 95% cov er- age in terv als [23]) together with Sp earman’s ρ to assess asso ciations b etw een structural metrics and FM size. 4. Deriv ation of indicators (R Q3). W e derived indicators related to main- tainabilit y and configurability , fo cusing on highly required and highly con- flicting features. While the dataset cov ers several domains (see T able 2), most FMs fall into t wo categories: systems softwar e (4,215 FMs) and se curity (1,464 FMs). Figure 6 10 https://igraph.org 12 J.M. Sanchez et al. represen ts the FM distribution based on the num b er of v ariables for b oth do- mains. Generally , security mo dels are smaller than systems softw are mo dels. The size of the FM across the whole dataset ranges from 99 v ariables (the smallest FM) to 35,907 v ariables (the largest, which corresp onds to a formula generated with K ConfigReader from Linux version 4.9). The detailed analyses in the follo w- ing subsections, therefore, fo cus on these t wo domains, which together accoun t for the v ast ma jorit y of the corpus. T able 2. Percen tage of core and dead v ariables in the systems p er domain. Domain #FMs Core v ariables Dead v ariables 95% CI Median ρ 95% CI Median ρ Systems software 4,215 0.00%-41.09% 5.30% 0.59 0.00%-42.35% 18.27% 0.41 Security 1,464 0.17%-10.04% 2.31% -0.84 0.00%-98.45% 0.00% 0.58 Finance 13 2.42%-9.51% 2.85% -0.49 0.00%-0.48% 0.00% 0.60 Automotive 5 4.48%-9.91% 9.55% 0.30 0.05%-6.99% 0.05% -0.70 Deep learning 2 0.02%-0.21% 0.11% − 0.04%-1.42% 0.73% − eCommerce 2 0.77%-28.18% 14.47% − 0.00%-0.00% 0.00% − Hardware 2 3.04%-27.84% 15.44% − 0.00%-0.00% 0.00% − Navigation 2 17.18%-41.12% 29.15% − 0.00%-%0.00 0.00% − Business 1 − 0.05 − − 0.00 − Database 1 − 11.97% − − 5.13 − Games 1 − 5.56% − − 0.00% − T ext 1 − 5.11% − − 0.00% − Fig. 6. Distribution of the FMs according to their domain and num b er of v ariables. 5.2 Step 2: Core and dead features across domains T able 2 summarizes the prop ortion of core and dead v ariables p er FM in eac h domain. F or each com bination (domain, v ariable type) we rep ort: (i) the 95% co verage interv al (CI) (i.e., excluding the 2.5% low est and 2.5% highest), (ii) the median percentage across FMs, and (iii) Sp earman’s ρ betw een the p ercen tage and the n umber of v ariables in the FM. F or example, the first ro w indicates that in the systems-softw are domain, 95% of the FMs hav e b et w een 0% and 41.09% of their core v ariables. The median is 5.30%, s o half of these FMs ha ve a core ratio b elow that v alue and half ab ov e. The correlation ρ = 0 . 59 suggests that larger systems-soft ware FMs tend to exhibit a higher prop ortion of core features. F or securit y FMs, core features are relatively scarce (median 2.31%), and the negativ e correlation ( ρ = − 0 . 84 ) indicates that larger FMs in this domain tend Net work Analysis for V ariability Mo dels 13 to hav e even few er core features in p ercentage terms. Con versely , dead features are extremely concentrated in some security FMs (the CI upp er b ound is close to 100%), y et the median is 0%, reflecting a v ery skew ed distribution: man y FMs ha ve virtually no dead features, while a few hav e highly constrained outliers. This contrasts with the systems-softw are domain, where dead features are more common (median 18.27%). T o statistically compare core and dead features, T able 3 rep orts Wilcoxon signed-rank tests per domain. In the systems soft war e domain, FMs tend to con tain significan tly more dead v ariables than core v ariables (mo derate effect size 11 ), whereas in securit y , the difference is not statistically significant. T able 3. Wilcoxon signed-rank test to chec k if the FMs hav e more dead v ariables than core v ariables. Domain Alt. Hyp. ( H a ) p -v alue Stat. sig.? r (effect size) Systems software #Dead > #Core < 2.2e-16 Y es 0.38 Mo derate Security #Dead > #Core 0.5 No 0.04 Negligible Ov erall, these results already suggest that structural b ehavior is far from uniform across domains. 5.3 Step 3: Dep endencies v ersus conflicts T able 4 analyzes the density of strong require and exclude relations. F or each domain, w e normalized the n umber of require arcs and conflict edges b y the n umber of v ariables in the FM form ula. W e again rep ort 95% CIs, medians, and Sp earman’s ρ . T able 4. Prop ortion of require and exclude links relative to the num b er of v ariables in the systems p er domain. Domain #FMs Require arcs Exclude edges 95% CI Median ρ 95% CI Median ρ Systems software 4,215 1.12 × -75.95 × 7.11 × 0.47 0.09 × -49.18 × 2.78 × 0.37 Security 1,464 0.00 × -7.16 × 0.82 × -0.01 0.04 × -259.24 × 62.65 × 0.02 Finance 13 0.58 × -49.46 × 34.67 × 0.92 0.12 × -272.08 × 259.37 × 0.43 Automotive 5 1.28 × -30.92 × 1.32 × -0.40 8.14 × -18.13 × 17.69 × 0.60 Deep learning 2 14.66 × -24.21 × 19.44 × − 5.46 × -14.11 × 9.78 × − eCommerce 2 4.95 × -10.53 × 7.74 × − 0.00 × -0.00 × 0.00 × − Hardware 2 0.22 × -1.16 × 0.69 × − 1.97 × -16.59 × 9.28 × − Navigation 2 0.37 × -4.91 × 2.64 × − 0.23 × -5.17 × 2.70 × − Business 1 − 94.62 × − − 0.00 × − Database 1 − 73.13 × − − 0.00 × − Games 1 − 0.50 × − − 4.22 × − T ext 1 − 3.26 × − − 0.00 × − 11 Effect size was computed as r = Z √ N [17], where Z is the standardized test statistic and N is the sample size. The common interpretation is | r | < 0 . 3 (small effect size), 0 . 3 ≤ | r | < 0 . 5 (mo derate effect), and | r | ≥ 0 . 5 (large effect). 14 J.M. Sanchez et al. In systems softw are, require relations are muc h more common than conflicts. On a verage, there are 7.11 times more require arcs than nodes, compared to 2.78 times more exclude edges. Both of these metrics increase with the size of the FM. In contrast, security FMs shows very dense conflict graphs (median 62.65 × ) and comparativ ely sparse dep endency structures (median 0.82 × ). Wilcoxon tests in T able 5 confirm that: (i) in systems softw are, require arcs are significantly pre- dominan t (large effect size), whereas (ii) in security , exclude edges significantly dominate the require arcs. T able 5. Wilcoxon signed-rank test to chec k if the FMs hav e more require arcs or exclude edges. Domain Alt. Hyp. ( H a ) p -v alue Stat. sig.? r (effect size) Systems software #Excludes < #Requires < 2.2e-16 Y es -0.67 Large Security #Excludes > #Requires < 2.2e-16 Y es 0.87 Large 5.4 Step 4: Degree distributions and hubs T o further understand structural organization, Figure 7 shows degree distribu- tions across FMs. The x -axis represents no de degrees as percentages of other features in the same FM, and the y -axis shows, for each degree v alue, the me- dian p ercen tage of features that exhibit that degree. W e note that a c haracteristic pattern emerges. Most nodes exhibit very low in-degree and conflict degree, while a small fraction of no des accumulates v ery high v alues. F or instance, in the systems-softw are dep endency graphs, there is a pronounced p eak where, on median, around 8% of the no des dep end on more than half of the other features in the FM. Similarly , conflict-degree distributions rev eal that only a small subset of features ha ve conflicts with a large p ortion of the feature space. This confirms the existence of c onfigur ation hubs : features with exceptionally high in-degree (strongly required by many others) and, in some domains, features with exceptionally high conflict degree (highly constraining options). These hubs are p oten tial weak p oin ts: changes or threats affecting them ma y propagate to a large n umber of dep enden t or incompatible options. Figure 8 complements this analysis b y examining ho w high degrees ov erlap. W e consider a degree to b e high when it is at least 10% of the features in a FM (e.g., if a no de is required by more than 10% of the remaining no des, its in-degree is high); this threshold could b e c hanged to adjust the sensitivit y of the analysis. Figure 8.a relates in-degree and out-degree in dep endency graphs. High p er- cen tages in this panel indicate the presence of features in the “warning zone” highligh ted in Figure 4, (i.e., features that are b oth highly required and highly dep enden t). Such features are problematic from a maintainabilit y p erspective, as Net work Analysis for V ariability Mo dels 15 Fig. 7. No de degree distributions across FMs (dep endency in-/out-degree and conflict degree). Fig. 8. Conditional distributions of no des with high degrees (degree ≥ 10% of #no des). 16 J.M. Sanchez et al. they are cen tral in b oth directions: they affect man y others and are themselv es constrained b y many prerequisites. Figure 8.b relates dependency in-degree and conflict degree. F or security FMs, almost 80% of no des with high dep endency in-degree also ha ve high con- flict degree. This indicates that highly required features in these FMs tend to b e largely incompatible with man y alternatives, suggesting limited reuse and fragmen tation into relatively isolated subsystems. These observ ations instan tiate the second pattern mentioned in the moti- v ational discussion in Section 3.2: across FMs, there is a clear tendency for a minorit y of features to act as hubs (in dep endencies and, in some domains, in conflicts), while most features remain structurally p eripheral. 5.5 Discussion The empirical evidence sho ws that strong graph analysis scales to FMs with thousands of features and reveals: (i) stable structural patterns (RQ1), (ii) clear differences across dom ains and FM sources (R Q2), and (iii) practical indicators for sp otting critical features and substructures (RQ3). These findings are not apparen t from the original v ariability artifacts or their raw Boolean enco dings alone, highlighting the additional descriptive insight of a netw ork-based p ersp ec- tiv e for b oth researc hers and practitioners. T aken as a whole, the empirical results outline a coheren t picture of how FMs are organized structurally , which can b e in terpreted in terms of the research questions prop osed in Section 1. R Q1: Structur al p atterns in str ong gr aphs. A cross the 5,709 FMs in our dataset, w e see several recurring structural patterns. First, in systems-soft w are FMs, strong dep endencies are m uc h more frequent than strong conflicts (T able 4), and their density tends to increase with FM size. Second, degree distributions in b oth dep endency and conflict graphs are highly unev en (Figure 7). These results suggest that FMs are not structurally flat or random: they exhibit recognizable, rep eated shap es in their strong graphs. R Q2: V ariation acr oss domains and sour c es. The structural b eha vior of FMs c hanges across domains and FM sources. Systems-softw are FMs (e.g., Linux, BusyBo x, and related systems) ha ve moderate but consisten t prop ortions of core and dead features (T able 2), and larger FMs tend to hav e more core and dead options in a controlled wa y . Their strong graphs are dense in dependencies and comparatively light in conflicts (T able 4). In contrast, man y securit y FMs, whic h are often syn thetically generated from vulnerabilit y repositories, show v ery high conflict densities and v ery skew ed distributions of dead features: most FMs hav e almost no dead features, but a few contain very high p ercen tages. Fig- ure 8 also sho ws that, in security FMs, highly required features often coincide with highly conflicting ones, which may indicate structurally fragile areas where cen tral features are strongly constrained. Smaller domains (finance, automotiv e, na vigation, etc.) show their o wn characteristic profiles, but the low num b er of Net work Analysis for V ariability Mo dels 17 FMs means that we must be careful with strong claims. Consequently , our re- sults do not supp ort single structural pattern that fits all domains, they suggest domain- and source-dep enden t structural tendencies. R Q3: Usefulness of network-b ase d indic ators. The structural indicators derived from strong dep endency and conflict graphs provide a compact wa y to describ e feature-lev el and substructure-level p ositions in the analyzed FMs. While these indicators app ear p oten tially relev an t for maintenance and evolution, such im- plications remain exploratory in our study b ecause we did not directly measure main tenance outcomes. (i) F e atur es with very high dep endency in-de gr e e may indicate structurally cen tral elements that could b ecome maintenance-sensitiv e areas, although this requires v alidation with direct maintainabilit y evidence. (ii) F e atur es with high c onflict de gr e e are c onfigur ational ly r estrictive : selecting them remo ves many alternatives from the configuration space and may create prob- lems during configuration, esp ecially in domains with dense conflict graphs such as security . Finally , (iii) the overlap b etwe en high dep endency and high c onflict degrees (Figure 8) indicates that highly required features in some FMs are often incompatible with many other features, which may b e asso ciated with limited reuse and fragmen tation into relatively isolated subsystems. The observed differences b et ween systems-soft ware and security FMs should also be interpreted in ligh t of differen t domains’ c haracteristics and mo dels’ origin. In our dataset, man y systems-soft ware FMs were derived from man u- ally curated models of system capabilities, whereas many securit y FMs w ere syn thetically generated with computer-assisted procedures from vulnerabilit y rep ositories. Therefore, some of the structural differences may reflect not only domain-sp ecific v ariability but also differences in modeling pro cess and artifact construction. F uture work should compare alternative FMs for the same systems (e.g., manually produced vs. computer-assisted generated) to assess how m uch the observ ed graph prop erties dep end on the mo deling metho dology . 5.6 Threats to v alidity Sev eral factors may affect the v alidity of the rep orted results. Construct v alidit y . Strong relationships represen t only a subset of the re- lations that exist in an FM. Our analysis fo cuses exclusively on strong relation- ships; those seman tic dep endencies and conflicts that hold across every v alid configuration of the FM. While this provides a conserv ative and w ell-defined foundation for analysis, it means w e do not capture w eaker forms of correla- tion or probabilistic asso ciations b et w een features that may o ccur in many (but not all) v alid configurations. This choice trades breadth for rigor: by fo cusing on relations guaranteed to hold universally , we obtain stable, verifiable struc- tural patterns, but we necessarily omit more n uanced relationships that might b e relev ant in certain contexts. A dditionally , the quality of our analysis dep ends critically on the translation from FM to Bo olean formulas. F or FMs expressed in simple v ariability languages suc h as the Universal V ariability L anguage (UVL) [6], where semantics are well- defined and standardized, this translation is straightforw ard and unproblematic. 18 J.M. Sanchez et al. Ho wev er, for Kconfig FMs, which constitute a substantial p ortion of our dataset (Lin ux, Busyb o x, and related systems), the situation is more complex. Despite n umerous efforts to translate Kconfig in to Bo olean logic [8,15,24,44,49], none ha ve ac hieved completeness as they do not fully adhere to the Kconfig syntax, and none hav e b een thoroughly v alidated [15]. Consequently , the Bo olean for- m ulas deriv ed from Kconfig sp ecifications ma y not fully capture the original seman tics, and the strong graphs computed from these formulas may underesti- mate or misrepresen t certain dep endencies and conflicts. In ternal v alidit y . The implementation addresses p oten tial errors from tw o main sources: backbone computation and core/dead option identification ( S 1 ), and graph construction ( S 2 ). T o mitigate S 1 , w e cross-v alidated backbone results using an independent to ol (MiniBones). F or S 2 , we implemen ted a v alidation algorithm 12 that systematically v erifies correctness by testing all core and dead options, and then randomly sampling graph no des to confirm that dep endency and conflict relationships are accurate. The v alidation pro cess w as executed comprehensively across all 5,709 mo dels, testing approximately 5.7 million no des ov er tw o weeks using parallel pro cess- ing. The extensiv e computational effort, examining 1,000 no des p er mo del on high-p erformance hardware, with zero errors detected across all tested arcs and edges provides empirical evidence that the dataset and graph construction are correct. This rigorous v alidation approach significantly strengthens confidence in the accuracy of the subsequen t structural analysis findings. External v alidit y . The dataset is limited to publicly av ailable FMs from sp ecific ecosystems, and some domains are represented b y only a few FMs. As a result, domain-sp ecific observ ations for small groups should b e regarded as indicativ e rather than conclusive. Conclusion v alidit y . Our statistical conclusions dep end on appropriate analysis metho ds and sound interpretation of results. Several factors could affect the v alidit y of our conclusions. First, structural metrics dep end on FM size; we address this by computing correlations b etw een metrics and FM size to account for size effects. Second, FMs from the same pro ject may not b e fully indep endent, p oten tially leading to inflated statistical significance. T o mitigate this, we used non-parametric statistical tests (Sp earman’s ρ and Wilco xon signed-rank tests) that make minimal assumptions ab out data distribution. Third, w e rep ort effect sizes alongside p-v alues to assess practical significance. Finally , different FM-to- Bo olean translators ma y pro duce different results, introducing v ariation in graph metrics. F urther replications on broader datasets would strengthen confidence in our conclusions. 6 Conclusions This work describ es how to create strong graphs from v ariabilit y mo dels and demonstrates that these graphs provide a foundation for understanding their 12 The v alidation algorithm is a v ailable at https://doi.org/10.5281/zenodo. 17790233 Net work Analysis for V ariability Mo dels 19 structural organization. By analyzing 5,709 FMs across different domains this study establishes net work analysis as a viable and insightful complemen t to logical reasoning in v ariability mo deling, enabling practitioners and researchers to systematically understand how v ariability is organized across domains. W e rev eal b oth universal structural patterns and domain-sp ecific asp ects. The fol- lo wing paragraphs outline the main adv an tages of strong graphs that this pap er emphasizes: Strong graphs enable fine-grained feature analysis . They reveal subtle relationships arising from the interpla y of constraints, surfacing hidden dep en- dencies and conflicts that manual insp ection misses. Strong graphs quantify each feature’s role: how many others dep end on it, how man y it dep ends on, and how man y it conflicts with. This supp orts targeted impact analysis and helps practi- tioners prioritize testing and co de review efforts. Strong graphs enable holistic FM assessmen t . At the system lev el, they rev eal whether a FM exhibits structural robustness, where highly required fea- tures hav e few dep endencies, or fragility , where central features are b oth highly required and highly dependent. Strong graphs also exp ose whether a system is compact or fragmen ted into isolated subsystems with limited reuse. Strong graphs enable empirical characterization across domains . Systems soft ware FMs exhibit a dep endency-dominated organization with robust h ub-and-sp ok e patterns. Security FMs, by con trast, sometimes hav e extremely dense conflict graphs and are fragmented in to subsystems. These domain-sp ecific patterns reflect b oth problem constrain ts and engineering practices, helping prac- titioners b enc hmark their models and adopt appropriate refactoring strategies. F uture wor k includes analyzing similarities and differences of softw are systems b eing describ ed as a FM, either man ually by examining their features or auto- matically (e.g., considering their requiremen ts). Practical implications . Configuration to ol developers can leverage degree- based metrics for in telligent user guidance. Maintainers can identify refactoring priorities b y lo cating features in the structural “warning zones” (Figures 4 and 5). T esting practitioners can fo cus their efforts on high-impact features through impact-a ware prioritization. Materials In line with op en science principles, the softw are artifacts needed to replicate our experimental v alidation in Section 5 are a v ailable in the follo wing public rep ository: https://doi.org/10.5281/zenodo.17790233 A ckno wledgmen ts. This work is funded by FEDER/Spanish Ministry of Science, Inno v ation and Universities (MCIN)/Agencia Estatal de In vestigacion (AEI) under gran t codes COSY (PID2022-142043NB-I00) and Data-PL (PID2022-138486OB-I00), and by Junta de Andalucía under grant co de SENSOLIVE (PLSQ_00162). Disclosure of Interests. The authors hav e no comp eting interests to declare that are relev an t to the conten t of this article. 20 J.M. Sanchez et al. References 1. Al-Ha jja ji, M., Thüm, T., Lo c hau, M., Meinick e, J., Saake, G.: Effective pro duct- line testing using similarity-based product prioritization. Softw are & Systems Mo d- eling 18 (1), 499–521 (2019). https://doi.org/0.1007/s10270- 016- 0569- 2 2. Baly o, T., Biere, A., Iser, M., Sinz, C.: SA T Race 2015. Artificial Intelligence 241 , 45–65 (2016). https://doi.org/10.1016/j.artint.2016.08.007 3. Batory , D., Benavides, D., Ruiz-Cortes, A.: Automated analysis of feature mo dels: c hallenges ahead. Communications of the A CM 49 (12), 45–47 (2006). https:// doi.org/10.1145/1183236.1183264 4. Batory , D.S.: F eature mo dels, grammars, and prop ositional formulas. In: 9th Soft ware Pro duct Line Conference (SPLC). pp. 7–20. Rennes, F rance (2005). https://doi.org/10.1007/11554844_3 5. Bena vides, D., Segura, S., Ruiz-Cortés, A.: Automated analysis of feature models 20 years later: A literature review. Information systems 35 (6), 615–636 (2010). https://doi.org/10.1016/j.is.2010.01.001 6. Bena vides, D., Sundermann, C., F eich tinger, K., Galindo, J.A., Rabiser, R., Thüm, T.: Uvl: F eature mo delling with the universal v ariability language. Journal of Sys- tems and Softw are 225 , 112326 (2025). https://doi.org/https://doi.org/10. 1016/j.jss.2024.112326 , https://www.sciencedirect.com/science/article/ pii/S0164121224003704 7. Berger, T., Rublack, R., Nair, D., Atlee, J.M., Bec k er, M., Czarnecki, K., Wą- so wski, A.: A survey of v ariabilit y mo deling in industrial practice. In: Pro ceedings of the 7th In ternational W orkshop on V ariability Mo delling of Softw are-intensiv e Systems. pp. 1–8 (2013). https://doi.org/10.1145/2430502.2430513 8. Berger, T., She, S., Lotufo, R., W asowski, A., Czarnecki, K.: A Study of V ariability Mo dels and Languages in the Systems Softw are Domain. IEEE T ransactions on Soft ware Engineering 39 (12), 1611–1640 (2013). https://doi.org/10.1109/TSE. 2013.34 9. Bo ender, J.: A formal study of F ree Soft ware Distributions. Ph.D. thesis, Univ ersité P aris-Diderot (2011), https://www.mancoosi.org/papers/phd- boender.pdf 10. Brandes, U.: Net work analysis: methodological foundations, vol. 3418. Springer Science & Business Media (2005). https://doi.org/10.1007/b106453 11. Castro, T., T eixeira, L., Alves, V., Ap el, S., Cordy , M., Gheyi, R.: A for- mal framew ork of soft ware pro duct line analyses. ACM T rans. Softw. Eng. Metho dol. 30 (3) (Apr 2021). https://doi.org/10.1145/3442389 , https://doi. org/10.1145/3442389 12. Clemen ts, P ., Northrop, L.: Softw are Pro duct Lines: Practices and Patterns. SEI Series in Softw are Engineering, Addison-W esley , Boston, MA, USA (2002) 13. F eic htinger, K., Stöbic h, J., Romano, D., Rabiser, R.: TRA V AR T: An Approach for T ransforming V ariability Models. In: International W orking Conference on V ari- abilit y Mo delling of Soft ware-In tensive Systems (V aMoS). pp. 1–10. Krems, Austria (2021). https://doi.org/10.1145/3442391.3442400 14. F elfernig, A., F alkner, A., Benavides, D.: F eature Mo dels: AI-Driven Design, Anal- ysis and Applications. Springer Nature (2024) 15. F ernandez-Amoros, D., Heradio, R., Mayr-Dorn, C., Egyed, A.: A Kconfig trans- lation to logic with one-wa y v alidation system. In: 23rd In ternational Systems and Soft ware Product Line Conference (SPLC). pp. 303–308. P aris, F rance (2019). https://doi.org/10.1145/3336294.3336313 Net work Analysis for V ariability Mo dels 21 16. F ernandez-Amoros, D., Heradio, R., Mayr-Dorn, C., Egy ed, A.: Scalable Sam- pling of Highly-Configurable Systems: Generating Random Instances of the Linux Kernel. In: IEEE/ACM International Conference on Automated Softw are Engi- neering (ASE). pp. 1–12. Ro c hester, MI, USA (2023). https://doi.org/10.1145/ 3551349.3556899 17. Field, A., Miles, J., Field, Z.: Discov ering Statistics Using R. SAGE Publications Ltd (2012) 18. Ghamizi, S., Cordy , M., Papadakis, M., T raon, Y.L.: Automated search for con- figurations of conv olutional neural net work arc hitectures. In: Int. Systems and Soft ware Pro duct Line Conference (SPLC). p. 119–130. Paris, F rance (2019). https://doi.org/10.1145/3336294.3336306 19. Heradio, R., Perez-Morago, H., Alferez, M., F ernandez-Amoros, D., Alferez, G.H.: Augmen ting measure sensitivity to detect essential, disp ensable and highly incom- patible features in mass customization. Europ ean Journal of Op erational Researc h 248 (3), 1066–1077 (2016). https://doi.org/10.1016/j.ejor.2015.08.005 20. Heradio-Gil, R., F ernández-Amorós, D., Cerrada, J.A., Cerrada, C.: Supp orting commonalit y-based analysis of softw are pro duct lines. IET softw are 5 (6), 496–509 (2011). https://doi.org/10.1049/iet- sen.2010.0022 21. Hierons, R.M., Li, M., Liu, X., P arejo, J.A., Segura, S., Y ao, X.: Many-ob jectiv e test suite generation for soft ware prod uct lines. ACM T ransactions on Softw are Engineering and Metho dology (TOSEM) 29 (1), 1–46 (2020) 22. Janota, M., Lynce, I., Marques-Silv a, J.: Algorithms for computing backbones of prop ositional formulae. AI Communications 28 (2), 161–177 (2015). https://doi. org/10.3233/AIC- 140640 23. Kaplan, D.: Statistical Mo deling: A F resh Approach. Pro ject Mosaic (2012) 24. Kästner, C.: Differential T esting for V ariational Analyses: Exp erience from De- v eloping KConfigReader. T ech. rep., Carnegie Mellon Universit y (2017), https: 25. Khoshmanesh, S., Lutz, R.R.: Lev eraging feature similarity for earlier detection of un wan ted feature in teractions in evolving soft ware pro duct lines. In: International Conference on Similarity Search and Applications (SISAP). pp. 293–307. Springer (2019). https://doi.org/10.1007/978- 3- 030- 32047- 8_2 26. Kn üpp el, A., Thüm, T., Mennick e, S., Meinick e, J., Schaefer, I.: Is there a mis- matc h b et ween real-w orld feature mo dels and pro duct-line research? In: Pro ceed- ings of the 2017 11th Joint Meeting on F oundations of Softw are Engineering. p. 291–302. ESEC/FSE 2017, Asso ciation for Computing Machinery , New Y ork, NY, USA (2017). https://doi.org/10.1145/3106237.3106252 , https://doi.org/10. 1145/3106237.3106252 27. K olaczyk, E.D., Csárdi, G.: Statistical Analysis of Netw ork Data with R. Springer (2020) 28. K ow al, M., Ananiev a, S., Thüm, T.: Explaining anomalies in feature mo dels. ACM SIGPLAN Notices 52 (3), 132–143 (2016). https://doi.org/10.1145/3093335. 29932 29. Krieter, S., Thüm, T., Sch ulze, S., Schröter, R., Saake, G.: Propagating configura- tion decisions with mo dal implication graphs. In: 40th International Conference on Soft ware Engineering (ICSE). pp. 898–909. Asso ciation for Computing Machinery , Gothen burg, Sweden (2018). https://doi.org/10.1145/3180155.3180159 30. Kuiter, E., Heß, T., Sundermann, C., Krieter, S., Thüm, T., Saake, G.: How easy is sat-based analysis of a feature mo del? In: 18th International W orking Confer- ence on V ariability Mo delling of Softw are-Intensiv e Systems (V aMoS). pp. 149– 22 J.M. Sanchez et al. 151. A CM, Bern, Switzerland (F eb 2024). https://doi.org/10.1145/3634713. 3634733 , https://doi.org/10.1145/3634713.3634733 31. Kuiter, E., Krieter, S., Sundermann, C., Thüm, T., Saake, G.: T seitin or not T seitin? The Impact of CNF T ransformations on F eature-Mo del Analyses. In: IEEE/A CM International Conference on Automated Softw are Engineering (ASE). pp. 1–13 (2023). https://doi.org/10.1145/3551349.3556938 32. Kuiter, E., Sundermann, C., Thüm, T., Heß, T., Krieter, S., Saake, G.: How Con- figurable is the Linux Kernel? Analyzing T wo Decades of F eature-Mo del History . A CM T rans. Soft w. Eng. Metho dol. (2025). https://doi.org/10.1145/3764666 33. Lau, S.Q.: Domain Analysis of E-Commerce Systems Using F eature-Based Mo del T emplates. Master’s thesis, Universit y of W aterlo o, Electrical and Computer En- gineering (2006), https://tinyurl.com/8essmk5e , master’s thesis 34. Liang, J.H., Ganesh, V., Czarnecki, K., Raman, V.: SA T-based analysis of large real-w orld feature mo dels is easy. In: International Conference on Softw are Product Line (SPLC. pp. 91–100. Nashville, TN, USA (2015). https://doi.org/10.1145/ 2791060.279107 35. Martinez, J., Ziadi, T., Mazo, R., Bissyandé, T.F., Klein, J., T raon, Y.L.: F eature relations graphs: A visualisation paradigm for feature constraints in soft ware prod- uct lines. In: 2014 Second IEEE W orking Conference on Softw are Visualization. pp. 50–59 (2014). https://doi.org/10.1109/VISSOFT.2014.18 36. Mendonca, M., Branco, M., Cow an, D.: S.p.l.o.t.: soft ware pro duct lines on- line to ols. In: Pro ceedings of the 24th ACM SIGPLAN Conference Compan- ion on Ob ject Oriented Programming Systems Languages and Applications. p. 761–762. OOPSLA ’09, Asso ciation for Computing Mac hinery , New Y ork, NY, USA (2009). https://doi.org/10.1145/1639950.1640002 , https://doi.org/10. 1145/1639950.1640002 37. Niek e, M., Mauro, J., Seidl, C., Thüm, T., Y u, I.C., F ranzke, F.: Anomaly analyses for feature-model ev olution. SIGPLAN Not. 53 (9), 188–201 (Apr 2020). https://doi.org/10.1145/3393934.3278123 , https://doi.org/10.1145/ 3393934.3278123 38. Oh, J., Batory , D., Heule, M.J., My ers, M., Gazzillo, P .: Uniform Sampling from Kconfig F eature Mo dels. T ech. rep., The Universit y of T exas at Austin, Depart- men t of Computer Science (2019), https://apps.cs.utexas.edu/apps/sites/ default/files/tech_reports/2018Kconfig_0.pdf 39. Oh, J., Gazzillo, P ., Batory , D., Heule, M., Myers, M.: Scalable uniform sampling for real-world softw are pro duct lines. T ech. Rep. TR-20-01, Universit y of T exas at Austin, Departmen t of Computer Science (Jun 13 2020), https://apps.cs. utexas.edu/apps/tech- reports/192690 , technical Rep ort, 13 pages 40. P ereira, J.A., Matuszyk, P ., Krieter, S., Spiliop oulou, M., Saake, G.: A feature- based p ersonalized recommender system for pro duct-line configuration. In: Pro- ceedings of the 2016 ACM SIGPLAN International Conference on Generative Pro- gramming: Concepts and Exp eriences. p. 120–131. GPCE 2016, Asso ciation for Computing Machinery , New Y ork, NY, USA (2016). https://doi.org/10.1145/ 2993236.2993249 , https://doi.org/10.1145/2993236.2993249 41. P ett, T., Heß, T., Krieter, S., Thüm, T., Sc haefer, I.: Contin uous t-wise cov erage. In: Pro ceedings of the 27th ACM International Systems and Softw are Product Line Conference - V olume A. p. 87–98. SPLC ’23, Association for Computing Mac hin- ery , New Y ork, NY, USA (2023). https://doi.org/10.1145/3579027.3608980 , https://doi.org/10.1145/3579027.3608980 Net work Analysis for V ariability Mo dels 23 42. P ett, T., Krieter, S., Runge, T., Thüm, T., Lochau, M., Sc haefer, I.: Stabilit y of product-line samplingin con tinuous in tegration. In: In t. W orking Conference on V ariability Mo delling of Softw are-Intensiv e Systems (V aMoS). Krems, Austria (2021). https://doi.org/10.1145/3442391.3442410 43. Sc hulze, S., Thüm, T., Kuhlemann, M., Saak e, G.: V ariant-preserving refactoring in feature-orien ted soft ware pro duct lines. In: In ternational W orkshop on V ariability Mo deling of Softw are-Intensiv e Systems (V aMoS). pp. 73–81. Leipzig, Germany (2012). https://doi.org/10.1145/2110147.2110156 44. Sincero, J., T artler, R., Lohmann, D., Schröder-Preikschat, W.: Efficient extraction and analysis of prepro cessor-based v ariabi lit y . In: Int. Conference on Generative Programming and Comp onent Engineering (GPCE). p. 33–42 (2010). https:// doi.org/10.1145/1868294.1868300 45. Sprey , J., Sundermann, C., Krieter, S., Nieke, M., Mauro, J., Thüm, T., Schaefer, I.: SMT-based v ariability analyses in F eatureIDE. In: International W orking Con- ference on V ariability Mo delling of Softw are-Intensiv e Systems (V aMoS). pp. 1–9. Magdeburg, Germany (2020). https://doi.org/10.1145/3377024.3377036 46. Sundermann, C., Brancaccio, V.F., Kuiter, E., Krieter, S., Heß, T., Thüm, T.: Col- lecting F eature Mo dels from the Literature: A Comprehensiv e Dataset for Bench- marking. In: ACM International Systems and Softw are Pro duct Line Conference (SPLC). p. 54–65 (2024). https://doi.org/10.1145/3646548.3672590 47. Th üm, T., Ap el, S., Kästner, C., Schaefer, I., Saake, G.: A classification and survey of analysis strategies for softw are pro duct lines. ACM Comput. Surv. 47 (1) (Jun 2014). https://doi.org/10.1145/2580950 , https://doi.org/10.1145/2580950 48. V arela-V aca, A.J., Gasca, R.M., Carmona-F ombella, J.A., Gómez-Lóp ez, M.T.: AMADEUS: tow ards the AutoMAteD secUrit y teSting. In: ACM Conference on Systems and Softw are Product Line (SPLC) (2020). https://doi.org/10.1145/ 3382025.3414952 49. Y aman, K.B., Wittler, J.W., Gerking, C.: Kfeature: Rendering the Kconfig Sys- tem in to F eature Mo dels. In: In t. W orking Conference on V ariability Mo delling of Soft ware-In tensive Systems (V aMoS). p. 1–5 (2024). https://doi.org/10.1145/ 3634713.3634731
Original Paper
Loading high-quality paper...
Comments & Academic Discussion
Loading comments...
Leave a Comment