AgriPath: A Systematic Exploration of Architectural Trade-offs for Crop Disease Classification
Reliable crop disease detection requires models that perform consistently across diverse acquisition conditions, yet existing evaluations often focus on single architectural families or lab-generated datasets. This work presents a systematic empirica…
Authors: Hamza Mooraj, George Pantazopoulos, Aless
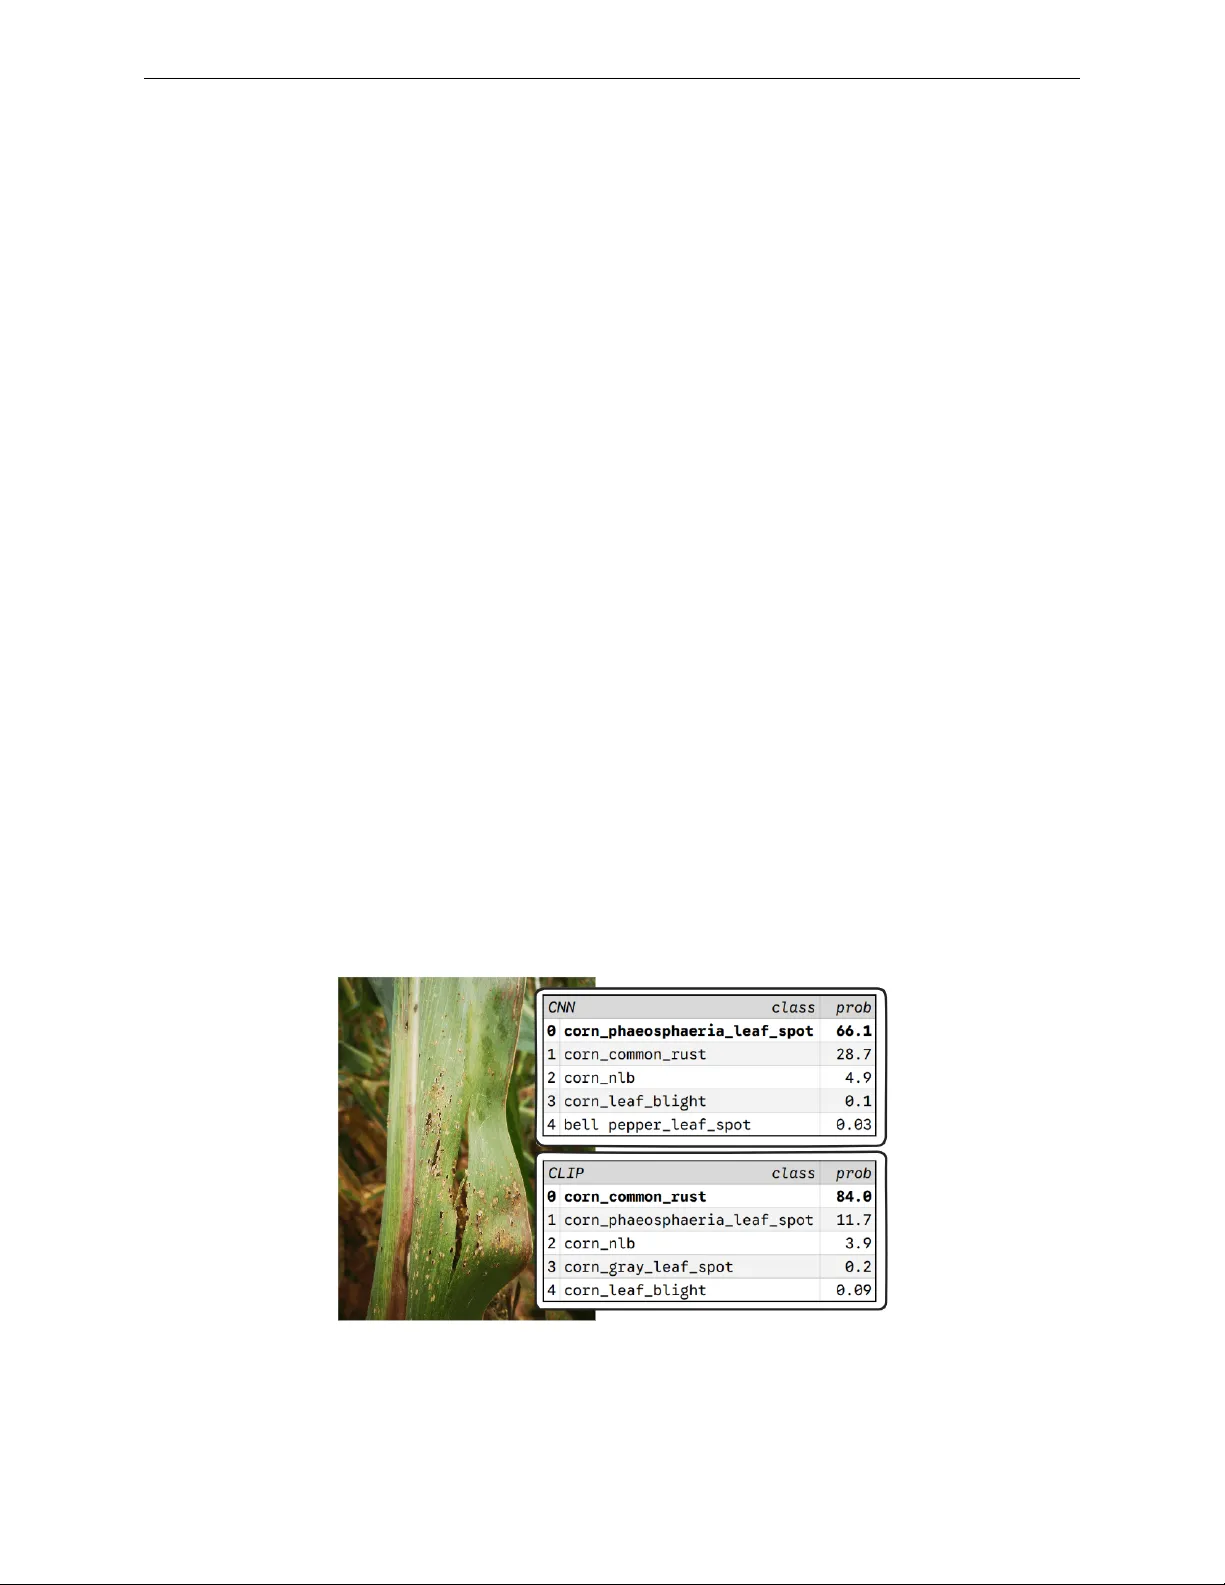
AgriP ath: A Systematic Explo ration of Architectural T rade- offs fo r Crop Disease Classification Hamza Mo ora j hhmo or aj@gmail.c om Scho ol of Mathematic al and Computer Scienc es Heriot-W att University George P antazopoulos gmp2000@hw.ac.uk Scho ol of Mathematic al and Computer Scienc es Heriot-W att University Alessandro Suglia asuglia@e d.ac.uk Institute for L anguage, Co gnition and Computation, Scho ol of Informatics University of Edinbur gh Abstract Reliable crop disease detection requires models that perform consisten tly across div erse acquisition conditions, y et existing ev aluations often focus on single architectural families or lab-generated datasets. This work presents a systematic empirical comparison of three mo del paradigms for fine-grained crop disease classification: Con volutional Neural Net- w orks (CNNs), con trastive Vision–Language Mo dels (VLMs), and generativ e VLMs. T o enable con trolled analysis of domain effects, we introduce A griPath-LF16 , a benchmark of 111k images spanning 16 crops and 41 diseases with explicit separation b etw een lab oratory and field imagery , alongside a balanced 30k subset for standardised training and ev alua- tion. W e train and ev aluate all mo dels under unified protocols across full, lab-only , and field-only training regimes using macro-F1 and P arse Success Rate (PSR) to account for generativ e reliability . The results reveal distinct p erformance profiles: CNNs ac hieve the highest accuracy on lab imagery but exhibit pronounced degradation under domain shift; con trastive VLMs pro vide a robust and parameter-efficien t alternativ e with competitive cross-domain p erformance; generative VLMs demonstrate the strongest resilience to distri- butional v ariation, alb eit with additional failure mo des stemming from free-text generation. These findings highligh t that arc hitectural choice should be guided by deploymen t con text rather than aggregate accuracy alone. 1 Intro duction A ccurate crop disease detection is critical for mitigating yield loss and supp orting fo o d security under in- creasingly v ariable en vironmental conditions. While automated systems can scale diagnostic support, their p erformance and reliabilit y dep end on the con text of deploymen t. Understanding how differen t mo del archi- tectures b eha ve in a v ariety of agricultural contexts remains essential for deplo ying computer vision systems in this field. Despite progress, most ev aluations focus on narro w arc hitectural families or curated lab imagery . Conv o- lutional Neural Net works (CNNs) (He et al., 2015), con trastive Vision-Language Models (VLMs) (Radford et al., 2021), and generative VLMs (Bai et al., 2025) possess distinct inductive biases and pre-training regimes, y et their comparative p erformance in complex field en vironments remains underexplored. F urthermore, ex- isting datasets are frequently crop-specific, domain-imbalanced, and often lack explicit separation b et ween acquisition domains (lab and field). This lac k of granularit y obscures whether p erformance reflects gen uine visual understanding or domain-sp ecific ov erfitting, complicating the ev aluation of deploymen t trade-offs. 1 This work pro vides a systematic empirical study of mo del arc hitectures for fine-grained crop disease classi- fication. The primary contributions are: (1) A griPath-LF16: A domain-aw are b enchmark featuring 111k images spanning 16 crops and 41 diseases with explicit separation b et ween lab and field acquisition domains. A balanced 30k subset is constructed to supp ort controlled training and ev aluation. The dataset is publicly released to facilitate repro ducible researc h 1 . (2) Multi-Par adigm Comp arison: A unified comparison of CNNs, con trastiv e VLMs, and generativ e VLMs is conducted under a shared exp erimen tal proto col, incorp orating a metric suite of macro-F1 across domains and Parse Success Rate (PSR) to enable direct comparison b etw een deterministic classifiers and free-text generativ e mo dels. (3) Deployment Context A nalysis: Mo del p erformance is ev aluated under domain-focused training regimes to c haracterise robustness, in-domain p erformance, and cross-domain transfer. The analysis highlights distinct p erformance profiles, clarifying which architectures b est suit sp ecific agricultural deploymen t contexts. 2 Related W ork A dv ances in computer vision hav e enabled widespread use of deep learning for image recognition, ob ject detection, and segmen tation across v arious domains. This section surveys prior datasets for crop disease classification, the implications of different computer vision architectures in this task, and outlines the re- maining limitations that motiv ate this study . 2.1 Datasets fo r Crop Disease Classification Public datasets for plan t disease detection remain limited in scale, en vironmental diversit y , and domain co verage. The widely used PlantVillage dataset in tro duced by Hughes & Salathe (2016) contains 54,306 images across 14 crops and 38 diseases but is almost entirely comp osed of lab-captured images with uniform bac kgrounds, restricting its suitabilit y for ev aluating models under real-world conditions. PlantDoc (Singh et al., 2020) pro vides field-based imagery but at a substantially smaller scale (2,922 samples), limiting its utilit y for training high-capacity mo dels. Other datasets suc h as Plan t P athology 2021 (Thapa et al., 2021) and CornNLB (Wiesner-Hanks & Brahimi, 2019) offer high-quality images but focus narrowly on specific crops and disease categories. Collectiv ely , existing resources exhibit three limitations: (i) strong bias to ward lab imagery , (ii) restricted crop and disease diversit y , and (iii) insufficient paired lab–field cov erage for assessing robustness under distributional shift. T o address these gaps, this w ork introduces AgriP ath-LF16, a larger-scale benchmark spanning 16 crops and 41 diseases with explicit separation b etw een lab and field imagery , enabling controlled analysis of p erformance across heterogeneous deploymen t contexts. 2.2 CNN-Based App roaches CNNs hav e long b een the dominant approac h for plan t disease classification due to their strong inductiv e biases for lo cal spatial pattern extraction (He et al., 2015). Prior studies demonstrate high p erformance wh en training and ev aluation occur within the same domain: for example, Islam et al. (2023) rep ort a 98.99% accuracy for ResNet-50 on a PlantVillage subset, and similar lab-based results are found across rice and cotton datasets in K.M. et al. (2023) and Hassan et al. (2022). How ever, several w orks highlight sev ere degradation under distribution shift. Mohan ty et al. (2016) sho w accuracy falling to just ab o ve 31% when Plan tVillage-trained mo dels were tested on field images. These findings indicate that CNNs tend to learn represen tations tightly coupled to their training distribution, resulting in p erformance v ariation under heterogeneous acquisition conditions. This trade-off b et w een p eak in-domain accuracy and cross-context reliability motiv ates a controlled comparison against architectures 1 https://huggingface.co/datasets/hamzamooraj99/AgriPath- LF16- 30k 2 with broader pre-training regimes. A ccordingly , this work ev aluates CNNs alongside contrastiv e and gener- ativ e vision–language mo dels under unified proto cols to c haracterise their relative strengths across div erse deplo yment contexts. 2.3 Vision–Language Models fo r Agricultural T asks Vision–Language Models (VLMs) com bine large-scale visual and textual pre-training, enabling mo dels to align image represen tations with language-conditioned outputs (Radford et al., 2021). Their application to crop disease detection remains relatively recen t. The VLCD framework (Zhou et al., 2024) integrates visual features with textual disease descriptions, reporting promising results on grap e leaf diseases, although its single-crop fo cus limits broader generalisability . More recen t w ork, such as AgroGPT (A wais et al., 2024), extends m ultimo dal LLMs tow ard expert-style reasoning and visual question answering (VQA) in agricultural con texts through the AgroEv als b enc hmark, emphasising con versational capabilit y and advisory in teraction. How ever, their primary fo cus do es not lie in fine-grained classification across diverse crops and acquisition conditions. Emerging b enc hmarks suc h as MIRA GE, in tro duced b y Dongre et al. (2025), ev aluate VLMs on information-seeking b ehaviour and m ultimo dal dialogue with agricultural experts. Similar to AgroGPT, suc h benchmarks presupp ose that mo dels p ossess reliable visual understanding. T o address these limitations, this work provides a unified empirical comparison of mo del arc hitectures under v arious training and ev aluation regimes. By examining performance across acquisition con texts, it assesses whether the visual capabilities assumed in advisory and conv ersational b enchmarks translate into reliable fine-grained classification under heterogeneous deploymen t conditions. 3 Building VLMs for Crop Disease Classification 3.1 Dataset This study introduces AgriPath-LF16, a large-scale dataset containing 111,307 images across 16 crops, 41 diseases, and 65 crop–disease pairs (T able 3). The dataset spans t wo acquisition domains: con trolled lab o- ratory conditions and natural field en vironments. Lab images exhibit uniform backgrounds and consistent ligh ting, whereas field images contain cluttered scenes and v ariable conditions (Figure 1). Figure 1: Example of source difference in AgriP ath-LF16. Left : Lab-sourced image of T omato with Bacterial Sp ot. Righ t: Field-sourced image of the same disease, illustrating background clutter and ligh ting v ariation. The full dataset exhibits class im balance and unev en domain representation, with some crop–disease pairs dominated by a single acquisition source. This im balance complicates controlled ev aluation of robustness under domain shift. T o mitigate imbalance, a balanced subset, AgriP ath-LF16-30k, w as constructed via class-preserving do wn- sampling. The subset contains 28,482 images, retains all 65 crop–disease pairs, and follo ws an 80/10/10 3 train–v alidation–test split. Balancing prioritised equitable lab–field represen tation within eac h class where data p ermitted. F ull downsampling rules are provided in Section A.2. Figure 2: Class and source distribution of AgriP ath-LF16-30k across 65 crop-disease pairs. Blue refers to lab-based samples and orange refers to field-based samples Figure 2 illustrates the distribution of AgriPath-LF16-30k across 65 crop–disease pairs, revealing a substan- tially flattened class profile. Although minor im balance persists due to data av ailability , the subset a voids the sev ere long-tailed skew typical of agricultural datasets, enabling more reliable cross-class and cross-domain ev aluation. The figure also shows that some classes remain dominated by lab imagery due to limited field data. This re- flects practical constrain ts in real-w orld data collection rather than a deliberate design c hoice. Retaining this im balance allows robustness to acquisition conditions to b e ev aluated under realistic deploymen t scenarios. AgriP ath-LF16-30k provides a domain-a ware benchmark for ev aluating p erformance, robustness, and gen- eralisation across CNNs, con trastiv e VLMs, and generative VLMs under b oth con trolled and in-the-wild conditions. 3.2 CNN Baseline A ResNet-50 mo del pre-trained on the ImageNet dataset is used to create the CNN baseline. All backbone la yers were initialised with ImageNet weigh ts; following previous w ork on using CNN for classification tasks, early la y ers w ere frozen, while only the final residual blo ck group and a newly initialised classification head w ere fine-tuned (He et al., 2015). T o identify an effective configuration, a small grid of nine experiments w as conducted, v arying batc h size (16, 32, 64) and learning rate ( 1 × 10 − 4 , 2 × 10 − 4 , 5 × 10 − 4 ). Each configuration w as trained under three regimes: (a) using the full training set containing b oth lab and field images, (b) using only lab images, and (c) using only field images. This design provides a consisten t set of CNN baselines for assessing in-domain p erformance as w ell as robustness under b oth mo derate and extreme forms of distributional shift. Of the 9 exp erimen ts, the exp eriment with the low est v alidation loss was selected for analysis. 3.3 Contrastive VLM Exp eriments Con trastive VLMs emplo y Vision T ransformer (ViT) backbones pretrained via image–text alignmen t ob- jectiv es and p erform inference ov er a fixed label space. T wo mo dels w ere ev aluated: Google’s SigLIP base mo del ( ≈ 203M parameters) (Zhai et al., 2023) and OpenAI’s CLIP ViT-L/14 ( ≈ 427M parameters) (Radford et al., 2021). These contrastiv e mo dels were ev aluated in t wo settings: 1) Zer o-shot classific ation and 2) line ar pr obing . In zero-shot classification, we embed images and textual class descriptions into a shared representation space, with lab els assigned via cosine similarity . F or each class, descriptiv e templates were constructed from crop and disease metadata (see Section C.1 for the zero-shot templates), and similarity scores were av eraged across a small template ensemble. 4 F or linear probing, w e train a linear classifier using frozen image em b eddings, updating only classifier pa- rameters while keeping the pretrained vision encoder fixed. Linear probing w as p erformed under the same three training regimes as other mo del types: full dataset, lab-only , and field-only . All con trastive mo dels were trained with a batch size of 64, with learning rates selected via a small manual sw eep including 0.001, 0.003, and 0.01. 3.4 Generative VLM Exp eriments In contrast to encoder-only con trastive mo dels, generativ e VLMs produce free-text outputs conditioned on visual input. Three generative VLMs of v arying scale are ev aluated: Qw en2.5-VL 3B Instruct, Qwen2.5-VL 7B Instruct (Bai et al., 2025), and SmolVLM 500M Instruct (Marafioti et al., 2025). Zero-shot p erformance was ev aluated prior to adaptation using three prompting strategies: (1) a simple instruction (Pure), (2) a context-augmen ted instruction providing the full set of crop–disease pairs (Con- text), and (3) a multiple-c hoice format (MCQ) requiring selection from four candidate classes, where three candidates were randomly selected for each sample, and one candidate w as the true lab el. A frozen-vision (FV) condition was included, where the vision enco der remained fixed and LoRA was applied only to the language comp onents. T o adapt the selected VLMs to the task, Lo w-Rank Adaptation (LoRA) (Hu et al., 2022) was applied to the mo dels, with all exp eriments using a multimodal conv ersational format (Section D.2). A Bay esian optimisa- tion sweep tuned learning rate, w eight decay , and LoRA rank r (see Section D.3 for sw eep configurations). A scaling factor of α = 2 r w as adopted after preliminary exp erimen ts sho wed consistently low er v alidation loss compared to α = r . Fine-tuning follow ed the same three training regimes as the CNNs: full dataset, lab-only , and field-only . 4 Evaluation & Analysis 4.1 Evaluation Setup Three model families are ev aluated under a unified proto col: CNNs, contrastiv e VLMs, and generativ e VLMs. CNNs and con trastiv e mo dels pro duce closed-set predictions, whereas generative VLMs output free- text responses that must be mapp ed to v alid class lab els. Performance is ev aluated using macro-av eraged Precision, Recall, and F1-score across the 65 classes, with F1 rep orted as the primary metric. Generalisation is assessed by ev aluating p erformance separately on lab, field, and combined test sets, enabling analysis under domain shift. Results for ov erall p erformance are rep orted in T able 1, while generalisation exp eriments can b e found in T able 2. T o ensure fair comparison, generative outputs that cannot b e parsed in to v alid class labels are treated as incorrect predictions via assignment to a dedicated false_parse class. Parse Success Rate (PSR) is rep orted separately to distinguish visual misclassification from instruction-related failures. 4.2 CNN-Based Models under Domain Shift T o calibrate task difficulty , tw o naïv e reference classifiers w ere ev aluated. A Random classifier achiev ed an F1-score of 0.013, consistent with chance p erformance, while a Ma jority-class baseline ac hieved an F1-score of 0.0006, indicating the absence of a dominant class and confirming the non-trivialit y of the task. A ResNet-50 CNN pretrained on ImageNet and fine-tuned for crop disease classification represen ts a con- v entional sup ervised baseline (Islam et al., 2023; K.M. et al., 2023). When trained and ev aluated on the com bined lab and field dataset, it achiev es an F1-score of 0.910, demonstrating that CNN-based models can perform v ery effectiv ely when training and test conditions are aligned (see T able 4 for hyperparame- ter sweep). Notably , the same model attains a lab-only F1-score of 0.973, indicating particularly strong p erformance in controlled imaging environmen ts. 5 PSR (%) F1 Precision Recall Random – 1.3 1.4 1.3 Ma jorit y – 0.06 0.03 1.5 ResNet-50 – 91.0 92.1 90.7 SigLIP-ZS – 0.16 0.15 0.64 CLIP/L/14-ZS – 14.3 20.0 19.1 SigLIP – 90.1 90.4 90.2 CLIP/L/14 – 91.1 91.6 91.1 Qw en2.5-VL-3B-ZS-MCQ 21.2 23.7 68.7 16.5 Qw en2.5-VL-7B-ZS-MCQ 94.8 65.9 71.0 65.9 SmolVLM-500M-ZS-Con text 25.0 0.2 0.4 0.6 Qw en2.5-VL-3B-FV 99.9 87.6 88.2 87.4 Qw en2.5-VL-7B-FV 100.0 89.8 90.5 89.9 SmolVLM-500M-FV 99.9 75.3 76.2 75.9 Qw en2.5-VL-3B 99.9 89.0 89.5 88.9 Qw en2.5-VL-7B 99.8 90.5 90.9 90.4 SmolVLM-500M 100.0 87.8 89.6 87.5 T able 1: Overall p erformance on the combined test set. Macro-F1, precision, recall, and Parse Success Rate (PSR) are rep orted in p ercentage scale (0–100). PSR is applicable only to generative VLMs. Bold v alues denote the strongest F1-score within each exp erimen tal group. Ho wev er, this performance is highly sensitive to c hanges in the data distribution. As shown in T able 2, when ev aluated exclusively on field images, the CNN’s F1-score decreases from 0.973 (Lab) to 0.703 (Field), corresp onding to a relative reduction of ≈ 27.75%. Under more extreme mismatc h, a CNN trained only on lab images achiev es a lab F1-score of 0.968 but degrades to a field F1-score of 0.045, indicating almost complete failure to transfer to in-the-wild conditions ( ≈ 95.35% collapse). The conv erse pattern is also observ ed: a CNN trained only on field data ac hieves a relativ ely strong field F1-score (0.737) but p erforms p oorly on lab images (0.133). T ak en together, these results indicate that CNN-based classifiers learn highly domain-sp ecific visual rep- resen tations that supp ort excellen t performance under con trolled conditions but generalise p oorly across acquisition settings. This behaviour suggests that CNNs are well suited to lab oratory-based disease clas- sification pip elines with standardised imaging protocols, but their reliabilit y degrades substantially when applied to heterogeneous field environmen ts. 4.3 Contrastive Vision-Language Mo dels Con trastive VLMs are ev aluated in b oth zero-shot and linear-probe settings under the same full, lab-only , and field-only regimes used for CNNs. Zero-shot contrastiv e inference p erforms po orly (F1 ≤ 0.15): cosine similarity betw een image em b eddings and templated class prompts does not reliably separate the 65 crop–disease categories. This indicates that w eb-scale contrastiv e alignmen t alone do es not enco de the fine-grained distinctions required, and that task- sp ecific adaptation is necessary . Linear probing substantially impro ves p erformance, showing that pretrained con trastive encoders already con tain disease-relev ant features. Under full-dataset training, p erformance increases with mo del capacity; relativ e to CNNs, contrastiv e models comp ete on lab images and improv e robustness on field images, sug- gesting that their pre-trained representations are less tightly coupled to con trolled imaging conditions. Under domain-exclusiv e training, con trastive VLMs degrade on the opposite domain: field-trained mo dels transfer to lab setting b etter than the inv erse. This suggests lab-only training encourages reliance on clean, 6 lo w-v ariance cues that do not transfer to real-world settings, whereas field-only training yields classifiers that tolerate cleaner lab imagery . Compared to CNNs, contrastiv e VLMs exhibit more stable cross-domain b eha viour, though substantial degradation p ersists under extreme lab-to-field mismatch. Con trastive models op erate ov er a fixed label space with deterministic inference, eliminating parse failures and in terface-induced errors. Their closed-set formulation constrains output flexibility but pro vides predictable and structurally reliable predictions. Ov erall, contrastiv e VLMs offer a more domain-tolerant alternativ e to con ven tional CNNs while maintaining architectural simplicity and minimal task-sp ecific adaptation. PSR (%) F1(Com bined) F1(Lab) F1(Field) T r aine d on ful l dataset ResNet-50 – 91.0 97.2 70.3 SigLIP – 90.1 93.2 73.7 CLIP/L/14 – 91.1 95.6 75.2 Qw en2.5-VL-3B 99.93 89.0 91.8 74.6 Qw en2.5-VL-7B 99.82 90.5 93.0 78.7 SmolVLM-500M 100.0 87.8 92.8 70.6 T r aine d on lab-only dataset ResNet-50 – 56.1 96.8 4.5 SigLIP – 56.5 95.0 14.0 CLIP/L/14 – 56.8 95.9 10.8 Qw en2.5-VL-3B 94.44 55.3 88.0 23.4 Qw en2.5-VL-7B 100.0 58.3 94.1 25.2 SmolVLM-500M 99.93 58.9 94.4 18.3 T r aine d on field-only dataset ResNet-50 – 37.4 13.3 73.7 SigLIP – 41.3 19.6 75.8 CLIP/L/14 – 41.2 17.4 77.5 Qw en2.5-VL-3B 99.16 39.4 15.8 75.0 Qw en2.5-VL-7B 92.05 43.7 20.3 75.1 SmolVLM-500M 99.86 34.9 10.6 67.5 T able 2: Generalisation p erformance across domain-sp ecific training regimes. Macro-F1 scores (p ercen tage scale) are rep orted for combined, Lab-only , and Field-only test sets. PSR is shown for generativ e mo dels. Bold v alues indicate the strongest F1 within each training regime. 4.4 Generative Vision-Language Mo dels Generativ e VLMs extend contrastiv e alignment by coupling pretrained vision encoders with large language mo dels capable of free-text reasoning and structured output generation. Their b ehaviour is examined under increasing levels of task adaptation, from zero-shot prompting to sup ervised LoRA fine-tuning. In the zero-shot setting, p erformance is highly sensitive to prompt formulation. Simple instruction prompts yield uniformly low F1-scores ( ≤ 0.04), whereas structurally constrained multiple-c hoice prompts substan- tially impro ve performance for larger models (see T able 7 for all zero-shot performance metrics). This con trast indicates that task-relev ant visual kno wledge is present in pretrained represen tations, but zero-shot p erformance is limited by the mo del’s ability to reliably map visual evidence in to the required structured output format. Unlike contrastiv e mo dels, inference quality is therefore jointly determined by representation and interface design. The frozen-vision (FV) condition isolates the contribution of pretrained visual features b y applying LoRA only to language comp onen ts. Under this constraint, b oth Qw en v ariants retain strong classification p erfor- mance, implying that substantial disease-relev ant signal is already enco ded in the vision backbone. SmolVLM 7 exhibits greater degradation, suggesting that mo del capacit y influences ho w effectiv ely frozen visual repre- sen tations can b e exploited. Under full LoRA fine-tuning on the com bined dataset, generative VLMs achiev e F1- scores ≥ 0.875, comp et- itiv e with CNNs. While CNNs achiev e higher lab accuracy , VLMs show more balanced degradation across domains. On a verage, VLMs exp erience a smaller relativ e drop under domain shift ( ≈ 19.35%) compared to the CNN ( ≈ 27.75%), with robustness improving with mo del scale. Cross-domain generalisation is ev aluated via domain-exclusive fine-tuning. Lab-only training leads to sub- stan tial degradation when ev aluated on field data, with v arying severit y across mo dels. Qwen-based models exhibit a smaller relativ e drop ( ≈ 74%) compared to the CNN’s collapse ( ≈ 95%), retaining a meaningful fraction of their p erformance under severe mismatch. SmolVLM shows a larger decline ( ≈ 80%), suggesting that mo del capacity influences the retention of transferable visual features under extreme domain shift. As observed with contrastiv e mo dels, transfer asymmetry emerges, how ever, inv ersely; lab-to-field degrada- tion is smaller than field-to-lab. This pattern suggests that web-scale pretraining biases vision enco ders to- w ard visually complex, in-the-wild imagery , providing a robustness prior during lab-only adaptation, whereas lab oratory imagery constitutes a comparatively narrow distribution. Ov erall, generative VLMs exhibit strong pretrained visual representations that can b e unlo ck ed with mo dest sup ervision, though their effectiveness dep ends on training domain and alignmen t strategy . Their generative in terface introduces additional complexity , but also supp orts greater robustness under domain shift, reflecting a trade-off b etw een interface simplicity and representational generalit y . 4.5 F ailure Analysis This section analyses the differen t failure mo des b y providing sp ecific examples of these failure modes that are characteristic of each mo del type. 4.5.1 CNN F ailure Modes T o analyse CNN failure mo des, the confusion matrix of the ResNet50 model trained on com bined lab and field data w as examined (Figure 5). The matrix revealed that corn_common_rust (Class 13) exhibited the highest error rate, primarily b eing misclassified as corn_phaeosphaeria_leaf_spot (Class 18). Figure 3 illustrates a representativ e case of this inter-class leakage. Figure 3: A corn crop with common rust in the field with probabilities for a CNN and CLIP prediction. The input image features a damaged leaf where necrotic lesions and p erforations dominate the lo cal texture, alongside darker rust-coloured pustules distributed across the leaf surface. The CNN’s preference for leaf sp ot ( ≈ 66%) may stem from an o ver-reliance on shape-dominant lo cal features under distributional noise, 8 reflecting an inductive bias to ward lesion geometry and texture patterns. The VLM, ho wev er, aligns the image with higher-level semantic concepts suc h as rust-like visual cues, resulting in correct iden tification of the rust disease with high confidence ( ≈ 84%). Despite this, the non-negligible probability assigned to the correct class ( ≈ 28%) indicates that the CNN maintains partial recognition of the underlying pathology . 4.5.2 Contrastive VLM Failure Mo des Similar to the CNN, the confusion matrix of the CLIP mo del was consulted (Figure 6), and an example where the CLIP model exhibits pronounced uncertaint y betw een tw o closely related disease classes is examined. Figure 4 shows a p otato leaf affected by blight-lik e symptoms, for which the mo del assigns comparable prob- abilit y to potato_late_blight (45%) and potato_early_blight (42%). Generally , b oth diseases present o verlapping visual phenotypic characteristics, including irregular necrotic regions and diffuse chlorosis, mak- ing disambiguation challenging. Figure 4: A p otato crop with an ambiguous blight disease in the field with an uncertain CLIP prediction. Rather than a spurious misclassification, this example reflects difficulty in resolving fine-grained class b ound- aries under substan tial visual ov erlap. The mo del’s probabilit y distribution reveals semantic proximit y b e- t ween the t wo classes in the embedding space, indicating that the visual evidence does not strongly fa vour a single diagnosis. Although this uncertain ty is preferable to o verconfiden t error, it remains problematic in high-stak es agricultural contexts, where early and late blight require differen t interv entions. This illustrates a limitation of con trastive VLMs: strong global semantic alignment do es not guarantee reliable separation of subtle intra-class distinctions without additional contextual or temp oral cues. 4.5.3 Generative VLM Failure Mo des Unconstrained text generation introduces failure mo des not presen t in discriminative mo dels. This analysis examines outputs that could not b e parsed into v alid crop–disease pairs under the task sp ecification. A cross all generative VLM exp erimen ts, 431 outputs failed parsing. Of these, 39.7% were empty generations, represen ting silent task breakdowns. Among the remaining non-empty failures, 12.69% w ere classified as hal- lucinations. Hallucinations o ccur in several systematic forms. First, mo dels introduce non-existen t modifiers or entities (e.g., icelandic raspberry , icicle apple ), producing crop–disease com binations outside the dataset ontology . Second, unsupp orted crop substitutions appear (e.g., banana , sage , hazel ), despite their absence from the training distribution. Third, other failures stem from semantic v agueness rather than out- righ t fabrication. F or instance, models can output undersp ecified classes (e.g., leaf_spot , tomato_spot ) that corresp ond to multiple dataset classes and cannot b e resolved unambiguously . These findings indicate that although generative VLMs offer expressive and flexible predictions, they intro- duce non-trivial risks of hallucination and silent failure in high-stakes agricultural deplo yment. 9 4.6 Summa ry of Findings Results sho w that crop disease detection dep ends hea vily on the deplo yment context. CNNs achiev e the strongest p erformance on lab-based data, but exp erience the steep est degradation under domain shift. Con- sisten t with prior findings that CNN represen tations are tightly coupled to their training distribution, their reliance on lo cal texture and shap e cues mak es them sensitive to c hanges in environmen tal con text, resulting in reduced aggregate p erformance and systematic class-level confusions under field conditions. Con trastive VLMs demonstrate impro ved robustness to domain shift relative to CNNs. Their errors tend to cluster around visually or seman tically adjacent classes, indicating uncertaint y rather than complete failure. This suggests that contrastiv e pretraining encourages more transferable visual representations, while still limited by visually subtle, fine-grained disease distinctions. Generativ e VLMs are the most robust to distributional shift among the three mo del types, but introduce an additional failure mode b eyond misclassification. Despite their robustness, their open-ended generation ob jectiv e leads to non-trivial rates of inv alid or hallucinated outputs that are critical in safety-sensitiv e agricultural contexts. T ak en together, these findings indicate that no single mo del family is universally optimal. Instead, deploy- men t requirements should guide model selection: CNNs are preferred when high lab-based accuracy is the primary ob jective; contrastiv e VLMs offer a more robust alternative for fixed sets of crops under mo derate domain shift; and generativ e VLMs are most suitable when flexibility and extended capabilities are required. 5 Conclusions & Outlo ok This w ork presents a systematic comparison of mo del arc hitectures across realistic agricultural domains and in tro duces a balanced b enchmark for crop disease ev aluation. The results show that arc hitectural suitability dep ends on deploymen t context rather than p eak accuracy . 5.1 Limitations & Future Wo rk Despite pro viding a controlled benchmark for cross-domain ev aluation, sev eral limitations remain. First, although AgriP ath-LF16 reduces extreme im balance, field-sourced samples remain comparativ ely under- represen ted for certain crop–disease pairs. This limits the abilit y to fully c haracterise robustness under real-w orld v ariability . Second, the dataset lacks con textual or temp oral information that represen ts disease progression, whic h is dynamic and am biguous in isolation. Additionally , m ultimo dal agricultural metadata suc h as region, climate, soil characteristics, or seasonality were not incorp orated. Computational constraints limited exploration of larger architectures, broader hyperparameter sweeps, and extended ablations. F uture work should expand field data collection to reduce domain imbalance and increase environmen tal cov- erage. In tegrating con textual metadata into generativ e VLM pipelines may impro ve reliability and reduce hallucinations through agricultural grounding (Y ao et al., 2023). T emp oral mo delling of disease progression using longitudinal imagery is another promising direction. Moreo ver, reasoning-aw are fine-tuning that pro- motes lo calisation of symptomatic regions and suppresses background cues may improv e robustness (Bansal et al., 2025). Finally , real-world farmer-facing ev aluations w ould clarify usability , trust calibration, and practical p erformance b eyond b enchmarks. 5.2 Statement of Broader Impact This study supports the developmen t of robust, con text-aw are disease detection systems to enhance agri- cultural pro ductivit y and fo o d security . Early , accurate identification of plant diseases minimises yield loss, enables timely interv en tion, and reduces unnecessary pesticide use. Arc hitectures that maintain robust- ness under domain shift are esp ecially critical for real-world agricultural settings with uncon trolled imaging conditions. F urthermore, generativ e VLMs offer flexible diagnostic p otential by integrating contextual meta- data and providing structured reasoning, impro ving accessibilit y for smallholder farmers and facilitating in tegration into precision agriculture workflo ws. 10 Generativ e models ma y pro duce hallucinated outputs that could lead to incorrect in terven tions; mitigation requires structured constraints, grounding, and human ov ersight. Additionally , systems should b e p ositioned as assistive rather than authoritativ e. F urthermore, dataset imbalance and limited field data can bias mo dels to ward con trolled conditions, requiring contin ued domain-div erse collection. Regional bias remains a risk due to geographic v ariation in disease app earance; mitigation requires lo cal data collection, fine-tuning, and transparen t deplo yment limits. Environmen tal and computational costs also remain a concern. Although parameter-efficien t tuning reduces ov erhead, architectural c hoices must balance sustainability with accuracy and robustness. Ultimately , careful design, transparent rep orting, and resp onsible deploymen t are essential for equitable agricultural b enefit. 11 References Muhammad A wais, Ali Husain Salem Ab dulla Alharthi, Amandeep Kumar, Hisham Cholakkal, and Rao Muhammad An w er. Agrogpt: Efficien t agricultural vision-language mo del with exp ert tuning, 2024. URL . Sh uai Bai, Keqin Chen, Xuejing Liu, Jialin W ang, W enbin Ge, Sib o Song, Kai Dang, Peng W ang, Shijie W ang, Jun T ang, Humen Zhong, Y uanzhi Zhu, Mingkun Y ang, Zhaohai Li, Jianqiang W an, Pengfei W ang, W ei Ding, Zheren F u, Yiheng Xu, Jiabo Y e, Xi Zhang, Tian bao Xie, Zesen Cheng, Hang Zhang, Zhib o Y ang, Haiyang Xu, and Juny ang Lin. Qw en2.5-vl technical rep ort, 2025. URL 2502.13923 . Hritik Bansal, Dev andra Singh Sac han, Kai-W ei Chang, Adit ya Grov er, Gargi Ghosh, W en-tau Yih, and Ramakanth Pasun uru. Honeyb ee: Data recip es for vision-language reasoners. arXiv pr eprint arXiv:2510.12225 , 2025. V ardhan Dongre, Chi Gui, Shubham Garg, Ho oshang Nayy eri, Gokhan T ur, Dilek Hakkani-Tür, and Vikram S Adv e. Mirage: A b enchmark for m ultimo dal information-seeking and reasoning in agricultural exp ert-guided conv ersations. arXiv pr eprint arXiv:2506.20100 , 2025. Ja wad Hassan, Kaleem Razzaq Malik, Ghulam Irtaza, Ali Ghulam, and Ashfaq Ahmad. Disease identification using deep learning in agriculture: A case study of cotton plan t. VF AST T r ansactions on Softwar e Engi- ne ering , 10(4):104–115, Dec. 2022. doi: 10.21015/vtse.v10i4.1224. URL https://vfast.org/journals/ index.php/VTSE/article/view/1224 . Kaiming He, Xiangyu Zhang, Shao qing Ren, and Jian Sun. Deep residual learning for image recognition, 2015. URL . Edw ard J Hu, yelong shen, Phillip W allis, Zeyuan Allen-Zh u, Y uanzhi Li, Shean W ang, Lu W ang, and W eizh u Chen. LoRA: Lo w-rank adaptation of large language models. In International Confer enc e on L e arning R epr esentations , 2022. URL https://openreview.net/forum?id=nZeVKeeFYf9 . Da vid. P . Hughes and Marcel Salathe. An op en access rep ository of images on plant health to enable the dev elopment of mobile disease diagnostics, 2016. URL . Md. Manow arul Islam, Md Ab dul Ahad Adil, Md. Alamin T alukder, Md. Khabir Uddin Ahamed, Md Ashraf Uddin, Md. Kamran Hasan, Selina Sharmin, Md. Mahbubur Rahman, and Sumon Kumar Debnath. Deep- crop: Deep learning-based crop disease prediction with w eb application. Journal of A gricultur e and F o o d R ese ar ch , 14:100764, 2023. ISSN 2666-1543. doi: h ttps://doi.org/10.1016/j.jafr.2023.100764. URL https://www.sciencedirect.com/science/article/pii/S2666154323002715 . Sudhesh K.M., Sowm y a V., Sainamole Kurian P ., and Sikha O.K. Ai based rice leaf disease iden- tification enhanced by dynamic mo de decomposition. Engine ering A pplic ations of A rtificial Intel li- genc e , 120:105836, 2023. ISSN 0952-1976. doi: https://doi.org/10.1016/j.engappai.2023.105836. URL https://www.sciencedirect.com/science/article/pii/S0952197623000209 . Andrés Marafioti, Orr Zohar, Miquel F arré, Merv e No yan, Elie Bakouc h, P edro Cuenca, Cyril Zakka, Loubna Ben Allal, Anton Lozhk ov, Nouamane T azi, V aibhav Sriv astav, Josh ua Lochner, Hugo Larc her, Mathieu Morlon, Lewis T unstall, Leandro von W erra, and Thomas W olf. Smolvlm: Redefining small and efficien t multimodal mo dels, 2025. URL . Sharada P . Mohan ty , Da vid P . Hughes, and Marcel Salathé. Using deep learning for image-based plan t disease detection. F r ontiers in Plant Scienc e , 7, 2016. ISSN 1664-462X. doi: 10.3389/fpls.2016.01419. URL https://www.frontiersin.org/journals/plant- science/articles/10.3389/fpls.2016.01419 . Alec Radford, Jong W o ok Kim, Chris Hallacy , Adit y a Ramesh, Gabriel Goh, Sandhini Agarwal, Girish Sastry , Amanda Askell, P amela Mishkin, Jack Clark, Gretchen Krueger, and Ilya Sutskev er. Learning transferable visual mo dels from natural language sup ervision, 2021. URL . 12 Da vinder Singh, Naman Jain, Pranjali Jain, Pratik Kay al, Sudhakar Kumaw at, and Nipun Batra. Plan tdo c: A dataset for visual plan t disease detection. In Pr o c e e dings of the 7th A CM IKDD CoDS and 25th COMAD , CoDS COMAD 2020, pp. 249–253. ACM, Jan uary 2020. doi: 10.1145/3371158.3371196. URL http://dx.doi.org/10.1145/3371158.3371196 . Ranjita Thapa, Kai Zhang, Noah Snav ely , Serge Belongie, and A wais Khan. Plan t pathology 2021 - fgvc8. https://kaggle.com/competitions/plant- pathology- 2021- fgvc8 , 2021. Kaggle. T yr Wiesner-Hanks and Mohammed Brahimi. Image set for deep learning: Field images of maize annotated with disease symptoms, F eb 2019. URL osf.io/p67rz . Han tao Y ao, Rui Zhang, and Changsheng Xu. Visual-language prompt tuning with knowledge-guided con text optimization. In Pr o c e e dings of the IEEE/CVF c onfer enc e on c omputer vision and p attern r e c o gnition , pp. 6757–6767, 2023. Xiaoh ua Zhai, Basil Mustafa, Alexander K olesniko v, and Lucas Beyer. Sigmoid loss for language image pre-training, 2023. Y ueyue Zhou, Hongping Y an, Kun Ding, Tingting Cai, and Y an Zhang. F ew-shot image classification of crop diseases based on vision–language mo dels. Sensors , 24(18), 2024. ISSN 1424- 8220. doi: 10.3390/s24186109. URL https://www.mdpi.com/1424- 8220/24/18/6109 . 13 A Dataset Comp osition A.1 Source Datasets Dataset Name Source Crop # Diseases # Samples Citation/Link New Bangladeshi Crop Disease Lab Rice 4 4,078 Moin (2023) Plan tVillage Lab Apple 4 4,645 G. & J. (2019) Blueb erry 1 1,502 Cherry 2 2,502 Corn 4 4,345 Grap e 4 4,639 Orange 1 5,507 P each 2 3,297 Bell Pepper 2 2,478 P otato 3 3,000 Raspb erry 1 1,000 So yb ean 1 5,090 Squash 1 1,835 Stra wb erry 2 2,109 T omato 10 18,835 Plan tDo c Field Apple 3 287 Jain & Ka yal (2024) Bell Pepper 2 125 Blueb erry 1 117 Cherry 1 57 Corn 3 378 Grap e 2 154 P each 1 112 P otato 2 379 Raspb erry 1 119 So yb ean 1 65 Squash 1 130 Stra wb erry 2 96 T omato 9 903 Apple Dataset 2021 Field Apple 5 15,675 FGV C (2021) Rob oflo w Rice Disease Dataset Field Rice 6 3,733 Jain & Kay al (2024) P addy Do ctor Field Rice 10 10,407 Paddy Do ctor (2023) Rice Leaf Disease Field Rice 4 5,932 Seth y (2020) CD&S Dataset Field Corn 1 523 Ahmad (2021) Disease of Maize in the Field Field Corn 5 2,716 UoPretoria (2022) CornNLB Field Corn 1 1,787 Brahimi et al. (2018) Zeytin Olive Leaf Disease Lab Oliv e 3 5,011 Uguz & Uysal (2021) Stra wb erry Disease Detection Field Stra wb erry 5 2,268 Afzaal et al. (2021) T able 3: Datasets used to compile AgriPath-LF16 along with links to the do wnload source 14 A.2 Do wnsampling Strategy Belo w is the do wnsampling logic used to create AgriP ath-LF16-30k. The balanced subset of AgriPath-LF16 used in this pap er: • Case 1 (Single Source): If samples existed for only one source (lab or field), all samples w ere k ept if the coun t w as close to the do wnsample target (within ± 10), or do wnsampled to matc h the target if the count exceeded it by more than 20. • Case 2L (Lab less than target, field more): If the total lab and field samples w ere less than the target, all samples were kept. Otherwise, field samples were downsampled to the required count, and all lab samples were included. • Case 2F (Field less than target, lab more): Similar to Case 2L, if the total samples were less than the target, all samples w ere k ept. Otherwise, lab samples w ere do wnsampled to the required coun t, and all field samples were included. • Case 3 (Both less than target): F or under-represen ted classes, the crop-disease pair was flagged for review, and all existing samples were kept and added to the dataset for insp ection. • Case 4 (Both meet or exceed target): Both lab and field samples w ere downsampled to equal amoun ts to achiev e a 50/50 split and match the target sample size. A.3 Dataset Structure Eac h sample in AgriPath-LF16 includes the following structured metadata: • image : The image of the crop. • crop : The sp ecific crop (leaf ) represen ted in the image. • disease : The disease present (if any) in the image. • source : Indicates whether the image was taken in a lab or in the field. • crop_disease_label : A combined lab el representing crop-disease pairs. • numeric_label : The numeric enco ding (0-64) for eac h crop-disease pair. 15 B A dditional CNN Info rmation All CNN exp eriments w ere implemented using PyT orch Lightning. A coarse grid search o ver batch size and learning rate was conducted for the ResNet-50 mo del across all exp eriments. The grid search includes three batc h sizes (16, 32, and 64) and three learning rates (1e-4, 2e-4, 5e-4), resulting in a total of 9 exp eriments. The exp eriment mentioned in the pap er is in b old. B.1 CNN-F ull Batc h Size Learning Rate F1(Combined) F1(Lab) F1(Field) 16 1e-4 91.0 97.2 70.3 16 2e-4 89.3 95.6 66.6 16 5e-4 88.8 94.9 69.9 32 1e-4 90.6 94.0 70.4 32 2e-4 90.1 93.7 70.3 32 5e-4 88.9 91.5 64.5 64 1e-4 89.9 95.0 66.0 64 2e-4 89.3 94.9 64.9 64 5e-4 87.5 91.4 68.6 T able 4: The F1-Scores of the CNN exp eriments trained on the full dataset (lab and field) B.2 CNN-Lab Batc h Size Learning Rate F1(Combined) F1(Lab) F1(Field) 16 1e-4 56.0 96.8 4.5 16 2e-4 55.1 94.6 4.9 16 5e-4 55.1 96.8 3.6 32 1e-4 55.5 97.0 4.2 32 2e-4 55.1 95.5 4.7 32 5e-4 55.8 96.3 3.5 64 1e-4 55.4 95.9 4.7 64 2e-4 55.8 96.6 4.2 64 5e-4 54.8 95.3 4.1 T able 5: The F1-Scores of the CNN exp eriments trained on the lab-only subset of the full dataset 16 B.3 CNN-Field Batc h Size Learning Rate F1 (Combined) F1(Lab) F1(Field) 16 1e-4 37.4 13.3 73.7 16 2e-4 35.6 10.8 69.6 16 5e-4 37.0 11.6 70.2 32 1e-4 40.2 15.2 76.9 32 2e-4 34.0 8.2 69.1 32 5e-4 34.7 11.2 68.7 64 1e-4 37.3 12.7 73.3 64 2e-4 37.6 12.9 70.6 64 5e-4 36.8 11.4 71.4 T able 6: The F1-Scores of the CNN exp eriments trained on the field-only subset of the full dataset C A dditional Contrastive VLM Info rmation C.1 Zero-Shot T emplates Zero-shot classification for contrastiv e VLMs was p erformed using prompt-ensemble protot yp es constructed from crop–disease metadata. T ext prompts w ere generated using class-specific templates and av eraged in em b edding space prior to similarity computation. T wo template families were defined: 1. Diseased T emplates: • "a photo of a {crop} leaf with {disease}" • "an image of a {crop} leaf affected by {disease}" • "a close-up photo of a {crop} leaf showing {disease}" 2. Health y T emplates: • "a photo of a healthy {crop} leaf" • "an image of a healthy {crop} leaf" • "a close-up photo of a healthy {crop} leaf" F or eac h of the 65 crop–disease classes, all corresp onding templates were instantiated, encoded using the mo del’s text encoder, L2-normalised, and a veraged to form a class protot yp e v ector. During inference, image em b eddings were L2-normalised and cosine similarit y was computed against all class protot yp es. The predicted lab el corresp onds to the maximum similarity score. C.2 Linea r Probing Configuration T o ev aluate the quality of pretrained visual represen tations, linear probing w as performed b y training a single fully-connected classifier head on frozen image embeddings. Bac kb one Handling: • Pretrained SigLIP and CLIP backbones were loaded via AutoModel . • All bac kb one parameters were frozen. • Image embeddings w ere extracted using get_image_features() when a v ailable, or via the CLS tok en from the vision enco der. • Em b eddings were L2-normalised b efore classification. 17 Classifier Head: A single Linear lay er, Linear(feature_dim, 65) was trained on top of frozen features. • Only classifier parameters were up dated. • Bac kb one gradients were disabled. The trained head and metadata (feature dimension, class count) w ere stored as a W&B artifact and reloaded during ev aluation. T raining Configuration: All linear probing exp eriments used: • Batc h size: 64 • Cross-En trop y loss • Macro-F1 as ev aluation metric • Learning Rate selected via small manual sweep from {0.001, 0.003, 0.01} D A dditional Generative VLM Info rmation D.1 Zero-Shot Evaluations PSR (%) F1 Precision Recall Qw en2.5-VL-3B-ZS-Pure 90.87 3.9 5.6 5.9 Qw en2.5-VL-3B-ZS-Context 20.02 2.4 18.1 2.0 Qw en2.5-VL-3B-ZS-MCQ 21.24 23.7 68.7 16.5 Qw en2.5-VL-7B-ZS-Pure 68.76 2.1 2.8 3.3 Qw en2.5-VL-7B-ZS-Context 90.21 10.5 17.7 15.5 Qw en2.5-VL-7B-ZS-MCQ 94.86 65.9 71.0 65.9 SmolVLM-500M-ZS-Pure 0.17 0 0 0 SmolVLM-500M-ZS-Con text 24.99 0.2 0.4 0.6 SmolVLM-500M-ZS-MCQ 0 0 0 0 T able 7: All ZS experiments for all Generativ e VLMs, rep orting PSR, F1, Precision, and Recall in a range of 0-100. Exp erimen ts mentioned in the pap er are in b old D.2 LoRA Conversational Fo rmat conversation = [ {"role": "system", "content": [ {"type": "text", "text": "You are an expert pathologist and need to identify the crop and disease present in an image. If it is a healthy crop, classify it as healthy"} ] }, {"role": "user", "content": [ {"type": "text", "text": "Identify the crop and disease in the image."}, {"type": "image", "image": sample[’image’]} ] }, {"role": "assistant", "content": [ {"type": "text", "text": f"Class: {sample[’crop’]}\nDisease: {sample[’disease’]}"} ] } ] 18 D.3 Sw eep P a rameters All sweeps b elow use α = 2 r in the LoRA configurations of the sweep. D.3.1 Initial Sea rch Space P arameters Distribution Range Learning Rate Uniform 5 × 10 − 5 to 2 × 10 − 4 LoRA Rank r Categorical 32, 64, 128 (Qwen3) | 64, 128 (Qwen7) W eigh t Decay Uniform 0 to 0 . 1 T able 8: The initial parameters used for sw eeps. Qw en3 and Qw en7 refer to the 3B and 7B v ariants of the Qw en2.5-VL-xB-LoRA exp eriments resp ectively . Early sw eeps indicated stable conv ergence in the region r ∈ { 64 , 128 } , hence the shift from {32, 64, 128} to {64, 128} seen ab ov e in T able 8. D.3.2 Refined Sea rch Space Based on preliminary results, the LoRA rank w as fixed and subsequen t sweeps w ere restricted to learning rate and weigh t decay , using a reduced search range. P arameters Distribution Range Learning Rate Uniform 5 × 10 − 5 to 1 . 5 × 10 − 4 W eigh t Decay Uniform 0 to 0 . 1 LoRA Rank r Fixed 128 T able 9: The refined parameters used for sw eeps after the initial sweeps sho wed some trends of conv ergence. D.3.3 Summa ry of Sw eep Configurations Sw eep Name Regime Search Space Qw en3 F ull LoRA Initial Qw en3-LAB Lab LoRA Initial Qw en3-FV F rozen Vision Refined Qw en3-FIELD Field LoRA Refined Qw en7 F ull LoRA Initial Qw en7-LAB Lab LoRA Initial Qw en7-FV F rozen Vision Refined Qw en7-FIELD Field LoRA Refined Smol F ull LoRA Refined Smol-LAB Lab LoRA Refined Smol-FV F rozen Vision Refined Smol-FIELD Field LoRA Refined T able 10: A summary of the search spaces used for eac h sw eep. Qw en3 relates to Qw en2.5-VL-3B, Qw en7 relates to Qw en2.5-VL-7B, and Smol relates to SmolVLM-500M. Initial relates to section D.3.1, and Refined relates to section D.3.2 19 D.4 Implementation Configuration D.4.1 T raining F ramewo rks and LoRA Implementation Generativ e VLM exp eriments were conducted using tw o training back ends: • Qw en2.5-VL mo dels (3B, 7B) were fine-tuned using the UnslothAI framework via FastVisionModel with PEFT-based LoRA adaptation. • SmolVLM-500M w as fine-tuned using a custom PEFT pip eline built on Idefics3ForConditionalGeneration , as UnslothAI do es not natively supp ort this architec- ture. In b oth cases, LoRA was applied to attention and MLP mo dules. F or frozen-vision exp eriments, LoRA was restricted to language comp onents only , leaving vision lay ers un touched. All LoRA runs used: • Scaling F actor: α = 2 r • Drop out: 0 • Bias: none This ensures architectural parity across implementations despite back end differences. D.4.2 Inference Configuration During ev aluation: • Mo dels were loaded using their resp ective back ends (UnslothAI or PEFT). • Generation w as deterministic (temp erature = 0). • Image resizing was constrained to a longest edge of 512 pixels. • No b eam search or sampling was used. This ensured that p erformance differences reflect representational differences rather than sto chastic deco ding effects. D.4.3 Output P a rsing and Evaluation Mo del outputs were programmatically mapp ed to the 65 crop–disease classes. The following regular expres- sions were used to extract structured predictions: • "(?:Class|Answer|Crop):\s*(\w+(?: \w+)*)\s*[\r\n]+Disease:\s*(\w+(?:_\w+)*)" • "Answer:\s*[\r\n]+(\w+(?: \w+)*)\s*[\r\n]+(\w+(?:_\w+)*)" • "Disease:\s*(\w+(?:_\w+)*)\s*[\r\n]+(?:Crop|Class|Answer):\s*(\w+(?: \w+)*)" P arsing then extracted the exact crop and disease fields from the generated text and matc hed it against canonical class list. If no v alid mapping is found, the prediction is assigned to the false_parse class. Empt y generations and malformed outputs were treated as incorrect predictions and p enalised F1 compu- tation in order to retrieve a holistic view of mo del capabilities. 20 E Confusion Matrix Analysis E.1 CNN – ResNet-50 (Batch=16, LR=1e-4) Figure 5: T op confusion pairs are discussed in Section 4.5.1. Actual lab els are along the y-axis, and Predicted lab els are along the x-axis. 21 E.2 CLIP – CLIP/L/14 Figure 6: T op confusion pairs are discussed in Section 4.5.2. Actual lab els are along the y-axis, and Predicted lab els are along the x-axis. 22
Original Paper
Loading high-quality paper...
Comments & Academic Discussion
Loading comments...
Leave a Comment