A Reduced Basis Decomposition Approach to Efficient Data Collection in Pairwise Comparison Studies
Comparative judgement studies elicit quality assessments through pairwise comparisons, typically analysed using the Bradley-Terry model. A challenge in these studies is experimental design, specifically, determining the optimal pairs to compare to ma…
Authors: Jiahua Jiang, Joseph Marsh, Rowl
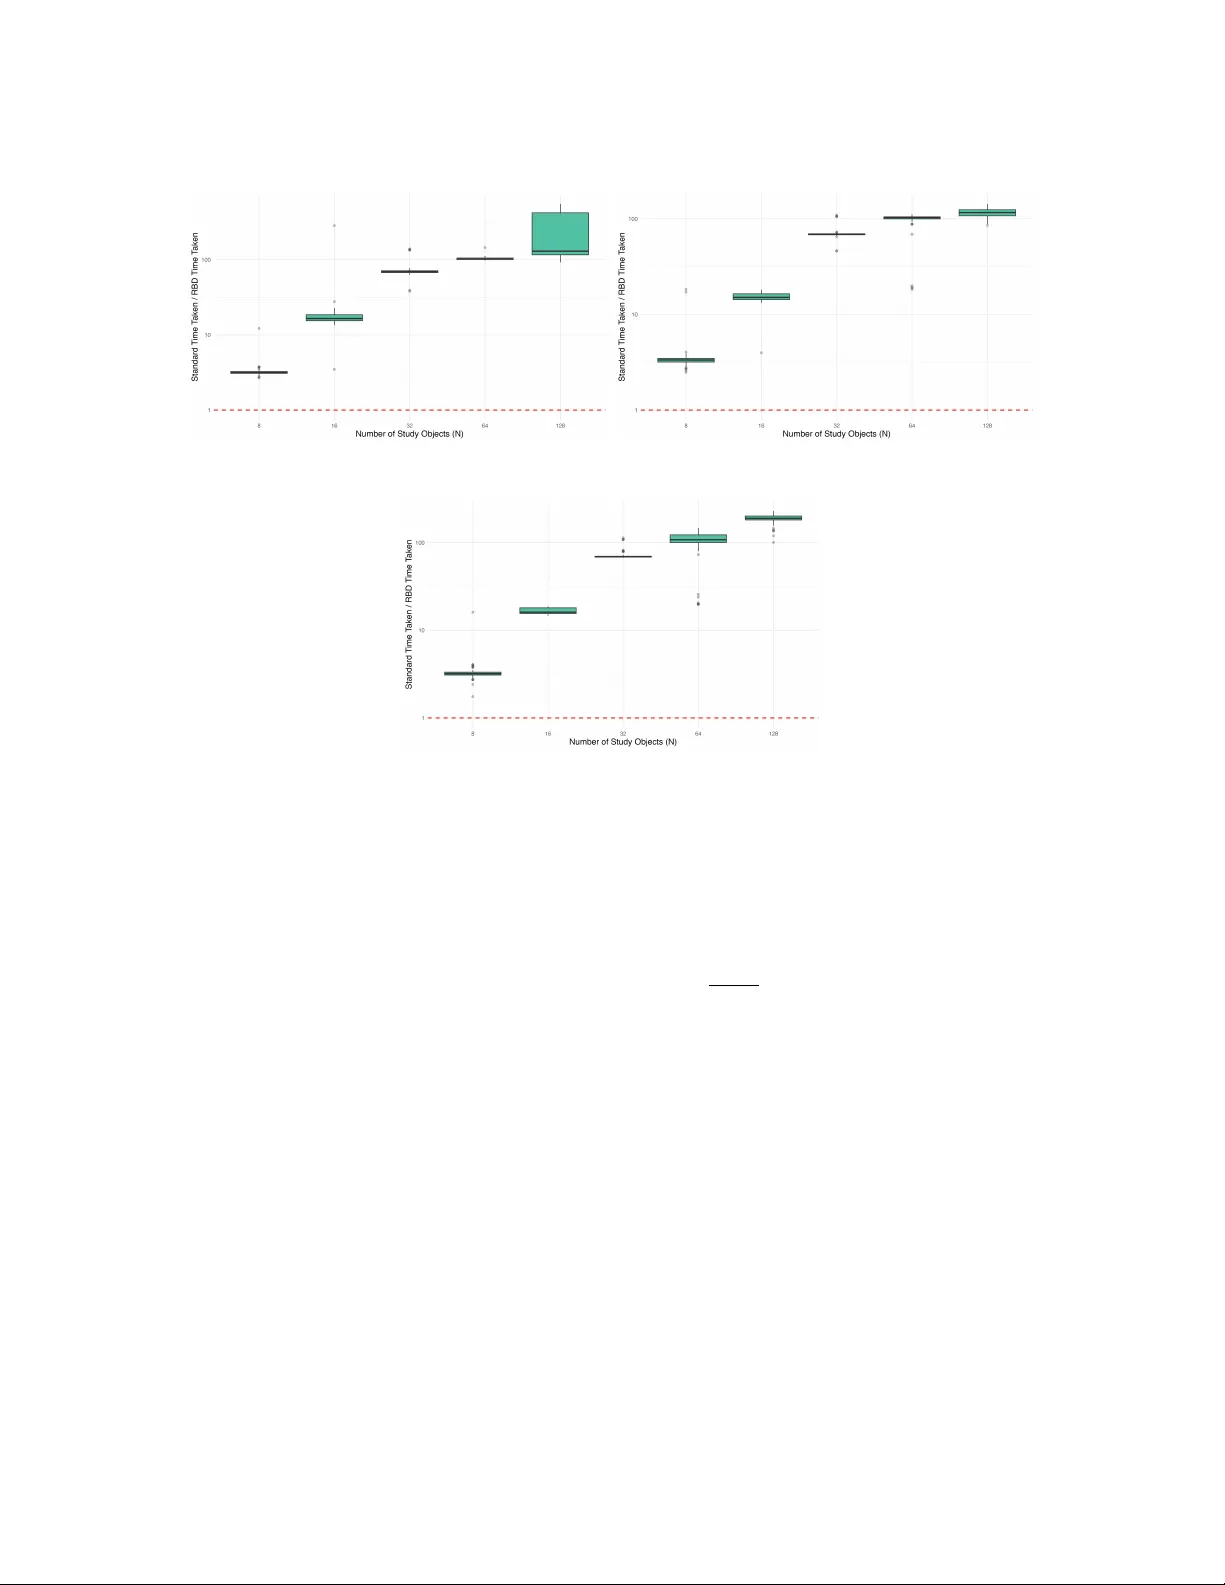
A Reduced Basis Decomp osition Approac h to Efficien t Data Collection in P airwise Comparison Studies Jiah ua Jiang 1 , Joseph Marsh 1 , and Ro wland G Seymour ∗ 1 1 Sc ho ol of Mathematics, Univ ersity of Birmingham, Edgbaston, B5 7US, United Kingdom Abstract Comparativ e judgemen t studies elicit quality assessments of ob jects through pairwise com- parisons, typically analysed using the Bradley-T erry mo del. A c hallenge in these studies is exp erimen tal design, specifically , determining the optimal pairs to compare to maximize sta- tistical efficiency . Constructing static exp erimen tal designs for these studies requires sp ectral decomp osition of a cov ariance matrix ov er pairs of pairs, which b ecomes computationally in- feasible for studies with a large n umber of ob jects. W e propose a scalable metho d based on reduced basis decomp osition that b ypasses explicit construction of this matrix, achieving computational savings of tw o to three orders of magnitude. W e establish eigenv alue b ounds guaran teeing approximation quality and characterise the rank structure of the design matrix. Sim ulations demonstrate speedup factors exceeding 100 for studies with 64 or more ob jects, with negligible appro ximation error. W e apply the method to construct designs for a 452-region spatial study in under 7 minutes, which w as not previously p ossible, and enable real-time de- sign updates for classro om p eer assessment, reducing computation time from 15 minutes to 15 seconds. 1 In tro duction Comparativ e judgemen t is a type of study that has b een widely used across the so cial sciences and h umanities. In its simplest form, study participants are shown ob jects and asked which ob ject has a higher quality . F rom these pairwise comparisons, a statistical mo del can b e used to estimate the quality of each ob ject and construct a rank ed ordering of the ob jects. F or example, in education research, comparative judgemen t studies hav e b een carried out with teachers comparing students’ mathematics homew ork based on which show ed a b etter understanding of fractions (Jones and Wheadon, 2015); in Linguistics, language learners hav e b een asked which of a pair of words in a foreign language was more difficult to learn (Bisson, 2022); and in one Philosophy study , participants were shown pairs of vehicles and asked which w as worse a violation of a sign that reads “no v ehicles in the park”, in order to understand rule-violations (T answell et al., 2023). The Bradley–T erry mo del (Bradley and T erry, 1952) is p erhaps the most commonly used statistical mo del to estimate the qualities of the ob jects in a comparativ e judgement study . ∗ Corresponding author: r.g.seymour@bham.ac.uk 1 This mo del assigns a quality parameter to each ob ject in the study and estimates the v alue of these parameters from the pairwise comparisons. One limitation of the Bradley–T erry mo del is the difficulty of generating an exp erimental design. The main exp erimen tal design element in a comparative judgement study is deciding which pairs of ob jects to ask participants ab out. Exp erimen tal designs can take the form of scheduling distributions, which are a distribution o ver all p ossible pairs of ob jects, and determine the probability each pair of ob jects is shown to the study participant. Constructing the scheduling distribution for comparative judgement studies requires us to mo del the dep endencies b etw een comparisons, necessitating the consid- eration of not just pairs of ob jects, but p airs of p airs of ob jects. This means the asso ciated matrices are prohibitively large, dense, and exhibit a non-standard structure. Indeed, many studies are simply to o large for current exp erimen tal design metho ds. A recent meta-analysis of 41 comparativ e judgemen t studies reported that 40% con tained more than 100 ob jects, while some citizen science studies hav e inv olved several thousand ob jects (Kinnear et al., 2025). W ell-designed exp eriments can substan tially reduce the amoun t of data required, making comparativ e judgemen t studies more feasible in practice. Exp erimental designs for the Bradley– T erry mo dels broadly fall into tw o categories: online designs (known as adaptive comparative judgemen t) and static designs that are constructed b efore the study b egins. P ollitt (2012) created an online exp erimen tal design, known as adaptive comparative judgement, where the ob jects featured in up coming comparisons are determined based on comparisons made earlier in the study . Adaptive designs ha ve come under criticism for tw o reasons. The first is that comparisons tow ards the end of the study are typically more difficult to make, as the adaptive design prioritises pairs that are close in qualit y (Jones and Davies, 2023). This can introduce an un wan ted study effect, where data collected later on in the study p eriod requires more effort to collect than data earlier on in the study . The second is that adaptive comparative judgement artificially inflates the reliability of the resulting parameter estimates (Bramley and Vitello, 2018). Additionally , a limitation of adaptive designs is that they are only based on the qualit y parameters, and do not take into account any prior information or cov ariates. W e fo cus on studies where the design is static and must be pre-calculated to account for sp ecific constrain ts. This includes scenarios inv olving prior information, such as spatial correlations b et ween ob jects, as w ell as sequential designs where the results of one round inform the sc heduling of the next. Examples of sequen tial designs include sp orting contests and educational p eer-assessmen t activities, where studen ts ev aluate w ork in distinct stages separated by other learning activities. Sev eral metho ds exist for creating static designs, but can only b e used for small studies or where no prior information is taken into account. Grasshoff and Sch wabe (2008) were able to analytically deriv e a static exp erimental design, but this is limited to studies with at most three ob jects. More recently , R¨ ottger et al. (2025) develop a metho d for constructing the D-optimal design, but not in a Bay esian framework. Seymour et al. (2025) developed a static design for studies where the ob jects are a priori correlated. This method creates a sc heduling distribution that specifies the probability of each pair of ob jects b eing compared. Ho wev er, constructing this distribution is computationally exp ensiv e and can only b e computed for studies with fewer than 150 ob jects, and it may take several hours or da ys to construct the distribution. These limitations come ab out b ecause we need to construct and decomp ose the large, dense matrix describing the correlation b etw een pairs of pairs of ob jects. W e develop a metho d that ov ercomes these computational barriers, allo wing us to construct the sc heduling distribution without constructing or decomp osing the pairs-of-pairs correlation matrix. This allows us to construct the sc heduling distribution in seconds or minutes, rather than hours, and for studies with several hundred ob jects, or even larger. This mak es creating exp erimen tal designs p ossible for a m uch wider range of so cial science studies, which either con tain a large num b er of ob jects, or are constrained by time and computational resources. 2 In Section 2 we describ e the Bradley–T erry mo del and the exp erimen tal design framework. Then in Section 3, w e develop a reduced basis decomposition metho d for approximating the design. W e prov e a relationship b et ween the true design and our approximation, b ounding its error and establishing conditions when the error is 0. In Sections 4 and 5, we apply our metho d to sim ulated and real data sets respectively , demonstrating the negligible error and considerable efficiency it provides. Finally , in Section 6, w e discuss the adv antages and limitations of our metho d, as well as how it could b e used to construct Bay esian D-Optimal designs. 2 The Bradley–T erry mo del W e now describ e the Bradley–T erry mo del and an exp erimental design for comparative judge- men t studies. Consider a study with N ob jects, where the qualit y of ob ject i is denoted λ i ∈ R , and large p ositiv e v alues of λ i corresp ond to high quality ob jects, and large negative v alues to low quality ob jects. Examples of this include educational studies, where the ob jects b eing compared are students’ coursework and the qualities represent the students’ understanding, or psyc holinguistic studies, where the ob jects are words in a foreign language and the qualities represen t how difficult they are to learn. 2.1 Lik eliho o d function and inference Consider a comparison b et ween ob jects i and j . In the Bradley–T erry mo del, the probability that ob ject i is judged to hav e a higher qualit y than ob ject j is defined as p ij = e λ i e λ i + e λ j ⇐ ⇒ logit( p ij ) = λ i − λ j . If ob ject i and j are compared n ij times, then the num ber of times ob ject i is judged to hav e a higher qualit y than j can b e mo delled using the Binomial distribution Y ij ∼ Bin( n ij , p ij ) . Giv en the vector of observe d comparisons y and the vector of ob ject q ualities λ , the lik eliho o d function is giv en by f ( y | λ ) = N Y i =1 i − 1 Y j =1 n ij y ij p y ij ij (1 − p ij ) n ij − y ij . (1) By Bay es’ theorem, the p osterior distribution is given b y π ( λ | y ) ∝ f ( y | λ ) π ( λ ). T o allow for prior correlation betw een the ob ject quality parameters and to allo w for an offline exp erimen tal design, we place a multiv ariate normal prior distribution on the quality parameters. This distribution is giv en by λ ∼ MVN( µ , C). The structure of the cov ariance matrix C is a mo delling choice and should reflect a priori assumptions ab out how the qualities of the ob jects are related. In some settings where data is collected in rounds, for example studen t’s abilities in educational assessments or sp orting teams quality in tournaments, the prior cov ariance matrix can b e constructed from the results of previous rounds (e.g. via the Hessian of the maximum likelihoo d estimates, or the p osterior co v ariance matrix). In contexts where there study items hav e cov ariate information, the co- v ariates can b e form the prior cov ariance structure, particularly if these are spatial cov ariates. Finally , in contexts where there is a natural prior ranking to the ob jects, this can b e included in a T o eplitz type structure, where the cov ariance b et ween items i and j depend on | i − j | . 3 2.2 Exp erimen tal design Static, or offline, exp erimen tal designs sp ecify in adv ance which pairs of ob jects will be com- pared during a study . The design takes the form of a probabilit y distribution o ver the set of all possible pairs, from which comparisons are sampled during data collection. W e formalise this as follo ws. Definition 1. A scheduling distribution is a pr ob ability distribution S over the set of al l p ossible p airs of obje cts { ( i, j ) : 1 ≤ i < j ≤ N } . The sche duling distribution assigns pr ob ability q ij to the p air ( i, j ) . During data c ol le ction, e ach c omp arison is dr awn indep endently fr om S , so that q ij r epr esents the pr ob ability that obje cts i and j ar e pr esente d to a judge for c omp arison. The scheduling distribution determines how comparisons are allo cated across pairs of ob- jects. The simplest approach is a uniform scheduling distribution, where q ij = 2 / [ N ( N − 1)] for all pairs, treating all comparisons as equally informative. Ho wev er, when prior information is a v ailable ab out the relationships b etw een ob jects, some comparisons may b e more informative than others. F or example, if tw o ob jects are known a priori to hav e similar qualities, compar- ing them may yield little new information ab out their relative ranking. An efficient scheduling distribution concentrates probabilit y mass on pairs that are exp ected to b e most informative, thereb y reducing the total num b er of comparisons required to achiev e a given level of precision in the qualit y estimates. The challenge in constructing an efficient sc heduling distribution lies in the dimensionality of the problem. Since the Bradley-T erry mo del relies on pairwise differences in quality parameters, w e must model the dep endencies betw een comparisons. This requires considering not just pairs of ob jects, but pairs of pairs of ob jects, leading to cov ariance matrices of dimension N ( N − 1) 2 × N ( N − 1) 2 . As N grows, constructing and decomp osing these matrices b ecomes computationally prohibitiv e. In this pap er, we fo cus on the design prop osed in Seymour et al. (2025). This is a principal comp onen t based design, where the scheduling distribution places higher probability on pairs of ob jects that explain higher prior v ariance. This design has b een sho wn to reduce the n um b er of comparisons that need to b e collected. Since the Bradley–T erry model relies on pairwise differences in quality parameters, w e can derive the distribution of these differences. This is deriv ed via an affine transformation of the prior distribution λ ∼ N ( µ , C ), yielding: λ diff ∼ N ( ν , ∆) . Here, the vector λ diff ∈ R N ( N − 1) / 2 consists of the quality differences for eac h pair of ob jects, suc h that the entry corresp onding to pair ( i, j ) is λ i − λ j for i < j , where the condition i < j is used solely to index unique pairs and do es not imply an ordering of the quality parameters. The vector ν represen ts the corresp onding differences in means, and ∆ ∈ R N ( N − 1) 2 × N ( N − 1) 2 is the cov ariance matrix capturing the dep endence structure b etw een pairwise comparisons. The en tries of ∆, representing the cov ariance b et ween tw o pairs ( i, j ) and ( k , l ), are given by: Co v ( λ i − λ j , λ k − λ l ) = Co v ( λ i , λ k ) − Cov( λ i , λ l ) − Cov( λ j , λ k ) + Cov( λ j , λ l ) . (2) W e p erform a spectral decomp osition of the cov ariance matrix suc h that ∆ = U Ψ U T , where Ψ is a diagonal matrix of eigenv alues and the columns of U con tain the corresp onding eigen vectors. W e order the eigenpairs { ψ ( c ) , u ( c ) } in descending order suc h that ψ ( c ) ≥ ψ ( c +1) ≥ 0, ensuring non-negativity as ∆ is p ositiv e semidefinite. The eigenv ectors { u ( c ) } form an orthogonal basis for R M , where each vector represents a principal comp onen t (Mardia et al., 1979). 4 In this framework, the c -th principal comp onent corresp onds to the direction explaining the maximum remaining v ariance of λ diff orthogonal to the preceding c − 1 comp onents. The prop ortion of the total v ariance explained b y the c -th comp onent is given b y ψ ( c ) / P d ψ ( d ) . Consequen tly , the term ( u ( c ) r ) 2 represen ts the contribution of the r -th v ariable (a sp ecific pair- wise difference) to the c -th principal comp onent. W e define the probability that the pair { i, j } is presented to a judge as: q ij = P c u ( c ) r 2 ψ ( c ) P d ψ ( d ) , (3) where r is the linear index of λ diff corresp onding to the pair ( i, j ), defined as r = N ( N − 1) 2 − ( N − i +1)( N − i ) 2 + j − i (assuming i < j ). This probability is equiv alent to the sum of the squared loadings for an ob ject risk parameter w eigh ted b y the eigenv alues, normalized by the total v ariance. The resulting set { q 1 , 2 , . . . , q N − 1 ,N } defines a probability distribution S o ver the set of all p ossible pairs, effectively assigning higher sampling mass to pairs exhibiting higher prior v ariance. A workflo w for the construction of S is sho wn in Algorithm 1. W e note that this Algorithm only provides information ab out which comparisons should b e collected and not how man y comparisons need to b e collected. This is still an area of active research in comparative judge- men t, how ever Kinnear et al. (2025) suggest that collecting ten times as many comparisons as there are items is required for reliable estimates for the quality parameters. Algorithm 1 Construction of scheduling distribution S Require: Ob jects { λ i } N i =1 , prior mean µ , prior cov ariance matrix C Output: Scheduling distribution S ov er all p ossible pairings 1: Construct the distribution λ diff ∼ N ( ν , ∆), where λ diff , µ ∈ R N ( N − 1) 2 and C ∈ R N ( N − 1) 2 × N ( N − 1) 2 . 2: Perform SVD on ∆ such that ∆ = U Ψ U T , where Ψ = diag ψ 1 , . . . , ψ N ( N − 1) 2 . 3: Return eigenpair { ψ i , U (: , i ) } N ( N − 1) 2 i =1 . 4: Compute the design probabilities q ij = P c ( u ( c ) r ) 2 ψ ( c ) P d ψ ( d ) . 3 Reduced basis decomp osition for the Bradley–T erry mo del Curren t static exp erimen tal designs b ecome infeasible for large N due to the quartic growth in memory and p olynomial gro wth in compute time. Because ∆ is a dense matrix of size N ( N − 1) 2 × N ( N − 1) 2 , it imp oses an O ( N 4 ) storage ov erhead. This volume renders standard PCA impractical with its O ( N 6 ) complexity (Jolliffe, 2011). F urthermore, ev en truncated v ariants suc h as randomized PCA (Eck art and Y oung, 1936; Halko et al., 2011) and Lanczos algorithms (Lehoucq et al., 1998) fail to sufficiently alleviate the cost, requiring O ( N 4 d ) op erations. T o address this, we prop ose a nov el computational framework to efficiently construct ∆ and com- pute its sp ectral decomp osition by exploiting the reduced basis decomp osition (RBD) metho d. Our approach has three main comp onents: 5 1. T o circumv en t the direct computation of eigenv alues for ∆, our efficien t construction metho d uses a large sparse matrix and the standard cov ariance matrix of { λ i } N i =1 to represen t ∆. This reduces the storage cost of ∆ from O ( N 4 ) to O ( N 2 ). F urthermore, this formulation not only exploits the low rank nature of ∆ for large N , but also allows its rank to be derived directly from the standard cov ariance matrix (section 3.4). 2. Our RBD-based transformation maps the large sparse matrix to a low-dimensional repre- sen tation, achieving an O ( N 3 d )( d ≤ N ) complexity for the sp ectral decomp osition of ∆. This constitutes a significant acceleration, outp erforming truncated PCA by one order of magnitude and standard PCA by tw o. 3. As shown in our theoretical analysis, the approximations satisfy an interlacing relation with the eigenv alues of ∆, ensuring a systematic approach tow ard the exact sp ectrum. F ull accuracy is captured when the num b er of iterations reaches N − 1. W e summarize our approach in algorithm 2 and elab orate on the individual steps in sec- tion 3.1–section 3.3. The theoretical analysis regarding accuracy , memory requirements, and computational costs is detailed in section 3.4. Algorithm 2 Reduced-basis sp ectral decomp osition of ∆ Require: Ob jects { λ i } N i =1 , target rank d Output: Approximation of the largest d eigenv alues and eigenv ectors of ∆ 1: Efficiently construct ∆ = E C E ⊤ , where C is the standard co v ariance matrix [Co v ( λ i , λ j )] N i,j =1 , and E is a sparse matrix; see section 3.1. 2: By RBD, E can b e approximated via e E = Y T , with Y ∈ R N ( N − 1) 2 × d con taining orthonormal columns, T ∈ R d × N ; see section 3.2. 3: Perform the SVD of the pro jected matrix e C = T C T ⊤ ∈ R d × d . Let the singular v alues of e C b e { σ i } d i =1 and the singular vectors b e the columns of V ∈ R d × d . The largest d eigenv alues of ∆ can b e approximated by { σ i } d i =1 , and the corresponding eigenv ectors can b e approximated b y Y V ; see section 3.3. 3.1 Efficien t construction of ∆ Let e i = (0 , 0 , . . . , 0 , 1 , 0 , . . . , 0) ∈ R 1 × N denote the i-th standard basis vector. Let C b e the co v ariance matrix of v ariables { λ s } N i =1 , where each entry is given by C sh = Cov( λ s , λ h ). By the definition of ∆ in eq. (2), we hav e Co v( λ i − λ j , λ k − λ l ) = e i C e ⊤ k − e i C e ⊤ ℓ − e j C e ⊤ k + e j C e ⊤ ℓ (4) = ( e i − e j ) C ( e k − e ℓ ) ⊤ , (5) where e k is the k − th standard basis vector and 1 ≤ i < j ≤ N , 1 ≤ k < ℓ ≤ N . Hence, ∆ can b e represented as the matrix pro duct: ∆ = E C E ⊤ (6) where E ∈ R N ( N − 1) 2 × N is the matrix whose rows are the vectors e i − e j , indexed consistently with the en tries of ∆. 6 3.2 Reduced-basis sp ectral decomp osition of E Note that E is sparse and sev erely ill-posed, which motiv ates the use of dimension-reduction tec hniques to construct an accurate low-dimensional surrogate. Among such techniques, the RBD is a state-of-the-art approach that is substantially more efficient than PCA/SVD-based metho ds, particularly when N is large. A further adv antage of RBD is the av ailability of an a p osteriori error estimator that quantifies the discrepancy betw een the reduced represen tation and the original high-dimensional data. Let d denote the num b er of iterations. Given a maximal reduced dimension d max satisfying d max ≤ rank( E ) ≤ N − 1 (see lemma 3.1), and a tolerance ε R go verning the admissible appro ximation error, the RBD pro cedure returns a basis matrix Y ∈ R N ( N − 1) 2 × d spanning the reduced space, along with a co efficien t matrix T ∈ R d × N . Here, d ≤ d max denotes the actual dimension of the compressed data. The approximation of E is then giv en by e E = Y T . (7) The basis matrix Y is constructed iteratively so that its column span pro vides increasingly accurate approximations to the column space of E . The pro cedure is initialized with either a randomly chosen column of E or a user-sp ecified vector. A t iteration k , giv en the current basis y 1 , . . . , y k , the next vector y k +1 is chosen b y scanning all columns of E and selecting the one whose pro jection on to span y 1 , . . . , y k yields the largest residual. This enrichmen t con tinues until either the maximal pro jection (or compression) error falls b elow the prescrib ed tolerance ε R or the dimension reaches d max . An additional computational b enefit of RBD lies in its offline–online decomp osition, whic h enables fast ev aluation of the error estimator once appropriate quantities ha ve b een precomputed. A complete description of the algorithm is giv en in algorithm 3. The RBD metho d is based on a greedy algorithm commonly used in mo del-reduction tec h- niques (Ngo c Cuong et al., 2005; Chen and Gottlieb, 2013; Rozza et al., 2008). It builds the reduced space dimension-b y-dimension: A t each step, the gr e e dy algorithm identifies the col- umn of E that is least well represen ted by the curren t reduced space and adds it as a new basis v ector. This choice is guided by a computable error indicator that measures the discrepancy b et ween each column of E and its pro jection onto the curren t reduced space. By repeatedly selecting the direction with the largest error, the algorithm ensures that the reduced basis im- pro ves systematically and targets the comp onen ts of E that are most difficult to appro ximate. 3.3 Eigenpairs appro ximation of ∆ Let e ∆ b e the approximation of ∆ via reduced-basis sp ectral decomp osition. Define e C = T C T ⊤ , (8) where C is the cov ariance matrix of { λ i } N i =1 and T is the co efficien t matrix in eq. (7). Then e ∆ = e E C e E ⊤ (9) = Y T C T ⊤ Y ⊤ (10) = Y e C Y ⊤ , (11) where Y ∈ R N ( N − 1) 2 × d is the basis matrix with orthonormal columns and T ∈ R d × N is the co efficien t matrix. Let the SVD of e C ∈ R d × d b e given by e C = V X V ⊤ , (12) 7 Algorithm 3 Reduced Basis Decomp osition ( Y , T ) = RBD( E , ε R , d max ) 1: Set d = 1, E cur = + ∞ , and i a random integer b et ween 1 and n . 2: while d ≤ d max and E cur > ε R do 3: ν = E (: , i ) 4: Apply the mo dified Gram-Schmidt (MGS) orthonormalization: 5: for j = 1 to d − 1 do 6: ν = ν − ( ν · ξ j ) ξ j 7: end for 8: if ∥ ν ∥ < ε R then 9: Y = Y (: , 1 : d − 1) 10: T = T (1 : d − 1 , :) 11: break 12: else 13: ξ d = ν ∥ ν ∥ 14: Y (: , d ) = ξ d 15: T ( d, :) = ξ ⊤ d E 16: end if 17: E cur = max j ∈{ 1 ,...,n } ∥ E (: , j ) − Y (: , 1 : d ) T (: , j ) ∥ 18: i = arg max j ∈{ 1 ,...,n } ∥ E (: , j ) − Y (: , 1 : d ) T (: , j ) ∥ 19: if E cur ≤ ε R then 20: Y = Y (: , 1 : d ) 21: T = T (1 : d, :) 22: else 23: d = d + 1 24: end if 25: end while where P = diag ( σ i ) d i =1 con taining eigev alues σ i and V ∈ R d × d is a unitary matrix of eigen- v ectors. Then e ∆ = Y V X V ⊤ Y ⊤ . (13) Since V ⊤ Y ⊤ Y V = I d (where I d is the identit y matrix), { σ i } d i =1 are the largest d eigenv alues of e ∆ and the columns of Y V form the corresp onding eigenv ectors. The remaining N − d eigen v alues of e ∆ are zero. 3.4 Theoretical analysis In this section, w e inv estigate the theoretical prop erties of the RBD appro ximation for the eigenpairs of ∆ in the Bradley–T erry mo del ov er d iterations. First, we present a theorem that sho ws the relation b etw een eigenv alues of ∆ and their approximations, eigenv alues of e ∆. 8 Theorem 1. L et { α i } N ( N − 1) 2 i =1 b e the eigenvalues of ∆ . L et { σ i } d i =1 b e the lar gest d eigenvalues of e ∆ , which appr oximate the lar gest d eigenvalues of ∆ . Both of them ar e sorted in non- incr easing or der. Then α i + N − d ≤ σ i ≤ α i (14) for i = 1 , . . . , d. Pr oof. After running d iterations (where d ≤ d max ≤ N ) of the RBD metho d (as defined in eq. (7)), w e obtain e E = Y T , (15) where Y ∈ R N ( N − 1) 2 × d has orthonormal columns and T ∈ R d × N is the co efficien t matrix. If w e keep running RBD for total N iterations, then E can b e represented as E = Y W T U , (16) where W ∈ R N ( N − 1) 2 × ( N − d ) has orthonormal columns and U ∈ R ( N − d ) × N . By eq. (6), eq. (8) and eq. (16), ∆ = Y W T U C T ⊤ , U ⊤ Y ⊤ W ⊤ (17) = Y W T C T ⊤ T C U ⊤ U C T ⊤ U C U ⊤ Y ⊤ W ⊤ (18) = Y W e C T C U ⊤ U C T ⊤ U C U ⊤ Y ⊤ W ⊤ . (19) By eq. (12) and eq. (13), { σ i } d i =1 are the eigenv alues of e C and the largest d eigenv alues of e ∆. By Cauc hy’s interlacing theorem (Bellman, 1997; Horn and Johnson, 2012; Parlett, 1998), α i + N − d ≤ σ i ≤ α i (20) for i = 1 , . . . , d . Next, we in tro duce a lemma to compute rank( E ) and then establish the consequen tial relation b etw een rank(∆) and rank( C ). Lemma 3.1. L et E ∈ R N ( N − 1) 2 × N b e the matrix in efficient c onstruction of ∆ in e q. (6) , define d as E ( N − i + 1)( N − i ) 2 + j − i, : = e i − e j (21) for 1 ≤ i < j ≤ N , wher e e k ∈ R 1 × N denotes the k -th standar d b asis ve ctor. Then rank( E ) = N − 1 , and Null( E ) = span( { 1 } ) with 1 = (1 , . . . , 1) ⊤ ∈ R N × 1 . Pr oof. Let v = ( v 1 , . . . , v N ) ∈ Null( E ). Then E v = 0 , and in particular each row of E yields ( e i − e j ) ⊤ v = 0 , v i = v j for i = j ∈ { 1 , . . . , N } . Th us, Null( E ) = span { 1 } and rank( E ) = N − dim(Null( E )) = N − 1. 9 Theorem 2. L et 1 b e the ve ctor of al l ones in R N × 1 . L et ∆ and C b e define d as above. If 1 ∈ range( C ) , then rank(∆) = rank( C ) − 1 . Otherwise, rank(∆) = rank( C ) . Pr oof. Since co v ariance matrix C is symmetric semi-p ositive definite, let C = LL ⊤ b e the Cholesky Decomposition of C , where L ∈ R N × N is a low er triangular matrix with non-negativ e diagonal entries. Then range( C ) = range( L ) (22) By eq. (6), ∆ = E L ( E L ) ⊤ . (23) Th us, by eq. (22) and eq. (23), rank(∆) = rank( E L ) (24) = dim range( L ) − dim Null( E ) \ range( L ) (25) = dim range( C ) − dim Null( E ) \ range( C ) . (26) If 1 ∈ range( C ), by lemma 3.1, range( C ) T Null( E ) = span { 1 } . Then rank(∆) = dim range( C ) − dim span { 1 } (27) = rank( C ) − 1 . (28) If 1 / ∈ range( C ), by lemma 3.1, range( C ) T Null( E ) = ∅ . Then rank(∆) = rank( C ) . (29) Corollary 3. If rank( C ) = N , rank(∆) = N − 1 . Remark 1. While ∆ is a p ositive semi-definite matrix, it is typic al ly low-r ank when N is lar ge. The eigenvalues of ∆ , denote d by α k , satisfy the or dering: α 1 ≥ · · · ≥ α rank( C ) − 1 > 0 , (30) with α k = 0 for al l k ≥ rank( C ) + 1 . In addition, running the RBD metho d for N − 1 iter ations is sufficient to ac cur ately c aptur e al l eigenvalue s of ∆ . Finally , we analyze the computational and storage cost. The sparse matrix E is constructed in O ( N 2 ) flops. The RBD pro cess on E , performed o ver d iterations, requires O ( N 2 d 2 ) for MGS and O ( N 2 d 2 + N d 3 ) for error calculation. Since d ≤ N − 1, the entire cost for RBD is O ( N 2 d 2 ). The construction of e C and its SVD require O ( N d 2 ) flops. Th us, the ov erall cost of our algorithm is O ( N 2 d 2 ). F or the storage requirements, the sparse matrix E ∈ R N ( N − 1) 2 × N con tains N ( N − 1) non- zero elemen ts, resulting in a storage cost of O ( N 2 ) for its efficien t representation. The algorithm m ust also store several other matrices: C ∈ R N × N , Y ∈ R N ( N − 1) 2 × d , T ∈ R d × N , e C ∈ R d × d , the singular v alues { σ i } d i =1 , and the matrix Y V ∈ R N ( N − 1) 2 × d .Assuming N is large, the storage requiremen t is dominated by the matrices Y and Y V . Therefore, the total storage cost of the prop osed algorithm is O ( N 2 d ). 10 3.5 Implemen ting the metho d Our workflo w to obtain the approximate scheduling distribution e S directly from C is shown in Algorithm 4. This metho d a voids constructing ∆. An R routine to construct the scheduling distribution using the RBD metho d can b e found at https://github.com/HiddenHarmsHub/ RBD- for- CJ- Design . Algorithm 4 Construction of approximate scheduling distribution e S using RBD Require: Ob jects { λ i } N i =1 Output: Approximate scheduling distribution e S ov er all p ossible pairings 1: Construct a prior mean vector µ and prior cov ariance matrix C , and place a distribution on λ ∼ N ( µ , C ). 2: Construct the reduced basis decomp osition of ∆ from C using Algorithm 2 to obtain the ap- pro ximate eigenpair { σ i , Y V (: , i ) } d i =1 . 3: Compute the approximate design probabilities ˜ q ij = P c ( yv ( c ) r ) 2 σ ( c ) P d σ ( d ) . 4 Empirical results In this section, the standard and appro ximate algorithms (Algorithms 1 and 4 respectively) are used to generate the standard and approximate scheduling distributions under a range of conditions. W e ev aluate the sp eed and accuracy of the RBD based metho d compared to the standard metho d. 4.1 Scalabilit y in size of study The computational viability of experimental designs for the Bradley–T erry model is hea vily dep enden t on the num b er of ob jects, N , as the size of the required cov ariance matrix ∆ gro ws quadratically with N . T o demonstrate the scalability of our proposed Reduced Basis Decomp osition framework, we perform a comparative sim ulation study against the baseline metho d of computing ∆ and then p erforming SVD. W e simulate scenarios with increasing N , ranging from small-scale studies ( N = 8) to high-dimensional cases ( N = 128) where standard decomp osition techniques typically b ecome in tractable. T o inv estigate the use of the metho d for different kinds of prior cov ariance struc- tures, w e simulate different co v ariance matrices. The first is a Graph Laplacian cov ariance structure, where w e simulate an Erd˝ os–R ´ enyi graph with N no des and the probability of an edge b eing placed b etw een tw o no des p = 0 . 5, i.e. G ( N , 0 . 5). W e used p = 0 . 5 to ensure the re- sulting graphs are sufficien tly connected, while retaining enough sparsit y to be non-trivial. The Graph Laplacian matrix is given b y C = ( D − A + I ) − 1 , where A is the adjacency matrix. This enforced smo othness b et ween the study ob jects and can b e used in Gaussian Marko v Random Fields. The second is a T o eplitz cov ariance matrix, where C ij = 0 . 5 | i − j | , which can b e used where there is a prior autoregressive or ordering assumption. The final cov ariance structure is a Inv erse-Wishart distribution with the identit y matrix I as the scale matrix, which represents studies where there is weakly informative prior information. F or structure, w e normalise the resulting matrix b y C ′ = D − 1 2 C D − 1 2 , where D is a diagonal matrix containing the elements on the diagonal of C . This allows us to provide a more fair comparison b et ween simulations, as the v ariance of each ob jects’ quality is the same. 11 F or each v alue of N , w e generate 100 cov ariance matrices of each structure and calculate the scheduling distribution S using the standard metho d in Algorithm 1 and the approximate sc heduling distribution e S using the RBD metho d in Algorithm 4. In T able 1, w e sho w the computation time (in seconds) for b oth the standard and RBD metho ds. W e see considerable efficiency gains for the RBD metho d across of study sizes and cov ariance structures. The effi- ciency gains increase with the study size, where studies with 128 ob jects, we see a considerable impro vemen t for the RBD metho d, which takes around 2 seconds compared to ov er 4 minutes with the standard metho d. F or studies with 64 ob jects and under, in even the slow est sim ula- tions, it takes under a second to compute the approximate scheduling distribution with RBD, compared to ov er 10 seconds in the b est p erforming sim ulations for the standard metho d. W e also see that the time taken for the RBD metho d is consistent, with little v ariation in the time tak en for sp ecific v alues of N or cov ariance structure. Fitting a log-log linear mo del to the time taken and the N , suggests that the time taken for the RBD metho d dep ends on N 2 . 81 , which is similar to the theoretical results derived in the previous section. F or the standard metho d, the time tak en depends on N 4 . 24 . W e also generate 100 netw orks from a G (512 , 0 . 5) mo del and construct the corresp onden t cov ariance matrices using the graph Laplacian approach. Using the RBD metho d the mean time taken to construct the approximate scheduling distribution is 23 minutes. W e are unable to construct the true scheduling distribution using the standard metho d, but predict it will take 11.5 days. T able 1: Performance Comparison Across Cov ariance Structures in seconds RBD Standard Structure N Median (Min, Max) Median (Min, Max) Laplacian 8 0.0008 (0.0007, 0.0015) 0.0025 (0.0023, 0.0106) 16 0.0023 (0.0021, 0.0088) 0.0378 (0.035, 0.0583) 32 0.0100 (0.0095, 0.0155) 0.660 (0.637, 1.17) 64 0.11 (0.0995, 0.578) 11.3 (10.6, 12.0) 128 2.17 (1.60, 3.19) 251 (227, 1080) T o eplitz 8 0.0008 (0.0007, 0.0012) 0.0027 (0.0024, 0.0149) 16 0.0025 (0.0023, 0.0086) 0.0376 (0.0337, 0.0431) 32 0.0077 (0.0075, 0.0115) 0.533 (0.515, 0.834) 64 0.112 (0.102, 0.609) 11.5 (11.0, 11.9) 128 2.46 (1.79, 3.41) 276 (247, 317) In verse Wishart 8 0.0009 (0.0008, 0.00160) 0.0027 (0.0025, 0.0132) 16 0.0023 (0.0022, 0.00250) 0.0375 (0.0338, 0.0417) 32 0.0078 (0.0075, 0.008) 0.537 (0.530, 0.856) 64 0.111 (0.0949, 0.578) 11.7 (10.8, 14.8) 128 2.22 (1.74, 3.04) 418 (254, 486) W e also see a considerable improv ement for the RBD metho d in Figure 1, which shows the ratio of the time tak en to compute the design probabilities using the standard to the RBD metho d. F or all cov ariance structures, when there are 64 ob jects or more in the study , the RBD metho d is 100 times faster than the standard metho d. Finally , we compute the the Kullback-Leibler (KL) divergence for each metho d. F or the sc heduling distribution S computed via the standard metho d, and the approximate scheduling 12 (a) Laplacian Matrix Time Comparison (b) T o eplitz Matrix Time Comparison (c) In verse Wishart Distribution Time Comparison Figure 1: Comparison of speed up of the RBD metho d compared to the standard method for studies with different num b ers of ob jects (N) in. The subfigures show (a) Laplacian, (b) T o eplitz, and (c) In verse Wishart. Note the y-axes are on the log scale. distribution e S computed via the RBD metho d, the KL divergence is given by D K L ( S || e S ) = N X i =1 X j
Original Paper
Loading high-quality paper...
Comments & Academic Discussion
Loading comments...
Leave a Comment