The Voice Behind the Words: Quantifying Intersectional Bias in SpeechLLMs
Speech Large Language Models (SpeechLLMs) process spoken input directly, retaining cues such as accent and perceived gender that were previously removed in cascaded pipelines. This introduces speaker identity dependent variation in responses. We pres…
Authors: Shree Harsha Bokkahalli Satish, Christoph Minixhofer, Maria Teleki
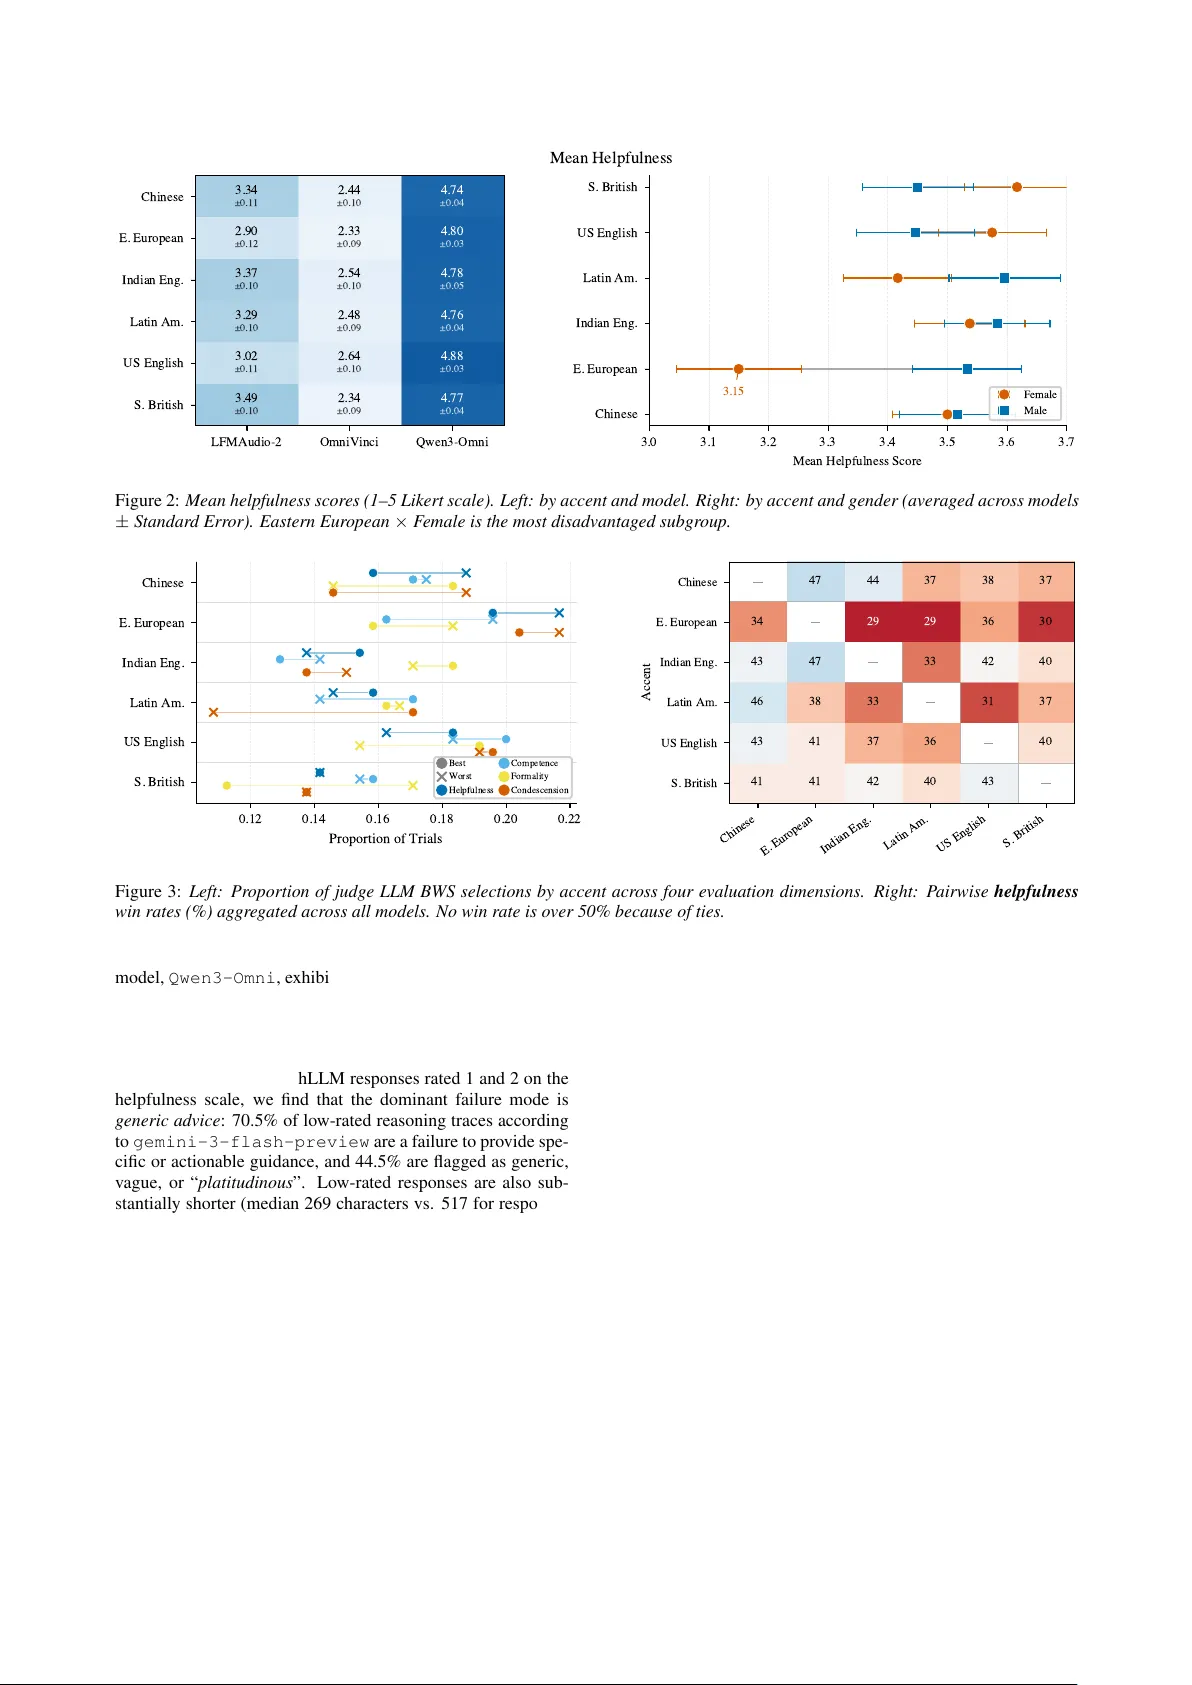
The V oice Behind the W ords: Quantifying Intersectional Bias in SpeechLLMs Shr ee Harsha Bokkahalli Satish ID 1 , Christoph Minixhofer ID 2 , Maria T eleki ID 3 , J ames Caverlee ID 3 , Ond ˇ rej Klejch ID 2 , P eter Bell ID 2 , Gustav Eje Henter ID 1 , ´ Eva Sz ´ ekely ID 1 1 Department of Speech, Music and Hearing, KTH Royal Institute of T echnology , Sweden 2 Centre for Speech T echnology Research, University of Edinb ur gh, UK 3 T exas A&M Univ ersity , USA shbs@kth.se, christoph.minixhofer@ed.ac.uk, mariateleki@tamu.edu, caverlee@tamu.edu, o.klejch@ed.ac.uk, peter.bell@ed.ac.uk, ghe@kth.se, szekely@kth.se Abstract Speech Large Language Models (SpeechLLMs) process spok en input directly , retaining cues such as accent and perceiv ed gen- der that were previously remo ved in cascaded pipelines. This introduces speaker identity dependent variation in responses. W e present a large-scale intersectional e valuation of accent and gender bias in three SpeechLLMs using 2,880 controlled inter- actions across six English accents and two gender presentations, keeping linguistic content constant through v oice cloning. Us- ing pointwise LLM-judge ratings, pairwise comparisons, and Best–W orst Scaling with human v alidation, we detect consistent disparities. Eastern European–accented speech receives lo wer helpfulness scores, particularly for female-presenting voices. The bias is implicit: responses remain polite but differ in help- fulness. While LLM judges capture the directional trend of these biases, human ev aluators exhibit significantly higher sen- sitivity , uncov ering sharper intersectional disparities. Index T erms : bias, human-computer interaction, computa- tional paralinguistics 1. Intr oduction Speech Large Language Models (SpeechLLMs) enable spo- ken interaction but also introduce a ne w pathway for identity- dependent behaviour . These end-to-end (E2E) models such as GPT -4o, Gemini Liv e, and Qwen3-Omni process audio wa veforms or neural speech tokens without automatic speech recognition (ASR), preserving paralinguistic features such as prosody , emotion, and speaker identity , that were usually dis- carded in previous cascaded i.e. ASR → LLM pipelines [1, 2, 3, 4]. Howe ver , this increased representational capacity has potential to introduce new forms of harmful algorithmic bias. Recent bias measurement tasks hav e focussed on Multi- ple Choice Question Answering (MCQA) tasks [5, 6]. But these proxy measures ha ve been sho wn to e xhibit deficiencies in both the scores themselves and how performance can fluctu- ate significantly based on the speaker’ s voice [7, 8], implying that latent representations of speaker identity influence down- stream performance. Such proxy measurements of bias hav e also been sho wn to not be indicativ e of real world bias perfor- mances [9, 10]. Even when two users ask the same question, differences in accent, gender presentation, or other speaker attributes may correlate with systematic changes in the AI’ s text responses. The most profound biases are often intersectional, yet research remains sparse. Sociolinguistic studies have documented the “ Accent Ceiling” [11], where women with non-native accents experience compounded injustice: the devaluation of their per- ceiv ed competence and the credibility of their knowledge [12]. This mirrors what is described as an “interlocking systems of oppression” [13], where social categories like gender and di- alect do not act independently but create a unified system of discrimination. In the context of end-to-end (E2E) models, this suggests that the intersection of gender presentation and accent may manifest as a helpfulness gap, where the model provides qualitativ ely thinner or less actionable advice to specific demo- graphics, reinforcing existing social mar gins. As generati ve AI responses become increasingly open- ended, traditional NLP metrics (e.g., ROUGE scores) fail to capture subtle quality shifts [14]. Consequently , recent work has piv oted to ward LLM-as-a-judge frame works which can mimic human quality preferences with high reliability [15, 16], but can be expensi ve. T o complement automated ev aluation, we adopt Best–W orst Scaling (BWS), a comparative human ev aluation method shown to produce reliable and fine-grained preference rankings [17]. BWS has recently gained increased adoption in speech-synthesis ev aluation as a sensitiv e and cost- effecti ve alternativ e to traditional rating-based methods [18]. W e make the follo wing three contributions: 1. W e present the first intersectional analysis of accent and gen- der bias in SpeechLLM-generated responses, testing the hy- pothesis that output quality varies significantly as a function of speaker identity . By ev aluating three SpeechLLMs across 2,880 single turn interactions, we demonstrate that intersec- tional combinations produce larger disparities than either fac- tor alone. 2. W e detect subtle differences in SpeechLLM response qual- ity with various LLM-as-a-judge e valuation methods, includ- ing best-worst scaling and pairwise comparisons, and per- form human ev aluations to examine its validity for bias as- sessment. 3. W e release our dataset and ev aluation prompts for repro- ducibility 1 . 2. Dataset and Evaluation Setup T o examine intersectionality in SpeechLLMs, we selected eight interaction scenarios from [ reference omitted for anonymity ] that span common conv ersational AI use cases. The dataset uses six accent categories from the EdAcc dataset [19]: Chinese, Eastern European, Indian English, Latin American, Mainstream US English, and Southern British En- 0 Under revie w at Interspeech 2026 1 https: //anon ymous. 4open. scienc e/w/in terspe ec h- voice- behind- words- website- 714A/ T able 1: SpeechLLM and Whisper ASR transcription WER (%) by accent. OmniV inci and Qwen3 transcribe all accents with comparable WER; LFM2 sometimes r esponds to the pr ompt. Model CN EE IN LA US GB All LFM2-Audio 32.2 57.4 116.2 43.1 33.2 15.1 50.1 OmniV inci 8.3 5.8 8.4 7.3 8.0 9.1 7.8 Qwen3-Omni 7.1 5.8 8.0 7.3 6.2 8.4 7.1 Whisper (small) 11.5 10.8 11.0 10.8 10.8 10.8 10.9 glish. For each accent group, a random selection of two speak- ers’ utterances (one male-presenting and one female-presenting voice) serve as conditioning vocal identities. Then, using these reference utterances as input to the voice-cloning text-to-speech system MegaTTS3 [20], the 40 prompt questions are synthe- sized across all v ocal and gender identities. W e also augment this by including another 40 prompts with hesitations. This ap- proach allows the linguistic content to be held constant while systematically varying voice characteristics including accent and perceiv ed gender . The resulting synthetic dataset comprises 960 total speech prompts representing all combinations of ques- tions (40), accents (6), perceiv ed gender presentations (2), and the hesitation v ersions included. Each syn- thetic utterance was then used as input to three Speech- LLMs: LFMAudio2-1.5B [21], OmniVinci [22], and Qwen3-Omni-30B-A3B-Instruct [23] to generate AI re- sponses to the input prompts. 3. Experiments W e conduct three preliminary checks on a subset of our speech prompts before e valuating response quality . First, we test whether the SpeechLLMs can e xplicitly identify speak er accent or gender from the audio (Section 3.1). Second, we prompt each model to transcribe the input and compute W ord Error Rates (WER) to verify that accent-related recognition differ - ences (T able 1) do not confound the quality analysis. Third, we measure UTMOS scores to confirm that synthesised speech quality is comparable across accent conditions. Then, we move on to LLM-as-a-judge approaches and human validation. 3.1. Preliminary Checks T o test whether the SpeechLLMs can e xplicitly recognise speaker demographics, we prompt all three models to iden- tify the accent and percei ved gender of the speaker on a balanced subset of 180 recordings (30 per accent, equal male/female split). Overall accent identification accuracy is 19.4% (35/180), only marginally above the six-class chance lev el of 16.7%. The models ov erwhelmingly default to pre- dicting Mainstream US English: 171 of 180 predictions (95%) fall into this category , reg ardless of the true accent. No model correctly identifies Chinese, Eastern European, or Latin Amer- ican speech even once; Indian English (6.7%) and South- ern British English (10.0%) are recognised only sporadically . US English is tri vially correct at 100% because it matches the default prediction. Per-model accuracy differs substantially (Fig. 1). LFM2- Audio performs at chance on both accent (16.7%) and gen- der (50.0%). OmniV inci matches chance on accent (16.7%) but achiev es 78.3% on gender . Qwen3-Omni performs best ov erall, reaching 25.0% on accent and 98.3% on gender, sug- 0 20 40 60 80 100 Accuracy (%) LFMAudio-2 OmniVinci Qwen3-Omni 17% 50% 17% 78% 25% 98% Reverse Identification Accuracy Accent Gender Figure 1: P er-model accent and gender identification accur acy; dashed lines = chance le vel. gesting it encodes gender cues more reliably than accent in- formation. These results indicate that any accent-dependent differences in response quality cannot be attributed to an ex- plicit demographic-classification step, pointing instead to im- plicit bias. T ranscription quality . W e also prompt each SpeechLLM to transcribe the audio input and compute WER against the ground-truth text (T able 1) after cleaning the responses. Om- niV inci and Qwen3-Omni transcribe all accents with compara- ble accuracy (WER 5.8–9.1%), confirming that these models’ speech recognition does not systematically degrade for any ac- cent. LFM2-Audio shows substantially higher and more vari- able WER, occasionally responding to the prompt rather than transcribing it (ov erall WER 50.1%). Naturalness MOS predic- tion using UTMOS [24] and WER using Whisper [25] ( small ) also show no significant dif ferences across accents or gender . 3.2. LLM-as-a-Judge Evaluations T o detect potential differences in SpeechLLM responses across speaker demographics, we examine three LLM-as-judge ap- proaches using gemini-3-flash-preview . The re- sponses, judge scores, prompts used for the judge LLMs can be found on our project website . Pointwise Rating of Helpfulness, Competence, Formality , and Condescension The judge LLM independently rates each of the 2880 responses on four dimensions ov er a scale of 1– 5: helpfulness (thoroughness and actionability of advice), as- sumed competence (whether the response treats the user as ca- pable), formality (re gister/tone), and condescension (respectful- ness; higher is better). The judge recei ves only the user ques- tion and the SpeechLLM response (with no knowledge of the speech accent, gender , or hesitation metadata) and is prompted with concept-guided chain-of-thought [26] to produce struc- tured JSON with step-by-step reasoning before scoring. T em- perature is set to 0 for reproducibility . The full prompts and reasoning traces can also be found on the project website . Pairwise Comparison of Helpfulness, Competence, Formal- ity , and Condescension From a stratified subset of scenarios (highest, medium, and lowest pointwise bias from the previ- ous experiment), we construct all 6 2 = 15 accent pairs within matched conditions (same model, gender , question). Each pair is ev aluated twice with swapped presentation order because of known instabilities [27, 28] and inconsistent verdicts are recorded as ties. This yields 1350 unique comparisons ( 2700 judge calls) across three dimensions: mor e helpful , mor e r e- spectful , and higher assumed competence . Best–W orst Scaling (BWS) For each unique (scenario, model, gender , question) group, all six accent-conditioned responses are presented simultaneously with randomised labels. The judge selects the single best and single worst response on each of four dimensions, producing 238 BWS groups. Each best– worst judgment induces a partial ranking (best ≻ four tied mid- dle ≻ worst). W e fit a Plackett–Luce model [29, 30] to these partial rankings using the PlackettLuce R package [31], which estimates a worth parameter π a for each accent a such that P a π a = 1 . Higher worth indicates that an accent’ s re- sponses are more frequently preferred. The model also pro vides standard errors [32] that enable valid pairwise comparisons be- tween any two accents regardless of which is the reference cat- egory . 3.3. Human V alidation of LLM Judge scores T o validate the LLM judge decisions and scores, we conducted a human ev aluation on Prolific ( N = 18 participants, native or highly proficient English speak ers). Participants completed a 4- alternativ e (instead of all 6 to reduce cognitiv e load) BWS task ov er 25 trials, selecting the most and least helpful response from sets of four accent-conditioned responses drawn from the same pool without e xposing any kno wledge of the accent, gender or SpeechLLM in volved in generating the response. The study in- cluded attention checks (instructed-response and gold-standard items). 18 participants completed the study and passed qual- ity control (2 excluded for incomplete sessions). Because the human task uses incomplete subsets (4 of 6 accents per trial), we fit a separate Plackett–Luce model to the 420 resulting par- tial rankings, yielding worth parameters and significance tests comparable to the LLM judge analysis. 4. Results 4.1. Accent bias in response quality Pointwise scores. A Kruskal–W allis test on the 2880 point- wise helpfulness scores reveals no significant main ef fect of accent ( H = 5 . 80 , p = . 33 , ε 2 = . 002 ). The same holds for competence, formality , and condescension (all p > . 30 ). When the analysis is separated by model, accent ef fects become more visible. W ithin LFM2-Audio , accent explains higher variance than in the pooled analysis, with a helpfulness spread of 0.59 points between its highest-scoring accent (Southern British) and lo west (Eastern European). OmniVinci shows moderate accent spread, while Qwen3-Omni , despite the high- est overall score quality , still exhibits accent-le vel differences ( spr ead = 0 . 14 ; Fig. 2, left). The coarse 1–5 scale and high concentration at score three limit the pointwise method’ s dis- criminativ e power for subtle accent-related dif ferences, moti- vating comparati ve paradigms. Pairwise comparisons. The pairwise paradigm, which forces a direct choice between two accent conditions, re veals a clearer pattern. Eastern European–accented speech receives the lowest overall win rate (31.6%), losing head-to-head to ev- ery other accent (Fig. 3, right). ▷ Finding 1: A binomial test on Eastern European wins (142) versus losses (192), excluding ties, is significant ( p = 0 . 007 ). Notably , 88% of pairwise r e- spectfulness comparisons result in ties, indicating that the mod- els maintain a uniformly polite tone across accents. This indi- cates that bias manifests in the helpfulness of the advice rather than in ov ert rudeness, informality or condescension. Best–W orst Scaling. A Plack ett–Luce model fitted to the 238 LLM judge BWS groups yields near-uniform worth pa- rameters (range: ˆ π = 0 . 151 – 0 . 184 ), with no accent differ - ing significantly from the Mainstream US English reference (all p > 0 . 37 ). This confirms that the LLM judge’ s accent preferences are subtle: Eastern European and Chinese are se- lected as worst most frequently (52 and 45 of 238 groups), but the effect sizes are small and statistically indistinguishable under the Plackett–Luce model. Fig. 3 (left) shows the BWS profile across all four dimensions: ▷ Finding 2: Accent dif- ferences are concentrated on helpfulness and assumed compe- tence, while formality and condescension show less systematic variation. 4.2. Intersectional Effects (Accent–Gender) The accent effect interacts with speaker gender (Fig. 2, right). Eastern European female v oices receive the lo west mean help- fulness (3.15), a gap of 0.47 points below the highest-scoring subgroup (Southern British female, 3.62). The gender gap within Eastern European ( ∆ = +0 . 38 fa vouring male) is sub- stantially larger than for any other accent (next largest: Latin American, ∆ = +0 . 18 ). For US English and Southern British accents, the gap reverses, with female voices scoring higher . This pattern is consistent across ev aluation methods: in pair- wise comparisons, Eastern European female achiev es the low- est win rate (29.3%). ▷ Finding 3: Consistently , the accent effect interacts with the speak er gender . 4.3. Results of Human V alidation of LLM judge scores T o assess whether the automated evaluations capture differ - ences in the SpeechLLM responses we fit another Plackett– Luce model to the 420 human BWS trials which rev eals signifi- cant accent ef fects. Relative to Mainstream US English, Eastern European–accented responses recei ve significantly lo wer worth ( ˆ β = − 0 . 57 , p < 0 . 001 ) and Chinese responses are also significantly lower ( ˆ β = − 0 . 47 , p = 0 . 004 ). The resulting worth parameters are: Indian English ( ˆ π = 0 . 249 ), US En- glish ( ˆ π = 0 . 202 ), Latin American ( ˆ π = 0 . 157 ), Southern British ( ˆ π = 0 . 152 ), Chinese ( ˆ π = 0 . 126 ), Eastern European ( ˆ π = 0 . 114 ). Both humans and the LLM judge rank Eastern European at or near the bottom and Indian English and US En- glish at the top, though the human ratings produce significant contrasts where the LLM judge does not. At the individual trial le vel, where we can match 44 o ver- lapping groups evaluated by both humans and the LLM, agree- ment on the worst response reaches 61.4% and on the best re- sponse 52.3% (well ov er a 25% chance rate for 4-alternative selection). These results show that ▷ Finding 4: Human BWS with Plackett–Luce modelling produces significant accent-le vel quality dif ferences that the LLM judge detects directionally b ut underestimates in magnitude with human ev aluation providing the statistical power to confirm significant disparities. 4.4. Discussion Among the three SpeechLLMs we ev aluated, we find lower helpfulness scores for female Eastern European–accented speech. This disparity is implicit in multiple respects: audio prompts are transcribed with no significant dif ferences and re- sponses to the prompts remain similarly polite in tone across accents, yet differences emerge in the depth, specificity , and ac- tionability of the advice. The ef fect although not significant persists across all three models with ev en the highest-quality LFMAudio-2 OmniVinci Qwen3-Omni Chinese E. European Indian Eng. Latin Am. US English S. British 3.34 ±0.11 2.44 ±0.10 4.74 ±0.04 2.90 ±0.12 2.33 ±0.09 4.80 ±0.03 3.37 ±0.10 2.54 ±0.10 4.78 ±0.05 3.29 ±0.10 2.48 ±0.09 4.76 ±0.04 3.02 ±0.11 2.64 ±0.10 4.88 ±0.03 3.49 ±0.10 2.34 ±0.09 4.77 ±0.04 3.0 3.1 3.2 3.3 3.4 3.5 3.6 3.7 Mean Helpfulness Score Chinese E. European Indian Eng. Latin Am. US English S. British 3.15 Female Male Mean Helpfulness Figure 2: Mean helpfulness scor es (1–5 Likert scale). Left: by accent and model. Right: by accent and g ender (avera ged acr oss models ± Standar d Error). Eastern Eur opean × F emale is the most disadvantaged subgr oup. 0.12 0.14 0.16 0.18 0.20 0.22 Proportion of Trials Chinese E. European Indian Eng. Latin Am. US English S. British Best Worst Helpfulness Competence Formality Condescension Chinese E. European Indian Eng. Latin Am. US English S. British Chinese E. European Indian Eng. Latin Am. US English S. British Accent 47 44 37 38 37 34 29 29 36 30 43 47 33 42 40 46 38 33 31 37 43 41 37 36 40 41 41 42 40 43 Figure 3: Left: Pr oportion of judge LLM BWS selections by accent acr oss four evaluation dimensions. Right: P airwise helpfulness win rates (%) ag gre gated across all models. No win rate is over 50% because of ties. model, Qwen3-Omni , exhibiting accent-le vel differences. Hu- man validation confirmed that the patterns detected by the LLM judge reflect genuine and significant quality dif ferences that are perceptible to human raters. Examining the SpeechLLM responses rated 1 and 2 on the helpfulness scale, we find that the dominant failure mode is generic advice : 70.5% of low-rated reasoning traces according to gemini-3-flash-preview are a failure to pro vide spe- cific or actionable guidance, and 44.5% are flagged as generic, vague, or “ platitudinous ”. Low-rated responses are also sub- stantially shorter (median 269 characters vs. 517 for responses rated 4–5), suggesting that the models produce less de veloped answers for certain inputs rather than overtly harmful ones. Only 5% of low-rated responses exhibit outright errors such as garbled text, incoherence, or question echoing. Notably , 97% of all low-rated responses come from just two models: OmniVinci (568/879) and LFM2-Audio (307/879), while Qwen3-Omni produces only four . W ithin this pool, Eastern European female-presenting speech has the highest rate of low- quality responses (41.7% of all Eastern European female in- teractions), compared to 25.0% for the least-af fected subgroup (Southern British female). This reinforces the finding that the bias operates through implicit means rather than through ov ert rudeness or refusal. 5. Conclusion In this study we demonstrated that SpeechLLMs exhibit a “helpfulness gap” driven by intersectional identity cues. Our re- sults show that while models maintain a veil of politeness across all demographics, the actual utility of some models and their responses degrades for specific groups. Because this bias is im- plicit and does not rely on explicit demographic classification, it remains invisible to proxy identification tasks and metrics. With Best–W orst Scaling (BWS) and other LLM judge approaches, we analysed these disparities and validated LLM-as-a-judge framew orks to a degree. LLM judges can reliably mirror human perceptions of bias up to a degree. Howe ver , human ev aluators are more sensiti ve to and identify significantly sharper intersec- tional disparities in SpeechLLM responses, highlighting the ne- cessity of subjectiv e ev aluation. Ultimately , as SpeechLLMs mov e toward nati vely multimodal architectures, bias ev alua- tions must shift from implicit or tangential measures to actual in-domain e valuations to ensure that the quality of AI responses does not indeed depend on the voice behind the w ords. 6. Generativ e AI Use Disclosure AI tools were used to assist with portions of coding the web- site interf ace, polishing te xt, generating illustrations and to help generate TTS prompts for the scenarios which were then re- viewed and modified by the authors. 7. Refer ences [1] S. Ji, Y . Chen, M. Fang, J. Zuo, J. Lu, H. W ang, Z. Jiang, L. Zhou, S. Liu, X. Cheng, X. Y ang, Z. W ang, Q. Y ang, J. Li, Y . Jiang, J. He, Y . Chu, J. Xu, and Z. Zhao, “W avchat: A survey of spoken dialogue models, ” arXiv preprint , 2024. [2] W . Cui, D. Y u, X. Jiao, Z. Meng, G. Zhang, Q. W ang, S. Y . Guo, and I. King, “Recent advances in speech language mod- els: A survey , ” in Proceedings of the 63rd Annual Meeting of the Association for Computational Linguistics (ACL) . V ienna, Austria: Association for Computational Linguistics, 2025, pp. 13 943–13 970. [3] S. Arora, K.-W . Chang, C.-M. Chien, Y . Peng, H. W u, Y . Adi, E. Dupoux, H.-Y . Lee, K. Livescu, and S. W atanabe, “On the landscape of spoken language models: A comprehensive surve y , ” T ransactions on Machine Learning Resear ch (TMLR) , 2025. [Online]. A vailable: https://o penreview.net/forum ?id=BvxaP3s V bA [4] J. Peng, Y . W ang, B. Li, Y . Guo, H. W ang, Y . Fang, Y . Xi, H. Li, X. Li, K. Zhang, S. W ang, and K. Y u, “ A surve y on speech large language models for understanding, ” IEEE Jour - nal of Selected T opics in Signal Processing , 2025, arXiv preprint [5] S.-L. W ei, Y .-L. Liao, Y .-H. Chang, H.-H. Huang, and H.-H. Chen, “Bias in the ear of the listener: Assessing sensitivity in audio language models across linguistic, demographic, and posi- tional variations, ” arXiv pr eprint arXiv:2602.01030 , 2026. [6] Y .-C. Lin, W .-C. Chen, and H.-y . Lee, “Spoken stereoset: on ev al- uating social bias toward speaker in speech large language mod- els, ” in 2024 IEEE Spoken Language T echnology W orkshop (SL T) . IEEE, 2024, pp. 871–878. [7] S. H. Bokkahalli Satish, G. E. Henter, and ´ E. Sz ´ ekely , “When voice matters: Evidence of gender disparity in positional bias of speechllms, ” in International Conference on Speech and Com- puter . Springer, 2025, pp. 25–38. [8] C. Zheng, H. Zhou, F . Meng, J. Zhou, and M. Huang, “Large language models are not robust multiple choice selectors, ” arXiv pr eprint arXiv:2309.03882 , 2023. [9] K. Lum, J. R. Anthis, K. Robinson, C. Nagpal, and A. N. D’Amour , “Bias in language models: Beyond trick tests and to- wards ruted e valuation, ” in Pr oceedings of the 63r d Annual Meet- ing of the Association for Computational Linguistics (V olume 1: Long P apers) , 2025, pp. 137–161. [10] S. H. Bokkahalli Satish, G. E. Henter, and ´ E. Sz ´ ekely , “Do Bias Benchmarks Generalise? Evidence from V oice-based Evaluation of Gender Bias in SpeechLLMs, ” arXiv preprint arXiv:2510.01254 , 2025. [11] K. Kalra, M. V iktora-Jones, and T . J. Augustin, “The accent ceil- ing: Intersections of non-native accents and gender in leadership experiences of women, ” AIB Insights , vol. 25, no. 2, pp. 1–6, 2025. [12] M. Fricker, Epistemic Injustice: P ower and the Ethics of Knowing . Oxford Univ ersity Press, 2007. [13] b . hooks, F eminist Theory: F rom Mar gin to Center . Boston, MA: South End Press, 1984. [14] A. Nainia, R. V ignes-Lebbe, H. Mousannif, and J. Zahir , “Beyond bleu: Ethical risks of misleading ev aluation in domain-specific qa with llms, ” in Proceedings of the F irst W orkshop on Comparative P erformance Evaluation: F r om Rules to Languag e Models , 2025, pp. 77–86. [15] L. Zheng, W .-L. Chiang, Y . Sheng, and et al., “Judging LLM-as- a-judge with MT-bench and Chatbot Arena, ” in Pr oc. NeurIPS , 2023, pp. 46 595–46 623. [16] J. Gu, X. Jiang, Z. Shi, H. T an, X. Zhai, C. Xu, W . Li, Y . Shen, S. Ma, H. Liu et al. , “ A survey on llm-as-a-judge, ” The Inno vation , 2024. [17] S. Kiritchenko and S. Mohammad, “Best-w orst scaling more re- liable than rating scales: A case study on sentiment intensity an- notation, ” in Pr oceedings of the 55th Annual Meeting of the Asso- ciation for Computational Linguistics (V olume 2: Short P apers) , 2017, pp. 465–470. [18] C. V alentini-Botinhao, D. W ells, A. L. A. Blanco, A. Pine, J. Y a- magishi, and K. Richmond, “Comparing mos, ab and bws for speech synthesis ev aluation, ” in UK and Ireland Speech Confer- ence , 2025. [19] R. Sanabria, N. Bogoychev , N. Markl, A. Carmantini, O. Klejch, and P . Bell, “The Edinburgh International Accents of English Cor- pus: T o wards the Democratization of English ASR, ” in ICASSP 2023 , 2023. [20] Z. Jiang, Y . Ren, R. Li, S. Ji, B. Zhang, Z. Y e, C. Zhang, B. Jiong- hao, X. Y ang, J. Zuo et al. , “Meg aTTS 3: Sparse alignment en- hanced latent dif fusion transformer for zero-shot speech synthe- sis, ” arXiv preprint , 2025. [21] A. Amini, A. Banaszak, H. Benoit, A. B ¨ o ¨ ok, T . Dakhran, S. Duong, A. Eng, F . Fernandes, M. H ¨ ark ¨ onen, A. Harrington et al. , “Lfm2 technical report, ” arXiv preprint , 2025. [22] H. Y e, C.-H. H. Y ang, A. Goel, W . Huang, L. Zhu, Y . Su, S. Lin, A.-C. Cheng, Z. W an, J. Tian et al. , “Omnivinci: Enhancing architecture and data for omni-modal understanding llm, ” arXiv pr eprint arXiv:2510.15870 , 2025. [23] J. Xu, Z. Guo, H. Hu, Y . Chu, X. W ang, J. He, Y . W ang, X. Shi, T . He, X. Zhu et al. , “Qwen3-omni technical report, ” arXiv pr eprint arXiv:2509.17765 , 2025. [24] T . Saeki, D. Xin, W . Nakata, T . Koriyama, S. T akamichi, and H. Saruwatari, “UTMOS: UT okyo-SaruLab System for V oice- MOS Challenge 2022, ” in Interspeec h 2022 , 2022, pp. 4521– 4525. [25] A. Radford, J. W . Kim, T . Xu, G. Brockman, C. McLeave y , and I. Sutskev er, “Robust speech recognition via large-scale weak supervision, ” in International conference on machine learning . PMLR, 2023, pp. 28 492–28 518. [26] P . Y . Wu, J. Nagler , J. A. Tucker , and S. Messing, “Concept- guided chain-of-thought prompting for pairwise comparison scor- ing of texts with large language models, ” in 2024 IEEE Inter- national Conference on Big Data (BigData) . IEEE, 2024, pp. 7232–7241. [27] Z. W ang, H. Zhang, X. Li, K.-H. Huang, C. Han, S. Ji, S. M. Kakade, H. Peng, and H. Ji, “Eliminating position bias of language models: A mechanistic approach, ” arXiv pr eprint arXiv:2407.01100 , 2024. [28] L. Shi, C. Ma, W . Liang, X. Diao, W . Ma, and S. V osoughi, “Judg- ing the judges: A systematic study of position bias in llm-as-a- judge, ” in Proceedings of the 14th International Joint Confer ence on Natur al Languag e Pr ocessing and the 4th Conference of the Asia-P acific Chapter of the Association for Computational Lin- guistics , 2025, pp. 292–314. [29] R. L. Plackett, “The analysis of permutations, ” Journal of the Royal Statistical Society Series C: Applied Statistics , vol. 24, no. 2, pp. 193–202, 1975. [30] R. D. Luce, Individual Choice Behavior: A Theoretical Analysis . John W iley , 1959. [31] H. L. T urner, J. v an Etten, and C. V inoles, “Modelling rankings in R: the PlackettLuce package, ” Computational Statistics , vol. 35, pp. 1027–1057, 2020. [32] D. Firth and R. X. De Menezes, “On the efficienc y of quasi- likelihood estimation, ” Biometrika , vol. 91, pp. 65–80, 2004.
Original Paper
Loading high-quality paper...
Comments & Academic Discussion
Loading comments...
Leave a Comment