Change point analysis of high-dimensional data using random projections
This paper develops a novel change point identification method for high-dimensional data using random projections. By projecting high-dimensional time series into a one-dimensional space, we are able to leverage the rich literature for univariate tim…
Authors: Yi Xu, Yeonwoo Rho
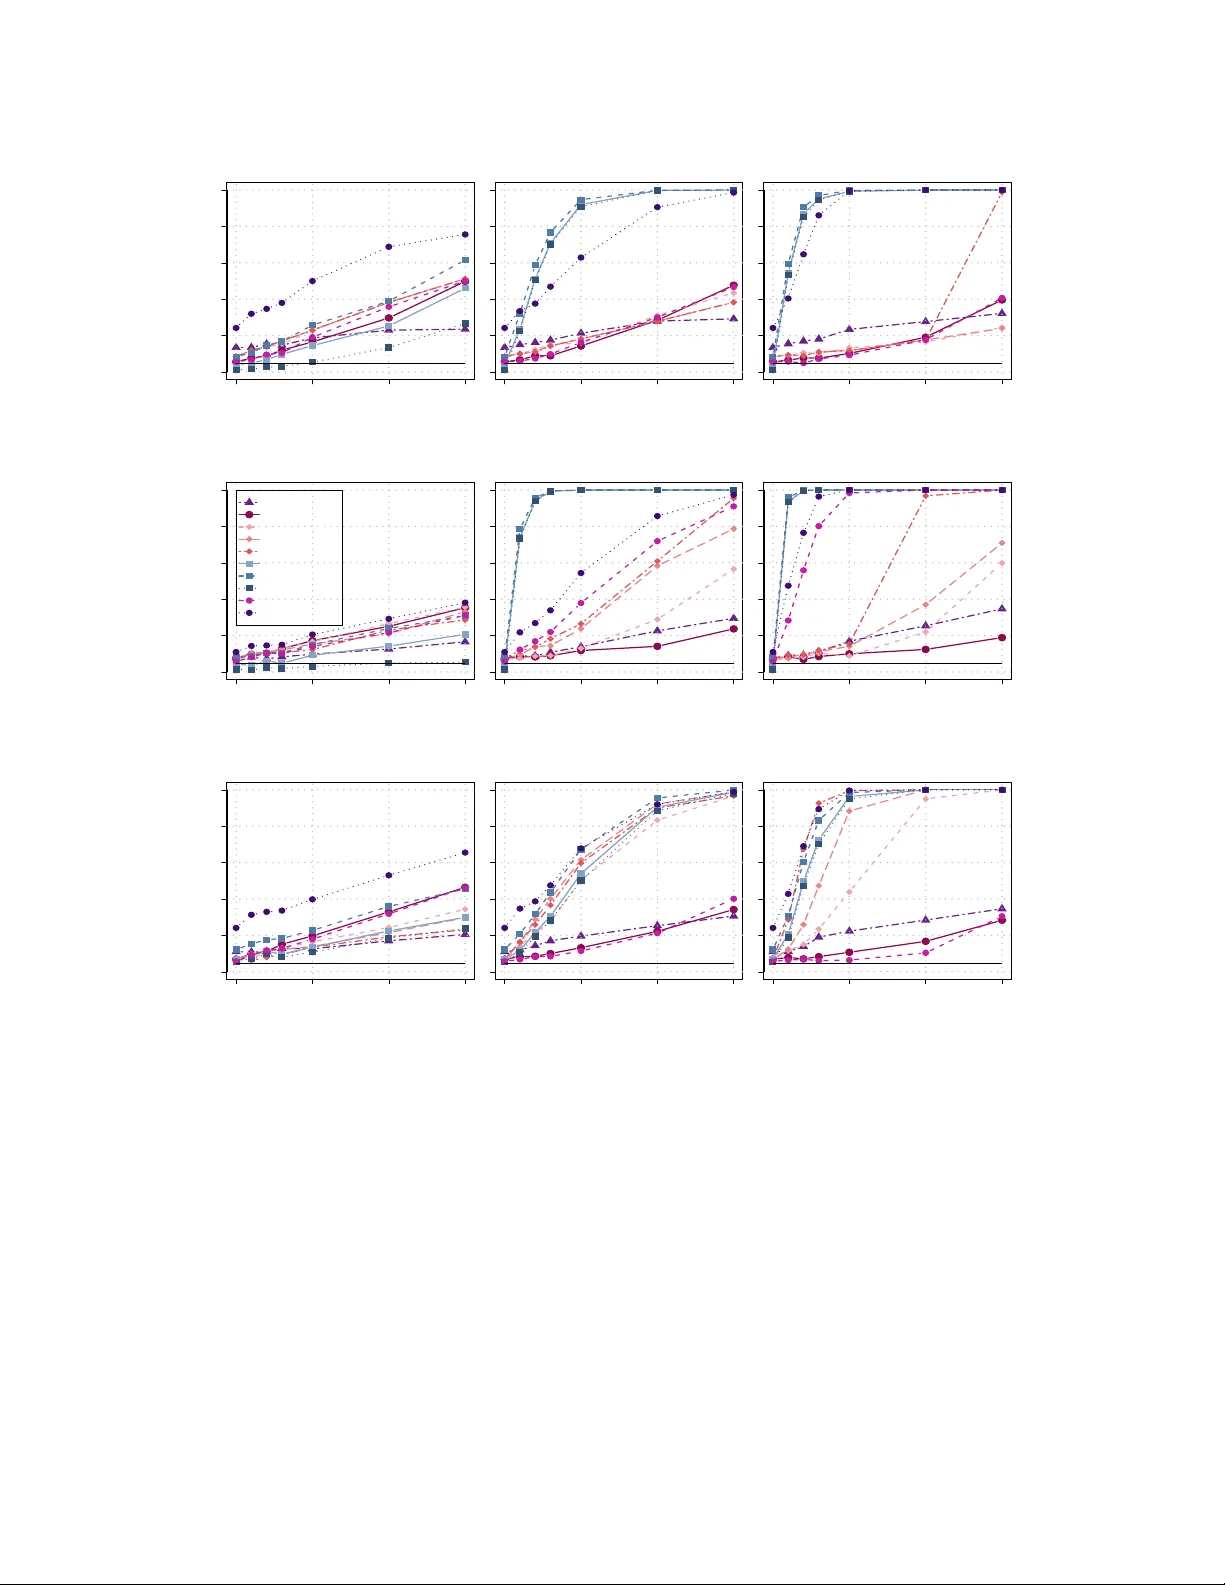
Change p oin t analysis of high-d i mensional data using random pro jections Yi Xu and Yeonwoo Rho 1 Department of Mathematical Sciences, Mic hig an T echnological Universit y F ebr ua ry 24, 2026 Abstract This pap er develops a nov el change p oi nt identification metho d for high-d i m en s ional d ata using random pro jections. By pro jecting high-dimensional time series into a one-dimensional sp ace, we are able to leverage the rich literature for univ ariate time series. W e prop ose applying random pro jections multiple times and then combining the univar iate test results u sing existing m u ltiple comparison methods. Simulati on results suggest that the prop osed metho d tends to h a ve b etter size and p o wer, with more accurate lo cation estimation. At th e same time, random pro jections may introduce va riability in th e estimated locations. T o enh ance stabilit y in practice, we recommend repeating th e procedure, and using the mo de of the estimated lo cations as a guide for the fi n al change p oint estimate. An application to an A ustralian temp erature dataset is presented. This study , though limited to the single change p oin t setting, d emonstrates th e usefulness of random pro jections in c h ange point analysis. Keywor ds— Change p o int ana lysis; High-dimensional data; Rando m pro jections; CUSUM; p-v alue co mbi- nation metho d 1 In tro d uction Change point detection plays a crucial r ole in science b y identif y ing shifts in the underlying dynamics of a s y stem. While change p oint ana ly sis has b een extensively s tudied in low-dimensional settings (e.g., Cs¨ org¨ o and Horv´ ath ( 1997 ); Aue and Horv´ ath ( 2013 ); Horv´ ath and Rice ( 2014 ); Aminikhanghahi and Co ok ( 2017 )), recent adv ances in the ability to co llect a nd s tore high-dimensional data in tro duce new challenges. F or instance, functional magnetic resonance imaging data in neuroscience ( Aston a nd Kirch , 2012b ), S& P 500 companies’ sto ck pr ices in finance ( Horv´ ath et al. , 201 4 ; Jir ak , 2015 ), and daily temp eratures ov er deca des in clima te studies ( Aue et al. , 2018 ) can all be high-dimensional. Detecting the precise timing of dynamic shifts in such high-dimens io nal da ta has increasingly attracted attention in the litera ture. See Liu et al. 1 Author of Correspondence: Y. Rho (yrho@mt u. edu) 1 ( 2022 ) for an extensive review of existing change p oint detection metho ds acros s different high-dimensional settings. Current change po int detection metho ds for high- dimensional data can b e br o adly divided in to tw o ca t- egories: pro jection-based appro aches and fully functional metho ds. Pro jection-based appro aches r e ly on classical univ ariate change point to ols, such as CUSUM ( Page , 1 954 , 1955 ) with no or minimal mo difica - tions and inv olve s o me form o f dimension reduction. The first type reduces dimensions b efore a pplying a CUSUM tes t. The F unct ional Principa l Comp onent (FPC) analy sis pro jects onto a few leading direc- tions that c apture the ma jor ity of v ariance ( Berkes et al. , 2009 ; Aue et al. , 2 009 ; Asto n and Kirch , 20 12a ) while o thers seek a single pro jectio n direction a ligned the most with the change ( W ang and Sam worth , 2018 ; Aston and K irch , 20 18 ). CUSUM-t yp e s tatistics ar e then applied to the pro jected data. The other t y pe a pplies the CUSUM tests comp onent-wise b efore the dimension reductio n. The CUSUM statistics are then aggrega ted using sum, max, or other suitable norms ( Bai , 2010 ; Horv´ ath and Hu ˇ sko v´ a , 2012 ; Chan et al. , 20 13 ; Jira k , 2015 ; Cho , 2016 ; Enikeev a and Harchaoui , 2 019 ; Liu et al. , 202 0 ; Y u a nd Chen , 2021 ; W a ng et al. , 2022 ; W ang and F eng , 20 23 ). While these appro a ches leverage well-established univ ariate to ols, reducing the data to o ne or a few dimensio ns may lo o se informa tion if the pro jection do es not fully capture the structure o f the change. F or insta nce, the FPC-ba sed tec hnique c a nnot consistently detect the change if the mean brea k function is or tho gonal to the directio n of FP Cs ( Aue et al. , 2 018 ). F ully-functiona l metho ds ( Horv´ ath et al. , 2014 ; Aue et al. , 2018 ; Dette et al. , 202 0 ) ar e r elatively free of such pro jection-induced limitations. Ho wev er, they ass ume the underlying signal is sufficiently smo o th, which may limit their applicability to certa in types of data . These metho ds req uir e a smo othing step since observ ations a re often only on discrete g rids, a nd improp er smo othing can negatively affect r e sults. F o r example, using to o few basis functions for densely observed data may remov e high-frequency v ariations ( Jiao et al. , 2 0 22 ), while using to o many basis functions can pr o duce excessively large cov ariance matrices, leading to slow computation. In this paper, we prop ose a no vel pro jection-based c hang e point detection algorithm for high-dimensional data with a sing le c ha nge point, based on r andom pro jections. Rando m pro jection is a p opular dimension- reduction to ol ( Bing ham and Mannila , 20 0 1 ; Dasg upta , 2 013 ). While Asto n and Kirch ( 2018 ) co nsider ran- dom pro jections in the cont ext of change p oint detection for hig h-dimensional data, only one random pro jec- tion is conside r ed, whic h is prop osed to b e used as the low er benchmark when measuring efficienc y of c ha nge po int detection metho ds. Howev er, random pro jections cannot ca pture the changes in the origina l dimension unless la rge enough num b er s o f them are inv olved - one random pro jection is certa inly not enough. This pa- per prop o s es to aggr egate across m ultiple random pro jections. An ensemble of man y random pr o jections and prop er aggr egation capture s the change in the o riginal dimension, avoiding the p ossible loss of infor mation 2 that is common in other pro jection-based approa ches. Our metho d do es not suffer fr om the limitatio ns of the fully functiona l approaches, either, without requiring the smoothness assumption nor the basis functions. Our approach may not fully exploit the dimensionality reductio n pr op erty of random pro jectio ns , as it can require the sa me o r e ven a grea ter num b er of pro jections than the origina l dimension ( Lee et al. , 20 05 ). Nevertheless, o ur pap er shall demonstr a te that rando m pro jections still pr ovide a v alua ble framework for change ana lysis. Adapting r andom pro jections to change p oint a nalysis in volves many choices: pro jection directions and their num b er, the univ a r iate change p o int tests, and the ag g regatio n pro cedure. A guideline of s uch choices are provided through extensive simulations, where size a nd pow er of global tests as well as accura cy o f locatio n estimates ar e explored. F or the univ ar ia te change p oint tests, cumulativ e sum (CUSUM) tests ( Page , 1 954 ) and its v ariants ar e considered in our simulations. Agg regation methods include the classical approaches, such as Bonferroni’s correction ( Bonferroni , 1936 ) a nd Benjamini–Ho ch b erg procedur e ( Benjamini and Ho ch b er g , 1995 ), as well a s more recently pro po sed p -v a lue combination techniques suc h as harmonic mean p ( Wilson , 2019 ). In addition, random pro jections ma y int r o duce high v ar iability in the lo cation estimation. W e pro po se to rep ea t the random pro jection-CUSUM-aggregatio n pro cedure multiple times for s tability . The adv a ntages of the prop osed metho d can b e summarized a s follows. Firs t, using random pro jections , our metho d is easy to implement, taking adv a ntage o f the ric h literature and computational ease of univ ariate time series. Second, compared to other pro jection-based metho ds, which heavily re ly o n the quality of selected directions, our metho d do es eliminates the need for explor ation o f optimal pro jection direction and the p ossible information loss due to dimension reduction. Thir d, our metho d do es not rely on the functional framework, which req uir es smo o th functions. The remainder of the pap er is o rganized as follows. W e introduce the pro p osed metho d in Section 2 . Section 3 presents sim ula tion res ults: par ameter choices are discussed in Subsection 3.1 , and compariso n with other existing metho ds a re presented in Subs e c tion 3.2 . Subsection 3.3 demonstrates the ability to correctly capture change lo ca tions despite the v ar ia bility introduced by r andom pro jectio ns, when o ur metho d is rep eatedly a pplied. Section 4 illustra tes the applications to an Australian temp era ture data. Section 5 is the co nclusion. 2 Random pro jection c hange p oin t detection metho d Let x t = ( X t 1 , . . . , X tp ) T be a p -dimensional time s eries. Our in ter e s t is to detect a change point in the mean vectors such that E ( x 1 ) = E ( x 2 ) = · · · = E ( x z ∗ ) 6 = E ( x z ∗ +1 ) = · · · = E ( x n ), where z ∗ denotes a p ossible 3 (unknown) ch ange p oint lo cation, and z ∗ = ⌊ θn ⌋ , θ ∈ (0 , 1). The time ser ies x 1 , . . . , x n are mo de le d by: x t = µ + δ 1 { t > z ∗ } + ε t , 1 ≤ t ≤ n, (2.1) where µ ∈ R p is a base line mean vector, δ ∈ R p is the change in the mean vector after z ∗ . W e denote R p as a space of p -dimensional vectors of real num b ers . 1 { t > z ∗ } is an indicator function which ma ps t to one if t > z ∗ and to zero if t ≤ z ∗ . W e a re interested in a hypothes is testing regarding the break v ec to r δ : H 0 : δ = 0 v er sus H A : δ 6 = 0 . (2.2) F or the p - dimens io nal er rors ε t = ( ε t 1 , . . . , ε tp ) T , any weak stationa rity a s sumption would work. Here, we present the linea r pro ce s s assumption, following Aston a nd Kirch ( 20 1 8 ), where the random b ehaviors o f a ra ndomly pro jected time ser ies is explored: Assumption 2.1 (Linear pro cess) . The err or se quenc e ε t = ( ε t 1 , . . . , ε tp ) T is a line ar pr o c ess of the form ε t = ∞ X l =0 ψ l e t − l , wher e { e t } t ∈ Z is an indep endent and identic al ly distribute d (i.i.d .) se quenc e with E ( e t ) = 0 , V ar( e t ) = 1 and E ( | e t | 2+ δ ) < ∞ for some δ > 0 . The c o efficients ψ l = ( ψ 1 ,l , . . . , ψ p,l ) T satisfy ∞ X l =0 ψ 2 j,l < ∞ , j = 1 , . . . , p. Our metho d is or g anized into tw o steps, the rando m pro jections (RP) step a nd the univ aria te change po int tests (CUSUM) and their combination step, a s outlined b elow. Algorithm 1 RP method for a sing le mean c ha ng e p oint detection Input: Or iginal data: X ∈ R n × p , Num b er of random pro jections: k , Output: E stimated change po int lo cation: ˆ z ∗ ∈ [1 , n ] , Combined p -v alue: p comb . Steps: 1. [RP ] Perform rando m pro jections Y = X D = ( y 1 , . . . , y k ) ∈ R n × k , where elements of D a re drawn from distribution ( 2.3 ). 2. [CUSU M a nd Combination] Apply a univ ariate CUSUM tes t to y r = ( y 1 ,r , . . . , y n,r ) T , 1 ≤ r ≤ k . Compute the adjusted p -v alues p ad j ( r ) , a nd the combin e d p -v alue p comb = min 1 ≤ r ≤ k p ad j ( r ) . Let ˆ z ∗ = arg max ⌊ nτ ⌋≤ z ≤ n −⌊ nτ ⌋ T z , ˜ r in eq ua tion ( 2.5 ), wher e ˜ r = arg min 1 ≤ r ≤ k p ad j ( r ) . 4 2.1 Step 1: RP Step The first step is to a pply RP to a p -dimensional time ser ies X = ( x 1 , . . . , x n ) T ∈ R n × p to obtain k univ ar ia te time series Y = 1 √ k X D = ( y 1 , . . . , y k ) ∈ R n × k , where D = ( d 1 , . . . , d k ) ∈ R p × k contains the k random directions. Here, the r th direction is denoted b y d r = ( d 1 ,r , . . . , d p,r ) T ∈ R p , 1 ≤ r ≤ k , and the r th pro jected time ser ies by y r = ( y 1 ,r , . . . , y n,r ) T ∈ R n , where y t,r = 1 √ k x T t d r , 1 ≤ t ≤ n . The RP pr eserves pa irwise distance to ce rtain a ccuracy ( Johnson and Lindenstrauss , 1984 ; Arriag a and V empala , 1 999 ). Intuitiv ely , the pro jected time serie s also pr eserve useful informa tio n ab out the mea n change and the stationarity of the original time series if δ T d r 6 = 0 b ecause E ( y t,r | d r ) = E ( 1 √ k x T t d r | d r ) = 1 √ k E ( x T t ) d r = 1 √ k µ T d r , t ≤ z ∗ , 1 √ k ( µ + δ ) T d r , t > z ∗ . There are t wo choices to make in this first step: the way to generate rando m directions and the num b er of pr o jections. F o r the ra ndom directions , several a pproaches hav e b een pro p o sed to genera te the entries d j,r for 1 ≤ j ≤ p , 1 ≤ r ≤ k in the direc tio n matrix D . Arriaga and V empa la ( 1999 ) pr op ose tw o metho ds. One option is selecting the ent ries d j,r independently from a s ta ndard no r mal distributio n. Another option is selecting elements indep endently from a discrete distribution, where d j,r = 1 with pr obability 1 2 and d j,r = - 1 with probability 1 2 . In fact, Arriaga a nd V empala ( 1999 ) prov e that the elemen ts d j,r can be drawn independently fro m any dis tr ibution with a mean of zero and a b ounded fourth moment. Ac hlio ptas ( 2003 ) argues that having spa rse d is also acceptable, prop os ing “spar se r andom pro jections ,” where the entries d j,r are indep endent ra ndom v ariable s fo llowing a proba bility distribution: d j,r = √ 3 1 with pr ob ability 1 / 6 , 0 with pr ob ability 2 / 3 , - 1 w ith pr ob ability 1 / 6 . (2.3) As Ac hlio ptas ( 2003 ) explains, a “threefold sp eedup” can b e achieved using this spa rse d , which r andomly drops tw o-thir ds of the or iginal data. T o further r educe computational co st, Li et al. ( 20 0 6 ) prop ose “very sparse random pro jections ” which requires only 1 /b of the original da ta to b e pr o cessed, where b ∈ Z a nd b ≫ 3. While a la r ger b spee ds the computation up sig nifica ntly , Li et al. ( 2006 ) notice that hig her spa rsity increases the v ar iance of the pairwise distanc e s of pr o jected data, po in ting out tha t using b < 3 can achiev e smaller v ariability than a lar ge b . In o ur appro ach, we follow Ac hlio ptas ( 2003 ), setting b = 3, to ba lance betw een computational cost and stability . F or the num b er of pro jections, a theor etical b o und is provided in 5 the Johnso n-Lindenstrauss (JL) lemma ( Johnson a nd Lindens tr auss ( 198 4 )), which aims to preserve pairwise distances. How ever, Bingham a nd Mannila ( 2001 ) ac hieve satis fa ctory empirical p erfo rmance us ing far few er pro jections than the J L b ound sug gests. O ur simulation results in Subsection 3.1 with sample s ize n = 50 also r eveal that using a relatively small num b e r of pro jections, k = 200, can already achiev e hig h a ccuracy . The la rger the signal-to-no is e ratio is, the s maller the n umber of random pro jections is needed. 2.2 Step 2: CUSUM and Com bination Step The second step is to a pply an ex isting univ aria te change p oint test on each pro jected time s eries y r = ( y 1 ,r , . . . , y n,r ) T , r = 1 , . . . , k , and then comb ine the k tests with a p -v alue combination metho d. There ar e t wo c hoices to ma ke in the se c o nd step: the type o f univ ar iate change po int test and the t y p e of p -v alue combination method. W e first discuss the type of univ ar iate change p oint tes t. Theorem 3.1 of Aston a nd Kirch ( 2018 ) prov es that, g iven a random direction d r independent of { ε t : 1 ≤ t ≤ n } , under Assumption 2.1 a nd H 0 , n Z n,r ( x ) ˆ σ : 0 ≤ x ≤ 1 | d r o D [0 , 1] − − − − → n B ( x ) : 0 ≤ x ≤ 1 o a.s., where Z n,r ( x ) = 1 √ n P ⌊ nx ⌋ t =1 y t,r − ⌊ nx ⌋ n P n t =1 y t,r , ˆ σ is a consistent es tima tor of the long-run v ar iance of the pro jected series, and B ( x ) is a standard Br ownian bridg e . This theorem justifies the use o f classica l change po int detection metho ds for univ a riate time series, suc h as the standard cumulative sum (CUSUM) test ( Page , 1954 ) and its v ar iants, to the RP-pro jected data . A weight ed version o f the CUSUM ( Cs¨ or g¨ o and Hor v´ ath , 1993 , 19 9 7 ) applies a weigh t function to stabilize the v ar iance, often a ttaining hig her p ow er in detecting early o r late change p oints as explained in Aue and Horv´ ath ( 2013 ). Other CUSUM-based tests can also be cons ide r ed, we refer rea ders to r e views in Aue and Horv´ ath ( 20 1 3 ) and Horv ´ a th and Rice ( 2014 ). Our simulations in Subsection 3.1 suggests tha t the standard or w eighted CUSUM per form the best, when combined with RP , in terms of size a nd p ow er . W e write the sta ndard and weigh ted CUSUM statistics as T s z ,r = 1 ˆ σ z Z n,r z n and T w z ,r = 1 ˆ σ z √ n z ( n − z ) n 2 − 1 2 z X t =1 y t,r − z n n X t =1 y t,r = 1 ˆ σ z r n z ( n − z ) z X t =1 y t,r − z n n X t =1 y t,r , (2.4) resp ectively . The details on ˆ σ z will b e discussed in Subsection 3.1 . In what follows, T z ,r shall denote either T s z ,r or T w z ,r . F or the p -v alue combination method, t wo cla ssical metho ds are illustrated here: the Bonferr oni (Bonf ) ( Bonferroni , 1 936 ) and Be nja mini and Ho chberg ( 199 5 ) (BH) metho ds . Denote p r , r = 1 , . . . , k , b y the 6 p -v alues o f the univ ariate change p oint tests of the pro jected data, and p (1) , . . . , p ( k ) by their ordered ver- sion from s mallest to la rgest. The Bonferro ni- and BH-adjusted p -v alues are p Bonf ad j ( r ) = k p r , and p BH ad j ( r ) = min { 1 , min r ≤ h ≤ k { kp ( h ) h }} , resp ectively . The global null is rejected when p ad j ( r ) is less tha n the s ig nificance level. While other p -v alue combination metho ds can also b e consider ed, such as Wilson ( 2 019 ); Liu and Xie ( 2020 ), but the adv antage of Bo nf and BH is that the ident ific a tion of significa nt test is stra ightf orward. Change lo cations ar e identified as follows. W e firs t identify the pro jected da ta that leads to the lar g est change, or equiv alently , smallest adjusted p -v alue: ˜ r = arg min 1 ≤ r ≤ k p ad j ( r ) . The change lo cation is estimated as ˆ z ∗ = arg max ⌊ nτ ⌋≤ z ≤ n −⌊ nτ ⌋ T z , ˜ r , (2.5) where τ ∈ (0 , 1 2 ) is a trimming pa r ameter for the weigh ted CUSUM. W e set τ = 1 / n for the standard CUSUM. 3 Sim ulation This simulation section has three go als. W e first pr ovide a guide on the pa rameter choices inv olved in o ur metho d thro ugh extensive simulations in Subsectio n 3.1 , and iden tify reas onable RP-CUSUM pro cedures. Compariso ns of our RP -CUSUM with o ther change po int metho ds for hig h- dimension o r functional data follow in Subsection 3.2 . Subsection 3.3 demo nstrates that while RP-CUSUM may exhibit v a riability in a single r un, it tends to correctly identify the change lo cation with rep etitions. In the simulations in this sectio n, data are gener ated s imilarly to the functiona l setting describ ed in Aue et al. ( 201 8 ). W e first formulate our change po int mo del pr esented in ( 2.1 ) in a functional fra mework: X t ( j p ) = X tj , j = 1 , . . . , p , wher e X 1 , . . . , X n denote functional time series on a unit interv a l [0 , 1]. A single change p oint mo del for the functional time ser ies is X t ( s ) = µ ( s ) + δ ( s ) 1 { t > z ∗ } + ε t ( s ) , 1 ≤ t ≤ n, s ∈ [0 , 1] , (3.1) where µ , δ , and ε t are functions defined o n the unit in terv al [0 , 1]. Let µ ( s ) = 0 and ε t ( s ) = D X g =1 A t,g v g ( s ) , 1 ≤ t ≤ n, s ∈ [0 , 1] , (3.2) with F ourier basis functions v 1 ( s ) , . . . , v D ( s ). The basis co efficients A t,g are drawn indep endently from a 7 normal dis tribution with mean zero and standard deviation σ g of the following three s ettings: Setting 1 : σ g = 1 for g = 1 , 2 , 3 and σ g = 0 for g = 4 , . . . , D . Setting 2 : σ g = 3 − g for g = 1 , . . . , D . Setting 3 : σ g = g − 1 for g = 1 , . . . , D . The three settings of σ g mo del different for ms in the decay o f the ordered eig env alues o f the cov ar ia nce matrix in the functional data setting. Set t ing 1 co ncerns the situation that o nly three basis functions ar e included in the functional da ta . Setting 2 in volves the situation in which the eigenv alues of the cov ariance matrix decay fast, while Set t ing 3 rela tes to the situation in which the e ig env alues decay slowly . When the eig env a lues of the cov arianc e matrix decay faster , fewer eigenfunctions ar e needed to e xplain most of the v ariatio n in the functional data samples. Sp ecifically , in S etting 1 , the ma jorit y of v a riation is explained by the first three eigenfunctions, with each contributing rela tively evenly . In Setting 2 , the first t wo eigenfunctions tend to explain about 95% of total v ar iation, with the first eigenfunction explaining m uch more than the se c ond eigenfunction. In Set ting 3 , the prop o rtion of v ariatio n explained by eigenfunctions decreases g radually , requir ing more than three eigenfunctions to capture most of the v ar iation. The brea k function δ ( s ) in mo del ( 3.1 ) is formulated with the fir st m basis functions v 1 ( s ) , ..., v m ( s ), where m ≤ D . The magnitude of the break function is scaled b y the signal- to-noise r atio ( S N R ) a s follows: δ ( s ) = δ ( s ; m, c ) = √ c ∗ 1 √ m m X g =1 v g ( s ) , c = S N R ∗ tr ( C ε ) θ (1 − θ ) √ D , (3.3) where θ is the scaled lo cation of the change p oint in the int erv al (0 , 1), and C ε is the lo ng-run v ar iance of the error s . Note that m = 1 corresp onds to a co nstant mean break. When m > 1, the break is spr ead ov er a large r num b er of basis functions, resulting in a more complex for m. F ollowing the simulation codes from Aue et al. ( 2018 ), the term tr ( C ε ) is computed as the trace of the sample c ov ariance matrix for the centered basis co efficients A t,g of the functional error s. F ollowing Aue et al. ( 2018 )’s setting, D = 21 and n = 50. The v alues o f S N R a re 0 , 0.1, 0.2, 0.3, 0.5 , 1, and 1 .5 , with S N R = 0 indicating δ ( s ) = 0 ( H 0 ), while S N R > 0 repres e n t alternative cases. The break function δ ( s ) is constructed with m = 1, 5, or 20 . When discretization of the functiona l data is needed for our RP metho d or for the metho d in W ang and Sam worth ( 2018 ), w e ev alua te functions at equally space d grid p oints j p ∈ [0 , 1], j = 1 , . . . , p , with p = 101. All results are based on 100 0 simulations unless otherwise sp ecified. 8 3.1 P arameter Choices for the RP metho d Our RP metho ds require three choices: the types of change po int tests , p -v alue combination metho ds , and the n umber of random pr o jections. In this subsection, w e provide an empirical g uide on suc h choices throug h simulations. F or the c hange point tests, there is extensive literature on detecting and loc ating change points. Horv´ ath a nd Rice ( 2014 ) provide a sur vey of some widely used change p oint metho ds. F or those applicable to univ a riate time series, they include the standa r d CUSUM test ( Page , 1 954 ), the weigh ted CUSUM ( Cs¨ org¨ o and Horv´ ath , 1993 , 19 9 7 ), Dar ling-Er d˝ o s (DE) test ( Darling and Erd¨ os , 1956 ), Andrews test ( Andrews , 19 93 ), and Hi- dalgo a nd Seo (HS) test ( Hidalgo a nd Seo , 2013 ). F urthermor e , Horv´ ath et al. ( 20 20 ) compare the ab ove tests with their newly develop ed R´ enyi-t yp e (HR) test, and mention that the Andrews test statistics have a similar per formance to that of the DE test. O ur simulation fo cuses on five tests: the standard CUSUM, the weigh ted CUSUM, DE, HS, and HR tests. When implementing the weigh ted CUSUM test, the change point estimatio n in ( 2.5 ) is restr ic ted to the trimmed in terv al [ ⌊ nτ ⌋ , n −⌊ nτ ⌋ ], where τ ∈ (0 , 1 2 ). W e consider c hoices of ⌊ nτ ⌋ including 1, ⌊ n 0 . 25 ⌋ , ⌊ l og ( n ) ⌋ , ⌊ n 0 . 5 ⌋ following Horv´ ath et al. ( 202 0 ). T o simulate the limiting distribution of the weighted CUSUM, we genera te 100,00 0 re plications and use 10,0 00 incr ements for Br ownian bridge. When estimating σ 2 z in ( 2.4 ), we con- sider the heteros kedasticit y and auto correla tion consistent (HAC) estimation with the Bar tlett kernel and the bandwidth ba sed on Andrews ( 199 1 ). Alternative co mbinations of kernel function a nd bandwidth are also co mpared but leads to inferior r esults, which are not pr e sented. W e als o consider a v a riance es tima- tor as mentioned in Horv´ ath et al. ( 202 0 ). Using y t to re pr esent y t,r for simplicity , for a ny r = 1 , . . . , k , ˆ σ 2 z = 1 n [( P z t =1 ( y t − ¯ y z ) 2 + P n t = z +1 ( y t − ¯ y n − z ) 2 )] , where ¯ y z = 1 z P z t =1 y t , and ¯ y n − z = 1 n − z P n t = z +1 y t . The ov era ll conclusions of compariso n using this v aria nce es timator remain consistent with those using the HA C estimator. When the time series is known to be uncorrelated, the v aria nce estimators ˆ σ 2 z from Horv´ ath et al. ( 2020 ) is reco mmended as it is computationally fas ter than the HAC estimators . W e present the r esults using the v arianc e estimator from Horv´ ath et al. ( 2020 ) in the main pap er, and the r esults o btained using the HAC estimator in the Supplemen ta r y Material S.1.1 . F or the p -v alue combination methods, there are a v ariety of a pproaches that co ntrol the family-wise error rate (FWER) or false discov er y rate (FDR) among multiple tests. In addition to the Bonf and BH metho ds, men tioned in Subsection 2.2 , we also consider the Cauch y combination test (CCT) from Liu and Xie ( 2020 ) and the Harmonic mean p -v alue (HMP) ( Wilson , 20 19 ) for a b etter FWER control and improv e d power when tests ar e dep endent. The Benjamini-Y ekutieli (BY) metho d ( Benjamini a nd Y ekutieli , 200 1 ), an extension of BH metho d to ha ndle dep endent tests, is a lso considered but not presented since the BH metho d has 9 better per formance than the BY metho d when combined with random pro jections based on our simulation results. W e further use BH and Bonf metho ds for change po int loc a tion identification base d on the sma lle st adjusted p -v a lue. F or the num b er k of r andom pro jections, a theoretical bo und fro m Dasgupta a nd Gupta ( 2003 ) is 4( a 2 / 2 − a 3 / 3) − 1 ln n , where 0 < a < 1 and (1 − a ) relates to the accura cy of random pro jections in pre s erving pairwise distance s . This b ound suggests that a ppr oximately 900 pro jections ar e required for the data settings we consider , with a = 0 . 2 and n = 50 . Given this theoretical b ound and the empir ical findings from Bingham a nd Mannila ( 2001 ) that a m uch low er num b er of rando m pr o jections tha n the b ound gives a comparable p erfor mance, we inv estigate selected num b ers ranging from 1 0 to 1000 . No te that incre a sing the nu m b er of random pro jectio ns may result in lo ng er co mputatio n time. W e intend to select a smalle r nu mber of r andom pr o jections to ensure computational efficiency while main taining accuracy in c ha nge p oint lo cation identification, as well as ensur ing acceptable sizes and p ow ers. First, we compa r e the e ffect of differen t change p oint tests when combined with RP . Figure 1 presents the s iz es and size-adjusted p ow er s of the RP metho ds using different change p oint tests with k = 20 0 and Bonf. The cor resp onding raw empirical r ejection rates are provided in Figure S.8 in the Supplemen tar y Material S.1.2 . The change point lo cation is set at θ = 0 . 25 . F rom Figure 1 , amo ng the different trimming choices of the weighted CUSUM tests, the tr imming choice of ⌊ n 0 . 5 ⌋ leads to slig ht ly higher size-adjusted powers but ov er-r ejects. The trimming choice of ⌊ l og ( n ) ⌋ has better siz e s and similar size-a djusted p ow ers as ⌊ n 0 . 5 ⌋ in most ca ses. W e compare the weight e d CUSUM tes t with trimming choice o f ⌊ l og ( n ) ⌋ and other tests. In the ca s e of non-constant shift ( m = 5 and m = 20), b oth the weighted CUSUM and the standard CUSUM ha ve manifestly higher size-adjusted powers in Set tings 1-2 , follow ed b y the HS test. The HR tes t exhibits the least p ow ers. The weigh ted CUSUM exhibits slightly b etter size-adjusted p ow e r s in Set ting 3 , closely followed by the standa rd CUSUM, with the standard CUSUM controlling the sizes b etter. In the case o f constant shift ( m = 1 ), all the tests display low size- adjusted pow ers , while the weighted CUSUM and standard CUSUM still o utper form. F ro m Figure S.8 , the weighted CUSUM has the b est p ow er s, follow ed by the s ta ndard CUSUM, with the sta ndard CUSUM controlling the sizes b etter. The DE test exhibits the least powers in most cases. Overall, Figure 1 a nd Figure S.8 s ug gest that the weight ed CUSUM and the standard CUSUM test outp erform the other change p oint tests in terms o f size c ontrol and power. When the change po int lo catio n is in the middle ( θ = 0 . 5 ) a s pre s ented in Figure S.6 and Figure S.7 in Supplemen tary Material S.1.2 , the standard CUSUM test ex hibits even sup erio r per formance, acquir ing higher raw p ow ers a nd s ize- adjusted p ow ers in all the alter native ca ses than the weighted CUSUM test a nd o ther tests. While mor e extreme change p oint lo cations may change the r esults, as sug gested in Horv´ ath et al. ( 202 0 ), it app ears that as long as the change p oints a re well within the obse r v a tion b o undaries, the standard CUSUM is a 10 reasona ble choice to combine with r andom pr o jections. Mor e re sults of the sizes and size-adjusted p ow er s of the RP metho ds with BH, HMP , and CCT are pr e sented in Figure S.12 , Figure S.13 a nd Figur e S.1 4 , and the corr esp onding sizes a nd raw p owers in Figure S.9 , Figure S.1 0 , a nd Figure S.11 in Supplementary Material S.1.2 . m=1 0.0 0.5 1.0 1.5 0.0 0.2 0.4 0.6 0.8 1.0 CUSUM DE HS HR Weighted Weighted n 0.25 Weighted n 0.5 Weighted log ( n ) m=5 0.0 0.5 1.0 1.5 m=20 0.0 0.5 1.0 1.5 (a) Setting 1 m=1 0.0 0.5 1.0 1.5 0.0 0.2 0.4 0.6 0.8 1.0 m=5 0.0 0.5 1.0 1.5 m=20 0.0 0.5 1.0 1.5 (b) Setting 2 m=1 0.0 0.5 1.0 1.5 0.0 0.2 0.4 0.6 0.8 1.0 m=5 0.0 0.5 1.0 1.5 m=20 0.0 0.5 1.0 1.5 (c) Setting 3 Figure 1 : Adjusted empirical rejection rates of the RP methods for v arious v alues of S N R in the x-axis. The RP metho d p erforms 200 random pro jections and applies different change p oin t tests (CUS UM, W eighted, DE, HS, HR) and th e Bonf com bination method . The data-generating pro cess follo ws ( 3.2 ) where the standard deviation σ g follo ws Settings 1-3 . The change p oint location is set at θ = 0 . 25. The empirical rejection rate is based on 1000 sim ulations. Secondly , we compare the effect of different p -v alue co mbination metho ds . Figure 2 pr esents the s izes and size-adjusted p owers of the RP metho ds using different p -v alue co mbin ation metho ds with k = 200 and 11 the s tandard CUSUM test. The cor r esp onding raw empirical r ejection r ates are provided in Figure S.15 in Supplementary Materia l S.1.2 . Denote RP-Bonf, RP -BH, RP- HMP , a nd RP-CC T b y RP metho ds with p -v alue co m bination metho ds Bonf, BH, HMP a nd CCT, res p ectively . The change po int lo cation is s et a t θ = 0 . 25. F ro m Figur e 2 , when m = 5 and m = 20, the RP-Bo nf metho d has the be st size-adjusted p owers in Settings 1-2 , the RP-BH has the b est size-a djusted p owers in Setting 3 . When m = 1, the four metho ds hav e similar size-adjusted pow e r s, with the RP-HMP being slig ht ly better in Set t ing 1 and the RP-BH being slightly b etter in S ettings 2-3 . F rom Figur e S.15 , when m = 5 and m = 20, the RP-HMP metho d has slightly b etter raw p ow er s. The o ther thr ee metho ds lead to similar p erformanc e in terms of raw p ow ers. When m = 1 , the RP-HMP still p erforms b es t in r aw p ow er s, follow ed by the RP-CCT metho d, while the RP-Bonf method displays manifestly low er raw p ow er s. T able 1 presents the empirica l re jection rates under the null for the RP metho ds using different p -v a lue co mbination metho ds with k = 200 and the CUSUM test, providing precise numerical comparisons. Thes e r e s ults are visually pre sented in Figur e 2 as well. More results of using different tests a re provided in the T able S.1 in Supplement ary Mater ial S.1.2 . F ro m T a ble s 1 a nd S.1 , b oth the RP- HMP a nd RP-CCT metho ds may lo ose size co ntrol. It is b ecaus e these metho ds a r e v a lid o nly when the significa nce level is sma ll enough, e sp ecially when dep endence is weak. Conditioning on the data in the or iginal dimension X , each pro jected univ ar ia te time series using RP a re independent. F o r HMP and CCT, significa nc e level of 0.0 5 may still b e to o la rge under indep endence, as Rho ( 2024 ) p oints out. In fact, considering the indep e ndenc e among RPs given the high dimensional data, Bonf and BH would work reasona bly well. The RP-B H maint a ins appropriate r e jection r ates under the null in Sett ings 1-2 and the RP-Bo nf shows the b est p erfor ma nce in controlling the sizes in Sett ing 3 . Overall, the RP-Bonf and RP-BH methods have better s ize-adjusted powers in mos t cases and co ntrol the sizes well. Consider ing that Bonf a nd BH can also na turally identify significant indicividual tests , unlike the sum-ba sed metho ds such as HMP a nd CCT, we r ecommend using Bonf o r BH with RP . Empirical rejection ra te under the null (significance level 0.05 ) Bonf HMP BH CCT Setting 1 0 .011 0.083 0.040 0.061 Setting 2 0 .014 0.080 0.044 0.074 Setting 3 0 .052 0.122 0.069 0.088 T a ble 1: Empirical rejection rate under the null of RP metho d using d ifferent p -v alue combination metho ds with k = 200 and the standard CUSUM test. Thirdly , we co mpare the effect o f the RP metho ds with different nu m b er s of rando m pr o jections. F o l- lowing the selected ch oices fro m Figures 1 , we limit the change p oint test to standard CUSUM. W e co mpare 12 m=1 0.0 0.5 1.0 1.5 0.0 0.2 0.4 0.6 0.8 1.0 Bonf BH HMP CCT m=5 0.0 0.5 1.0 1.5 m=20 0.0 0.5 1.0 1.5 (a) Setting 1 m=1 0.0 0.5 1.0 1.5 0.0 0.2 0.4 0.6 0.8 1.0 m=5 0.0 0.5 1.0 1.5 m=20 0.0 0.5 1.0 1.5 (b) Setting 2 m=1 0.0 0.5 1.0 1.5 0.0 0.2 0.4 0.6 0.8 1.0 m=5 0.0 0.5 1.0 1.5 m=20 0.0 0.5 1.0 1.5 (b) Setting 3 Figure 2: Adjusted empirical rejection rates of the RP- Bonf, RP-BH, RP-H MP , and RP-CCT meth od s with the standard CUSUM test for v arious v alues of S N R in the x-axis. T he R P metho d p erforms 200 random p ro jections. The d ata-generating pro cess follo ws ( 3.2 ) where the stand ard deviation σ g follo ws Settings 1-3 . The change p oint location is set at θ = 0 . 25. The empirical rejection rate is based on 1000 simulations. the sizes, r aw p ow ers, size-a djusted p ow e r s of our metho ds as well as ro ot mean squared err ors (RMSE) of estimated c ha nge p oint lo cations. The c ho ices of the n umber k of random pr o jections r ange from 10 to 100 in incr ements of 10 and then from 100 to 10 00 in incr ements o f 50. Figure 3 displays the sizes and size- adjusted p ow ers of the RP methods in Setting 1 . The results in Settings 2 and 3 are provided in Figures S.19 and S.20 in Supplementary Materia l S.1.2 . The raw empir ical rejection rates in Set tings 1-3 are pr esented in Figures S.16 , S.17 , and S.18 . The change p oint lo ca tion is 13 0 200 400 600 800 1000 0.0 0.2 0.4 0.6 0.8 1.0 Bonf BH HMP CCT (a) S N R = 0 m=1 0 200 400 600 800 1000 0.0 0.2 0.4 0.6 0.8 1.0 m=5 0 200 400 600 800 1000 m=20 0 200 400 600 800 1000 (b) S N R = 0 . 5 m=1 0 200 400 600 800 1000 0.0 0.2 0.4 0.6 0.8 1.0 m=5 0 200 400 600 800 1000 m=20 0 200 400 600 800 1000 (c) S N R = 1 . 5 Figure 3: A djusted empirical rejection rates of the RP-Bonf, RP- BH, RP-HMP and R P- CCT meth od s with the standard CUS UM test for v arious c hoices of num b er k of random pro jections in the x- axis. The d ata-generating process follo ws ( 3.2 ) where th e standard d eviation σ g follo ws Setting 1 . The c han ge p oint location is set at θ = 0 . 25. The empirical rejection rate is based on 1000 sim ulations. set at θ = 0 . 25 . In Figur e 3 , under the null ( S N R = 0), the RP- B H metho d can control the s izes well across different num b ers of random pro jectio ns. The RP-HMP metho d tends to over-reject, similar ly to what w e observed in T able 1 . Under the a lter natives with S N R = 0 . 5 and S N R = 1 . 5, when m = 5 and m = 2 0, size - adjusted p ow ers of the RP metho ds are improv ed sig nificantly as the num b er k o f rando m pro jections rises. Moreover, the size-adjusted p owers remain s table after k = 2 00. How ever, when m = 1, the size-adjusted p ow er s fluctuates without an asc e nding trend as k increa s es. Similar tr ends can be fo und 14 in the raw p owers. m=1 0 200 400 600 800 1000 0.0 0.1 0.2 0.3 0.4 0.5 Bonf BH m=5 0 200 400 600 800 1000 m=20 0 200 400 600 800 1000 (a) Setting 1 m=1 0 200 400 600 800 1000 0.0 0.1 0.2 0.3 0.4 0.5 m=5 0 200 400 600 800 1000 m=20 0 200 400 600 800 1000 (b) Setting 2 m=1 0 200 400 600 800 1000 0.0 0.1 0.2 0.3 0.4 0.5 m=5 0 200 400 600 800 1000 m=20 0 200 400 600 800 1000 (c) Setting 3 Figure 4 : RMSE of estimated change p oint locations d etected by the RP-Bonf and RP-BH meth od s with t he standard CUS UM test for v arious c hoices of num b er k of random pro jections in the x- axis. The d ata-generating process follo ws ( 3.2 ) where the standard deviation σ g follo ws Settings 1-3 . The change p oint lo cation is set at θ = 0 . 25. The RMSE is based on 1000 simulations. Figure 4 displays RMSE of a ll the estimated change p o int lo c ations detected by the RP methods with an increasing num b er of ra ndo m pr o jections. W e include non-sig nificant o nes b e cause those a re use d later in subsection 3.3 when rep ea ting the RP metho ds and a r e appea red to b e informa tive a s well. W e rep ort the RMSE of o nly significa nt estimated ch ange p oint loc a tions in Figure S.21 in Supplymen tar y Material S.1.2 . The change p o int lo ca tion is set a t θ = 0 . 25. In Figur e 4 , when m = 5 and 20 , RMSE exhibits a declining 15 trend, decre asing ra pidly at the b eginning as the n umber k of random pro jections increases. It seems that k = 200 is enough in most cas e s . Beyond k = 200, further increases in the num b er o f r andom pr o jections do es not result in a remar k a ble gain in RMSE. How ever, when m = 1, the RMSE is higher than that in m = 5 and 2 0, and do e s no t decline as k increases . The difficult y observed when m = 1 a lso a rises in o ther comparable metho ds, as shown in Figure 5 in subsectio n 3.2 . This may b e b eca use, when m = 1, the break function is constan t a nd the change is uniform across compo ne nts w ith a small magnitude. In contrast, when m = 5 or m = 2 0, the break function is non- constant, and the change is different across co mpo nents. Some comp onents exhibit lar ger changes, which a pp ea r to be easier to detect. Therefore, for the da ta settings w e consider, p erfor ming k = 200 rando m pro jections app ear s to b e a r easonable choice for the RP metho ds, as it offers a simpler computation while maintaining s imilar perfor mance as with m uch larger k . The a dditional random pro jections b eyond k = 200 under mine the computational efficiency of the RP metho d. Figure S.21 exhibits a trend similar to that in Figure 4 , sugg esting k = 200 but with lower RMSE v a lues. 3.2 Comparison of cha nge p oint metho ds In this s ubsection, we compa r e the p erfor mance of the RP metho ds and o ther existing single change p o int detection metho ds for functional or high- dimensional data, including pr o jection-ba sed metho ds and func- tional metho ds without dimension reduction. Pro jection-based methods include FPC-ba sed metho ds from Aue et al. ( 2009 ) a nd Berk es e t al. ( 2009 ) with diff e r ent desired prop ortion of tota l v ariatio n explained (TVE): 0 .85, 0.90 , a nd 0.95 (FPC-0.85 , FP C-0.90 , FPC - 0.95), and a metho d from W ang and Samw o rth ( 2018 ), where one optimal direction tha t clo sely a ligns with the direction o f the change is iden tified. Meth- o ds without dimension reduction include a fully functional (FF) method from Aue et al. ( 201 8 ) and a method from Dette et al. ( 2020 ). In the pro cess of change p oint detection, the RP metho ds, the FPC-ba sed metho ds , and the FF metho d use a standar d CUSUM pro cess, while the metho ds in W ang and Samw o rth ( 2018 ) and Dette et al. ( 202 0 ) and use a w eighted CUSU M pro cess. W e mo dify the methods in W ang and Sam worth ( 20 18 ) and Dette et al. ( 2020 ) to use the sta nda rd CUSUM pro cess and lab el them as WS and DKV, resp ectively . The orig inal versions o f the tw o metho ds that use weight e d CUSUM a re lab eled as WS-w e ig hted and DKV-w eig ht e d. W e present o nly the r esults of WS and DKV using the standa rd CUSUM proce s s due to b etter s iz e control in mos t cases in the consider ed settings t han WS-w eig ht e d and DKV-w eig hted. T he results of using w eighted CUSUM are pre s ented in the Figure S.22 in Subsection S.2 in the Supplement ary Material. F o r W ang and Samw or th ( 2018 ), we also consider their simulation-based approach to find a cr itical v alue. In our results, bo th WS and WS-CUSUM indicate W ang and Samw o rth ( 2018 )’s metho d with s tandard CUSUM but with t wo different 16 wa ys to compute critica l v alues: WS choo ses the 95% quantile of maximized s tandard CUSUM statistics o f 1000 i.i.d. sa mples with no change p oint nor any temp oral dep endence, while the WS-CUSUM method rely on the s imulation of Brownian bridges, simila r ly to the one desc r ib ed in the beg inning of Subsection 3.1 for the weighted CUSUM. W e compar e the afore men tioned metho ds in terms o f siz e s, raw powers, and the accura cy of estimated change po int loc ations. Fig ure 5 displays the empirical rejection r ates of the RP metho d using 200 r andom pro jections and the o ther change p oint detection metho ds for high-dimensional o r functional da ta. The change point lo cation is set a t θ = 0 . 25. Under the null, our RP-BH metho d maint a ins an acceptable empir - ical rejection ra te close to a sig nificance level of 0.05 in Sett ings 1-2 , while RP- B onf metho d is conserv ative and RP - HMP is slig ht ly ov er-r ejecting. In Setting 3 , o ur RP-B o nf shows the b est per formance in controlling the sizes compa red to RP - BH and RP-HMP . F or o ther methods , the WS metho d a lso controls the sizes well, comparable to our RP -BH in S et tings 1-2 and o ur RP-Bonf in Setting 3 , follow ed by the FF method, while other metho ds fail to control the s iz es. Under the alternatives, when m = 5 a nd 20 , o ur RP metho ds hav e the b est p ow e r in Settings 1-2 , follow ed by the WS-CUSUM metho d. In Setting 2 , the pro jection-based metho ds show higher p owers than metho ds witho ut dimension r eduction, though FP C with TVE 0.85 has low er p ow er in w eak a nd mo dera te alternative cases. Our RP metho ds show b etter p erformance compa r ed to other pro jectio n-based metho ds . In Setting 3 , FPC with TVE 0.95 and WS-CUSUM hav e higher pow er than our RP methods when magnitude of change is small ( S N R ≤ 0 . 5 ) but ar e outp erfor med by RP - HMP metho d when S N R > 1. When m = 1 , RP-BH and RP- Bonf metho ds are surpass ed by other pro jection-based metho ds, while RP- HMP exceeds WS metho d in all Sett ings a nd has compara ble p erfor mance to FP C 0.85 metho d in Setting 3 . O verall, our RP metho ds a r e recommended for detecting da ta with p otentially no n-constant brea k functions . Based on the co mparison acr oss the three Sett ings , RP-Bo nf and RP- BH metho d is s uggested whe n the v aria bility o f data is concentrated in few dir ections. When the data has v ariability acros s mor e directions, RP-HMP is applicable to detect change with relatively large ma gnitude. Figure 6 pr esents the b oxplots o f estimated c ha nge p oints detected by the afor ementioned methods. Our RP metho ds use k = 200 random pro jections. The change p oint lo cation is set at θ = 0 . 25. The ma gnitude of the break function is sca le d by S N R = 0 . 5. When m = 5 and 2 0, in Sett ings 1-2 , the RP metho ds can detect the c hange point most accurately , as the media n is closely aligned with the true lo ca tion 0.25, fo llow ed by the WS metho d which has a wider sprea d. In S et ting 3 , the s pread o f our estimates is similar to that of FP C 0.9 with the median of our es tima tes b eing closer to the true loc a tion. The spread o f our estimates is narrower than other metho ds when m = 20, except for FPC 0.95 . When m = 1, the RP metho ds do not hav e distinct adv antages. The RP methods are similar to the WS metho d in b oth median and spread. 17 0.0 0.5 1.0 1.5 0.0 0.2 0.4 0.6 0.8 1.0 0.0 0.5 1.0 1.5 0.0 0.5 1.0 1.5 (a) Setting 1 , with m = 1 , 5 , 20 0.0 0.5 1.0 1.5 0.0 0.2 0.4 0.6 0.8 1.0 DKV FF FPC−0.85 FPC−0.90 FPC−0.95 RP−BH RP−HMP RP−Bonf WS WS−CUSUM 0.0 0.5 1.0 1.5 0.0 0.5 1.0 1.5 (b) Setting 2 , with m = 1 , 5 , 20 0.0 0.5 1.0 1.5 0.0 0.2 0.4 0.6 0.8 1.0 0.0 0.5 1.0 1.5 0.0 0.5 1.0 1.5 (c) Setting 3 , with m = 1 , 5 , 20 Figure 5: R aw emp irical rejection rates of v arious c h ange p oint d etection meth od s, including pro jection-based and fully funct ional method s, for va rious v alues of S N R in the x -axis. The data-generating p rocess follo ws ( 3.2 ) where the standard deviation σ g follo ws Settings 1-3 . The change point lo cation is set at θ = 0 . 25. The rejection rate is based on 1000 simulations. How ever, when m = 1, metho ds without dimension reduction (DKV, FF) show a dv a nt ages in Setting 3 , as their medians ar e closer to the true lo cation. O verall, given the high accur acy and precision, RP metho ds are well-suited for applications with non-consta nt break function. In the case of co nstant brea k function, metho ds witho ut dimensio n reduction may b e preferable. 18 0.00 0.25 0.50 0.75 1.00 DKV FF FPC−0.85 FPC−0.90 FPC−0.95 RP−BH RP−Bonf WS DKV FF FPC−0.85 FPC−0.90 FPC−0.95 RP−BH RP−Bonf WS DKV FF FPC−0.85 FPC−0.90 FPC−0.95 RP−BH RP−Bonf WS (a) Setting 1 , with m = 1 , 5 , 20 0.00 0.25 0.50 0.75 1.00 DKV FF FPC−0.85 FPC−0.90 FPC−0.95 RP−BH RP−Bonf WS DKV FF FPC−0.85 FPC−0.90 FPC−0.95 RP−BH RP−Bonf WS DKV FF FPC−0.85 FPC−0.90 FPC−0.95 RP−BH RP−Bonf WS (b) Setting 2 , with m = 1 , 5 , 20 0.00 0.25 0.50 0.75 1.00 DKV FF FPC−0.85 FPC−0.90 FPC−0.95 RP−BH RP−Bonf WS DKV FF FPC−0.85 FPC−0.90 FPC−0.95 RP−BH RP−Bonf WS DKV FF FPC−0.85 FPC−0.90 FPC−0.95 RP−BH RP−Bonf WS (c) Setting 3 , with m = 1 , 5 , 20 Figure 6 : Estimated change point lo ca tions detected by different methods on 10 00 simulations. The data - generating pro cess follows ( 3.2 ) where the s ta ndard deviatio n σ g follows Settings 1-3 . The change p oint lo cation is set at θ = 0 . 25. The magnitude of the br eak function is sc aled by S N R = 0 . 5 . 3.3 Lo cation estimates of the RP metho d in practice The lo catio n estimates based on RP methods may b e unstable due to the randomness of directions . In practice, we prop os e to rep eat RP-BH (or RP -Bonf ) metho d multiple times to ach ieve stabilit y . W e co mpa re the quality of lo cation estimates of RP-ba sed methods with those o f existing metho ds in s imu la tions: fix a 19 single s imulated dataset, and rep eat each RP-BH (o r RP- Bonf ) metho d 100 0 times. W e consider k = 200 random pro jections and the standar d CUSUM. The change p oint loc ation is se t at θ = 0 . 25. The ma gnitude of the br eak function is s caled by S N R = 0 . 5. Figure 7 summarizes the r esulting empirical distributions of the 1000 estimated change p oint lo cations using v iolin plo ts, with the red dot indicating the mo de acro ss all 1000 rep etitions for RP-B H a nd RP-Bo nf. W e also r ep ort the estimated change po int lo ca tions only when a 20 0-RP set leads to a significant a djusted p- v alues : min 1 ≤ r ≤ 200 p ad j ( r ) < 0 . 05. These metho ds are labe led as RP BH sig and RP Bonf sig. Figure S.23 in Supplemen ta ry Mater ial S.3 includes those results. While RP BH sig and RP Bonf sig may have smaller v ariability compared to those using a ll 100 0 change lo cation estimates, they may miss detection some c ha ng es, esp ecially when m = 1. Five additiona l figures similar to Fig ure 7 are presented as Figures S.24 - S.27 in Section S.3 in the Supple- men tary Materia l. These figur es ar e the sa me as Figur e 7 , except that they are bas ed on differ ent datasets. In most ca ses, the RP metho ds e x hibit less v ariability when m = 5 and m = 20 than m = 1, esp ecia lly in Settings 1-2 . When m = 5 and m = 20, tho ugh rep eating the RP metho d can yield v ariable estimated lo cations, the mo de o f the RP rep etitions is accura te in most cases, tending to be clos er to the true lo catio n than other metho ds. When m = 1 , the mo de o f the RP rep etitions is similar to the lo ca tions obtained b y other metho ds in most datase ts . In practice, we reco mmend rep ea ting the RP metho d. If the detected change p oints a c r oss r ep e a ted RP metho ds ar e consistent, a s mall num b er of re p etition would b e ok ay . How ever, if they v ar y widely , we reco mmend rep eating the RP metho d ma ny times, for example, 10 00 times, and choosing an aggreg ate estimate, for exa mple, the mo de. The mo de acros s rep etitions c a n b e re po rted as the fina l change p oint estimate b ecause it targets the most frequently repro ducible change p oint lo ca tion, and is less influenced b y outlier estimates. When the distribution has multi peak s, it might be an indication that ther e ex is t multiple change p oints, or the mean change is more gra dual r ather than a brupt. This related topic o f detecting m ultiple change p oints will b e discussed further in separate w o rk. 4 Application W e illustra te the pe rformance of the RP metho d using daily minim um tempe r atures from eight Australian weather stations , most of which provide records spanning more than 100 years. The s tation names and n um- ber s are Bo ulia (038003 ), Cap e Otw ay (09001 5), Gayndah (039 066), Gunnedah (05 5 024), Hobar t (094 0 29), Melbo urne (08633 8), Robe (02 6026 ), a nd Sydney (06621 4). The dataset is av a ilable from the Australian Bu- reau of Meteo r ology ’s on the following website http:/ /www. bom.gov.au/climate/data/acorn- sat/ , which provide long- term climate monitoring. Our o b jectiv e is to identify the year that the mean shift starts. F or 20 0.00 0.25 0.50 0.75 1.00 DKV FF FPC−0.85 FPC−0.90 FPC−0.95 RP−BH RP−Bonf WS DKV FF FPC−0.85 FPC−0.90 FPC−0.95 RP−BH RP−Bonf WS DKV FF FPC−0.85 FPC−0.90 FPC−0.95 RP−BH RP−Bonf WS (a) Setting 1 , with m = 1 , 5 , 20 0.00 0.25 0.50 0.75 1.00 DKV FF FPC−0.85 FPC−0.90 FPC−0.95 RP−BH RP−Bonf WS DKV FF FPC−0.85 FPC−0.90 FPC−0.95 RP−BH RP−Bonf WS DKV FF FPC−0.85 FPC−0.90 FPC−0.95 RP−BH RP−Bonf WS (b) Setting 2 , with m = 1 , 5 , 20 0.00 0.25 0.50 0.75 1.00 DKV FF FPC−0.85 FPC−0.90 FPC−0.95 RP−BH RP−Bonf WS DKV FF FPC−0.85 FPC−0.90 FPC−0.95 RP−BH RP−Bonf WS DKV FF FPC−0.85 FPC−0.90 FPC−0.95 RP−BH RP−Bonf WS (c) Setting 3 , with m = 1 , 5 , 20 Figure 7: Estimated change p oint locations detected by repeating the meth ods on one dataset (Dataset 1) 1000 times. F or th e RP metho ds, the mo de of t h e estimated locations across the 1000 repetitions is marked by a red d ot. The d ata-generating pro cess follo ws ( 3.2 ) where the stand ard deviation σ g follo ws Settings 1-3 . The change p oint location is set at θ = 0 . 25. The magnitude of th e break function is scaled by S N R = 0 . 5. each station, we form a yearly sequence { x t } n t =1 , where n = 1 1 4 for most stations. W e remov e the extr a day in leap years, re s ulting in p = 3 65 o bserv ations p er year. W e apply the RP -Bonf method with k = 20 0 random pro jections and the standar d CUSUM test. Beca use the estima ted change p oint lo cation can v ar y across differe nt runs, we rep eat the RP-Bonf metho d 1000 times on e a ch statio n’s dataset and rep or t the mo de, following the pro cedure in Subsection 3.3 . Figure 8 presents the e mpir ical distribution of detected change point lo catio ns across the 1000 r e p etitions and hig hlig hts the mo de , wher e six stations have common 21 time ra nge 1910 − 2023. The remaining tw o s tations hav e differ e nt ranges , 1948 − 2023 and 1 918 − 2023. F ro m Figure 8 , the stations Gayndah, Gunnedah, Hobart, Rob e, and Sydney seem to form a sharp p eak, indicating that the sa me calendar year is repea tedly selected acro ss man y RP rep e titions. In these cases, the mo de provides a stable a nd repro ducible estima te of the change p oint lo cation. The other stations Boulia , Cap e O t way , and Melb our ne hav e mo re than one p eak, suggesting that mult iple ca ndidates years or gr adual mean trans ition. 1910 1938 1966 1994 2023 Boulia (2008) 1910 1938 1966 1994 2023 Cape Otwa y (1996) 1910 1938 1966 1994 2023 Gayndah (1972) 1948 1966 1985 2004 2023 Gunnedah (2019) 1918 1944 1970 1996 2023 Hobar t (1973) 1910 1938 1966 1994 2023 Melbourne (1958) 1910 1938 1966 1994 2023 Robe (1983) 1910 1938 1966 1994 2023 Sydney (1972) Figure 8: Estimated change p oin t locations detected by repeating the RP- Bonf metho d on the t emp erature dataset 1000 times. The mo de of the estimated locations across the 1000 rep etitions is marked by a red dot and labeled in the p aren thesis u nder the station. 5 Conclusion This pa pe r prop ose a random pro jection ch ange p oint detection method in high-dimens io nal data. By pro jecting hig h-dimensional data onto m ultiple random direc tions and applying a standard univ a riate c hange po int test on each pro jected series, the propo s ed meth o d con verts a high- dimens ional problem into a colle ction of one-dimensio nal task s, which is co mputationally easy and offers more metho ds to use. The family-wise error or false discovery rate is controlled by aggr egating acr oss pro jections using a p -v a lue combination metho d. Our sim ula tion res ults show that the RP metho d has b etter size co ntrol, higher p ower, and accurate 22 lo cation detection w hen the break function is not cons tant in the consider e d cases . At the s a me time, the change lo catio n e s timate of the RP methods may have high v ariability . W e handle it b y rep eating RP methods and rep or ting the mo de ov er r ep etitions. The re a l-data analy s is illustrates how the prop osed RP metho d can b e use d in pra ctice. In summary , the RP metho d provides a computationally easy and c o nceptually simple a pproach for change point ana lysis in high dimensions. The sco p e o f this pa p er is limited to the s ingle change po int case. Extending the scop e to cover m ultiple change p oints would strengthen a pplicability . This topic will b e discusse d in a future work using bina ry segmentation as a breakthro ugh. References Ac hlio ptas, D. (2003). Databa se-friendly r andom pro jections: Johnson-lindenstr auss with bina ry coins. Journal of c omputer and System Scienc es 66 (4 ), 671–6 87. Aminikhanghahi, S. and D. J. Co ok (2017 ). A s urvey of metho ds for time series change p oint detection. Know le dge and information systems 51 (2), 339–36 7. Andrews, D. W. (19 91). Heteroskedasticit y and a uto correla tion consistent cov aria nce matrix estimation. Ec onometric a: Journal of the Ec onometric S o ciety , 817–8 58. Andrews, D. W. (1993 ). T ests for parameter instabilit y and structural change with unknown change po int . Ec onometric a: Journal of the Ec onometric S o ciety , 821–8 56. Arriaga , R. I. and S. V empala (19 9 9). An a lgorithmic theory of learning: Robust conce pts and ra ndom pro jection. In 40th Annual Symp osium on F oundations of Computer Scienc e (Cat. No. 99CB3 7039) , pp. 616–6 16. IE E E Computer So ciety . Aston, J. A. and C. Kirch (2012a ). Detecting and estimating changes in dependent functiona l data. Journal of Multivariate Analysis 109 , 204–22 0. Aston, J. A. and C. Kirch (201 2b). Ev alua ting s tationarity via c hange-p oint alternatives with applications to fmri data. Aston, J. A. and C. Kirch (2018 ). High dimensional efficiency with a pplications to change p oint tests. Ele ctro n ic Journal of Statistics 12 (1), 1901 – 1947. Aue, A., R. Gabrys, L. Horv´ ath, and P . Kokoszk a (20 09). Estimation of a change-p o int in the mean function of functiona l data. Journal of Multivariate Analy s is 100 (10), 2 254– 2269. 23 Aue, A. a nd L. Horv ´ ath (2 0 13). Structural breaks in time ser ies. Journal of Time Series Analysis 34 (1), 1–16. Aue, A., G. Rice, and O. S¨ onmez (2018). Detecting and dating structural breaks in functional data without dimension reduction. Journal of t he R oyal Statistic al So ciety. Series B (Statistic al Metho dolo gy) 80 (3), 509–5 29. Bai, J. (201 0 ). Common br eaks in means and v ar iances for panel data. Journal of Ec onometrics 15 7 (1), 78–92 . Benjamini, Y. and Y. Hoch b er g (199 5). Controlling the false discovery ra te: a prac tica l a nd p ow e r ful approach to multiple testing. J ournal of the R oyal statistic al so ciety: series B (Metho dolo gic al) 57 (1), 289–3 00. Benjamini, Y. a nd D. Y e kutieli (2001). The control of the fals e discovery rate in multiple testing under depe ndency . Annals of statistics , 116 5–11 88. Berkes, I., R. Gabr ys, L. Horv´ ath, and P . Kokoszk a (2 009). Detecting changes in the mean of functional observ ations. Journal of the R oyal Statistic al So ciety: Series B (S tatistic al Metho dolo gy) 71 (5), 927 –946. Bingham, E. and H. Mannila (2001). Ra ndom pro jection in dimensiona lit y reduction: applicatio ns to image and text data . In Pr o c e e dings of the seventh ACM SIGKDD i nternational c onfer enc e on Know le dge disc overy and data mining , pp. 245– 250. Bonferroni, C. (193 6). T e o ria statistica de lle classi e calcolo delle probabilita. Pubblic azioni del R Istituto Sup erior e di S cienze Ec onomiche e Commericiali di Fir enze 8 , 3–62 . Chan, J., L. Horv´ ath, and M. Hu ˇ skov´ a (2013 ). Darling–erd˝ os limit results for change-point detection in panel data. Journal of S tatistic al Planning and Infer enc e 143 (5), 95 5–970 . Cho, H. (2016). Chang e-p oint detection in pa nel data via double cusum statistic. Cs¨ org¨ o, M. a nd L. Horv ´ a th (19 93). Weighte d appr oximations in pr ob ability and stat ist ics . Wiley series in probability and statistics. Chichester, England; New Y ork, NY: John Wiley & Sons. Cs¨ org¨ o, M. and L. Horv´ ath (199 7). Limit the or ems in change-p oint analysis . Wiley series in proba bility and statistics. Chichester, Eng land; New Y or k, NY: John Wiley & So ns. Darling, D. A. and P . Erd¨ os (19 5 6). A limit theor em for the maximum of norma lized sums of independent random v ar iables. 24 Dasgupta, S. (2013 ). Ex p er iment s with random pr o jection. arXiv pr eprint arXiv:130 1.3849 . Dasgupta, S. and A. Gupta (2003). An elementary pr o of of a theorem of johnson and lindenstrauss. R andom Structures & Algo rithms 22 (1), 6 0–65 . Dette, H., K . Ko kot, and S. V olgushev (2020 ). T es ting r e le v a n t hypotheses in functional time ser ie s via self-normaliza tion. Jour n al of the Ro yal Statistic al So ciety Series B 82 (3), 6 29–6 60. Enikeev a, F. and Z . Harchaoui (2019). High- dimensional change-p oint detection under sparse alterna tives. Hidalgo, J. and M. H. Seo (2013). T esting for structura l stability in the who le sample. Journal of Ec ono- metrics 175 (2), 8 4–93. Horv´ ath, L. and M. Hu ˇ s ko v´ a (2012). Change-p oint detection in panel data. Journal of Time Series Anal y- sis 33 (4), 6 31–6 48. Horv´ ath, L ., P . Ko koszk a, and G. Rice (2014). T esting statio narity of functiona l time series. Journal of Ec onometrics 179 (1), 6 6–82 . Horv´ ath, L., C. Miller, a nd G. Rice (20 20). A new class of change p oint test statistics of r´ en yi type. Jou r n al of Business & Ec onomic Statist ics 38 (3), 5 70–5 7 9. Horv´ ath, L. and G. Rice (2 0 14). Extensions of some classical methods in change point a nalysis. T est 23 (2), 219–2 55. Jiao, S., N.-H. Chan, and C.-Y. Y au (202 2). Enhanced change-p oint de tec tio n in functional mea ns. arXiv pr eprint arXiv:2205 .04299 . Jirak, M. (2015 ). Unifor m change p oint tests in high dimension. The Annals of Statistics , 24 5 1–24 83. Johnson, W. B . and J. Lindenstr auss (1984). Extensio ns of lipschitz mapping s into hilb ert spa c e. Contem- p or ary mathematics 26 , 189– 206. Lee, J. R., M. Mendel, and A. Nao r (2005). Metric structures in l1: dimension, snowflakes, and average distortion. Eur op e an J ournal of Combinatorics 26 (8), 11 80–1 190. Li, P ., T. J. Hastie, and K. W. Ch ur ch (2006). V ery sparse random pro jections. I n Pr o c e e dings of the 12th ACM SIGKD D international c onfer enc e on K now le dge disc overy and data mining , pp. 28 7–296 . Liu, B., X. Zha ng, and Y. Liu (2022). High dimensional change p o int inference : Recen t developmen ts a nd extensions. Journ al of multivariate analysis 188 , 1 0483 3. 25 Liu, B., C. Z hou, X. Zhang, a nd Y. Liu (20 20). A unified data- adaptive framework for high dimensiona l change p o int detectio n. Journal of the R oyal Statistic al So ciety Series B: Statistic al Metho dolo gy 82 (4), 933–9 63. Liu, Y. a nd J. Xie (202 0). Cauch y combination test: a powerful test with ana lytic p-v alue calculatio n under arbitrar y dep e ndency s tructures. Journal of the Americ an Statistic al Asso ciation 115 (529), 3 93–40 2. Page, E. (195 5). A test for a change in a parameter o cc ur ring at an unknown p oint. Biometrika 42 (3/4), 523–5 27. Page, E . S. (1954). Contin uous inspectio n s chemes. Biometrika 41 (1/2), 1 00–1 15. Rho, Y. (202 4). Heavy-tailed p - v a lue combinations fro m the p ersp ective of extreme v a lue theory . arXiv pr eprint arXiv:2402 .03197 . W ang , G. and L. F eng (20 2 3). Computationa lly efficient a nd data-a da ptive changepoint infere nce in hig h dimension. Journ al of the Ro yal S tatistic al So ciety Series B: Statistic al Metho dolo gy 85 (3), 936–9 5 8. W ang , R., C. Z hu, S. V olgushev , a nd X. Shao (20 2 2). Inference for c ha nge p oints in high- dimens io nal data via selfnor malization. The Annals of St atist ics 50 (2), 781– 806. W ang , T. a nd R. J. Sa mw orth (201 8). High dimensional change po int estimation via spar se pr o jection. Journal of the R oyal Stat ist ic al So ciety. S eries B (Statistic al Metho dolo gy) 80 (1 ), 57–83 . Wilson, D. J. (2019). The ha rmonic mea n p-v alue for combining dep endent tests. Pr o c e e dings of the National A c ademy of Scienc es 116 (4 ), 1195– 1200 . Y u, M. and X. Chen (202 1). Finite sample change p oint inference a nd identification for high-dimensio nal mean vectors. Journal of the R oyal Statistic al S o ciety Series B: Statistic al Metho dolo gy 83 (2), 24 7–270 . 26 Supplemen tary Material The supplementary material pre sents additional sim ula tion results. Section S.1 presents additional results for the par ameter c ho ic e , relating to Section 3.1 : Subsection S.1.1 presents the r esults of the RP metho d using HA C estimator, a nd Subsection S.1.2 presents the r esults of the RP metho d using Horv´ ath et al. ( 2020 )’s v a r iance estimato r . Section S.2 pre sents e s timated change lo cations using weigh ted CUSUM appro aches. Section S.3 prese nt s figures similar to Figure 7 in Sectio n 3.3 but with different datasets. 27 S.1 Additional results for Subsection 3.1 S.1.1 Result of using the HAC v ariance estimator m=1 0.0 0.5 1.0 1.5 0.0 0.2 0.4 0.6 0.8 1.0 CUSUM DE HS HR Weighted Weighted n 0.25 Weighted n 0.5 Weighted log ( n ) m=5 0.0 0.5 1.0 1.5 m=20 0.0 0.5 1.0 1.5 (a) Setting 1 m=1 0.0 0.5 1.0 1.5 0.0 0.2 0.4 0.6 0.8 1.0 m=5 0.0 0.5 1.0 1.5 m=20 0.0 0.5 1.0 1.5 (b) Setting 2 m=1 0.0 0.5 1.0 1.5 0.0 0.2 0.4 0.6 0.8 1.0 m=5 0.0 0.5 1.0 1.5 m=20 0.0 0.5 1.0 1.5 (c) Setting 3 Figure S.1: R a w empirical rejection rates of the R P metho ds for v arious v alues of S N R in the x-axis. The RP metho d p erforms 200 random pro jections and applies different change p oin t tests (CUS UM, W eighted, DE, HS, HR) and th e Bonf com bination method . The data-generating pro cess follo ws ( 3.2 ) where the standard deviation σ g follo ws Settings 1-3 . The change p oint location is set at θ = 0 . 25. The empirical rejection rate is based on 1000 sim ulations. 28 m=1 0.0 0.5 1.0 1.5 0.0 0.2 0.4 0.6 0.8 1.0 CUSUM DE HS HR Weighted Weighted n 0.25 Weighted n 0.5 Weighted log ( n ) m=5 0.0 0.5 1.0 1.5 m=20 0.0 0.5 1.0 1.5 (a) Setting 1 m=1 0.0 0.5 1.0 1.5 0.0 0.2 0.4 0.6 0.8 1.0 m=5 0.0 0.5 1.0 1.5 m=20 0.0 0.5 1.0 1.5 (b) Setting 2 m=1 0.0 0.5 1.0 1.5 0.0 0.2 0.4 0.6 0.8 1.0 m=5 0.0 0.5 1.0 1.5 m=20 0.0 0.5 1.0 1.5 (c) Setting 3 Figure S.2: R a w empirical rejection rates of the R P metho ds for v arious v alues of S N R in the x-axis. The RP metho d p erforms 200 random pro jections and applies different change p oin t tests (CUS UM, W eighted, DE, HS, HR) and the BH com bination metho d. The data-generating pro cess follo ws ( 3.2 ) where the standard deviation σ g follo ws Settings 1-3 . The change p oint location is set at θ = 0 . 25. The empirical rejection rate is based on 1000 sim ulations. 29 m=1 0.0 0.5 1.0 1.5 0.0 0.2 0.4 0.6 0.8 1.0 CUSUM DE HS HR Weighted Weighted n 0.25 Weighted n 0.5 Weighted log ( n ) m=5 0.0 0.5 1.0 1.5 m=20 0.0 0.5 1.0 1.5 (a) Setting 1 m=1 0.0 0.5 1.0 1.5 0.0 0.2 0.4 0.6 0.8 1.0 m=5 0.0 0.5 1.0 1.5 m=20 0.0 0.5 1.0 1.5 (b) Setting 2 m=1 0.0 0.5 1.0 1.5 0.0 0.2 0.4 0.6 0.8 1.0 m=5 0.0 0.5 1.0 1.5 m=20 0.0 0.5 1.0 1.5 (c) Setting 3 Figure S.3: R a w empirical rejection rates of the R P metho ds for v arious v alues of S N R in the x-axis. The RP metho d p erforms 200 random pro jections and applies different change p oin t tests (CUS UM, W eighted, DE, HS, HR) and the CCT combination metho d. The data-generating process fo llo ws ( 3.2 ) where th e standard deviation σ g follo ws Settings 1-3 . The change p oint location is set at θ = 0 . 25. The empirical rejection rate is based on 1000 sim ulations. 30 m=1 0.0 0.5 1.0 1.5 0.0 0.2 0.4 0.6 0.8 1.0 CUSUM DE HS HR Weighted Weighted n 0.25 Weighted n 0.5 Weighted log ( n ) m=5 0.0 0.5 1.0 1.5 m=20 0.0 0.5 1.0 1.5 (a) Setting 1 m=1 0.0 0.5 1.0 1.5 0.0 0.2 0.4 0.6 0.8 1.0 m=5 0.0 0.5 1.0 1.5 m=20 0.0 0.5 1.0 1.5 (b) Setting 2 m=1 0.0 0.5 1.0 1.5 0.0 0.2 0.4 0.6 0.8 1.0 m=5 0.0 0.5 1.0 1.5 m=20 0.0 0.5 1.0 1.5 (c) Setting 3 Figure S.4: R a w empirical rejection rates of the R P metho ds for v arious v alues of S N R in the x-axis. The RP metho d p erforms 200 random pro jections and applies different change p oin t tests (CUS UM, W eighted, DE, HS, HR) and the HMP com bination metho d. The data-generating process follo ws ( 3.2 ) where the standard deviation σ g follo ws Settings 1-3 . The change p oint location is set at θ = 0 . 25. The empirical rejection rate is based on 1000 sim ulations. 31 m=1 0.0 0.5 1.0 1.5 0.0 0.2 0.4 0.6 0.8 1.0 Bonf BH HMP CCT m=5 0.0 0.5 1.0 1.5 m=20 0.0 0.5 1.0 1.5 (a) Setting 1 m=1 0.0 0.5 1.0 1.5 0.0 0.2 0.4 0.6 0.8 1.0 m=5 0.0 0.5 1.0 1.5 m=20 0.0 0.5 1.0 1.5 (b) Setting 2 m=1 0.0 0.5 1.0 1.5 0.0 0.2 0.4 0.6 0.8 1.0 m=5 0.0 0.5 1.0 1.5 m=20 0.0 0.5 1.0 1.5 (c) Setting 3 Figure S.5: (HAC) Ra w empirical rejection rates of the R P- Bonf, RP-BH, RP-HMP , and RP-CCT methods with the standard CUSUM test for v arious v alues of S N R in the x-axis. T he R P metho d p erforms 200 random p ro jections. The d ata-generating pro cess follo ws ( 3.2 ) where the stand ard deviation σ g follo ws Settings 1-3 . The change p oint location is set at θ = 0 . 25. The empirical rejection rate is based on 1000 simulations. 32 S.1.2 Result of using the v ariance estimator in H or v´ ath et al. ( 2020 ) m=1 0.0 0.5 1.0 1.5 0.0 0.2 0.4 0.6 0.8 1.0 CUSUM DE HS HR Weighted_log m=5 0.0 0.5 1.0 1.5 m=20 0.0 0.5 1.0 1.5 (a) Setting 1 , with m = 1 , 5 , 20 m=1 0.0 0.5 1.0 1.5 0.0 0.2 0.4 0.6 0.8 1.0 m=5 0.0 0.5 1.0 1.5 m=20 0.0 0.5 1.0 1.5 (b) Setting 2 , with m = 1 , 5 , 20 m=1 0.0 0.5 1.0 1.5 0.0 0.2 0.4 0.6 0.8 1.0 m=5 0.0 0.5 1.0 1.5 m=20 0.0 0.5 1.0 1.5 (c) Setting 3 , with m = 1 , 5 , 20 Figure S.6: Raw empirical rejection rates of RP-Bonf method u sing different c h ange p oint t ests with k = 200 in sim u lated data with θ = 0 . 5. 33 m=1 0.0 0.5 1.0 1.5 0.0 0.2 0.4 0.6 0.8 1.0 CUSUM DE HS HR Weighted_log m=5 0.0 0.5 1.0 1.5 m=20 0.0 0.5 1.0 1.5 (a) Setting 1 , with m = 1 , 5 , 20 m=1 0.0 0.5 1.0 1.5 0.0 0.2 0.4 0.6 0.8 1.0 m=5 0.0 0.5 1.0 1.5 m=20 0.0 0.5 1.0 1.5 (b) Setting 2 , with m = 1 , 5 , 20 m=1 0.0 0.5 1.0 1.5 0.0 0.2 0.4 0.6 0.8 1.0 m=5 0.0 0.5 1.0 1.5 m=20 0.0 0.5 1.0 1.5 (c) Setting 3 , with m = 1 , 5 , 20 Figure S.7: Adjusted empirical rejection rates of RP-Bonf metho d using different change p oint tests with k = 200 in sim ulated data with θ = 0 . 5. 34 m=1 0.0 0.5 1.0 1.5 0.0 0.2 0.4 0.6 0.8 1.0 CUSUM DE HS HR Weighted Weighted n 0.25 Weighted n 0.5 Weighted log ( n ) m=5 0.0 0.5 1.0 1.5 m=20 0.0 0.5 1.0 1.5 (a) Setting 1 m=1 0.0 0.5 1.0 1.5 0.0 0.2 0.4 0.6 0.8 1.0 m=5 0.0 0.5 1.0 1.5 m=20 0.0 0.5 1.0 1.5 (b) Setting 2 m=1 0.0 0.5 1.0 1.5 0.0 0.2 0.4 0.6 0.8 1.0 m=5 0.0 0.5 1.0 1.5 m=20 0.0 0.5 1.0 1.5 (c) Setting 3 Figure S.8: Raw empirical rejection rates of the RP metho ds for v arious v alues of S N R in the x- axis. The RP metho d p erforms 200 random pro jections and applies different change p oin t tests (CUS UM, W eighted, DE, HS, HR) and th e Bonf com bination method . The data-generating pro cess follo ws ( 3.2 ) where the standard deviation σ g follo ws Settings 1-3 . The change p oint location is set at θ = 0 . 25. The empirical rejection rate is based on 1000 sim ulations. 35 m=1 0.0 0.5 1.0 1.5 0.0 0.2 0.4 0.6 0.8 1.0 CUSUM DE HS HR Weighted Weighted n 0.25 Weighted n 0.5 Weighted log ( n ) m=5 0.0 0.5 1.0 1.5 m=20 0.0 0.5 1.0 1.5 (a) Setting 1 m=1 0.0 0.5 1.0 1.5 0.0 0.2 0.4 0.6 0.8 1.0 m=5 0.0 0.5 1.0 1.5 m=20 0.0 0.5 1.0 1.5 (b) Setting 2 m=1 0.0 0.5 1.0 1.5 0.0 0.2 0.4 0.6 0.8 1.0 m=5 0.0 0.5 1.0 1.5 m=20 0.0 0.5 1.0 1.5 (c) Setting 3 Figure S.9: Raw empirical rejection rates of the RP metho ds for v arious v alues of S N R in the x- axis. The RP metho d p erforms 200 random pro jections and applies different change p oin t tests (CUS UM, W eighted, DE, HS, HR) and the BH com bination metho d. The data-generating pro cess follo ws ( 3.2 ) where the standard deviation σ g follo ws Settings 1-3 . The change p oint location is set at θ = 0 . 25. The empirical rejection rate is based on 1000 sim ulations. 36 m=1 0.0 0.5 1.0 1.5 0.0 0.2 0.4 0.6 0.8 1.0 CUSUM DE HS HR Weighted Weighted n 0.25 Weighted n 0.5 Weighted log ( n ) m=5 0.0 0.5 1.0 1.5 m=20 0.0 0.5 1.0 1.5 (a) Setting 1 m=1 0.0 0.5 1.0 1.5 0.0 0.2 0.4 0.6 0.8 1.0 m=5 0.0 0.5 1.0 1.5 m=20 0.0 0.5 1.0 1.5 (b) Setting 2 m=1 0.0 0.5 1.0 1.5 0.0 0.2 0.4 0.6 0.8 1.0 m=5 0.0 0.5 1.0 1.5 m=20 0.0 0.5 1.0 1.5 (c) Setting 3 Figure S.10: Raw empirical rejection rates of th e RP metho ds for va rious va lues of S N R in th e x-axis. The RP metho d p erforms 200 random pro jections and applies different change p oin t tests (CUS UM, W eighted, DE, HS, HR) and the HMP com bination metho d. The data-generating process follo ws ( 3.2 ) where the standard deviation σ g follo ws Settings 1-3 . The change p oint location is set at θ = 0 . 25. The empirical rejection rate is based on 1000 sim ulations. 37 m=1 0.0 0.5 1.0 1.5 0.0 0.2 0.4 0.6 0.8 1.0 CUSUM DE HS HR Weighted Weighted n 0.25 Weighted n 0.5 Weighted log ( n ) m=5 0.0 0.5 1.0 1.5 m=20 0.0 0.5 1.0 1.5 (a) Setting 1 m=1 0.0 0.5 1.0 1.5 0.0 0.2 0.4 0.6 0.8 1.0 m=5 0.0 0.5 1.0 1.5 m=20 0.0 0.5 1.0 1.5 (b) Setting 2 m=1 0.0 0.5 1.0 1.5 0.0 0.2 0.4 0.6 0.8 1.0 m=5 0.0 0.5 1.0 1.5 m=20 0.0 0.5 1.0 1.5 (c) Setting 3 Figure S.11: Raw empirical rejection rates of th e RP metho ds for va rious va lues of S N R in th e x-axis. The RP metho d p erforms 200 random pro jections and applies different change p oin t tests (CUS UM, W eighted, DE, HS, HR) and the CCT combination metho d. The data-generating process fo llo ws ( 3.2 ) where th e standard deviation σ g follo ws Settings 1-3 . The change p oint location is set at θ = 0 . 25. The empirical rejection rate is based on 1000 sim ulations. 38 m=1 0.0 0.5 1.0 1.5 0.0 0.2 0.4 0.6 0.8 1.0 CUSUM DE HS HR Weighted Weighted n 0.25 Weighted n 0.5 Weighted log ( n ) m=5 0.0 0.5 1.0 1.5 m=20 0.0 0.5 1.0 1.5 (a) Setting 1 m=1 0.0 0.5 1.0 1.5 0.0 0.2 0.4 0.6 0.8 1.0 m=5 0.0 0.5 1.0 1.5 m=20 0.0 0.5 1.0 1.5 (b) Setting 2 m=1 0.0 0.5 1.0 1.5 0.0 0.2 0.4 0.6 0.8 1.0 m=5 0.0 0.5 1.0 1.5 m=20 0.0 0.5 1.0 1.5 (c) Setting 3 Figure S.12 : Ad justed empirical rejection rates of the RP methods for v arious v alues of S N R in the x - axis. The RP metho d p erforms 200 random pro jections and applies different change p oin t tests (CUS UM, W eighted, DE, HS, HR) and the BH com bination metho d. The data-generating pro cess follo ws ( 3.2 ) where the standard deviation σ g follo ws Settings 1-3 . The change p oint location is set at θ = 0 . 25. The empirical rejection rate is based on 1000 sim ulations. 39 m=1 0.0 0.5 1.0 1.5 0.0 0.2 0.4 0.6 0.8 1.0 CUSUM DE HS HR Weighted Weighted n 0.25 Weighted n 0.5 Weighted log ( n ) m=5 0.0 0.5 1.0 1.5 m=20 0.0 0.5 1.0 1.5 (a) Setting 1 m=1 0.0 0.5 1.0 1.5 0.0 0.2 0.4 0.6 0.8 1.0 m=5 0.0 0.5 1.0 1.5 m=20 0.0 0.5 1.0 1.5 (b) Setting 2 m=1 0.0 0.5 1.0 1.5 0.0 0.2 0.4 0.6 0.8 1.0 m=5 0.0 0.5 1.0 1.5 m=20 0.0 0.5 1.0 1.5 (c) Setting 3 Figure S.1 3: Adjusted empirical rejection rates of the R P metho ds for v arious v alues of S N R in the x-axis. The RP metho d p erforms 200 random pro jections and applies different c h ange p oint tests (CUSUM, W eigh t ed, DE, H S, HR) and the HMP combination metho d. The d ata-generating pro cess follo ws ( 3.2 ) where the standard d eviation σ g follo ws Settings 1-3 . The change p oint lo cation is set at θ = 0 . 25. The empirical rejection rate is based on 1000 sim u lations. 40 m=1 0.0 0.5 1.0 1.5 0.0 0.2 0.4 0.6 0.8 1.0 CUSUM DE HS HR Weighted Weighted n 0.25 Weighted n 0.5 Weighted log ( n ) m=5 0.0 0.5 1.0 1.5 m=20 0.0 0.5 1.0 1.5 (a) Setting 1 m=1 0.0 0.5 1.0 1.5 0.0 0.2 0.4 0.6 0.8 1.0 m=5 0.0 0.5 1.0 1.5 m=20 0.0 0.5 1.0 1.5 (b) Setting 2 m=1 0.0 0.5 1.0 1.5 0.0 0.2 0.4 0.6 0.8 1.0 m=5 0.0 0.5 1.0 1.5 m=20 0.0 0.5 1.0 1.5 (c) Setting 3 Figure S.14 : Adjusted empirical rejection rates of the R P metho ds for v arious val u es of S N R in the x-axis. The RP metho d p erforms 200 random pro jections and applies different c h ange p oint tests (CUSUM, W eigh t ed, DE, H S, HR) and the CCT com b in ation metho d. The data-generating pro cess follo ws ( 3.2 ) where the standard deviation σ g follo ws Settings 1-3 . The change p oint lo cation is set at θ = 0 . 25. The empirical rejection rate is based on 1000 sim u lations. 41 m=1 0.0 0.5 1.0 1.5 0.0 0.2 0.4 0.6 0.8 1.0 Bonf BH HMP CCT m=5 0.0 0.5 1.0 1.5 m=20 0.0 0.5 1.0 1.5 (a) Setting 1 m=1 0.0 0.5 1.0 1.5 0.0 0.2 0.4 0.6 0.8 1.0 m=5 0.0 0.5 1.0 1.5 m=20 0.0 0.5 1.0 1.5 (b) Setting 2 m=1 0.0 0.5 1.0 1.5 0.0 0.2 0.4 0.6 0.8 1.0 m=5 0.0 0.5 1.0 1.5 m=20 0.0 0.5 1.0 1.5 (c) Setting 3 Figure S.15: Raw empirical rejection rates of the RP-Bonf, R P-BH, RP-H MP , and RP-CCT metho ds with the standard CUSUM test for v arious v alues of S N R in the x-axis. T he R P metho d p erforms 200 random p ro jections. The d ata-generating pro cess follo ws ( 3.2 ) where the stand ard deviation σ g follo ws Settings 1-3 . The change p oint location is set at θ = 0 . 25. The empirical rejection rate is based on 1000 simulations. 42 Empirical rejection ra te under the null (significance level 0.05 ) Bonf HMP BH CCT Setting 1 CUSUM 0.011 0.083 0.040 0.061 DE 0.000 0.010 0.001 0.009 HS 0.001 0.022 0.010 0.017 HR 0.013 0.077 0.034 0.068 W eighted 0.024 0.131 0.059 0.110 W eighted n 0 . 25 0.024 0.136 0.065 0.126 W eighted n 0 . 5 0.022 0.128 0.068 0.107 W eighted l og ( n ) 0.021 0.123 0.059 0.103 Setting 2 CUSUM 0.014 0.080 0.044 0.074 DE 0.000 0.015 0.001 0.015 HS 0.000 0.024 0.009 0.021 HR 0.017 0.075 0.035 0.071 W eighted 0.025 0.114 0.060 0.101 W eighted n 0 . 25 0.025 0.126 0.061 0.113 W eighted n 0 . 5 0.027 0.123 0.070 0.113 W eighted l og ( n ) 0.023 0.117 0.059 0.102 Setting 3 CUSUM 0.052 0.122 0.069 0.088 DE 0.000 0.007 0.000 0.004 HS 0.004 0.022 0.005 0.019 HR 0.052 0.122 0.054 0.097 W eighted 0.092 0.200 0.109 0.151 W eighted n 0 . 25 0.086 0.208 0.108 0.172 W eighted n 0 . 5 0.108 0.212 0.128 0.143 W eighted l og ( n ) 0.083 0.187 0.104 0.143 T a ble S.1 : Empirical rejection rate und er the null of RP meth od using different tests and p -v alue combination metho d s with k = 200. 43 0 200 400 600 800 1000 0.0 0.2 0.4 0.6 0.8 1.0 Bonf BH HMP CCT (a) S N R = 0 m=1 0 200 400 600 800 1000 0.0 0.2 0.4 0.6 0.8 1.0 m=5 0 200 400 600 800 1000 m=20 0 200 400 600 800 1000 (b) S N R = 0 . 5 m=1 0 200 400 600 800 1000 0.0 0.2 0.4 0.6 0.8 1.0 m=5 0 200 400 600 800 1000 m=20 0 200 400 600 800 1000 (c) S N R = 1 . 5 Figure S.16: Raw empirical rejection rates of the RP-Bonf, RP-BH, RP- HMP and RP-CCT metho ds with th e standard CUS UM test for v arious c hoices of num b er k of random pro jections in the x- axis. The d ata-generating process follo ws ( 3.2 ) where th e standard d eviation σ g follo ws Setting 1 . The c han ge p oint location is set at θ = 0 . 25. The empirical rejection rate is based on 1000 sim ulations. 44 0 200 400 600 800 1000 0.0 0.2 0.4 0.6 0.8 1.0 Bonf BH HMP CCT (a) S N R = 0 m=1 0 200 400 600 800 1000 0.0 0.2 0.4 0.6 0.8 1.0 m=5 0 200 400 600 800 1000 m=20 0 200 400 600 800 1000 (b) S N R = 0 . 5 m=1 0 200 400 600 800 1000 0.0 0.2 0.4 0.6 0.8 1.0 m=5 0 200 400 600 800 1000 m=20 0 200 400 600 800 1000 (c) S N R = 1 . 5 Figure S.17: Raw empirical rejection rates of the RP-Bonf, RP-BH, RP- HMP and RP-CCT metho ds with th e standard CUS UM test for v arious c hoices of num b er k of random pro jections in the x- axis. The d ata-generating process follo ws ( 3.2 ) where th e standard d eviation σ g follo ws Setting 2 . The c han ge p oint location is set at θ = 0 . 25. The empirical rejection rate is based on 1000 sim ulations. 45 0 200 400 600 800 1000 0.0 0.2 0.4 0.6 0.8 1.0 Bonf BH HMP CCT (a) S N R = 0 m=1 0 200 400 600 800 1000 0.0 0.2 0.4 0.6 0.8 1.0 m=5 0 200 400 600 800 1000 m=20 0 200 400 600 800 1000 (b) S N R = 0 . 5 m=1 0 200 400 600 800 1000 0.0 0.2 0.4 0.6 0.8 1.0 m=5 0 200 400 600 800 1000 m=20 0 200 400 600 800 1000 (c) S N R = 1 . 5 Figure S.18: Raw empirical rejection rates of the RP-Bonf, RP-BH, RP- HMP and RP-CCT metho ds with th e standard CUS UM test for v arious c hoices of num b er k of random pro jections in the x- axis. The d ata-generating process follo ws ( 3.2 ) where th e standard d eviation σ g follo ws Setting 3 . The c han ge p oint location is set at θ = 0 . 25. The empirical rejection rate is based on 1000 sim ulations. 46 0 200 400 600 800 1000 0.0 0.2 0.4 0.6 0.8 1.0 Bonf BH HMP CCT (a) S N R = 0 m=1 0 200 400 600 800 1000 0.0 0.2 0.4 0.6 0.8 1.0 m=5 0 200 400 600 800 1000 m=20 0 200 400 600 800 1000 (b) S N R = 0 . 5 m=1 0 200 400 600 800 1000 0.0 0.2 0.4 0.6 0.8 1.0 m=5 0 200 400 600 800 1000 m=20 0 200 400 600 800 1000 (c) S N R = 1 . 5 Figure S.19: Adjusted empirical rejection rates of the RP-Bonf, RP-BH, R P-HMP and RP-CCT meth od s with the stand ard CUSU M test for va rious choices of num b er k of random pro jections in th e x- axis. The data-generating process follo ws ( 3.2 ) where th e standard d eviation σ g follo ws Setting 2 . The c han ge p oint location is set at θ = 0 . 25. The empirical rejection rate is based on 1000 sim ulations. 47 0 200 400 600 800 1000 0.0 0.2 0.4 0.6 0.8 1.0 Bonf BH HMP CCT (a) S N R = 0 m=1 0 200 400 600 800 1000 0.0 0.2 0.4 0.6 0.8 1.0 m=5 0 200 400 600 800 1000 m=20 0 200 400 600 800 1000 (b) S N R = 0 . 5 m=1 0 200 400 600 800 1000 0.0 0.2 0.4 0.6 0.8 1.0 m=5 0 200 400 600 800 1000 m=20 0 200 400 600 800 1000 (c) S N R = 1 . 5 Figure S.20: Adjusted empirical rejection rates of the RP-Bonf, RP-BH, R P-HMP and RP-CCT meth od s with the stand ard CUSU M test for va rious choices of num b er k of random pro jections in th e x- axis. The data-generating process follo ws ( 3.2 ) where th e standard d eviation σ g follo ws Setting 3 . The c han ge p oint location is set at θ = 0 . 25. The empirical rejection rate is based on 1000 sim ulations. 48 m=1 0 200 400 600 800 1000 0.0 0.1 0.2 0.3 0.4 0.5 Bonf BH m=5 0 200 400 600 800 1000 m=20 0 200 400 600 800 1000 (a) Setting 1 m=1 0 200 400 600 800 1000 0.0 0.1 0.2 0.3 0.4 0.5 m=5 0 200 400 600 800 1000 m=20 0 200 400 600 800 1000 (b) Setting 2 m=1 0 200 400 600 800 1000 0.0 0.1 0.2 0.3 0.4 0.5 m=5 0 200 400 600 800 1000 m=20 0 200 400 600 800 1000 (c) Setting 3 Figure S.21: RMSE of estimated significant c h ange p oint locations detected by the RP-Bonf and RP-BH meth ods with the standard CUSU M test for v arious choices of number k of random pro jections in the x -axis. The data- generating process follo ws ( 3.2 ) where th e stand ard deviation σ g follo ws Settings 1-3 . The change p oint lo cation is set at θ = 0 . 2 5. The RMSE is based on 1000 simulations. 49 S.2 Comparison of differen t metho ds using w eigh ted CUSUM 0.00 0.25 0.50 0.75 1.00 DKV DKV− weighted RP−BH RP−BH− weighted RP−Bonf RP−Bonf− weighted WS WS− weighted DKV DKV− weighted RP−BH RP−BH− weighted RP−Bonf RP−Bonf− weighted WS WS− weighted DKV DKV− weighted RP−BH RP−BH− weighted RP−Bonf RP−Bonf− weighted WS WS− weighted (a) Setting 1 , with m = 1 , 5 , 20 0.00 0.25 0.50 0.75 1.00 DKV DKV− weighted RP−BH RP−BH− weighted RP−Bonf RP−Bonf− weighted WS WS− weighted DKV DKV− weighted RP−BH RP−BH− weighted RP−Bonf RP−Bonf− weighted WS WS− weighted DKV DKV− weighted RP−BH RP−BH− weighted RP−Bonf RP−Bonf− weighted WS WS− weighted (b) Setting 2 , with m = 1 , 5 , 20 0.00 0.25 0.50 0.75 1.00 DKV DKV− weighted RP−BH RP−BH− weighted RP−Bonf RP−Bonf− weighted WS WS− weighted DKV DKV− weighted RP−BH RP−BH− weighted RP−Bonf RP−Bonf− weighted WS WS− weighted DKV DKV− weighted RP−BH RP−BH− weighted RP−Bonf RP−Bonf− weighted WS WS− weighted (c) Setting 3 , with m = 1 , 5 , 20 Figure S.22: Estimated change p oint lo cations detected by different metho ds o n 1000 simulations, using the standard CUSUM approaches or w eighted CUSUM approa ches with tr imming choice of ⌊ nτ ⌋ = 1. The data-gener ating pr o cess follows ( 3.2 ) where the standard deviation σ g follows Settings 1-3 . The change p oint lo cation is set at θ = 0 . 25. The magnitude of the br eak function is sc aled by S N R = 0 . 5 . 50 S.3 Rep eating the pro cedure in Subsection 3.3 using additional datasets This section pr e s ents additiona l simulation results for Subsectio n 3.3 . Figur e s in this se ction ar e the same as Figur e 7 , except for the underlying dataset. 0.00 0.25 0.50 0.75 1.00 DKV FF FPC−0.85 FPC−0.90 FPC−0.95 RP−BH RP−Bonf RP−BH−sig RP−Bonf−sig WS DKV FF FPC−0.85 FPC−0.90 FPC−0.95 RP−BH RP−Bonf RP−BH−sig RP−Bonf−sig WS DKV FF FPC−0.85 FPC−0.90 FPC−0.95 RP−BH RP−Bonf RP−BH−sig RP−Bonf−sig WS (a) Setting 1 , with m = 1 , 5 , 20 0.00 0.25 0.50 0.75 1.00 DKV FF FPC−0.85 FPC−0.90 FPC−0.95 RP−BH RP−Bonf RP−BH−sig RP−Bonf−sig WS DKV FF FPC−0.85 FPC−0.90 FPC−0.95 RP−BH RP−Bonf RP−BH−sig RP−Bonf−sig WS DKV FF FPC−0.85 FPC−0.90 FPC−0.95 RP−BH RP−Bonf RP−BH−sig RP−Bonf−sig WS (b) Setting 2 , with m = 1 , 5 , 20 0.00 0.25 0.50 0.75 1.00 DKV FF FPC−0.85 FPC−0.90 FPC−0.95 RP−BH RP−Bonf RP−BH−sig RP−Bonf−sig WS DKV FF FPC−0.85 FPC−0.90 FPC−0.95 RP−BH RP−Bonf RP−BH−sig RP−Bonf−sig WS DKV FF FPC−0.85 FPC−0.90 FPC−0.95 RP−BH RP−Bonf RP−BH−sig RP−Bonf−sig WS (c) Setting 3 , with m = 1 , 5 , 20 Figure S.2 3 : Estimated change p oin t locations detected by rep eating the method s on one d ataset (Dataset 2) 1000 times. F or th e RP metho ds, the mo de of t h e estimated locations across the 1000 repetitions is marked by a red d ot. The d ata-generating pro cess follo ws ( 3.2 ) where the stand ard deviation σ g follo ws Settings 1-3 . The change p oint location is set at θ = 0 . 25. The magnitude of th e break function is scaled by S N R = 0 . 5. 51 0.00 0.25 0.50 0.75 1.00 DKV FF FPC−0.85 FPC−0.90 FPC−0.95 RP−BH RP−Bonf RP−BH−sig RP−Bonf−sig WS DKV FF FPC−0.85 FPC−0.90 FPC−0.95 RP−BH RP−Bonf RP−BH−sig RP−Bonf−sig WS DKV FF FPC−0.85 FPC−0.90 FPC−0.95 RP−BH RP−Bonf RP−BH−sig RP−Bonf−sig WS (a) Setting 1 , with m = 1 , 5 , 20 0.00 0.25 0.50 0.75 1.00 DKV FF FPC−0.85 FPC−0.90 FPC−0.95 RP−BH RP−Bonf RP−BH−sig RP−Bonf−sig WS DKV FF FPC−0.85 FPC−0.90 FPC−0.95 RP−BH RP−Bonf RP−BH−sig RP−Bonf−sig WS DKV FF FPC−0.85 FPC−0.90 FPC−0.95 RP−BH RP−Bonf RP−BH−sig RP−Bonf−sig WS (b) Setting 2 , with m = 1 , 5 , 20 0.00 0.25 0.50 0.75 1.00 DKV FF FPC−0.85 FPC−0.90 FPC−0.95 RP−BH RP−Bonf RP−BH−sig RP−Bonf−sig WS DKV FF FPC−0.85 FPC−0.90 FPC−0.95 RP−BH RP−Bonf RP−BH−sig RP−Bonf−sig WS DKV FF FPC−0.85 FPC−0.90 FPC−0.95 RP−BH RP−Bonf RP−BH−sig RP−Bonf−sig WS (c) Setting 3 , with m = 1 , 5 , 20 Figure S.2 4 : Estimated change p oin t locations detected by rep eating the method s on one d ataset (Dataset 3) 1000 times. F or th e RP metho ds, the mo de of t h e estimated locations across the 1000 repetitions is marked by a red d ot. The d ata-generating pro cess follo ws ( 3.2 ) where the stand ard deviation σ g follo ws Settings 1-3 . The change p oint location is set at θ = 0 . 25. The magnitude of th e break function is scaled by S N R = 0 . 5. 52 0.00 0.25 0.50 0.75 1.00 DKV FF FPC−0.85 FPC−0.90 FPC−0.95 RP−BH RP−Bonf RP−BH−sig RP−Bonf−sig WS DKV FF FPC−0.85 FPC−0.90 FPC−0.95 RP−BH RP−Bonf RP−BH−sig RP−Bonf−sig WS DKV FF FPC−0.85 FPC−0.90 FPC−0.95 RP−BH RP−Bonf RP−BH−sig RP−Bonf−sig WS (a) Setting 1 , with m = 1 , 5 , 20 0.00 0.25 0.50 0.75 1.00 DKV FF FPC−0.85 FPC−0.90 FPC−0.95 RP−BH RP−Bonf RP−BH−sig RP−Bonf−sig WS DKV FF FPC−0.85 FPC−0.90 FPC−0.95 RP−BH RP−Bonf RP−BH−sig RP−Bonf−sig WS DKV FF FPC−0.85 FPC−0.90 FPC−0.95 RP−BH RP−Bonf RP−BH−sig RP−Bonf−sig WS (b) Setting 2 , with m = 1 , 5 , 20 0.00 0.25 0.50 0.75 1.00 DKV FF FPC−0.85 FPC−0.90 FPC−0.95 RP−BH RP−Bonf RP−BH−sig RP−Bonf−sig WS DKV FF FPC−0.85 FPC−0.90 FPC−0.95 RP−BH RP−Bonf RP−BH−sig RP−Bonf−sig WS DKV FF FPC−0.85 FPC−0.90 FPC−0.95 RP−BH RP−Bonf RP−BH−sig RP−Bonf−sig WS (c) Setting 3 , with m = 1 , 5 , 20 Figure S.2 5 : Estimated change p oin t locations detected by rep eating the method s on one d ataset (Dataset 4) 1000 times. F or th e RP metho ds, the mo de of t h e estimated locations across the 1000 repetitions is marked by a red d ot. The d ata-generating pro cess follo ws ( 3.2 ) where the stand ard deviation σ g follo ws Settings 1-3 . The change p oint location is set at θ = 0 . 25. The magnitude of th e break function is scaled by S N R = 0 . 5. 53 0.00 0.25 0.50 0.75 1.00 DKV FF FPC−0.85 FPC−0.90 FPC−0.95 RP−BH RP−Bonf RP−BH−sig RP−Bonf−sig WS DKV FF FPC−0.85 FPC−0.90 FPC−0.95 RP−BH RP−Bonf RP−BH−sig RP−Bonf−sig WS DKV FF FPC−0.85 FPC−0.90 FPC−0.95 RP−BH RP−Bonf RP−BH−sig RP−Bonf−sig WS (a) Setting 1 , with m = 1 , 5 , 20 0.00 0.25 0.50 0.75 1.00 DKV FF FPC−0.85 FPC−0.90 FPC−0.95 RP−BH RP−Bonf RP−BH−sig RP−Bonf−sig WS DKV FF FPC−0.85 FPC−0.90 FPC−0.95 RP−BH RP−Bonf RP−BH−sig RP−Bonf−sig WS DKV FF FPC−0.85 FPC−0.90 FPC−0.95 RP−BH RP−Bonf RP−BH−sig RP−Bonf−sig WS (b) Setting 2 , with m = 1 , 5 , 20 0.00 0.25 0.50 0.75 1.00 DKV FF FPC−0.85 FPC−0.90 FPC−0.95 RP−BH RP−Bonf RP−BH−sig RP−Bonf−sig WS DKV FF FPC−0.85 FPC−0.90 FPC−0.95 RP−BH RP−Bonf RP−BH−sig RP−Bonf−sig WS DKV FF FPC−0.85 FPC−0.90 FPC−0.95 RP−BH RP−Bonf RP−BH−sig RP−Bonf−sig WS (c) Setting 3 , with m = 1 , 5 , 20 Figure S.2 6 : Estimated change p oin t locations detected by rep eating the method s on one d ataset (Dataset 5) 1000 times. F or th e RP metho ds, the mo de of t h e estimated locations across the 1000 repetitions is marked by a red d ot. The d ata-generating pro cess follo ws ( 3.2 ) where the stand ard deviation σ g follo ws Settings 1-3 . The change p oint location is set at θ = 0 . 25. The magnitude of th e break function is scaled by S N R = 0 . 5. 54 0.00 0.25 0.50 0.75 1.00 DKV FF FPC−0.85 FPC−0.90 FPC−0.95 RP−BH RP−Bonf RP−BH−sig RP−Bonf−sig WS DKV FF FPC−0.85 FPC−0.90 FPC−0.95 RP−BH RP−Bonf RP−BH−sig RP−Bonf−sig WS DKV FF FPC−0.85 FPC−0.90 FPC−0.95 RP−BH RP−Bonf RP−BH−sig RP−Bonf−sig WS (a) Setting 1 , with m = 1 , 5 , 20 0.00 0.25 0.50 0.75 1.00 DKV FF FPC−0.85 FPC−0.90 FPC−0.95 RP−BH RP−Bonf RP−BH−sig RP−Bonf−sig WS DKV FF FPC−0.85 FPC−0.90 FPC−0.95 RP−BH RP−Bonf RP−BH−sig RP−Bonf−sig WS DKV FF FPC−0.85 FPC−0.90 FPC−0.95 RP−BH RP−Bonf RP−BH−sig RP−Bonf−sig WS (b) Setting 2 , with m = 1 , 5 , 20 0.00 0.25 0.50 0.75 1.00 DKV FF FPC−0.85 FPC−0.90 FPC−0.95 RP−BH RP−Bonf RP−BH−sig RP−Bonf−sig WS DKV FF FPC−0.85 FPC−0.90 FPC−0.95 RP−BH RP−Bonf RP−BH−sig RP−Bonf−sig WS DKV FF FPC−0.85 FPC−0.90 FPC−0.95 RP−BH RP−Bonf RP−BH−sig RP−Bonf−sig WS (c) Setting 3 , with m = 1 , 5 , 20 Figure S.2 7 : Estimated change p oin t locations detected by rep eating the method s on one d ataset (Dataset 6) 1000 times. F or th e RP metho ds, the mo de of t h e estimated locations across the 1000 repetitions is marked by a red d ot. The d ata-generating pro cess follo ws ( 3.2 ) where the stand ard deviation σ g follo ws Settings 1-3 . The change p oint location is set at θ = 0 . 25. The magnitude of th e break function is scaled by S N R = 0 . 5. 55
Original Paper
Loading high-quality paper...
Comments & Academic Discussion
Loading comments...
Leave a Comment