Uncertainty-Aware Delivery Delay Duration Prediction via Multi-Task Deep Learning
Accurate delivery delay prediction is critical for maintaining operational efficiency and customer satisfaction across modern supply chains. Yet the increasing complexity of logistics networks, spanning multimodal transportation, cross-country routin…
Authors: Stefan Faulkner, Reza Z, ehshahvar
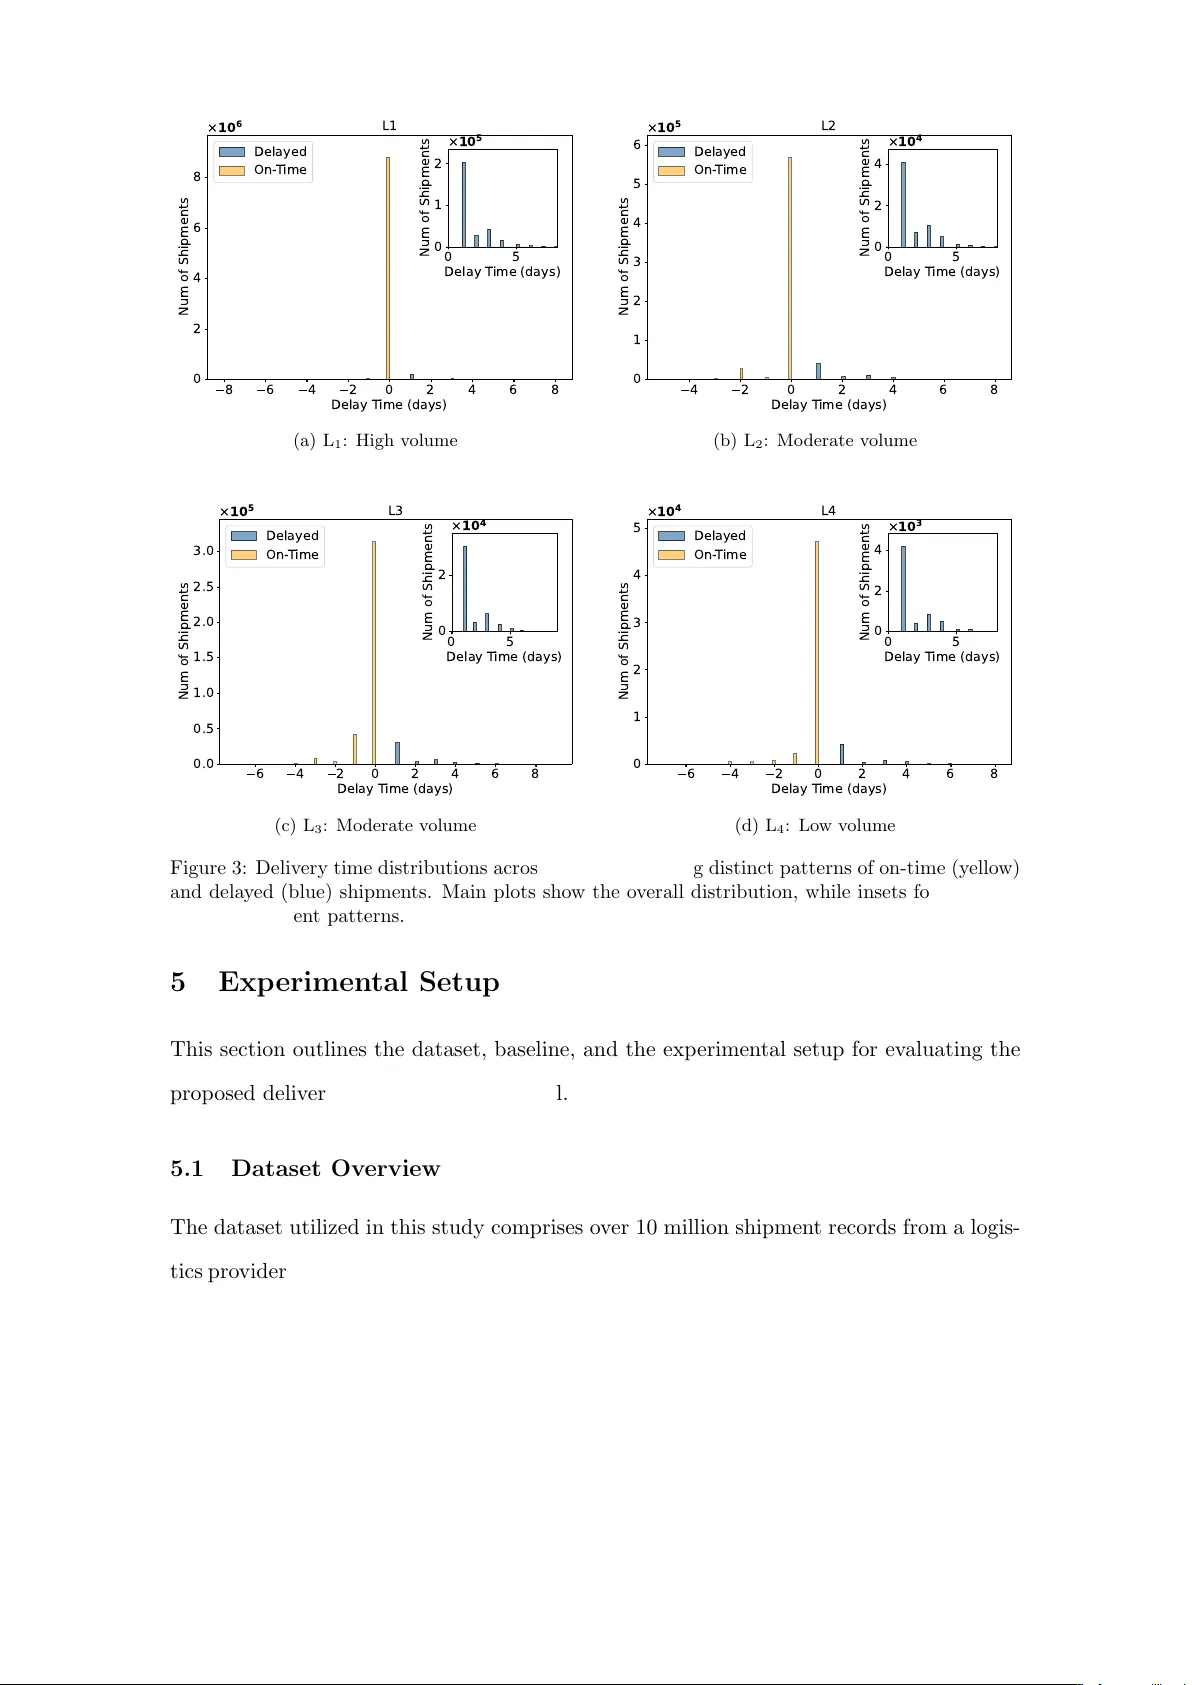
Uncertain t y-Aw are Deliv ery Dela y Duration Prediction via Multi-T ask Deep Learning Stefan F aulkner 1 , Reza Zandehshah v ar 1 , V ahid Egh bal Akhlaghi 2 , Sebastien Ouellet 2 , Carsten Jordan 2 , P ascal V an Hentenryc k 1 1 NSF Artificial In telligence Institute for Adv ances in Optimization, H. Milton Stew art School of Industrial and Systems Engineering, Georgia Institute of T ec hnology , Atlan ta, GA, USA 2 Kinaxis { sfaulkner9, mohammadreza3, pvh } @gatech.edu { vakhlaghi, souellet, cjordan } @kinaxis.com Abstract Accurate deliv ery delay prediction is critical for maintaining op erational efficiency and customer satisfaction across mo dern supply c hains. Y et the increasing complex- it y of logistics netw orks, spanning multimodal transp ortation, cross-coun try routing, and pronounced regional v ariability , makes this prediction task inheren tly c hallenging. This pap er in tro duces a multi-task deep learning model for delivery dela y duration prediction in the presence of significant imbalanced data, where dela yed shipmen ts are rare but op erationally consequen tial. The model embeds high-dimensional ship- men t features with dedicated em b edding lay ers for tabular data, and then uses a classification-then-regression strategy to predict the delivery delay duration for on- time and delay ed shipments. Unlike sequen tial pip elines, this approach enables end- to-end training, impro ves the detection of delay ed cases, and supp orts probabilistic forecasting for uncertaint y-aw are decision making. The prop osed approach is ev alu- ated on a large-scale real-world dataset from an industrial partner, comprising more than 10 million historical shipmen t records across four ma jor source locations with dis- tinct regional characteristics. The prop osed mo del is compared with traditional ma- c hine learning methods. Exp erimen tal results sho w that the prop osed method ac hieves a mean absolute error of 0.67–0.91 da ys for delay ed-shipmen t predictions, outp erform- ing single-step tree-based regression baselines b y 41–64% and t wo-step classify-then- regress tree-based mo dels by 15–35%. These gains demonstrate the effectiveness of the prop osed mo del in op erational delivery dela y forecasting under highly imbalanced and heterogeneous conditions. Keywor ds : Delivery Delay Prediction, Multitask Learning, Supply Chains, Deep Learn- ing, Quantile Regression, Uncertain ty Quan tification, Conformal Prediction 1 1 In tro duction Accurate deliv ery dela y prediction has b ecome a critical requirement in mo dern supply c hains. Manufacturers, retailers, and logistics service pro viders increasingly rely on reliable deliv ery estimates to plan inv en tory , allo cate resources, honor se rvice lev el agreemen ts, and main tain customer satisfaction [ 1 , 2 ]. As logistic netw orks gro w in scale and complexit y , and with the rapid expansion of e-commerce, the uncertain ty in delivery times increases. This can lead to cascading op erational and financial consequences, including sto ck outs, misallo cated lab or, and ero ded service quality [ 3 , 4 ]. Early and accurate iden tification of p oten tial delays is therefore critical for initiating contingency plans, optimizing resource deplo yments, and providing trustw orth y customer comm unication [ 5 , 6 ]. T raditional approaches for delivery time prediction rely on rule based or static service lev el driv en estimation methods. Ho wev er, these metho ds fail to adapt to the dynamic c hanges in modern supply c hains caused b y factors such as demand v olatility and lo cal- ized op erational conditions that gov ern real world deliv ery p erformance [ 7 , 8 ]. As a result, the logistics industry is increasingly turning tow ard data-driven mac hine learning (ML) metho ds. Historical shipment data con tains fine-grained signals reflecting seasonal pat- terns, regional b eha vior, transp ortation mo des, and interactions among a large n umber of shipmen t attributes, whic h could b e utilized for data-driv en prediction of the deliv ery time and delays. Despite the growing adoption of machine learning metho ds for delivery delay predic- tion, the existing literature exhibits several imp ortan t limitations. First, as highligh ted by a recen t systematic review from Muller et al. [ 9 ], existing researc h is hea vily sk ewed tow ard binary classification (predicting if a shipmen t is late) rather than regression (predicting the duration of dela y). Second, uncertaint y-aw are estimation remains underexplored, de- spite its imp ortance for downstream decision making under op erational risk. Third, the significan t class im balance b et w een on-time and delay ed shipments requires approaches that can handle class im balance and provide reliable predictions for b oth ma jorit y and minorit y classes. This pap er introduces a m ulti-task deep learning mo del for delivery delay prediction that join tly addresses point estimation and uncertain ty quantification. The paper presen ts a classification-then-regression mo del within a single end-to-end architecture, enabling ef- fectiv e learning under sev ere class imbalance and reducing the error propagation commonly observ ed in sequentially trained pip elines. In addition, the mo del pro duces calibrated pre- 2 diction in terv als, allo wing uncertaint y-aw are decision making in op erational settings. The main contributions of this work are summarized as follows: • A unified multi-task learning mo del for uncertaint y-a ware delivery dela y prediction. The prop osed mo del utilizes dedicated em b edding lay ers for categorical and nu- merical features to handle heterogeneous and high-dimensional tabular data of the shipmen ts, and integrates conformal prediction to impro ve the probabilistic forecasts. • A comprehensive empirical ev aluation on a large-scale, real-world shipmen t dataset with o ver 10 million instances, demonstrating consistent improv emen ts ov er widely used tree-based baselines, including X GBo ost and CatBo ost. The dataset is provided b y an industrial partner, and includes shipment records from four source locations to more than 190k destinations from 2022 to 2024. Exp erimen tal results show that the prop osed metho d achiev es a mean absolute er- ror (MAE) of 0.67–0.91 days for dela yed-shipmen t predictions, outp erforming single-step tree-based regression mo dels by 41–64% and tw o-step classify-then-regress tree-based ap- proac hes b y 15–35%. Moreo ver, the prop osed mo del yields more reliable probabilistic forecasts, ac hieving higher empirical co verage with sharp er prediction interv als. The remainder of this pap er is organized as follows. Section 2 reviews related w ork. Sections 3 and 4 presen t the problem statement and the metho dology . Section 5 describ es the exp erimen tal setup and dataset. The exp erimental results are presented in Section 6, follo wed by the conclusion in Section 7. 2 Related W ork 2.1 Deliv ery Systems and Delay Timely and reliable deliv ery has become a critical driver of p erformance in mo dern sup- ply chains and can directly impact sales, profitabilit y , and customer satisfaction. Fisher et al. [ 5 ] rep orted that reducing delivery times can increase sales by up to 4% and prof- its by 2.2%. Ho wev er, subsequen t studies rev ealed a more nuanced relationship: while shorter promised deliv ery times can b oost sales, o verly aggressiv e commitmen ts often lead to delays, increased return rates, and weak er customer retention [ 10 , 6 ]. These findings emphasize that b oth the sp eed and reliability of deliv ery critically shap e customer b e- ha vior and do wnstream business outcomes. The impact of deliv ery time uncertain ty on 3 order fulfillment and carrier selection is further studied by Y e et al. [ 11 ], emphasizing the imp ortance of reliable deliv ery time estimates for optimizing op erational costs. Uncertain ty in delivery times arises from a wide range of op erational factors, particu- larly in supply chains that rely on multimodal transp ortation. Prior work has examined dela ys in maritime shipping, sho wing that weather conditions, port congestion, and routing decisions contribute significantly to vessel arriv al v ariabilit y [ 12 ]. Other studies inv esti- gated the cascading effect of dela ys at v arious stages of transportation and how disruptions at one step can amplify system-wide delivery time v ariabilit y [ 7 , 13 ]. Similar complexities app ear in last-mile deliv ery , where urban congestion, service t yp e, and carrier selection create significant fluctuations that cannot b e explained b y static planning assumptions [ 14 , 4 ]. These studies collectively illustrate that delays are rarely isolated even ts; rather, they arise from in terconnected and context-dependent sources across the logistics n etw ork. The div erse and interdependent causes of deliv ery-time v ariabilit y , spanning omnic han- nel fulfillmen t, maritime transp ort, and last-mile op erations, underscore the need for more sophisticated prediction metho ds. T raditional rule-based approaches, which assume fixed transit times or rely on static service levels, fail to capture the dynamic and nonlinear in teractions that shap e real-world delivery p erformance. This gap has motiv ated the dev elopment of data-driv en ML mo dels capable of learning complex dela y patterns from historical operational data and pro viding more accurate, reliable deliv ery time predictions. 2.2 Mac hine Learning for Delivery Time and Dela y Prediction Mac hine learning approac hes hav e b een increasingly applied to delivery-time estimation and delay prediction in logistics and supply chain net works. While many studies fo cus on predicting the absolute deliv ery time of a shipment [ 1 , 15 , 16 , 17 ], this work cen ters on dela y prediction, whic h seeks to estimate the deviation b etw een the actual arriv al time and the promised delivery time. Recen t researc h has formulated delay prediction as b oth a classification and a re- gression problem. In the classification setting, the ob jective is to determine whether a shipmen t will arrive on time or b e dela yed. Ensem ble learning techniques ha ve b een applied to classify dela yed shipments using historical shipment records and op erational features (e.g., origin–destination characteristics, service type, and carrier information) [ 18 , 19 ]. Deep learning mo dels hav e also b een ev aluated against traditional tree-based ap- proac hes, demonstrating improv ed p erformance in capturing complex feature interactions 4 [ 20 ]. In the regression setting, other studies ha ve prop osed gradient b o osting or neural net work–based models to estimate the magnitude of dela y directly [ 21 ], including metho ds that incorp orate external signals such as macro economic indicators to improv e predictiv e accuracy [ 8 ]. Despite these adv ances, sev eral imp ortan t limitations remain, as highlighted in the systematic review b y M ¨ uller et al. [ 9 ]. Most existing studies rely on datasets where the prop ortion of delay ed shipments is relatively balanced [ 19 , 18 , 20 ]. Ho wev er, in real-world op erations, the v ast ma jorit y of shipmen ts arriv e on time, leading to sev ere class im bal- ance that can significantly degrade mo del p erformance. Moreo ver, uncertaint y quantifica- tion, including prediction interv als for dela y duration, has received limited attention, even though accurate assessments of uncertaint y are essen tial for op erational decision-making. These gaps underscore the need for dela y-prediction metho ds that can robustly handle im balanced data and offer calibrated, uncertain ty-a ware estimates. In addition, the shipmen t deliv ery data often includes heterogeneous tabular data, whic h introduces c hallenges for v anilla neural netw orks. The recent adv ances in deep learning for tabular data hav e introduced embedding tec hniques that improv e mo del p er- formance on heterogeneous features [ 22 , 23 , 24 ]. Gorishniy et al. [ 25 ] demonstrated that piece-wise linear enco ding and quan tile binning can enhance deep learning p erformance on tabular data. These embedding approac hes hav e not yet b een fully explored in the con text of delivery delay duration estimation. 2.3 Multi-task Learning and Uncertaint y Quan tification Multi-task learning (MTL) helps in improving the p erformance of interrelated tasks by lev eraging shared represen tations, as introduced b y Caruana [ 26 ]. In deep neural net works, MTL is typically implemen ted through hard parameter sharing, where hidden lay ers are shared across tasks while maintaining task-sp ecific output la yers. MTL has b een in- creasingly applied in transp ortation and logistics: T ang et al. [ 27 ] developed an adaptiv e m ulti-task mo del for route-sp ecific trav el time estimation, Roy et al. [ 28 ] jointly predicted traffic emissions and trav el delay , and Khalil and F atmi [ 29 ] demonstrated that hard pa- rameter sharing improv es p erformance when jointly mo deling classification and regression tasks. F or delivery time estimation, Zhang et al. [ 30 ] prop osed a dual graph m ulti-task framew ork addressing imbalanced data by separately mo deling frequen t and rare deliv ery patterns, while Yi et al. [ 31 ] dev elop ed T ransPDT, a T ransformer-based mo del deploy ed at 5 Source Locations Destinations 𝐿 ! 𝑅 ! . . 𝑠 ! 𝑠 " 𝑠 # 𝑠 $ 𝑅 " 𝑅 # 𝑅 % 𝐿 " 𝐿 # 𝐿 $ 𝑠 & 𝑠 ' Figure 1: Logistics netw ork o verview. Shipments s i ∈ S flow from origin lo cations L k ∈ L to destinations R j ∈ R , characterized by physical features (weigh t, volume, items count) and timing information (planned departure/arriv al). JD Logistics. Despite these adv ances, the application of MTL under severe class im balance remains underexplored in the context of delivery delay prediction. Bey ond p oin t predictions, uncertaint y quan tification is essen tial for op erational decision- making. Quantile regression [ 32 ] estimates conditional quantiles rather than mean v alues, pro viding richer distributional information. In delivery time prediction, Zhang et al. [ 33 ] and Rueda-T oicen and Zea [ 34 ] applied quan tile regression to obtain prediction interv als. Ho wev er, quantile regression often pro duces interv als with insufficient cov erage during inference. Conformal prediction addresses this limitation b y pro viding distribution-free co verage guarantees [ 35 , 36 ]. Romano et al. [ 37 ] prop osed Conformalized Quantile Re- gression (CQR), which com bines quantile regression’s ability to capture heteroscedasticit y with conformal prediction’s calibration prop erties. Within logistics, Liu et al. [ 38 ] devel- op ed ProbTTE at DiDi, demonstrating the op erational v alue of probabilistic forecasting at industrial scale, while Y e et al. [ 39 ] applied conformal metho ds to order fulfillmen t forecasting. Ho wev er, these approac hes fo cus on deliv ery time estimation rather than de- la y prediction, and none addresses the zero-inflated distributions characteristic of dela y data where most shipments arriv e on time. This pap er combines MTL with conformalized quan tile regression, providing reliable prediction in terv als while handling the zero-inflated structure through sp ecialized dual-head routing. 6 T able 1: Mathematical notations and definitions. Sym b ol Domain/T yp e Description Indic es and Counts N Positiv e integer Number of shipments K Positiv e integer Num b er of categorical features M Positiv e integer Num b er of numerical features i { 1 , . . . , N } Shipment index k { 1 , . . . , K } Categorical feature index m { 1 , . . . , M } Numerical feature index Data and F e atur es D train , D v al , D calib , D test T raining, v alidation, calibration, and test datasets x i F eature v ector for shipmen t i ( K categorical + M numerical) x cat i , x num i Categorical and numerical feature subv ectors z i R d z Concatenated embedded feature vector y i R Delay duration in da ys (negative = early , p ositive = delay ed) d i { 0 , 1 } Binary delay indicator ( d i = 1 if y i ≥ 1) Mo del Comp onents h i R d h Learned represen tation from shared MLP backbone f c Classification head f delay ed r , f ontime r Dual regression heads for delay ed and on-time pre- dictions ˆ p i (0 , 1) Predicted delay probability for shipment i ˆ d i { 0 , 1 } Predicted binary delay indicator r i R d h +1 Regression input vector [ h i , ˆ p i ] ˆ y ( α ) i R Predicted α -quantile of delay duration L oss F unctions L t T otal loss: L c + L r L c Classification loss (SigmoidF1) L r Regression loss (pinball loss) ρ α ( y i , ˆ y ( α ) i ) Pinball loss for quantile level α Unc ertainty Quantific ation α (0 , 1) Miscov erage level (e.g., α = 0 . 2 for 80% cov erage) ˆ C α ( x i ) Initial prediction interv al [ ˆ y ( α/ 2) i , ˆ y (1 − α/ 2) i ] E i R Conformity score for sample i in calibration ˆ q 1 − α R Conformal correction term ((1 − α )-quantile of { E i } ) ˜ C α ( x i ) Calibrated prediction interv al 3 Problem Statemen t Consider a logistics netw ork with a set of source lo cations L and a set of destination lo cations R , as illustrated in Figure 1 . T able 1 summarizes the mathematical notation used throughout this pap er. Eac h shipment s i ∈ S , for i ∈ { 1 , . . . , N } , is describ ed by a feature vector x i ∈ X that con tains its origin–destination pair, physical attributes (e.g., weigh t, v olume), and service-lev el characteristics suc h as carrier, service type, and handling instructions. A detailed description of the feature set is provided in Section 5.1 . F or each shipment s i , let t planned i denote the planned delivery time determined by the 7 en terprise rule-based system at the time of order placement, and let t actual i denote the actual recorded delivery time. The delivery delay for shipment s i is defined as: y i = t actual i − t planned i , (1) where y i is measured in da ys. A shipment s i is classified as delaye d if y i ≥ 1 da y , and on-time otherwise. The one-da y threshold reflects op erational practice at the industrial partner, where sub-da y deviations are typically absorb ed within service-lev el buffers and do not trigger downstream actions. The ob jective of this work is to learn a predictiv e mapping from shipment features x i to dela y duration, enabling b oth accurate p oin t estimation of y i and calibrated prediction in terv als that quan tify the uncertaint y in the delay estimate for future shipments. T o accoun t for heterogeneit y in delivery patterns across source locations arising from regional, op erational, and infrastructural differences, the prop osed approach adopts a lo cation- sp ecific mo deling strategy . In particular, separate mo dels are trained for each source lo cation L k ∈ L for k ∈ { 1 , . . . , |L|} , allowing the learning pro cess to capture lo cation- dep enden t dela y dynamics. The prop osed metho dology is describ ed in detail in Section 4 . 4 Metho dology Figure 2 illustrates the prop osed mo del for delivery delay prediction with calibrated un- certain ty . The mo del consists of four main components: (1) a shared embedding backbone with dedicated em b edding la y ers for categorical and numerical features; (2) a classification head to predict the delay status, whic h acts as a routing mechanism to assign instances to the appropriate regression head; (3) dual quantile regression heads, whic h predict the de- la y duration for on-time and delay ed instances separately; and (4) a conformal calibration step to adjust the prediction interv als. During inference, to predict the delay for a shipment s i , the mo del first enco des the feature vector x i using the dedicated em b edding la yers. Next, the classifier predicts the dela y status given the embedding v ector h i . If the shipment is predicted to b e delay ed ( ˆ d i = 1), it is routed to the dela yed regression head; otherwise, it is routed to the on- time head. The mo del returns b oth a p oin t estimate of the delay duration ˆ y (0 . 5) i and a calibrated prediction in terv al ˜ C α ( x i ) = [ ˜ y low i , ˜ y high i ], where α ∈ (0 , 1) is the user-sp ecified misco verage rate (e.g., α = 0 . 2 for 80% cov erage). 8 Figure 2: Ov erview of the multi-task learning mo del. Input features are pro cessed through ded- icated em b edding lay ers (categorical and numerical), concatenated, and passed to a shared MLP bac kb one that pro duces a hidden representation h i . The bac kb one output feeds in to three task- sp ecific heads: a classification head for binary delay prediction, and dual regression heads for duration estimation. The classification probability ˆ p i is concatenated with h i and passed to b oth regression heads (dashed arrows). During training, samples are routed to regression heads based on ground truth lab els; during inference, routing is determined by the classifier output ( ˆ p i > 0 . 5 → dela yed head). Quan tile predictions are calibrated via conformal prediction to pro duce prediction in terv als. The prop osed mo del is trained end-to-end via empirical risk minimization using train- ing data D train = { ( x i , y i ) } N i =1 . The follo wing sections detail the mo del arc hitecture and training pro cess. 4.1 F eature Embedding Let x i = [ x cat i , x num i ] denote the feature vector of shipmen t s i , where x cat i = [ x cat i, 1 , . . . , x cat i,K ] represen ts K categorical features and x num i = [ x num i, 1 , . . . , x num i,M ] represents M numerical features. The em b edding pro cess for these features is as follows: Categorical Em b edding. Denote x cat .,k as a categorical feature with cardinalit y C k , for k ∈ { 1 , . . . , K } . Each unique v alue of x cat .,k is mapped to a d cat k -dimensional learnable vector via an embedding lo okup: Em b( x cat i,k ) = W k [ x cat i,k ] ∈ R d cat k , (2) where W k ∈ R C k × d cat k is a learnable embedding matrix and W k [ x cat i,k ] denotes the row corresp onding to the category index. The em b edding dimension d cat k is sp ecified as: d cat k = min( d cat max , ⌊ log 2 ( C k ) + 1 ⌋ ) , (3) 9 where d cat max = 50 is set as the maxim um em b edding dimension. The logarithmic scaling ensures that embedding dimensions grow sublinearly with cardinality , pro viding sufficien t represen tational capacity while preven ting ov erparameterization. This approac h enables the model to learn dense v ector represen tations of categorical v ariables, capturing complex relationships by mapping similar categories close to each other in the embedding space [ 40 ]. Numerical Embedding. Denote x num .,m as a n umerical feature, for m ∈ { 1 , . . . , M } . The mo del utilizes the P erio dic Linear (PLR) embedding approach in tro duced by Gorishniy et al. [ 25 ] to map each numerical feature to a d num m -dimensional v ector as follows: Em b( x num i,m ) = ReLU W m sin(2 π c m x num i,m ); cos(2 π c m x num i,m ) + b m , (4) where c m = [ c 1 , . . . , c ℓ ] ∈ R ℓ are learnable frequency co efficients, W m ∈ R d num m × 2 ℓ is a learnable w eight matrix, and b m ∈ R d num m is a learnable bias vector. The embedded categorical and numerical features are concatenated to form z i ∈ R d z , where d z = P K k =1 d cat k + P M m =1 d num m . The final representation is then obtained by passing z i through a shared MLP backbone: h i = MLP( z i ) ∈ R d h , (5) where MLP( · ) consists of sequen tial fully connected la yers with ReLU activ ations and drop out regularization, and d h is the dimension of the hidden represen tation. The num b er of la yers and d h are determined through hyperparameter tuning. 4.2 Classification Head This comp onent predicts whether a shipment is exp ected to b e delay ed. Let d i ∈ { 0 , 1 } denote the delay indicator derived from the observed delay duration, where d i = 1 indicates a delay ed shipment (i.e., y i ≥ 1 day). The classifier is a shallow MLP that tak es as input the em b edded feature representation vector h i and predicts the delay status as follows: ˆ p i = f c ( h i ) = σ ( w T c h i + b c ) , (6) 10 where w c ∈ R d h and b c ∈ R are learnable parameters, and σ ( z ) = 1 / (1 + e − z ) is the sigmoid function. The predicted binary delay indicator is then obtained as: ˆ d i = I { ˆ p i > 0 . 5 } . (7) The classifier acts as a routing mec hanism by separating the dominan t on-time regime from the delay ed, allo wing subsequent regression models to sp ecialize and improv e p er- formance on delay ed instances. T o balance precision and recall, the SigmoidF1 loss func- tion [ 41 ], a smo oth and differen tiable surrogate for the F1-score, is used for training the classification head: L c = 1 − f F 1 , (8) f F 1 = 2 ˜ tp 2 ˜ tp + ˜ f p + ˜ f n . (9) The soft confusion matrix comp onen ts are calculated as follo ws: ˜ tp = |B| X i =1 ˆ p i · d i , (10) ˜ f p = |B| X i =1 ˆ p i · (1 − d i ) , (11) ˜ f n = |B| X i =1 (1 − ˆ p i ) · d i , (12) where B denotes a mini-batch of training samples, |B | is the batch size, and ˆ p i is the predicted delay probability from Eq. 6 , whic h serv es as a smo oth relaxation of the binary prediction. This smooth approximation enables gradient-based optimization and is particularly effectiv e for imbalanced classification as it join tly balances precision and recall. Note that unlik e decomp osable losses, SigmoidF1 is computed at the batch level since the F1 score requires aggregating confusion matrix statistics within each mini-batch. 4.3 Quan tile Regression Heads Giv en the classifier’s output, the mo del estimates the dela y duration using tw o sp ecialized quan tile regression heads. F or a user-sp ecified miscov erage level α ∈ (0 , 1), the prediction 11 in terv al is defined as ˆ C α ( x i ) = [ ˆ y ( α/ 2) i , ˆ y (1 − α/ 2) i ], with ˆ y ( α ) i defined as: ˆ y ( α ) i = f delay ed r ( r i ; α ) if ˆ d i = 1 , f ontime r ( r i ; α ) if ˆ d i = 0 , (13) where r i = [ h i , ˆ p i ] is the regression input formed by concatenating the hidden representa- tion with the classification probabilit y . This probability conditioning allows each regression head to leverage the classifier’s confidence when making predictions. Each regression head is a shallo w MLP with ReLU activ ations. The point estimate of dela y duration is obtained as the median prediction ˆ y (0 . 5) i . Both regression heads are trained using the pinball loss (i.e., quan tile loss) [ 32 ]. F or a giv en quantile level α and prediction error u = y i − ˆ y ( α ) i , the pinball loss is defined as: ρ α ( u ) = α · u if u ≥ 0 , ( α − 1) · u if u < 0 . (14) During training, samples are routed to regression heads based on ground truth delay lab els ( d i ). In this work, w e target 80% prediction in terv als ( α = 0 . 2), corresp onding to quan tile levels { 0 . 1 , 0 . 5 , 0 . 9 } for the lo wer b ound, median, and upp er b ound resp ectiv ely . The total regression loss is: L r = 1 3 |B | |B| X i =1 X α ∈{ 0 . 1 , 0 . 5 , 0 . 9 } h d i · ρ α ( y i − f delay ed r ( r i ; α )) + (1 − d i ) · ρ α ( y i − f ontime r ( r i ; α )) i (15) where |B | is the num b er of training instances in the mini-batch, and the d i and (1 − d i ) terms route each sample to the appropriate head. T raining is p erformed in t wo stages. First, the total loss L t = L c + L r is minimized using mini-batch stochastic gradien t descent o ver the training data. The classification loss is monitored and the first stage is stopp ed when no significant improv ement is observed, or the maximum n umber of ep o c hs is reached. In the second stage, all lay ers are frozen except the regression heads and training con tin ues to minimize the regression loss, allo wing eac h head to refine its quan tile estimates without disrupting the shared representations and classification routing learned in the first stage. 12 4.4 Conformal Calibration The resulting interv als obtained from the quantile regression mo dels may ha ve high mis- co verage rate due to the lack of prop er training, or distribution shift in the data. T o enhance reliability of predictions, the prop osed mo del applies conformalized quantile re- gression (CQR) [ 37 ] using a hold-out calibration set D calib = { ( x i , y i ) } N calib i =1 . The dual-head arc hitecture requires separate calibration for each regression head. The calibration set is partitioned into tw o subsets based on ground truth lab els: D delay ed calib = { i ∈ D calib : d i = 1 } and D ontime calib = { i ∈ D calib : d i = 0 } . F or eac h head, given the initial prediction interv al ˆ C α ( x i ) = [ ˆ y ( α/ 2) i , ˆ y (1 − α/ 2) i ], confor- mit y scores are calculated o ver the corresp onding calibration subset: E delay ed i = max n ˆ y ( α/ 2) , delay ed i − y i , y i − ˆ y (1 − α/ 2) , delay ed i o , i ∈ D delay ed calib (16) with E ontime i defined analogously for i ∈ D ontime calib . The conformit y score measures interv al violation: E i > 0 when the true v alue falls outside the predicted interv al, and E i ≤ 0 when co vered. The calibration threshold for target cov erage 1 − α is the (1 − α )-quan tile of the conformit y scores: ˆ q delay ed 1 − α = Q 1 − α { E delay ed i } i ∈D delay ed calib , ˆ q ontime 1 − α = Q 1 − α { E ontime i } i ∈D ontime calib (17) where Q 1 − α ( · ) denotes the empirical quantile function. A t test time, the calibrated prediction in terv al is obtained by adjusting the quantile predictions with the appropriate correction term: ˜ C α ( x i ) = h ˆ y ( α/ 2) i − ˆ q 1 − α , ˆ y (1 − α/ 2) i + ˆ q 1 − α i (18) where the head selection (and corresp onding ˆ q 1 − α ) is determined b y the classifier: samples with ˆ p i > 0 . 5 use the delay ed head and ˆ q delay ed 1 − α , while samples with ˆ p i ≤ 0 . 5 use the on-time head and ˆ q ontime 1 − α . CQR pro vides finite-sample marginal co verage guarantees under exchangeabilit y of calibration and test data [ 37 ]. How ever, the temp oral nature of logistics data violates this assumption. This paper v alidates co verage empirically on hold-out test data using c hronological splits rather than claiming theoretical guaran tees. 13 8 6 4 2 0 2 4 6 8 Delay T ime (days) 0 2 4 6 8 Num of Shipments × 1 0 6 L1 Delayed On- T ime 0 5 Delay T ime (days) 0 1 2 Num of Shipments × 1 0 5 (a) L 1 : High volume 4 2 0 2 4 6 8 Delay T ime (days) 0 1 2 3 4 5 6 Num of Shipments × 1 0 5 L2 Delayed On- T ime 0 5 Delay T ime (days) 0 2 4 Num of Shipments × 1 0 4 (b) L 2 : Mo derate volume 6 4 2 0 2 4 6 8 Delay T ime (days) 0 . 0 0 . 5 1 . 0 1 . 5 2 . 0 2 . 5 3 . 0 Num of Shipments × 1 0 5 L3 Delayed On- T ime 0 5 Delay T ime (days) 0 2 Num of Shipments × 1 0 4 (c) L 3 : Mo derate volume 6 4 2 0 2 4 6 8 Delay T ime (days) 0 1 2 3 4 5 Num of Shipments × 1 0 4 L4 Delayed On- T ime 0 5 Delay T ime (days) 0 2 4 Num of Shipments × 1 0 3 (d) L 4 : Low v olume Figure 3: Deliv ery time distributions acros s locations showing distinct patterns of on-time (yello w) and delay ed (blue) shipmen ts. Main plots show the ov erall distribution, while insets focus on the dela yed shipment patterns. 5 Exp erimen tal Setup This section outlines the dataset, baseline, and the exp erimen tal setup for ev aluating the prop osed delivery delay prediction mo del. 5.1 Dataset Ov erview The dataset utilized in this study comprises ov er 10 million shipment records from a logis- tics pro vider, co v ering delivery op erations conducted b et ween September 2022 and January 2024. After prepro cessing, the dataset includes four ma jor source lo cations, referred to as L 1 , . . . , L 4 (i.e., |L| = 4). The n umber of shipments across differen t source lo cations is presen ted in Figure 4 , with L 1 b eing resp onsible for the ma jority of the shipments (ov er 9 million). Figure 3 presents the distribution of the deliv ery delays across different source lo cations. The ma jority of the shipments are deliv ered on time, with the delay p ercen tage ranging from 3.28% to 10.79% across different source lo cations. 14 L1 L2 L3 L4 L ocations 0 2 4 6 8 Number of Shipments 1e6 9,195,250 672,909 412,481 57,681 Figure 4: Distribution of shipment volumes across source lo ca- tions. Eac h shipmen t in the dataset is asso ciated with a combination of categorical and nu- merical features, as presented in T ables 2 and 3 , resp ectively . The categorical features encompass lo cation-related information (e.g., city , country) for b oth the origin and des- tination, hazardous materials, shipment type, and service type. The n umerical features include the shipment’s weigh t, volume, num b er of items, distance b et ween the origin and destination, and the latitude and longitude of both the origin and destination. The dataset also includes temp oral features, such as departure dates, planned arriv al dates, and actual arriv al dates. Delivery delays are calculated as the difference in days b et ween the actual arriv al date and the planned arriv al date. Due to the heterogeneity in op erational scale and dela y patterns across source lo ca- tions, com bined with the im balanced distribution betw een delay ed and on-time shipments, lo cation-specific mo dels are dev elop ed for each of the source lo cations L 1 − L 4 . Mo del ar- c hitecture and the training process are similar across all locations, unless stated otherwise. 5.2 Baseline Metho ds The prop osed mo del is compared with Gradien t Bo osting Decision T ree (GBDT) base- lines, sp ecifically eXtreme Gradien t Bo osting (XGBoost) [ 42 ] and Categorical Bo osting (CatBo ost) [ 43 ], under t wo different settings: 1. One-Step Prediction: Under this setting, a single quantile regression mo del is trained to estimate the dela y duration quan tiles ( α ∈ { 0 . 1 , 0 . 5 , 0 . 9 } ) for 80% co v- erage. During the training, higher sample w eights are emplo yed for the delay ed 15 instances to account for the class imbalance. 2. Tw o-Step Prediction: This setting inv olv es a classification-then-regression ap- proac h where the t wo steps are trained separately , unlik e the prop osed mo del which trains end-to-end. First, a GBDT classifier is trained to predict the delay status. Next, tw o GBDT regression mo dels are trained with pinball loss to predict the delay durations, one on dela yed samples only and the other on on-time samples only . At inference time, shipmen ts are routed to the corresp onding regression head based on the classifier output. This approach mimics our dual-head architecture, but eac h regression mo del is trained indep enden tly on its resp ectiv e subset, whereas our mul- titask mo del b enefits from shared representations learned across all samples. 5.3 Exp erimen tal Setting All mo dels are implemented in Python 3.9 using PyT orch 2.0 for neural netw ork de- v elopment and scikit-learn for traditional mac hine learning metho ds. Exp erimen ts are conducted on NVIDIA R TX 6000 GPUs with 16GB memory p er task, supp orted by six CPU cores. F or each lo cation, the data is first sorted based on the planned arriv al times. Next, T able 2: Summary of Categorical F eatures F eature Cardinality Description F rom Lo cation ID 4 Source lo cation identifier F rom City 4 City of shipment origin F rom Postal Co de 4 Postal co de of origin F rom Country System ID 4 Country co de for origin T o Lo cation ID 198,019 Destination lo cation iden tifier T o City 34,572 Destination city name T o Postal Co de 52,236 Destination p ostal co de T o Country System ID 29 Country co de for destination Coun try Combination 33 Origin-destination country pair Shipmen t Type ID 37 Classification of shipment type Preferred Carrier ID 81 Identifier for the preferred shipping carrier Dangerous Go ods (Y es/No) 2 Indicator for hazardous materials (0/1) T able 3: Summary of Numerical F eatures F eature Unit Description Service Order W eight Kilograms T otal weigh t of the shipment Service Order V olume Cubic meters T otal volume of the shipmen t T otal Number of Items Coun t Num b er of individual items in shipment Destination Cit y Latitude Degrees Destination cit y latitude co ordinate Destination Cit y Longitude Degrees Destination cit y longitude co ordinate Distance Kilometers Direct distance b etw een origin and destination 16 the data is divided into training, v alidation, calibration, and test sets with 0.7/0.1/0.1/0.1 ratios, resp ectiv ely . This splitting strategy is used to av oid data leak age due to the tem- p oral nature of the dataset. The v alidation data is used for h yp erparameter tuning. After training the mo dels, the calibration data is used for conformal calibration of the prediction in terv als as explained in the Metho dology section. Finally , all models are ev aluated on the test set. Deep learning mo dels emplo y the AdamW optimizer with learning rate scheduling. The scheduler implements a linear warm up follow ed b y a linear decay , whic h helps stabi- lize the early training pro cess. T raining pro ceeds in mini-batches, with gradient clipping applied to preven t explo ding gradien ts. Early stopping is implemented based on v alidation p erformance to preven t ov erfitting. Hyp erparameter tuning is p erformed using Optuna for b oth the mac hine learning baseline metho ds and our multitask mo del [ 44 ]. The range of parameters for each metho d is presen ted in App endix A . T able 4 summarizes the ev aluation metrics. All metrics are computed separately for o verall samples and delay ed samples only , denoted as (O/D) in the results tables. Let D ∗ test denote the ev aluation set: for ov erall metrics (O), D ∗ test = D test includes all test samples; for dela yed metrics (D), D ∗ test = D delay ed test includes only shipmen ts with d i = 1. The p oint predictions are ev aluated using Mean Absolute Error (MAE), comparing the ground truth ( y i ) with the median prediction from the quantile regression mo dels (i.e., ˆ y (0 . 5) i ). Additionally , the probabilistic predictions are ev aluated using Cov erage, Av erage In terv al Width (AIW), and Winkler Score (WS) prior and after the conformal calibration steps. 17 T able 4: Summary of Ev aluation Metrics Metric F ormula Description Delay Dur ation Estimation MAE (O/D) 1 |D ∗ test | X i ∈D ∗ test | y i − ˆ y (0 . 5) i | Mean absolute error b et ween actual delays and median predictions (days). Avg-QL (O/D) 1 3 |D ∗ test | X α ∈{ 0 . 1 , 0 . 5 , 0 . 9 } X i ∈D ∗ test ρ α ( y i − ˆ y ( α ) i ) Average quan tile loss across all three quan tiles, where ρ α ( u ) = max( αu, ( α − 1) u ). Unc ertainty Quantific ation Co verage (O/D) 1 |D ∗ test | X i ∈D ∗ test I [ ˆ y (0 . 1) i ≤ y i ≤ ˆ y (0 . 9) i ] Proportion of true dela ys within predic- tion in terv als. T arget: 80% ( α = 0 . 2). AIW (O/D) 1 |D ∗ test | X i ∈D ∗ test ( ˆ y (0 . 9) i − ˆ y (0 . 1) i ) Average interv al width (days). WS (O/D) 1 |D ∗ test | X i ∈D ∗ test WS i , WS i = w i + 2 α ( ˆ y (0 . 1) i − y i ) y i < ˆ y (0 . 1) i w i + 2 α ( y i − ˆ y (0 . 9) i ) y i > ˆ y (0 . 9) i w i otherwise Winkler Score, where w i = ˆ y (0 . 9) i − ˆ y (0 . 1) i . P enalizes interv al width plus miscov erage. 6 Results This section presen ts the n umerical ev aluation and comparison of the prop osed deep learn- ing mo del against baseline metho ds for delivery dela y duration estimation. P erformance is ev aluated across four source lo cations ( L 1 , L 2 , L 3 , L 4 ) using the metrics defined in Sec- tion 5 . The mo dels include: 1) single-step quantile regression X GBo ost and CatBo ost referred to as XGB-S1 and CatB-S1; 2) tw o-step classify-then-regression mo dels referred to as XGB-S2 and CatB-S2; and 3) the prop osed multitask deep learning mo del, referred to as DL (ours) in the tables. T able 5 presents the MAE and a verage quantile loss (Avg-QL, also known as pin ball loss) for the dela yed instances and the o verall dataset across L 1 – L 4 . The proposed DL mo del achiev es the lo west MAE and Avg-QL for the delay ed instances across all the lo cations, with MAE ranging from 0.67 to 0.91. In particular, the prop osed DL mo del impro ves the MAE on the delay ed instances b y 41–64% compared to the b est single-step mo del, and b y 15–35% compared to the b est t wo-step tree-based mo del across the four lo cations. The t wo-step tree-based mo dels achiev e slightly b etter p erformance on the delay ed instances compared to the single-step models. Ho wev er, their MAE on the ov erall instances is significan tly higher, esp ecially on the lo cation with the highest num b er of shipments (i.e., L 1 ). In con trast, the prop osed DL model ac hieves comparable MAE on the ov erall 18 T able 5: Poin t prediction performance across lo cations. Best delay ed p erformance p er lo cation highligh ted in bold. Low er v alues indicate b etter p erformance. Ovr = ov erall instances, Del = dela yed instances only . Mo del L1 L2 L3 L4 Avg-QL ( ↓ ) MAE ( ↓ ) Avg-QL ( ↓ ) MAE ( ↓ ) Avg-QL ( ↓ ) MAE ( ↓ ) Avg-QL ( ↓ ) MAE ( ↓ ) Ovr Del Ovr Del Ovr Del Ovr Del Ovr Del Ovr Del Ovr Del Ovr Del X GB-S1 0.05 0.52 0.10 1.43 0.13 0.58 0.33 1.48 0.17 0.59 0.41 1.85 0.16 0.64 0.32 1.70 CatB-S1 0.05 0.76 0.11 1.72 0.14 0.59 0.41 1.59 0.18 0.62 0.41 1.86 0.16 0.79 0.30 1.86 X GB-S2 0.11 0.46 0.23 1.02 0.20 0.52 0.40 1.16 0.28 0.40 0.60 0.90 0.20 0.67 0.41 1.40 CatB-S2 0.10 0.47 0.21 1.00 0.17 0.55 0.37 1.24 0.32 0.33 0.70 0.81 0.19 0.65 0.34 1.40 DL (ours) 0.05 0.39 0.12 0.84 0.14 0.39 0.37 0.85 0.19 0.30 0.45 0.67 0.17 0.42 0.35 0.91 instances while achieving significantly low er error o ver the delay ed shipmen ts. T ables 6 and 7 present the uncertaint y quan tification p erformance ev aluation for the baselines and the prop osed DL mo del b efore and after conformal calibration, resp ectiv ely . The metrics are calculated on the outputs of the quan tile regression mo dels without any calibration (T able 6 ), and after p erforming the CQR approac h (T able 7 ) for the target co verage of 80%. Considering the cov erage rates of the mo dels prior to the conformal calibration (T a- ble 6 ), most mo dels achiev e o verall cov erage ab o ve 70%, except for the CatBo ost-based mo dels whic h exhibit substantially low er co verage at several lo cations. Comparing the results on the co verage o ver the dela yed instances, the prop osed DL mo del shows signifi- can tly higher co verage (ranges from 63.6% to 69.8%) compared to the other baselines. The b est single-step mo del’s cov erage ranges from 19.7% to 48.0%. The b est tw o-step mo dels also ac hieve cov erage rates of 21.7% to 58.4% across differen t lo cations, falling b ehind the prop osed mo del. The conformal calibration improv es the co verage of the mo dels ov er b oth o verall samples and the delay ed instances, except for the single-step mo dels. F or the single-step mo dels, due to the lack of an y classification step, the calibration strategy do es not differentiate b etw een the delay ed and on-time instances and as a result the con- ditional cov erage do es not improv e significantly . Ho wev er, in the prop osed DL mo del the calibration metho d impro ves the co verage rate on b oth o verall and the dela yed instances. Note that due to the temp oral nature of the data and the p ossibilit y of distribution shift, the exchangeabilit y assumption required for conformal prediction’s statistical guar- an tees do es not hold for any of the mo dels. Additionally , the t wo-step tree-based mo dels ma y suffer from error propagation b et ween the classification and regression stages. How- ev er, the empirical results demonstrate the efficacy of CQR in impro ving the calibration of the prediction interv als. 19 T able 6: Uncertain ty quan tification p erformance (pre-calibration). T arget cov erage is 80% ( α = 0 . 2). Best delay ed p erformance p er lo cation highligh ted in bold for Co verage and WS. F or Cov erage, higher is b etter; for AIW and WS, low er is b etter. Mo del T yp e L1 L2 L3 L4 Co v ↑ AIW ↓ WS ↓ Cov ↑ AIW ↓ WS ↓ Cov ↑ AIW ↓ WS ↓ Co v ↑ AIW ↓ WS ↓ X GB-S1 Ov erall 0.843 0.381 0.926 0.769 0.650 2.135 0.823 0.663 3.128 0.700 0.438 3.131 Dela yed 0.435 1.442 8.411 0.422 1.406 9.914 0.455 1.346 8.453 0.197 0.862 10.768 CatB-S1 Ov erall 0.729 0.412 1.124 0.648 0.653 2.105 0.561 0.562 3.232 0.642 0.392 3.284 Dela yed 0.358 0.986 9.542 0.480 1.493 9.906 0.350 1.017 9.471 0.103 0.741 13.842 X GB-S2 Ov erall 0.864 0.184 2.255 0.769 0.438 3.983 0.647 0.719 5.481 0.768 0.153 4.095 Dela yed 0.460 0.865 8.807 0.532 1.100 9.762 0.584 1.494 7.592 0.217 0.381 13.213 CatB-S2 Ov erall 0.456 0.160 2.059 0.655 0.379 3.309 0.405 0.866 6.135 0.652 0.174 4.117 Dela yed 0.418 0.771 9.097 0.355 1.053 10.188 0.351 1.624 5.950 0.182 0.425 12.535 DL (ours) Ov erall 0.816 0.448 1.324 0.798 0.728 2.964 0.742 0.886 4.218 0.772 0.598 4.042 Dela yed 0.682 0.894 6.742 0.664 1.008 7.284 0.698 1.164 5.412 0.636 0.774 6.986 T able 7: Uncertain ty quantification p erformance (p ost-calibration). T arget cov erage is 80% ( α = 0 . 2). Best delay ed p erformance p er lo cation highligh ted in bold for Co verage and WS. F or Cov erage, higher is b etter; for AIW and WS, low er is b etter. Mo del T yp e L1 L2 L3 L4 Co v ↑ AIW ↓ WS ↓ Co v ↑ AIW ↓ WS ↓ Co v ↑ AIW ↓ WS ↓ Co v ↑ AIW ↓ WS ↓ X GB-S1 Ov erall 0.846 0.384 0.924 0.847 0.659 2.132 0.826 0.664 3.126 0.774 0.440 3.129 Dela yed 0.438 1.448 8.396 0.426 1.418 9.869 0.457 1.348 8.450 0.199 0.865 10.762 CatB-S1 Ov erall 0.812 0.578 1.386 0.764 0.816 2.348 0.678 0.694 2.986 0.728 0.524 3.086 Dela yed 0.362 0.992 9.538 0.484 1.502 9.873 0.406 1.024 9.436 0.108 0.749 13.718 X GB-S2 Ov erall 0.870 0.186 2.248 0.776 0.443 3.972 0.654 0.726 5.468 0.772 0.155 4.086 Dela yed 0.466 0.871 8.794 0.538 1.108 9.746 0.591 1.504 7.574 0.221 0.385 13.194 CatB-S2 Ov erall 0.692 1.124 4.824 0.742 0.512 3.126 0.687 1.314 5.050 0.681 0.196 4.024 Dela yed 0.596 1.886 6.982 0.586 1.384 8.642 0.580 2.136 7.143 0.228 0.468 12.186 DL (ours) Ov erall 0.852 0.839 1.089 0.854 1.016 2.524 0.828 1.082 3.742 0.822 1.142 3.486 Dela yed 0.726 1.324 5.864 0.718 1.482 6.642 0.742 1.486 4.982 0.686 1.568 6.124 The AIW v alues of the calibrated prediction interv als (T able 7 ) range from 1.32 to 1.57 da ys for the prop osed DL mo del on the dela yed samples, and from 0.84 to 1.14 ov er all instances. While some of the baselines seem to pro vide sharp er prediction in terv als, they often exhibit a significant misco verage rate. T o fairly compare the trade-off b et ween the AIW and the cov erage rates, the pap er considers Winkler Score (WS). As sho wn in T ables 6 and 7 , the prop osed DL mo del results in substan tially low er WS for the prediction of the dela yed instances o ver all lo cations. Considering the WS ov er all instances, the prop osed mo del is sligh tly w orse than the single-step mo dels. Ho wev er, it pro vides substantially more reliable interv als for the delay ed instances, which are op erationally imp ortan t. 20 7 Conclusion and F uture Researc h This pap er presented a m ultitask deep learning model for deliv ery dela y duration esti- mation using a classification-then-regression strategy . The prop osed mo del addresses a k ey limitation of existing approaches: standard regression mo dels trained on highly im- balanced logistics data tend to optimize for the ma jority on-time class, pro ducing p o or predictions for the op erationally critical dela yed shipmen ts. The prop osed mo del utilizes dedicated numerical and categorical embedding la yers to pro cess high-dimensional tab- ular features. By employing dual regression heads with a routing mechanism based on classification confidence, the mo del enables each regression head to sp ecialize on its target distribution while benefiting from shared feature representations learned across all training samples. The prop osed mo del w as ev aluated on a large-scale dataset from an industrial part- ner containing ov er 10 million shipmen t records across four ma jor source lo cations, eac h exhibiting distinct regional characteristics and delay rates ranging from 3% to 11%. Ex- p erimen tal results demonstrated that the prop osed multitask approac h achiev es mean absolute errors of 0.67–0.91 days for dela yed shipments, representing improv ements of 41%–64% ov er single-step tree-based baselines and 15%–35% ov er sequen tial t wo-step ap- proac hes. The mo del also pro duces significantly b etter-calibrated prediction in terv als for dela yed shipmen ts, achieving 64%–70% co verage before calibration compared to 20%–48% for the b est single-step tree-based baselines. After conformal calibration, the prop osed mo del reaches the nominal 80% cov erage on ov erall shipments while consistently main- taining the b est Winkler Scores for delay ed shipments across all lo cations. F rom a practical standpoint, the model enables logistics planners to iden tify shipments at risk of significan t delay with greater accuracy . The calibrated prediction interv als pro vide operationally useful uncertain ty estimates that supp ort decision-making. As noted b y our industry partner, the abilit y to iden tify shipmen ts that are lik ely to b e substantially late rather than b orderline cases aligns well with core op erational priorities. Sev eral directions remain for future w ork. T ransfer learning approaches could impro ve p erformance in data-sparse lo cations b y leveraging represen tations learned from high- v olume origins. Incorp orating temp oral dynamics through online learning could enable the mo del to adapt to ev olving delivery patterns and seasonal v ariations. Finally , extend- ing the uncertaint y quantification to provide conditional cov erage guaran tees for sp ecific subgroups could further enhance op erational utilit y . 21 Ac kno wledgmen ts This research w as partly supp orted b y the NSF AI Institute for Adv ances in Optimization (Aw ard 2112533). References [1] S. V an der Sp oel, C. Amrit, and J. v an Hillegersb erg, “Predictive analytics for truc k arriv al time estimation: A field study at a europ ean distribution center,” International Journal of Pr o duction R ese ar ch , v ol. 55, no. 17, pp. 5062–5078, 2017. [2] J. Liu, S. Hw ang, W. Y und, L. N. Bo yle, and A. G. Banerjee, “Predicting purc hase orders delivery times using regression mo dels with dimension reduction,” in ASME 2018 International Design Engine ering T e chnic al Confer enc es and Computers and Information in Engine ering Confer enc e , 11 2018. [3] A. Balster, O. Hansen, H. F riedrich, and A. Ludwig, “An eta prediction mo del for in termo dal transp ort net works based on mac hine learning,” Business & Information Systems Engine ering , vol. 62, pp. 403–416, 10 2020. [4] W. A. Mohammad, Y. Nazih Diab, A. Elomri, and C. T riki, “Innov ativ e solutions in last mile deliv ery: Concepts, practices, challenges, and future directions,” Supply Chain F orum: A n International Journal , vol. 24, pp. 151–169, 04 2023. [5] M. L. Fisher, S. Gallino, and J. J. Xu, “The v alue of rapid deliv ery in omnic hannel retailing,” Journal of Marketing R ese ar ch , v ol. 56, no. 5, pp. 732–748, 2019. [6] S. Masuch, J. R. Landw ehr, C. M. Flath, and F. Thiesse, “The faster, the b etter? the impact of short deliv ery times on pro duct returns in online retailing,” Journal of R etailing , vol. 100, no. 3, pp. 475–485, 2024. [7] L. Urciuoli, “An algorithm for impro ved etas estimations and p oten tial impacts on supply c hain decision making,” Pr o c e dia Manufacturing , vol. 25, pp. 185–193, 2018. [8] M. Gab ellini, L. Civolani, F. Calabrese, and M. Bortolini, “A deep learning approach to predict supply c hain deliv ery dela y risk based on macroeconomic indicators: A case study in the automotive sector,” Applie d Scienc es , vol. 14, no. 11, p. 4688, 2024. 22 [9] N. M ¨ uller, P . Burggr¨ af, F. Stein b erg, C. R. Sauer, and M. Sc h ¨ utz, “An analytical review of predictive metho ds for delivery delays in supply chains,” Supply Chain A nalytics , vol. 11, p. 100130, 09 2025. [10] R. Cui, Z. Lu, T. Sun, and J. M. Golden, “So oner or later? promising delivery sp eed in online retail,” Manufacturing & Servic e Op er ations Management , v ol. 26, pp. 233–251, 01 2024. [11] T. Y e, S. Cheng, A. Hijazi, and P . V an Hen tenryck, “Contextual sto c hastic optimiza- tion for omnic hannel m ulti-courier order fulfillment under delivery time uncertaint y ,” 09 2024. [12] S. Kim, H. Kim, and Y. Park, “Early detection of vessel delays using combined his- torical and real-time information,” The Journal of the Op er ational R ese ar ch So ciety , v ol. 68, no. 2, pp. 182–191, 2017. [13] G. Baryannis, S. Dani, and G. An toniou, “Predicting supply c hain risks using mac hine learning: The trade-off b et w een performance and in terpretability ,” F utur e Gener ation Computer Systems , v ol. 101, pp. 993–1004, 12 2019. [14] M. Slabinac, “Innov ative solutions for a “last-mile” deliv ery – a europ ean experience,” Business L o gistics in Mo dern Management , 2015. [15] J. Khiari and C. Olav erri-Monreal, “Bo osting algorithms for delivery time predic- tion in transp ortation logistics,” in 2020 International Confer enc e on Data Mining Workshops (ICDMW) , pp. 251–258, 11 2020. [16] F. W u and L. W u, “Deepeta: A spatial-temporal sequential neural netw ork mo del for estimating time of arriv al in pack age deliv ery system,” Pr o c e e dings of the AAAI Confer enc e on Artificial Intel ligenc e , vol. 33, pp. 774–781, 07 2019. [17] A. Rok oss, M. Syb erg, L. T omidei, C. H ¨ ulsing, J. Deuse, and M. Schmidt, “Case study on delivery time determination using a mac hine learning approac h in small batc h pro duction companies,” Journal of Intel ligent Manufacturing , 01 2024. [18] H. Ab ouloifa and M. Baha j, “Predicting late deliv ery in supply chain 4.0 using fea- ture selection: A mac hine learning mo del,” in 2022 5th International Confer enc e on A dvanc e d Communic ation T e chnolo gies and Networking (CommNet) , pp. 1–5, 12 2022. 23 [19] N. Rezki and M. Mansouri, “Machine learning for proactive supply c hain risk manage- men t: Predicting dela ys and enhancing op erational efficiency ,” Management Systems in Pr o duction Engine ering , vol. 32, pp. 345–356, 09 2024. [20] M. M. Bassiouni, R. K. Chakrab ortt y , K. M. Sallam, and O. K. Hussain, “Deep learn- ing approaches to identify order status in a complex supply chain,” Exp ert Systems with Applic ations , vol. 250, p. 123947, 09 2024. [21] F. Stein b erg, P . Burggr¨ af, J. W agner, B. Hein bach, T. Saßmannshausen, and A. Brin- trup, “A no vel machine learning mo del for predicting late supplier deliv eries of low- v olume-high-v ariet y products with application in a german machinery industry ,” Sup- ply Chain A nalytics , vol. 1, p. 100003, 03 2023. [22] J. Robinson, R. Ranjan, W. Hu, K. Huang, J. Han, A. Dobles, M. F ey , J. E. Lenssen, Y. Y uan, Z. Zhang, et al. , “Relbench: A b enc hmark for deep learning on relational databases,” A dvanc es in Neur al Information Pr o c essing Systems , vol. 37, pp. 21330– 21341, 2024. [23] V. Borisov, T. Leemann, K. Seßler, J. Haug, M. P aw elczyk, and G. Kasneci, “Deep neural net works and tabular data: A surv ey ,” IEEE T r ansactions on Neur al Networks and L e arning Systems , vol. 35, no. 6, pp. 7499–7519, 2024. [24] S. ¨ O. Arik and T. Pfister, “T abnet: A ttentiv e in terpretable tabular learning,” in Pr o c e e dings of the AAAI Confer enc e on Artificial Intel ligenc e , vol. 35, pp. 6679–6687, 2021. [25] Y. Gorishniy , I. Rubachev, and A. Bab enk o, “On embeddings for n umerical features in tabular deep learning,” in A dvanc es in Neur al Information Pr o c essing Systems , v ol. 35, 2022. [26] R. Caruana, “Multitask learning,” Machine L e arning , vol. 28, pp. 41–75, 07 1997. [27] K. T ang, S. Chen, T. Guo, Y. Ma, and A. J. Khattak, “An adaptive deep multi-task learning approac h for citywide trav el time collab orative estimation,” Exp ert Systems with Applic ations , vol. 244, p. 123009, 06 2024. [28] K. Roy , L. S. Chan, X. Zhang, and N. Nassir, “Multi-task deep learning for joint prediction of traffic emissions and tra vel delay ,” T r ansp ortation R ese ar ch Part D: T r ansp ort and Envir onment , vol. 146, p. 104846, 09 2025. 24 [29] M. A. Khalil and M. R. F atmi, “How effective are discrete-contin uous multi-task learning compared to single-output mo dels? insigh ts from trav el mo de and departure time analysis,” Exp ert Systems with Applic ations , vol. 274, p. 127002, 05 2025. [30] L. Zhang, M. W ang, X. Zhou, X. W u, Y. Cao, Y. Xu, L. Cui, and Z. Shen, “Dual graph m ultitask framework for imbalanced deliv ery time estimation,” 02 2023. [31] J. Yi, H. Y an, H. W ang, J. Y uan, and Y. Li, “Learning to estimate pack age delivery time in mixed im balanced deliv ery and pickup logistics services,” in Pr o c e e dings of the 32nd ACM International Confer enc e on A dvanc es in Ge o gr aphic Information Systems (SIGSP A TIAL ’24) , (New Y ork, NY, USA), pp. 432–443, Asso ciation for Computing Mac hinery , 11 2024. [32] R. Ko enk er, Quantile R e gr ession . Econometric So ciety Monographs, Cambridge: Cam bridge Universit y Press, 2005. [33] L. Zhang, X. Zhou, Z. Zeng, Y. Cao, Y. Xu, M. W ang, X. W u, Y. Liu, L. Cui, and Z. Shen, “Delivery time prediction using large-scale graph structure learning based on quantile regress ion,” in 2023 IEEE 39th International Confer enc e on Data Engine ering (ICDE) , pp. 3403–3416, 04 2023. [34] A. Rueda-T oicen and A. A. Zea, “Estimating parcel delivery da y via quantile regres- sion,” in 2024 11th IEEE Swiss Confer enc e on Data Scienc e (SDS) , pp. 41–46, 05 2024. [35] V. V ovk, A. Gammerman, and G. Shafer, Algorithmic L e arning in a R andom World . Springer, 2005. [36] G. Shafer and V. V ovk, “A tutorial on conformal prediction,” 06 2007. [37] Y. Romano, E. Patterson, and E. J. Cand ` es, “Conformalized quantile regression,” in A dvanc es in Neur al Information Pr o c essing Systems , vol. 32, pp. 3538–3548, 2019. [38] H. Liu, W. Jiang, S. Liu, and X. Chen, “Uncertaint y-a ware probabilistic trav el time prediction for on-demand ride-hailing at didi,” in Pr o c e e dings of the 29th ACM SIGKDD Confer enc e on Know le dge Disc overy and Data Mining (KDD ’23) , (New Y ork, NY, USA), pp. 4516–4526, Asso ciation for Computing Machinery , 08 2023. [39] T. Y e, A. Hijazi, and P . V an Hen tenryck, “Conformal predictive distributions for order fulfillmen t time forecasting,” 05 2025. 25 [40] C. Guo and F. Berkhahn, “Entit y embeddings of categorical v ariables,” arXiv pr eprint arXiv:1604.06737 , 2016. [41] G. B´ en ´ edict, V. Ko ops, D. Odijk, and M. de Rijke, “sigmoidf1: A smo oth f1 score surrogate loss for multilabel classification,” 2022. [42] T. Chen and C. Guestrin, “Xgb oost: A scalable tree bo osting system,” in Pr o c e e dings of the 22nd ACM SIGKDD International Confer enc e on Know le dge Disc overy and Data Mining , pp. 785–794, 2016. [43] L. Prokhorenko v a, G. Gusev, A. V orob ev, A. V. Dorogush, and A. Gulin, “Catb oost: Un biased b o osting with categorical features,” in A dvanc es in Neur al Information Pr o c essing Systems , vol. 31, 2018. [44] T. Akiba, S. Sano, T. Y anase, T. Oh ta, and M. Koy ama, “Optuna: A next-generation h yp erparameter optimization framew ork,” in Pr o c e e dings of the 25th ACM SIGKDD International Confer enc e on Know le dge Disc overy and Data Mining , pp. 2623–2631, 2019. 26 A App endix This app endix summarizes the hyperparameter se arc h spaces used for tuning all mo d- els. Hyp erparameter optimization w as p erformed using Optuna with the T ree-structured P arzen Estimator (TPE) sampler, with 100 trials p er mo del and lo cation. A.1 GBDT Baselines T ables 8 and 9 present the hyperparameter search ranges for the XGBoost and CatBo ost mo dels used in b oth one-step and tw o-step baseline configurations. The ranges were c hosen based on prior work and preliminary exp erimen ts to ensure robust searc h spaces. T able 8: Hyp erparameter Search Space for XGBoost P arameter Range Scale n estimators [200, 2000] linear max depth [3, 12] linear learning rate [1e-3, 0.3] log subsample [0.6, 1.0] linear colsample b ytree [0.6, 1.0] linear gamma [0, 5] linear reg alpha [0.0, 20.0] linear reg lam b da [0.0, 50.0] linear min c hild weigh t [1, 10] linear T able 9: Hyp erparameter Search Space for CatBo ost P arameter Range Scale iterations [200, 1500] linear depth [4, 12] linear learning rate [1e-3, 0.3] log l2 leaf reg [1, 30] linear b order count [32, 255] linear bagging temp erature [0, 10] linear random strength [0.0, 10.0] linear min c hild samples [5, 100] linear A.2 Multitask Deep Learning Mo del T able 10 presents the hyperparameter search space for the prop osed m ultitask deep learn- ing mo del. The arc hitecture consists of a shared MLP backbone with dedicated embedding la yers for categorical and n umerical features, follow ed b y task-sp ecific heads. F or the em b edding lay ers, categorical embedding dimensions are computed as d cat k = min( d cat max , ⌊ log 2 ( C k ) + 1 ⌋ ), where d cat max = 50 and C k denotes the cardinalit y of categorical 27 T able 10: Hyp erparameter search space for the multitask deep learning mo del. P arameter Range / V alues n blo c ks [2, 12] d hidden { 128, 192, 256, 320, 384 } drop out [0.0, 0.5] w eight decay [1e-6, 3e-3] gradien t clip norm { None, 1.0, 5.0 } batc h size { 256, 512, 1024, 2048 } learning rate [1e-4, 1e-2] (log scale) feature k . Numerical features are embedded using the P erio dic Linear (PLR) embedding with em b edding dimension 24. The base learning rate was tuned using Optuna, and the training utilized a linear warm up follo wed by a linear decay schedule. 28
Original Paper
Loading high-quality paper...
Comments & Academic Discussion
Loading comments...
Leave a Comment