Dirichlet Scale Mixture Priors for Bayesian Neural Networks
Neural networks are the cornerstone of modern machine learning, yet can be difficult to interpret, give overconfident predictions and are vulnerable to adversarial attacks. Bayesian neural networks (BNNs) provide some alleviation of these limitations…
Authors: August Arnstad, Leiv Rønneberg, Geir Storvik
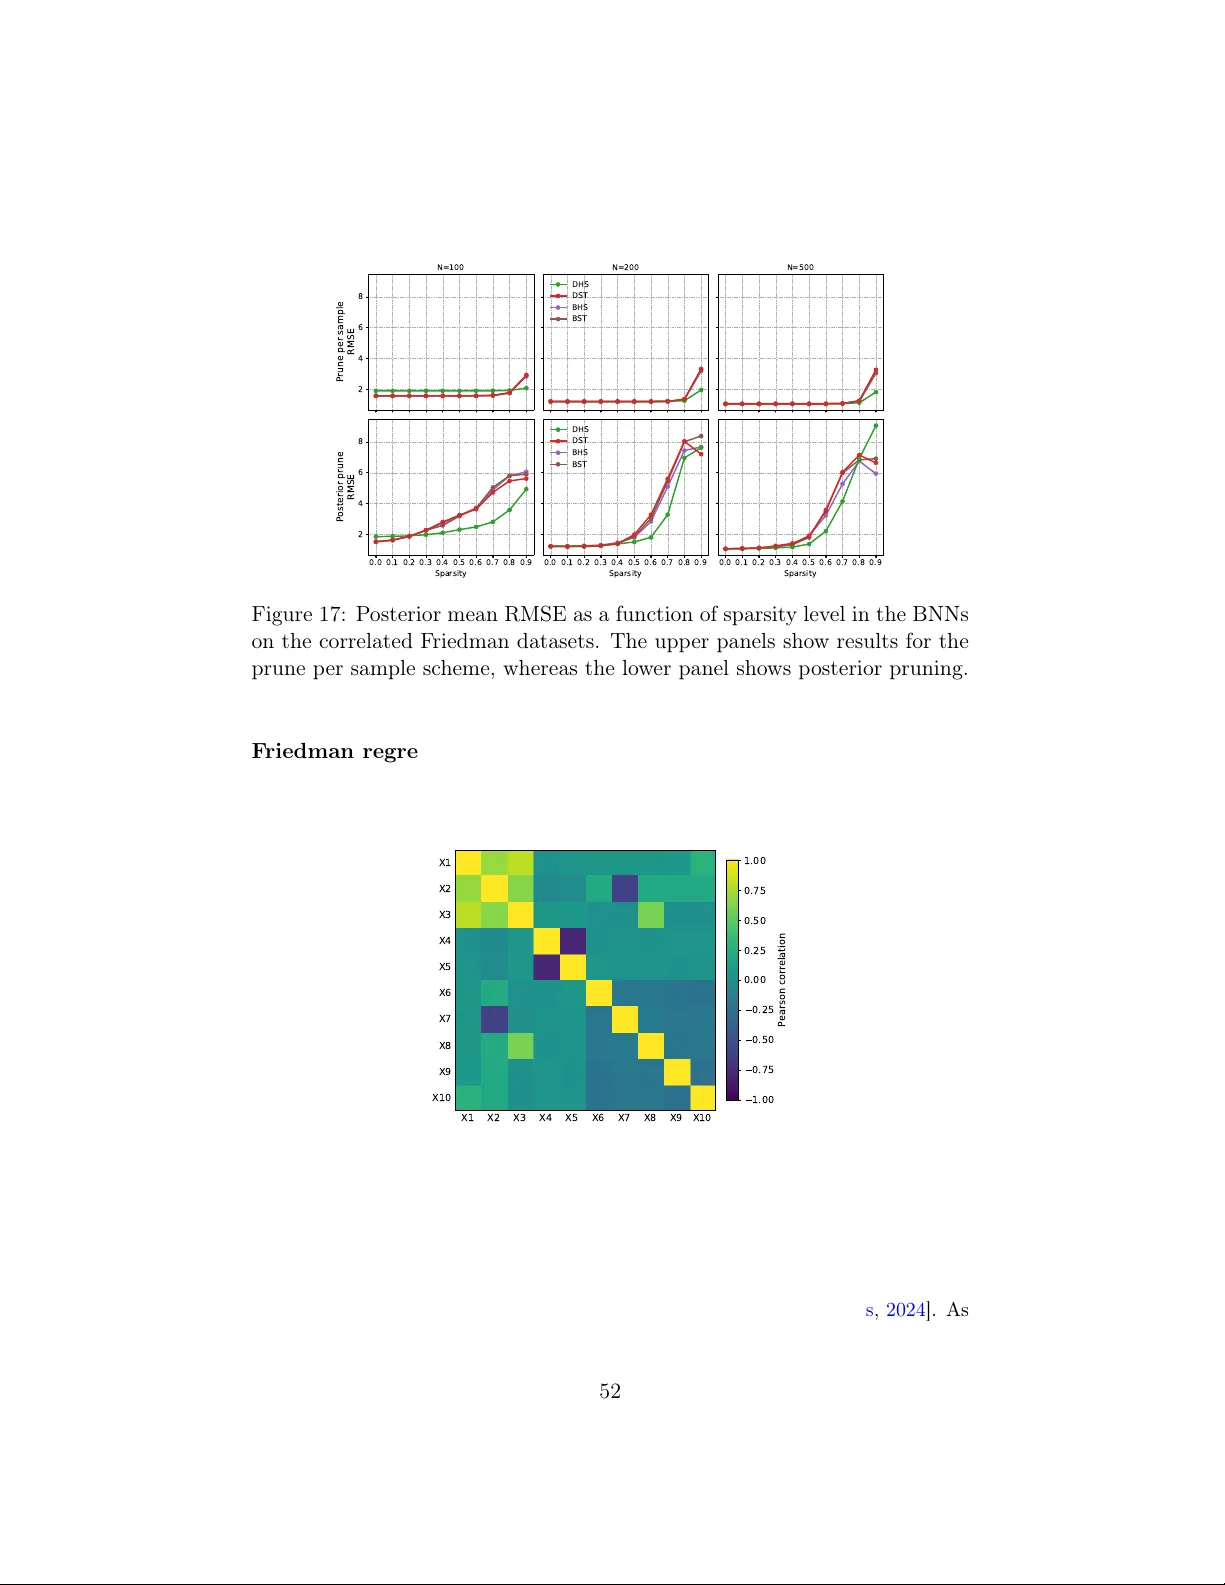
Diric hlet Scale Mixture Priors for Ba y esian Neural Net w orks August Arnstad ∗ Leiv Rønneb erg † Geir Storvik ‡ Abstract Neural net works are the cornerstone of mo dern machine learning, y et can be difficult to in terpret, give o verconfiden t predictions and are vulnerable to adv ersarial attac ks. Ba yesian neural net works (BNNs) pro vide some alleviation of these limitations, but hav e problems of their o wn. The key step of sp ecifying prior distributions in BNNs is no trivial task, yet is often skipp ed out of conv enience. In this w ork, w e prop ose a new class of prior distributions for BNNs, the Diric hlet scale mixture (DSM) prior, that addresses current limitations in Ba yesian neural net- w orks through structured, sparsity-inducing shrink age. Theoretically , w e derive general dep endence structures and shrink age results for DSM priors and show how they manifest under the geometry induced b y neu- ral netw orks. In exp erimen ts on sim ulated and real world data we find that the DSM priors encourages sparse netw orks through implicit fea- ture selection, show robustness under adversarial attacks and deliv er comp etitiv e predictiv e p erformance with substantially few er effectiv e parameters. In particular, their adv an tages app ear most pronounced in correlated, mo derately small data regimes, and are more amenable to w eight pruning. Moreo ver, by adopting hea vy-tailed shrink age mec h- anisms, our approach aligns with recen t findings that suc h priors can mitigate the cold posterior effect, offering a principled alternative to the commonly used Gaussian priors. Keywor ds— Ba yesian neural netw orks, hierarc hical priors, heavy-tailed priors, sparsit y , interpretabilit y , robustness, cold p osterior effect ∗ Departmen t of Statistics & Data Science, Univ ersity of Oslo. Email: au- gusa@math.uio.no † Departmen t of Statistics & Data Science, Universit y of Oslo. Email: ltron- neb@math.uio.no ‡ Departmen t of Statistics & Data Science, Univ ersity of Oslo. Email: geirs@math.uio.no 1 1 In tro duction F or machine learning tasks, neural netw orks (NNs) are widely applied in a v ariet y of settings, due to their ability to mo del complex relationships in high-dimensional data. They do so by mo deling resp onses y ∈ R d with the function f 1 ( x ) = W 1 x + b 1 f ℓ ( x ) = W ℓ φ ( f ℓ − 1 ( x )) + b ℓ , l = 2 , . . . , L ˆ y ( x ) = f L ( x ) , (1) where x ∈ R p is the input, W ℓ ∈ R h ℓ × h ℓ − 1 and b ℓ ∈ R h ℓ are w eigh t matrices and bias v ectors, φ is an elemen t-wise non-linear activ ation function, ˆ y ( x ) ∈ R d is the net work output, and p ( · | f L ( x )) denotes the lik eliho o d mo del. Ho wev er, due to ov er-parametrization and gro wing size, they are hard to in terpret and often o verconfiden t in their predictions [ Arb el et al. , 2023 ]. Bay esian neural netw orks (BNNs) promise to mitigate predictive ov erconfidence b y incorp orating uncertain ty in to the predictions, at the cost of increased computational complexity [ F ortuin et al. , 2022 ]. A BNN is a neural netw ork in whic h one places a prior distribution p (Θ) ov er the net work parameters Θ = { W ℓ , b ℓ } ℓ =1 ,...,L , and aims to infer the p osterior distribution p (Θ | y ) = p ( y | Θ) p (Θ) p ( y ) . (2) The distributional formulation extends inference b eyond single p oin t estimates, making it possible to study uncertain ty and other distributional prop erties of the mo del. This generality , ho wev er, comes at the cost of significan t computational and metho dological challenges. In order to define a BNN, one m ust c ho ose the prior distribution suc h that it reflects ones prior b eliefs about the parameters in the mo del. Specifying such beliefs is difficult, esp ecially in BNNs where a large n umber of parameters with complex in teractions make it unclear how prior infor- mation should b e encoded. As a consequence, because sp ecifying a prior is difficult, the standard in many BNN applications has b een to choose the simplest prior of all, isotropic Gaussian distributions, p (Θ) = N (0 , α 2 I ) with α typically chosen to scale inv ersely with the square ro ot of the la yer width. The Gaussian prior is regarded as uninformativ e and has conv enien t sampling prop erties, making it a p opular c hoice [ F ortuin , 2022 ]. Ho wev er, it has recen tly b een p oin ted out that the c hoice of prior can greatly affect the posterior distribution in BNNs, and that tem- p ering the posterior can significantly impro ve p erformance, a phenomenon referred to as the c old p osterior effe ct [ W enzel et al. , 2020a , T ran et al. , 2022 , F ortuin , 2022 ], suggesting that either the lik eliho o d or the prior is missp ecified. Because of the cold p osterior effect, there has b een a growing in terest in more complex priors, such as sparsit y-inducing priors, functional priors, structured priors, and hierarchical pri- ors [ Louizos et al. , 2017 , Ghosh et al. , 2019 , T ran et al. , 2022 ]. Man y of the prior distributions that hav e b een prop osed are so-called scale mixture priors, where the prior structure is enco ded in the v ariance of the prior distribution [ Bhattac harya et al. , 2015 ]. 2 This pap er introduces a structured extension of classical global-lo cal scale mix- ture priors for BNNs, in whic h an additional join t scale is used to regularize param- eters at a group-lev el alongside the usual global and lo cal comp onen ts. Building on ideas from Bhattachary a et al. [ 2015 ], Nagel et al. [ 2024 ] on comp etitiv e shrink- age via Dirichlet distributions, we define our nov el class as Dirichlet Scale Mixture (DSM) priors. The main idea b ehind the DSM prior class is to use the Diric hlet distribution to allocate a fixed v ariance budget in a w ay that is structurally natural for neural netw orks. Similar approac hes with the Dirichlet distribution ha ve b een tak en, for example for generalized linear mixed mo dels [ Y anc henko et al. , 2025 ]. In our approach, all weigh ts mapping in to the same no de in a hidden lay er share a group-sp ecific v ariance, allotted out to individual weigh ts according to a Diric hlet comp onen t. W e exp ect this to encourage sparse solutions, as entire no des may b e strongly shrunk through the group scale, while individual weigh ts within a group are further shrunk at the lo cal level. In this paper w e analyse how this structured prior assumption translates into dep endence, sparsity and effectiv e model complexity in BNNs. W e deriv e general theoretical prop erties of the a priori dep endence and s hrink age behavior induced b y DSM priors and inv estigate how these prop erties manifest in neural netw ork settings. Empirically , we compare DSM priors to standard global-lo cal alternatives and sho w that they consisten tly yield netw orks that are more amenable to pruning, rely on substantially fewer effective parameters, and remain competitive in terms of predictive p erformance. The remainder of the paper is organized as follo ws. In Section 2 , a brief review of the literature is given. Section 3 introduces the DSM prior class, highligh ts sim- ilar priors and describ es its application to neural net work models. The dependence structure and shrink age prop erties of the DSM priors are given in Section 4 , b efore sho wcasing exp eriments in Section 5 . The article is wrapp ed up with a discus- sion in Section 6 . The Supplemen tary Material 7 is organized into five sections. It contains additional analysis of the dependence structure; detailed lemmas and pro ofs of theorems; further exp osition of the linearization pro cedure; extended ex- p erimen tal results including con vergence diagnostics and implemen tation details; and a complete co de example. 2 Related w ork The field of Ba yesian neural netw orks has received significan t in terest due to their unique prop erties. In particular, their probabilistic form ulation naturally incorp o- rates Occam’s razor b y fav oring simpler explanations unless the data pro vide strong evidence for more complex mo dels, while also remaining robust against o verconfi- den t predictions [ MacKay , 1992 , Bishop , 1995 ]. Ho wev er, recent findings suc h as the cold p osterior effect, has raised questions tow ards b oth inference techniques and prior specification. W enzel et al. [ 2020a ] h yp othesize that tec hniques in deep learning may compromise the likelihoo d, or that the Gaussian priors are inade- quate. F urthermore, W enzel et al. [ 2020b ] argue that the cold p osterior effect is 3 primarily driv en by data augmen tation, frequently employ ed in deep learning, and Marek et al. [ 2024 ] attribute it to mo del misspecification that leads to underfitting or inflated estimates of aleatoric uncertaint y . F ortuin et al. [ 2022 ] argues that the cold p osterior is dep endent on the architecture, and that data augmentation do es not remo ve the cold p osterior effect for all mo dels. They advocate tailoring the prior based on the arc hitecture, sho wing that, fully connected lay ers trained with sto c hastic gradien t descent metho ds are heavy-tailed and recommend reflecting this in priors also for BNNs. This raises the question whether priors should mimic the hea vy-tailed behavior, reinforcing it, or counteract it, dep ending on the desired inductiv e bias. The cold p osterior effect questions b oth inference techniques and prior sp ecifica- tion in Bay esian deep learning. Inference techniques such as v ariational drop out in neural netw orks are interpreted as an approximation to (deep) Gaussian pro cesses [ Gal and Ghahramani , 2016 ]. Although not intrinsically Bay esian, suc h tec hniques can help our understanding of the distributional prop erties in BNNs. Notably , Molc hanov et al. [ 2017 ] demonstrate that drop out pro duces extremely sparse neu- ral netw orks with negligible accuracy loss. Ho w ever, despite its empirical success, Hron et al. [ 2018 ] p oint out that v ariational drop out suffers from improp er priors, leading to p osterior pathologies that cannot be remedied. F rom a more theoret- ical p ersp ective, Vladimiro v a et al. [ 2019 ] sho w that the distribution of nodes in a BNN with Gaussian i.i.d. priors, b ecome sub-W eibull distributed in deep er lay- ers, highligh ting ho w prior choices alone can induce strong structural prop erties. This further stresses the need for a deeper understanding of prior distributions in Ba yesian neural net works. The literature on BNNs primarily considers priors on the weigh ts, as they gov- ern the netw ork’s functional complexit y . While Gaussian i.i.d. priors on the weigh ts are attractive due to their ease of sampling and analytical tractability , their inter- pretation in neural net works is difficult, as the hea vy ov erparameterization obscures the relationship b etw een weigh t distributions and the underlying data. An y prior parameterized on the weigh ts combined with a deterministic netw ork architecture induces a prior in the function space. Therefore, a line of work fo cuses on desirable prop erties the net work should hav e in function space. Nalisnic k et al. [ 2021 ] ex- tend the penalizing complexity prior by Simpson et al. [ 2017 ], to yield a predictive complexit y prior that p enalizes large deviation in predictions, by comparing the net work to a less complex base mo del. F urthermore, T ran et al. [ 2022 ] matc h the induced functional prior to a Gaussian pro cess via an optimization scheme based on a distance measure b et ween the GP and the net work, to make the prior exhibit in terpretable prop erties. Another line of priors are motiv ated b y sparsit y , not only for its computational b enefits, but also because of concepts such as the lottery tic ket h yp othesis [ F rankle and Carbin , 2019 ]. The lottery tick et hypothesis indicates that there exists subnet- w orks whic h give roughly the same p erformance as the o verparameterized net works. Obtaining these net works is not trivial, but the class of sparsit y-inducing priors ha ve sho wn promising results. Sparsit y-inducing priors hav e b een widely studied for standard regression mo dels, but their effect on BNNs hav e not b een as exten- 4 siv ely inv estigated. The classical spike-and-slab prior [ Mitc hell and Beauchamp , 1988 ] induces sparsit y similar to the Bernoulli drop out [ Boluki et al. , 2020 ] and can also b e used for mo del selection [ Hubin and Storvik , 2023 ]. F urthermore, one of the most p opular sparsit y-inducing priors is the horsesho e prior [ Carv alho et al. , 2009 ]. With a high concentration of mass near zero and heavy tails, it shrinks most weigh ts to zero, while allo wing a few w eights to escap e shrink age through lo cally large scales. The horseshoe prior b elongs to the p opular class of global-local shrink age priors, which use one global scale to con trol o verall shrink age and one lo cal scale to allo w some co efficients to escap e shrink age. Many global-lo cal priors can be expressed as part of the larger class of scale mixture Gaussian priors [ P olson and Scott , 2011 ]. Bhattachary a et al. [ 2015 ] conjectures, based on strong empirical evidence, that the horsesho e leads to optimal shrink age rates. Ho wev er, as the the- oretical properties of the horseshoe are not fully clear, Bhattachary a et al. [ 2015 ] in tro duces the Diric hlet Laplace prior, which is sho wn to attain optimal shrink age. Another Gaussian scale mixture for regression mo dels is the Dirichlet horseshoe prior [ Nagel et al. , 2024 ], for whic h we dev elop new theoretical foundations and extend to the neural netw ork setting. Structure can also b e introduced into sparsifying priors to encourage group-wise shrink age [ Ghosh et al. , 2019 , Louizos et al. , 2017 ]. By letting either all incoming or all outgoing weigh ts of a neuron share the same scale parameter, shrink age acts on groups of weigh ts rather than on eac h w eight individually , with the possibility of an additional global scale controlling the ov erall level of sparsity . In Louizos et al. [ 2017 ], this structure is exploited to prune entire neurons by thresholding mo des of outgoing weigh ts, thereby reducing the fixed point precision required to represen t the net work. On the other hand, Ghosh et al. [ 2019 ] consider incident weigh ts and use the structure for mo del selection. 3 The Diric hlet Scale Mixture (DSM) priors W e no w extend the global-lo cal shrink age framework b y in tro ducing joint regular- ization using the Diric hlet distribution. Let w j = ( w j 1 , . . . , w j p ) ⊤ denote a generic group of co efficients of length p . The Dirichlet scale mixture (DSM) prior is defined hierarc hically by w j k | τ , λ j , ξ j k ∼ N 0 , τ 2 λ 2 j ξ j k , ( ξ j 1 , . . . , ξ j p ) ∼ Dir( α 1 , . . . , α p ) ∈ ∆ p − 1 , λ j ∼ P λ , τ ∼ P τ . (3) where ∆ p − 1 denotes the standard p − 1 Euclidean simplex, α k , k = 1 , . . . , p are the concen tration parameters, τ > 0 is a global scale, λ j > 0 a group scale and ξ j a simplex-v alued random vector with P p k =1 ξ j k = 1 . W e restrict our attention to the symmetric case α k = α for all k . The distributions P λ and P τ are unsp ecified 5 p ositiv e prior distributions, go verning the amount of shrink age induced at the group and global levels, resp ectively . The intuition is to treat parameters in groups with a fixed v ariance budget τ 2 λ 2 j , and let the Dirichlet comp onent distribute this v ariance within eac h group. This induces negative dep endence among the ξ j k through the simplex constraint, coupling prior v ariances and promoting comp etition and sparsity . The DSM hier- arc hy th us imp oses three levels of shrink age: a global scale τ , group-specific scales λ j , and a joint allo cation ( ξ j 1 , . . . , ξ j p ) that couples co efficien ts within each group. The grouping used by the DSM prior is mo del dep endent. In linear regression there is no comparable arc hitectural grouping, and we therefore assign co efficient- sp ecific lo cal scales, while using a single Diric hlet vector to allocate v ariance across co efficien ts. In contrast, for models such as neural netw orks, meaningful groups arise naturally from the architecture itself. In the Bay esian neural net work setting, w e exploit this structure by assigning priors at m ultiple lev els. W e share the global scale τ across the lay er, let all incoming weigh ts to a no de j share a group-sp ecific scale λ j , and use Dirichlet comp onen ts ξ j k to gov ern how v ariance is allo cated among the incoming w eigh ts. This is similar to the ideas in Y anchenk o et al. [ 2025 ], who place a Diric hlet distribution on the v ariance comp onents of coefficients in generalized linear mixed mo dels. They do so by placing a Beta prior on the co efficien t of determination R 2 , in order to induce a Beta prime prior on the total v ariance that is subsequently allo cated via a Diric hlet distribution. The concen tration parameter α controls the lev el of sparsity within groups. Small v alues of α encourage highly uneven allo cations in whic h only a few co ef- ficien ts receive substantial v ariance, while α = 1 corresp onds to a uniform distri- bution on the simplex. As α gro ws large, the Diric hlet distribution concentrates around (1 /p, . . . , 1 /p ) and the allo cation becomes increasingly uniform. In this regime, the dep endence induced b y the simplex constraint v anishes and the DSM prior reduces to a standard global-lo cal scale mixture with group-level v ariance τ 2 λ 2 j /p . This limiting case connects the DSM framework directly to classical shrink- age priors, most notably the horsesho e. Dep ending on whether the group-lev el scale λ j is retained or replaced by parameter-sp ecific scales, this limit recov ers either a group ed or a fully lo cal version of the horsesho e prior. It is defined by placing half-Cauc hy scales b oth lo cally and globally , w j k | τ , λ j ∼ N 0 , τ 2 λ 2 j , λ j ∼ C + (0 , 1) , τ ∼ C + (0 , τ 2 0 ) . The horseshoe has b een sho wn to effectiv ely capture signals in high-dimensional settings, as most parameters are shrunk aggressiv ely to ward zero while a few escape due to the lo cally hea vy tails [ v an der Pas et al. , 2017 ]. While this shrink age profile is a key strength of the horsesho e, it also implies that co efficients escaping shrink age are only weakly regularized. 6 The Diric hlet Student’s t prior In this pap er, w e will b e mostly concerned with the DSM priors that use a half- Cauc hy distribution for τ and let λ i follo w a half-Student’s t distribution. By letting P λ = t + ν , the group regularization is gov erned by the tails of the Studen t’s t, which is dependent on the degrees of freedom (df ), ν . This means that the Diric hlet Student’s t prior allo ws for flexible shrink age controlled by tuning ν . When ν is small, the distribution b ecomes hea vy-tailed, enforcing strong shrink age for most draws while allo wing a few to tak e large v alues. As ν increases, the tails b ecome ligh ter and the shrink age becomes more uniformly mo derate. W e define the Dirichlet Student’s t prior as w j k | τ , λ j , ξ j k ∼ N 0 , τ 2 λ 2 j ξ j k , ( ξ j 1 , . . . , ξ j p ) ∼ Dir( α, . . . , α ) ∈ ∆ p − 1 , λ j ∼ t + ν (0 , 1) , τ ∼ C + (0 , τ 2 0 ) . where τ 0 is a h yp erparameter to be c hosen. By c ho osing ν = 1 , the Dirichlet Studen t’s t prior b ecomes a Dirichlet horsesho e prior [ Nagel et al. , 2024 ], as t + 1 = C + (0 , 1) . 3.1 Regularization of the DSM priors Hea vy-tailed scale priors suc h as the half-Cauc hy and low-df Student’s t can pro- duce extremely large lo cal scales, which may cause n umerical instabilities and slo w mixing in p osterior sampling. F ollowing Piironen and V ehtari [ 2017 ], we therefore apply a soft regularization to the local scales. This modification preserv es shrink age b eha vior, while substantially impro ving computational robustness. W e regularize b y replacing eac h group scale λ j b y a regularized version ˜ λ 2 j = c 2 λ 2 j c 2 + τ 2 λ 2 j , c 2 ∼ In vGamma( a, b ) , (4) where the hyperparameter c controls the degree of truncation. When c 2 ≫ τ 2 λ 2 j , the prior reduces to the original heavy-tailed form, whereas for c 2 ≪ τ 2 λ 2 j the lo cal v ariance is b ounded by c 2 . This transformation can b e applied generically to an y DSM v arian t b y substituting λ j with ˜ λ j . The c hoices of a and b determine the effectiv e slab b ehavior. F ollo wing Piironen and V ehtari [ 2017 ], w e set a = ν c 2 / 2 = , b = ν c 2 s 2 / 2 , which induces a scaled half-Studen t’s t distribution with scale s on the slab comp onent. Here, ν c 2 denotes the degrees of freedom con trolling tail hea viness, while s determines the typical magnitude of coefficients that escape shrink age. In our exp eriments, we set ν c 2 = 4 , s 2 = 2 , corresponding to a mo derately heavy tailed slab. 7 4 Prop erties of the DSM priors In this section, we characterize the dep endence structure and shrink age behavior induced by the DSM priors. 4.1 Dep endence structure W e study the dep endence induced by the DSM prior through the v ariance compo- nen ts that gov ern the weigh ts within each group. In our mo del, the prior v ariance of weigh t w j k is given by V ar( w j k | ˜ λ 2 j , ξ j ) = τ 2 ˜ λ 2 j ξ j k , (5) where ξ j = ( ξ j 1 , . . . , ξ j p ) ∼ Diric hlet( α, . . . , α ) and ˜ λ 2 j denotes the regularized local scale. T o isolate the structural dep endence induced b y the shared scale, we fo cus on the v ariance comp onen ts excluding the global factor τ 2 and define V j k = ˜ λ 2 j ξ j k , V j l = ˜ λ 2 j ξ j l , k = l. (6) A direct calculation (see Section 1 of the supplementary material 7 ) yields Co v ( V j k , V j l ) = 1 p 2 ( pα + 1) αp V ar( ˜ λ 2 j ) − E [ ˜ λ 2 j ] 2 . (7) The sign of the cov ariance is therefore gov erned by the square of the co efficien t of v ariation C V 2 ( ˜ λ 2 j ) = V ar( ˜ λ 2 j ) E [ ˜ λ 2 j ] 2 , (8) in the sense that Co v ( V j k , V j l ) < 0 , if C V 2 ( ˜ λ 2 j ) < 1 pα , = 0 , if C V 2 ( ˜ λ 2 j ) = 1 pα , > 0 , if C V 2 ( ˜ λ 2 j ) > 1 pα , (9) where the group size p and the concentration parameter α directly mo dulate the threshold b et ween negativ e and p ositive dependence. The qualitative b ehaviour of C V 2 ( ˜ λ 2 j ) dep ends on b oth the prior placed on λ j and the regularization map defining ˜ λ 2 j . Heavy-tailed priors on ˜ λ j tend to in- flate disp ersion and therefore promote p ositiv e dependence b et ween comp onen ts, whereas lighter-tailed priors fav or negative dependence. An interesting sp ecial case is the Dirichlet–Laplace prior [ Bhattac harya et al. , 2015 ], for which ˜ λ 2 j ∼ Gamma( pα, 1 / 2) and C V 2 ( ˜ λ 2 j ) = 1 /pα , reco v ering the uncorrelated, and in fact indep enden t, case. F urthermore, the regularization map imp oses the deterministic b ound ˜ λ 2 j ≤ c 2 /τ 2 . As a consequence, for fixed τ and c , all moments of ˜ λ 2 j exist ev en when λ j follo ws a hea vy-tailed prior. In our mo del, the b ound parameter c 2 8 is itself assigned an in verse gamma prior, meaning that the co v ariance sign will de- p end on c 2 . Consequently , heavy-tailed priors on λ j still tend to increase C V 2 ( ˜ λ 2 j ) relativ e to light-tailed alternativ es, but this effect is progressively atten uated as c 2 decreases. This atten uation effect is illustrated in Figure 1 , which displays the dis- p ersion ratio C V 2 ( ˜ λ 2 j ) ev aluated at three represen tative v alues of the regularization parameter c 2 , namely the prior median of c 2 , the 0 . 9 quan tile of the prior distribu- tion of c 2 , and a v ery large v alue of c 2 . Large v alues of c 2 reco ver the b eha vior of the unregularized model, while smaller v alues enforce a stronger Gaussian en velope on the marginal weigh t distribution and fav or negative dependence through reduced disp ersion. 0 2 4 6 8 10 T ail parameter 0 1 2 3 4 5 6 7 C V ( 2 j ) 2 c 2 = 2 . 3 8 3 0 2 4 6 8 10 T ail parameter c 2 = 7 . 5 2 1 0 2 4 6 8 10 T ail parameter c 2 = 1 e 3 Half -Nor mal G a m m a ( s h a p e k ) I n v - G a m m a ( s h a p e a ) B e t a - p r i m e ( b , a = 1 ) H a l f - t ( d f ) Figure 1: Monte Carlo estimates of the dispersion ratio C V 2 ( ˜ λ 2 j ) for differen t scale priors as a function of their tail-controlling parameter ( σ, k , a, b, ν ) . The curv es are ev aluated at three fixed v alues of the regularization parameter: (i) the median of the prior on c , (ii) the 0 . 9 quantile of the prior on c 2 , and (iii) a v ery large v alue of c , corresp onding to an essen tially unregularized regime. The horizon tal line indicates the threshold 1 / ( pα ) separating negativ e and p ositiv e cov ariance regimes. Smaller v alues of c attenuate disp ersion and increasingly fav or negativ e co v ariance among the v ariance comp onents ˜ λ 2 j ξ j k . A final remark is in order. The dependence describ ed abov e arises through the v ariance comp onents of the weigh ts and is scaled by the global parameter τ , whic h w e take to follow a half-Cauch y prior. While τ controls the o verall magnitude of the weigh ts, its direct effect cancels out in relative quantities such as correlations, so that the dep endence structure itself is indep enden t of the global scale. The analysis ab ov e therefore characterizes gen uine structural prop erties of the prior. A t the same time, this dep endence acts indirectly , entering through the v ariance comp onen ts of the weigh ts. This means that the induced dep endence do es not app ear at the lev el of marginal means, but is expressed through relativ e dispersion and higher-order moments. In what follo ws, we shift fo cus to marginal shrink age profiles, whic h provide a complemen tary and more directly interpretable summary of the regularization b ehavior induced b y the DSM priors. 9 4.2 Horsesho e for linear regression W e now turn to shrink age and mo del complexity under the DSM priors. W e first study the scalar shrink age factor κ in a linear regression mo del with a horsesho e prior on the co efficients, following Piironen and V ehtari [ 2017 ]. This restriction to scalar shrink age factors is delib erate, since for group ed parameters, shrink age is naturally describ ed by matrix-v alued op erators rather than scalars. W e therefore dev elop the scalar theory first, and return to the group ed case when lifting the analysis to linearized Bay esian neural netw orks. Consider the linear regression mo del y i = x ⊤ i w + ε i ε i ∼ N (0 , σ 2 ) i = 1 , . . . n (10) where x i , w ∈ R p and we assume X ⊤ X ≈ n diag ( s 1 , . . . s p ) . Equip the coefficients with an unregularized horsesho e prior w j | τ , λ j ∼ N (0 , τ 2 λ 2 j ) j = 1 , . . . p λ j ∼ C + (0 , 1) where τ is some global hyperparameter. The prior on τ is not sp ecified but is often also half-Cauc hy , with the pap er Piironen and V ehtari [ 2017 ] inv estigating the initial scale of the prior on τ . F rom this, the p osterior mean of the co efficients w given h yp erparameters λ j , data ( X , y ) , for fixed τ , σ can be expressed as ¯ w j = (1 − κ j ) ˆ w j , κ j = 1 1 + nσ − 2 τ 2 s 2 j λ 2 j = 1 1 + z 2 j λ 2 j , (11) where ˆ w j is the ordinary least square (OLS) estimator and κ j is the shrink age factor for w j , with z j = √ nσ − 1 τ s j . Intuitiv ely , κ j = 1 means complete shrink age of w j and κ j = 0 no shrink age. These results hold in general for Gaussian scale mixtures for fixed z j [ Piironen and V eh tari , 2017 ]. By no w letting λ j follo w an i.i.d. half Cauc hy prior for all j , for fixed τ and σ , one can show that κ j follo ws the a priori distribution p ( κ j | σ , τ ) = 1 π z j ( z 2 j − 1) κ j + 1 1 √ κ j p 1 − κ j , (12) with E λ j [ κ j | σ , τ ] = 1 1 + z j , V ar λ j ( κ j | σ , τ ) = z j 2(1 + z j ) 2 . Another v aluable prop erty one can obtain from the shrink age factor, is the effectiv e n umber of nonzero coefficients. F or a given τ , Piironen and V ehtari [ 2017 ] define this as m eff = p X j =1 (1 − κ j ) , (13) 10 and it effectively counts the n umber of times κ j is close to zero. This measure can b e used as an indicator for effective mo del size. F rom the exp ectation and v ariance of the shrink age factor, Piironen and V eh tari [ 2017 ] further dev elop the exp ectation and v ariance of m eff and use these to choose the global prior scale τ 0 . In the regularized horsesho e, Piironen and V eh tari [ 2017 ] shows that one obtains the shrink age co efficien t ˜ κ j = (1 − b j ) κ j + b j b j = 1 1 + nσ 2 s 2 j c 2 (14) where κ j is the original shrink age co efficien t. Thus, the theoretical results are mo dified by a shift from the in terv al (0 , 1) to ( b j , 1) , which is a result of truncating λ j . 4.3 DSM for linear regression W e now develop an analogous shrink age theory for the DSM priors. Consider again the regression in Equation ( 10 ), but now assign w j the unregularized Dirichlet Horsesho e prior w j | τ , λ j , ξ j ∼ N (0 , τ 2 λ 2 j ξ j ) (15) where ξ = ( ξ 1 , . . . , ξ p ) ∼ Dir( α, . . . , α ) ∈ ∆ p − 1 and again assume X ⊤ X ≈ n diag ( s 1 , . . . , s p ) . In the absence of a natural higher-lev el grouping in linear regression, we adopt the finest possible grouping by treating each co efficient as its own group and assigning an individual lo cal scale λ j . T his choice preserves direct comparabilit y with the horsesho e analysis of Piironen and V eh tari [ 2017 ] while isolating the effect of the Diric hlet v ariance allo cation. By noting that eac h comp onent ξ j marginally follows a Beta( α, ( p − 1) α ) dis- tribution under symmetry , we can state that, given h yp erparameters λ j , ξ j , data ( X , y ) , for fixed τ , σ , the marginal shrink age factor takes the form κ j = 1 1 + nσ − 2 τ 2 s 2 j λ 2 j ξ j = 1 1 + z 2 j λ 2 j ξ j , (16) with z j defined as b efore. W e now put forth a theorem that will characterize the marginal shrink age imposed b y the DSM priors. Ho ere, we denote b y 2 F 1 the generalized hypergeometric function with p = 2 , q = 1 [ Andrews et al. , 1999 ]. Theorem 4.1. L et w j fol low the DSM prior with glob al sc ale τ , gr oup sc ale λ j ∼ t + ν (0 , 1) and lo c al sc ale ξ j ∼ Beta( α, ( p − 1) α ) mar ginal ly. Assume a z j = √ nσ − 1 τ s j > 0 to b e fixe d and given. The mar ginal prior distribution of κ j as p er Equation ( 16 ) , with the ac c omp anying assumptions, c an b e written as p ( κ j | τ , σ ) = ˜ C ( ν, z j ) · ( α ) ν / 2 ( pα ) ν / 2 · κ ν 2 − 1 j (1 − κ j ) ν 2 +1 · 2 F 1 ν +1 2 , α + ν 2 pα + ν 2 ; − κ j ν z 2 j 1 − κ j ! 11 wher e ˜ C ( ν, z j ) = Γ( ν +1 2 ) √ ν π Γ( ν 2 ) ν ν +1 2 z ν j . When ν = 1 , we obtain p ( κ j | τ , σ ) = 1 π z j (1 − κ j ) √ κ j p 1 − κ j ( α ) 1 / 2 ( pα ) 1 / 2 2 F 1 1 , α + 1 2 pα + 1 2 ; − κ j z 2 j 1 − κ j ! . The exp e ctation is in that c ase given by E ξ j [ κ j | τ , σ ] = 2 F 1 1 , α pα ; z 2 j − z j ( α ) 1 / 2 ( pα ) 1 / 2 2 F 1 1 , α + 1 2 pα + 1 2 ; z 2 j . A pro of can b e found in the supplementary material 7 . The ab ov e theorem extends the w ell-known horseshoe shrink age result b y iden- tifying the a priori marginal distribution of κ j under the DSM prior with Studen t’s t distribution for the lo cal scales. In Figure 2 , we see that the marginal prior on 0.00 0.25 0.50 0.75 1.00 0 1 2 3 4 5 6 7 p ( , ) Dirichlet Horseshoe 0.00 0.25 0.50 0.75 1.00 0 1 2 3 4 5 6 7 D i r i c h l e t S t u d e n t ' s T ( = 3 ) z j = 0 . 1 z j = 0 . 7 z j = 1 z j = 2 z j = 5 0.00 0.25 0.50 0.75 1.00 0 1 2 3 4 5 6 7 Horseshoe Figure 2: p ( κ | σ, τ ) in the Dirichlet horsesho e ( ν = 1 ), Dirichlet Studen t’s t (Theorem 4.1 ), and the classical horsesho e (Equation ( 12 )). κ = 1 indicates full shrink age, and κ = 0 indicates no shrink age at all. It is clear that the Diric hlet metho ds shrinks more aggressiv ely , as the shrink age factor κ has more mass close to 1 , than for the horsesho e. κ induced from the Dirichlet horsesho e is essentially a scaled v ersion of the orig- inal horsesho e, which is not surprising as the Diric hlet distribution is symmetric. The Dirichlet Student’s t prior on the other hand lacks the div ergent mass at zero, and yields quite differen t prior shrink age profiles compared to those from horsesho e distributed lo cal scales. The results abov e characterize the marginal shrink age induced by DSM priors in the classical linear regression setting under orthogonality X ⊤ X ≈ n diag ( s 1 , . . . , s p ) . In this regime, the effectiv e shrink age matrix is diagonal and eac h co efficien t w j admits a scalar shrink age factor κ j , whose prior distribution we can describ e in 12 closed form for b oth Dirichlet–horseshoe and Dirichlet–Studen t’s t priors. In neu- ral net works, the situation is more intricate. The likelihoo d depends on the weigh ts through a complicated in teraction structure. T o relate the DSM shrink age be- ha viour to this setting, w e first linearize a single-hidden-la yer BNN around a ref- erence p oint and identify the analogue of the scalar shrink age factor in terms of a matrix-v alued operator acting on the weigh ts. 4.3.1 Linearizing the single-la yer BNN T o extend the scalar shrink age analysis to Ba yesian neural net works, we now place the DSM priors hierarchically on a single-hidden la y er neural netw ork ( L = 2 ) as previously describ ed. Then, w e linearize the net work around a reference p oint ( w 1 , 0 , b 1 , 0 , w L, 0 , b L, 0 ) . This yields a locally linear model in whic h shrink age is naturally describ ed by a matrix-v alued op erator rather than a scalar factor. Let J w denote the Jacobian of the netw ork output with resp ect to the vectorized input w eights w 1 , and let Σ y denote the marginal cov ariance of the linearized likelihoo d. F ull expressions for J w , Σ y , and the linearization are given in Section 3 of the Supplemen tary material 7 . Conditioned on the DSM hyperparameters ( τ , λ , ξ ) , we obtain the approximate linear Gaussian mo del y ∗ | w 1 ∼ N ( J w w 1 , Σ y ) , w 1 ∼ N (0 , τ 2 Ψ) , where the prior cov ariance matrix Ψ ∈ R pH × pH is diagonal with entries Ψ ( k,j ) , ( k ,j ) = λ 2 j ξ kj , k = 1 , . . . , p, j = 1 , . . . , H . Standard Gaussian conditioning gives w 1 | y ∗ ∼ N ( P + S ) − 1 S ˆ w , ( P + S ) − 1 , where P = τ − 2 Ψ − 1 , S = J ⊤ w Σ − 1 y J w , ˆ w = ( J ⊤ w Σ − 1 y J w ) − 1 J ⊤ w Σ − 1 y y ∗ . The matrix K := ( P + S ) − 1 S = I − ( P + S ) − 1 P (17) is a shrink age matrix, generalizing the scalar shrink age κ from linear regression. It go verns the shrink age of the ordinary least squares estimator ˆ w and forms the basis for our subsequent analysis of shrink age in Bay esian neural netw orks. 4.3.2 General shrink age In the case of S b eing diagonal, w e reco ver the scalar shrink age, κ ij for w ij , as seen for the linear regression. In neural net works, ho wev er, the Jacobian structure generally mak es S non-diagonal, so shrink age acts along data-adapted directions rather than co ordinate-wise. T o analyze this, w e exploit the sp ectral structure of the shrink age op erator. 13 As derived in Section 3 of the supplementary material 7 , the matrix admits the whitened form ( P + S ) − 1 S = P − 1 / 2 ( I + G ) − 1 GP 1 / 2 , G = P − 1 / 2 S P − 1 / 2 . Diagonalizing G = U Ω U ⊤ with Ω = diag ( ω 1 , . . . , ω pH ) yields shrink age along the generalized eigenv ectors satisfying S u j = ω j P u j . In these directions, w e obtain a shrink age factor analogous to equation ( 11 ) κ ( u j ) = 1 1 + τ 2 ψ 2 eff ( u j ) u ⊤ j S u j , ψ 2 eff ( u j ) = u ⊤ j Ψ − 1 u j − 1 . (18) Th us, each generalized eigendirection u j b eha ves like a scalar problem with an effectiv e local scale ψ eff ( u j ) and an effectiv e data term u ⊤ j S u j . F urthermore, using the cyclic inv ariance of the trace, one finds tr ( P + S ) − 1 S = tr ( I + G ) − 1 G = pH X j =1 ω j 1 + ω j , (19) whic h provides a direct analogue to the effective mo del size m eff in equation ( 13 ). Consequen tly , as this trace is aggregated ov er generalized directions rather than co ordinates, it remains v alid for non-diagonal S . In contrast to the co ordinate-wise shrink age in a linear regression, the shrink age in a BNN acts in the generalized eigen-directions u j of the pair ( S, P ) . Because eac h hidden unit depends only on its own incoming weigh ts, the Jacobian J w has a unit wise structure when the weigh ts are vectorized, and the matrix S = J ⊤ w J w is therefore close to blo c k-diagonal, with blocks corresp onding to the sets of weigh ts feeding into individual hidden no des. Consequently , man y generalized eigenv ectors u j are effectively lo calized within a single hidden unit. Within eac h blo c k, the effectiv e scale ψ eff ( u j ) captures ho w the DSM prior aggregates no de-level shrink- age through λ j , with the Diric hlet weigh ts ξ ih con trolling relative con tributions of individual inputs. The factor u ⊤ j S u j reflects the data geometry and noise level, and under mild regularity assumptions (see Supplementary material, Section 3, for details), one can establish the b ounds 1 − 1 1 + ψ 2 eff ( u j ) τ 2 Θ( n ) σ 2 +Θ( n ) ≤ 1 − 1 1 + ψ 2 eff ( u j ) τ 2 u ⊤ j S u j ≤ 1 − 1 1 + ψ 2 eff ( u j ) τ 2 σ − 2 Θ( n ) , where Θ( n ) denotes a quan tity that is bounde d ab o ve and below by p ositiv e con- stan ts times n , and σ 2 is the observ ation noise v ariance in the lik eliho o d. These b ounds mak e explicit ho w the sample size n , noise level σ 2 and DSM scales jointly con trol the amoun t of shrink age in eac h mo de u j . 5 Exp erimen ts The experimental analysis fo cuses on the baseline Gaussian prior, the horsesho e prior and tw o instances of DSM priors, namely the Dirichlet horsesho e prior (DSM- HS) and the Diric hlet Student’s t prior (DSM-ST), where the latter is sp ecified 14 with ν = 3 degrees of freedom. First, a constructed linear regression example is used to study shrink age and effective dimensionality in a controlled sparse setting with correlated predictors. Second, the priors are used in BNNs on a simulated regression task, with known in teractions and sparsit y , providing insigh t into how the shrink age b eha viour observ ed in linear mo dels carries ov er to neural netw orks. Lastly , BNNs are fitted to real-world datasets, whic h serve as b enchmarks with less explicit structure and allow us to assess the practical utility of the priors. W e study how our prior construction encourages sparsit y by inv estigating tw o distinct pruning schemes. In the first approac h, which w e refer to as prune p er sample , pruning is applied indep enden tly to each posterior dra w of the netw ork parameters. That is, each sampled netw ork is pruned based on its o wn w eigh t magnitudes, and predictions are obtained b y av eraging ov er the resulting pruned net works. This sc heme preserv es p osterior v ariabilit y in the sparsit y pattern, but leads to sample-specific netw ork structures. In the second approach, which w e refer to as p osterior prune , pruning is p erformed at the level of the p osterior distribution. Here, a single pruning mask is constructed from the p osterior mean of the absolute w eights and applied across all p osterior samples. Predictions are then formed b y a veraging o ver these consistently pruned net works. This sc heme yields a single, in terpretable sparsity structure represen tative of the p osterior. Since the netw orks considered in this study are relativ ely small, the attainable level of sparsit y is inheren tly limited, and we expect larger architectures w ould p ermit substantially higher pruning rates. Moreo ver, p osterior pruning is inherently more aggressiv e than prune-p er-sample, as it enforces a global sparsity pattern across all p osterior dra ws. A cross all exp erimen ts, we use a single-hidden-lay er feedforward Bay esian neural net work with H = 16 neurons. P osterior inference is p erformed using Hamiltonian Mon te Carlo with the No-U-T urn Sampler (NUTS), dra wing M = 1000 samples p er chain from 4 indep endent chains, after a w arm-up p eriod of M warm up = 1000 iterations p er c hain. The same sampling configuration is used for b oth linear and neural-net work mo dels. T o ensure comparable shrink age b eha vior across models, w e follo w the recommendation of Piironen and V ehtari [ 2017 ] for setting the global scale parameter, τ 0 = p 0 p − p 0 σ √ N , where N denotes the sample size, p the input dimensionalit y , p 0 an a priori guess of the num ber of relev ant co v ariates, and σ the noise scale. W e fix p 0 = 4 throughout, encouraging moderate sparsity while remaining agnostic ab out the exact degree. The noise v ariance is assigned the prior σ 2 ∼ Inv - Gamma(3 , 2) , corresp onding to E [ σ 2 ] = V ar( σ 2 ) = 1 . W e view this as mildly informative, anchoring the v ariance at the unit scale after standardization and stabilizing the induced global shrink age lev el τ 0 . In all exp eriments, the lo cal scales in the DSM and Horsesho e priors are regularized as describ ed in Section 3.1 . All prior sp ecifications are held fixed across linear and neural-netw ork mo dels. 15 5.1 A linear regression example Based on the regression in ( 10 ), we construct a linear regression example. W e set N = 250 , p = 10 and generate data X ∈ R N × p , with X standard normally distributed with pairwise correlation ρ b et ween all co v ariates. The response is then generated as y = Xw + ε where ε ∼ N (0 , 1) and w ∈ R p giv en by w 1 = 3 . 0 , w 2 = − 2 . 0 , w 3 = 1 . 5 , w 4 = 0 . 8 , w 5 = 0 . 2 and w 6 = · · · = w 10 = 0 . Upon fitting the mo del, the co efficients are giv en the DSM prior as in ( 15 ), and we fit the mo dels using 80% of the full dataset, for instances of ρ ∈ { 0 . 0 , 0 . 5 , 0 . 9 } . The remaining 20% of the dataset is held out for v alidating the mo dels. In Figure 3 , a histogram of sampled coefficients are shown, with the true co efficien t as the dotted line. In this sparse regime, the Gaussian prior clearly stands out with its p o or estimates compared to the other priors. The regularized horsesho e (RHS) and the DSM priors (DHS and DST) show very similar p erformance across all correlations for co efficien ts that are truly nonzero. It can b e noted that for the smallest co efficient, w 5 , the DSM priors give a go o d estimate on av erage, but show a larger spread than the Gaussian. How ever, for w 6 whic h is truly zero, the DSM priors seem to shrink this muc h stricter than the RHS. Gauss RHS DHS DST 1.75 2.00 2.25 2.50 2.75 3.00 3.25 w 1 Gauss RHS DHS DST 0.2 0.0 0.2 0.4 0.6 0.8 1.0 w 5 Gauss RHS DHS DST 0.4 0.2 0.0 0.2 0.4 0.6 w 6 0.0 0.5 0.9 Figure 3: Boxplot of p osterior samples from ( w 1 , w 5 , w 6 ) for the linear re- gression mo del, for different correlations. The dotted blue line represents the underlying, true co efficient. This is further reflected in Figure 4 , where w e displa y posterior samples of three co efficients w 1 , w 5 and w 6 , alongside the asso ciated κ v alues from ( 16 ). F or w 1 , all mo dels seem to yield little to no shrink age, whic h is of course exp ected, as this is the largest co efficient. It seems that the DSM priors shrink the smallest nonzero coefficient, w 5 , more than the RHS do es. F or the zero co efficien t w 6 , the DSM priors exhibit sup erior shrink age, giving a m uch more narro w estimate cen tered ab out zero. The linear regression exp eriment highligh ts a key distinction b et ween the DSM priors and the regularized horseshoe. While both priors p erform similarly for large co efficients, the DSM priors imp ose stronger shrink age on weak signals. In particular, the smallest nonzero coefficient is shrunk more under the DSM priors, whereas truly zero co efficien ts are more tigh tly concentrated around zero. This effect is not explained by a simple rescaling of the prior, as adjusting the global scale b y √ p yields similar b ehav oir. Instead, the shrink age pattern reflects 16 0.0 0.5 1.0 1 0 10 20 30 40 F r equency 0.0 0.5 1.0 5 0 10 20 30 40 F r equency 0.0 0.5 1.0 6 0 10 20 30 40 F r equency 2 3 w 1 0 1 2 Density 0.0 0.5 1.0 w 5 0 1 2 Density 0.5 0.0 0.5 w 6 0 5 10 Density Gauss RHS DHS DST w true w GLS Figure 4: Estimated density of p osterior samples for w 1 , w 5 , w 6 (left) and histogram of κ 1 , κ 5 , κ 6 (righ t) for the linear regression mo del, for ρ = 0 . 9 . The dashed blac k line represen ts the true co efficient, and the dotted purple line the GLS estimate. the normalization induced b y the Dirichlet distribution when α is small, whic h concen trates mass on a few active coefficients. No w, we turn to Bay esian neural net works. 5.2 F riedman dataset, regression T o ev aluate the priors w e consider the regression dataset prop osed in F riedman [ 1991 ], a popular benchmark for regression trees c haracterized b y b oth interactions and sparsity [ Prado et al. , 2021 ]. The ob jective is to mo del the resp onse y = f ( x )+ ε with f ( x ) = 10 sin( π X 1 X 2 ) + 20 X 3 − 1 2 2 + 10 X 4 + 5 X 5 , (20) where the p = 10 co v ariates X are generated uniformly on the hypercub e [0 , 1] 10 , with only the first five co v ariates contributing to the resp onse, and ε is a stan- dard normal v ariable. In addition to the indep endent setting, we also consider a correlated regime. T o construct correlated uniform cov ariates, w e sp ecify a target Sp earman correlation S ij b et ween cov ariates i and j and map it to a Gaussian copula using the relation R ij = 2 sin( π S ij / 6) , where R ij denotes the correspond- ing P earson correlation. Samples are then drawn from the Gaussian copula and transformed coordinatewise using the standard normal CDF, yielding uniformly distributed cov ariates with the desired dep endence structure. This construction imp oses a correlation, while prese rving uniform marginals. F or b oth the indepen- den t and correlated regimes, w e generate fifteen datasets to fit the mo dels, fiv e 17 Gauss RHS DHS DST 0.4 0.5 0.6 0.7 0.8 0.9 1.0 CRPS MEDIAN T rain size N=100 N=200 N=500 Gauss RHS DHS DST 0.4 0.5 0.6 0.7 0.8 0.9 1.0 1.1 CRPS MEDIAN T rain size N=100 N=200 N=500 Figure 5: Bo xplots of seed-lev el median CRPS for eac h mo del and training sample size on the indep endent F riedman (left) and correlated F riedman (righ t) datasets. F or each training size N ∈ { 100 , 200 , 500 } , five indep endent datasets are used. Each b ox summarizes the fiv e median CRPS v alues, where eac h v alue is computed from p osterior predictiv e ensembles ev aluated on a large generated test set. for each sample size N ∈ { 100 , 200 , 500 } . The mo dels are fit using a single-la yer BNN with H = 16 hidden units, tanh activ ation and ev aluated on N test = 1000 samples from the data generating pro cess, with a previously unseen seed. As noted b y F riedman (1991), the signal-to-noise ratio is high ( SNR = 4 . 8 ). T o ev aluate the F riedman mo dels, all p erformance metrics are computed sepa- rately for each random seed and subsequen tly aggregated o v er the fiv e seeds corre- sp onding to the same training sample size N . In Figure 5 , the contin uous ranked probabilit y score (CRPS) of the mo dels is shown across training sample sizes and dep endence regimes. The results are consistent with those rep orted in T able 1 , with the shrink age priors generally yielding sup erior predictive p erformance com- pared to the Gaussian baseline. F or N = 100 , the DST mo del attains the low est predictiv e error in both the indep endent and correlated settings, while the DHS mo del p erforms less fa vorably in this small-sample regime. As the sample size in- creases, the differences b et ween the sparsit y-inducing priors narrow, with all three ac hieving similar performance for N = 200 and N = 500 . In con trast, the Gaus- sian prior consistently results in higher higher error across all settings, indicating inferior predictive p erformance relative to the shrink age-based alternativ es. T o assess the complexity induced b y the different priors, w e fo cus on the case N = 100 , where prior effects are most pronounced. In Figure 6 , we report the trace of the shrink age matrix ( 17 ) across posterior samples. F or indep endent co- v ariates, the Gaussian prior exhibits substantially larger effectiv e dimensionality than the shrink age-based mo dels. In the correlated setting, the regularized horse- sho e yields the highest effectiv e complexit y among the sparsity-inducing priors. In b oth regimes, the DSM priors produce the low est effective num b er of parameters, suggesting stronger ov erall shrink age. This reduction in complexit y is ac hiev ed 18 Uncorrelated Correlated Model N=100 N=200 N=500 N=100 N=200 N=500 Gauss 2.601 (0.035) 1.443 (0.042) 1.150 (0.018) 2.547 (0.083) 1.459 (0.060) 1.143 (0.017) RHS 2.079 (0.033) 1.260 (0.035) 1.113 (0.018) 1.583 (0.107) 1.233 (0.063) 1.057 (0.011) DHS 2.359 (0.036) 1.243 (0.037) 1.106 (0.018) 1.846 (0.199) 1.232 (0.056) 1.057 (0.011) DST 1.887 (0.042) 1.252 (0.036) 1.107 (0.017) 1.515 (0.099) 1.215 (0.060) 1.049 (0.009) T able 1: Boxplots of p osterior mean RMSE for eac h mo del and training sam- ple size on the correlated F riedman data. F or each N ∈ { 100 , 200 , 500 } , five indep enden t datasets are used. F or each dataset, predictions are formed by a veraging o v er p osterior dra ws and RMSE is computed on a large generated test set. 10 20 30 40 50 t r ( ( P + S ) 1 S ) 0 50 100 150 200 250 300 F r equency Gauss RHS DHS DST (a) Indep enden t features 10 20 30 40 50 t r ( ( P + S ) 1 S ) 0 50 100 150 200 250 300 F r equency Gauss RHS DHS DST (b) Correlated features Figure 6: T race plots of the effectiv e num b er of non-zero parameters m eff = tr ( P + S ) − 1 S for different mo dels on the F riedman dataset with indep en- den t and correlated input features. Each curve corresp onds to a single fitted mo del and shows m eff across 4000 p osterior draws. without a corresp onding loss in predictive accuracy . The same qualitativ e b ehavior is observed in the eigenv alue sp ectra of the shrink age matrix. W e next examine ho w the differen t priors respond to explicit sparsification through pruning. F or the indep endent F riedman dataset (Figure 7a ), across all sparsit y lev els, the Gaussian mo del deteriorates mark edly faster than the shrink age- based priors. The RHS, DHS, and DST mo dels displa y similar robustness in this setting, with no clear separation b etw een them. F or the correlated F riedman dataset (Figure 7b ), the differences b et ween sparsit y-inducing priors become more pro- nounced. While the Gaussian prior again sho ws rapid p erformance degradation, the RHS model also exhibits reduced robustness to pruning. Among the DSM pri- ors, the DHS mo del maintains low er RMSE across a wider range of sparsit y levels, whereas the DST mo del shows in termediate b ehavior, p erforming b etter than the RHS but w orse than the DHS. Overall, thes e results suggest that the DSM priors pro vide a fav orable balance b etw een predictive accuracy , model complexity , and robustness to aggressiv e sparsification, particularly in the presence of correlated 19 5 10 P rune per sample RMSE N=100 N=200 Gauss RHS DHS DST N=500 0.0 0.2 0.4 0.6 0.8 Sparsity 5 10 P osterior prune RMSE 0.0 0.2 0.4 0.6 0.8 Sparsity Gauss RHS DHS DST 0.0 0.2 0.4 0.6 0.8 Sparsity (a) Indep enden t F riedman 2.5 5.0 7.5 P rune per sample RMSE N=100 N=200 Gauss RHS DHS DST N=500 0.0 0.2 0.4 0.6 0.8 Sparsity 2.5 5.0 7.5 P osterior prune RMSE 0.0 0.2 0.4 0.6 0.8 Sparsity Gauss RHS DHS DST 0.0 0.2 0.4 0.6 0.8 Sparsity (b) Correlated F riedman Figure 7: Posterior mean RMSE as a function of sparsity lev el in Bay esian neural net works on F riedman datasets, aggregated across random seeds. The left panel shows the indep endent case and the right panel sho ws the corre- lated case. The upp er panels corresp ond to the prune-p er-sample scheme, the low er panels show p osterior pruning. co v ariates. 5.3 Abalone dataset, regression A classic UCI regression dataset is the Abalone dataset [ Nash et al. , 1994 ], con- taining data from physical measurements on abalone shells. The categorical sex v ariable is enco ded as an ordinal n umerical co v ariate. F urthermore, the target of the regression is the n umber of rings the shell has, which determines the age of the abalone. The dataset consists of N = 4177 observ ations with p = 8 features, man y of which exhibit strong p ositive correlations. W e use an 80 / 20 train–test split. F or the Abalone dataset, w e include the predictive negative log-likelihoo d as a p erformance measure. In Figure 8a and T able 2 , predictiv e p erformance across priors is broadly compa- rable, with only mo derate differences observ ed across training sizes. F or the smallest training fraction ( 0 . 1 N ), the DHS attains the low est predictive error, follow ed by the RHS, while the Gaussian prior again p erforms worse across all metrics. Notably , the DST model exhibits a larger CRPS spread in this small sample regime, indi- 20 Gauss RHS DHS DST 0.5 1.0 1.5 2.0 2.5 3.0 CRPS 0.1N 0.2N N (a) 0.0 0.2 0.4 0.6 0.8 Sparsity 2.5 5.0 7.5 10.0 RMSE P rune per sample Gauss RHS DHS DST 0.0 0.2 0.4 0.6 0.8 Sparsity P osterior prune Gauss RHS DHS DST (b) Figure 8: a) Poin t wise CRPS distributions for eac h mo del on the Abalone dataset at three training sizes. Each b ox summarizes CRPS across test p oints computed from p osterior predictive ensem bles. b) P osterior mean RMSE as a function of sparsity level for the Abalone dataset. The left column shows sample-wise pruning, where masks are recomputed for each p osterior draw, while the right column sho ws p osterior pruning using a single global mask p er mo del. cating greater predictive uncertaint y . At 0 . 2 N , all sparsit y-inducing priors achiev e nearly identical p erformance, with only marginal differences b et ween RHS, DHS, and DST. When trained on the full dataset, performance con verges further, with all mo dels yielding similar RMSE and PNLL v alues, and ov erlapping CRPS distribu- tions. Ov erall, these results suggest that on this relativ ely large dataset, predictive accuracy and uncertaint y metrics pro vide limited separation b et ween priors except for the clear gap to the Gaussian baseline. Clearer differences emerge when examining robustness to sparsification. As sho wn in Figure 8b , the DSM mo dels remain stable under substantial pruning. Un- der the prune-p er-sample scheme, the DHS and DST models maintains near con- stan t RMSE until approximately 90% and 80% sparsit y , respectively , after whic h p erformance degrades. In con trast, the Gaussian and RHS models exhibit a no- ticeable increase in RMSE at substantially low er sparsit y levels, with degradation b eginning around 40 – 50% sparsit y . This separation is ev en more pronounced un- der p osterior pruning, where the RHS model deteriorates rapidly , while the DHS 21 0 . 1 N 0 . 2 N N Model RMSE PNLL RMSE PNLL RMSE PNLL Gauss 2.918 2.534 2.662 2.433 1.990 2.103 RHS 2.578 2.434 2.243 2.232 1.949 2.087 DHS 2.475 2.365 2.240 2.229 1.965 2.096 DST 2.702 2.497 2.236 2.229 1.956 2.087 T able 2: Posterior mean RMSE and test-set negativ e log-likelihoo d on the Abalone dataset for three training sizes (10%, 20%, and full data). prior preserv es predictiv e accuracy o ver a m uch wider sparsity range. The pruning b eha vior of the RHS model in this v ery correlated setting is consisten t with its b eha vior in the correlated F riedman exp eriments. W e also conducted a SHAP analysis using the KernelExplainer framew ork [ Lundb erg and Lee , 2017 , Lundb erg, Scott M. and Lee, Su-In , 2026 ]. SHAP v al- ues are based on Shapley v alues from co op erative game theory and measure the marginal contribution of eac h feature to the mo del prediction. The resulting sum- maries are sho wn together with a visualization of the posterior mean netw ork in Figure 9 . The DHS prior induces substan tially sparser input-to-hidden connec- tivit y , with a larger prop ortion of w eights shrunk effectiv ely to zero compared to the Gaussian, RHS and DST mo dels. The concen tration of mass on fewer con- nections migh t b e the reason the DHS mo del is particularly robust to pruning. Finally , the sparsit y patterns induced b y the Dirichlet Horsesho e mo del enables a degree of feature-level in terpretability . The largest p osterior weigh t magnitudes for the DHS mo del is consistently associated to shuc k ed weigh t (no de 6 ), with height, whole w eight, and viscera w eight (no des 4 , 5 , 7 ) also receiving substantial emphasis. This aligns with the SHAP v alues, whic h similarly indicate these v ariables as most influen tial. 5.4 Breast cancer dataset, classification Another commonly used UCI dataset is the breast cancer dataset [ W olb erg et al. , 1993 ]. The data has p = 30 features on N = 569 observ ations computed from a digitized image of breast mass, that describ e the characteristics of the cell nuclei. The resp onse indicates whether the tumor is malignant or b enign, i.e. we perform a binary classification. As before, the models are trained on 80% of the full dataset, and 20% , 114 observ ations, is held out for testing. W e calculate the accuray (Acc), negativ e log-lik eliho o d (NLL) and exp ected calibration error (ECE) for the mo dels in T able 3 . It is a relativ ely easy classification task, and w e see that all mo dels ac hieve high accuracy and p erformance ov erall is similar. T o analyze ho w robust the p osterior BNNs we obtain are, w e rely on the meth- o ds presen ted in Cardelli et al. [ 2019 ]. In this, a notion of robustness and of safety are presented, and we briefly describ e them here. 22 F eature Gauss RHS DHS DST Whole weigh t 3.48 2.26 2.23 2.14 Sh uck ed w eight 2.69 1.37 1.68 1.36 Shell weigh t 0.98 0.96 0.95 1.00 Viscera weigh t 0.59 0.58 0.53 0.60 Diameter 0.29 0.30 0.29 0.03 Heigh t 0.38 0.19 0.21 0.24 Length 0.49 0.46 0.17 0.12 Sex 0.18 0.17 0.12 0.14 Figure 9: The left figure shows the p osterior mean netw ork, in whic h the thic kness of edges are prop ortional to the mean absolute v alue of weigh ts. The right table displa ys feature imp ortances from a SHAP analysis for the Abalone dataset. Model Acc NLL ECE Gauss 0.9386 0.1288 0.0267 RHS 0.9649 0.1005 0.0320 DHS 0.9649 0.0943 0.0305 DST 0.9649 0.1004 0.0291 T able 3: Posterior mean p erformance of net works on the Breastcancer dataset. Definition 5.1. Robustness: Consider a neural net work f w with training set D . Let x ∗ b e a test p oint and T ⊆ R p a b ounded set. F or a given δ > 0 , define p 1 as the probability p 1 = P ( {∃ x ∈ T : ∥ σ ( f w ( x ∗ )) − σ ( f w ( x )) ∥ q ≥ δ }|D ) , (21) where σ is the softmax output of the classifier and ∥·∥ q is a giv en norm or seminorm (w e apply the ℓ 2 -norm). F or 0 ≤ η ≤ 1 , w e say that f w is robust with probabilit y at least 1 − η in x ∗ with resp ect to T and p erturbation δ iff p 1 ≤ η . This means that p 1 represen ts the probability that there exists x ∈ T such that the output of the softmax lay er deviates from x more than a giv en threshold δ . x ∗ is not necessarily an element of T , but if it is, p 1 assess the robustness to lo cal p erturbations. p 1 is relative to the output of the softmax lay er, and thus the sto c hasticity of it comes only from the distribution ov er weigh ts. Definition 5.2. Safet y: Let f w b e a neural net work, m ( x ) = arg max j σ j ( f w ( x )) 23 denote the predicted class lab el and D denote the training data. Then define p 2 = P ( {∃ x ∈ T : m ( x ∗ ) = m ( x ) }|D ) . (22) F or 0 ≤ η ≤ 1 , the mo del f w is said to be safe with probability at least 1 − η in x ∗ with resp ect to T iff p 2 ≤ η . The sto chasticit y of p 2 includes b oth the distribution o ver w eights and the noise of the mo deled pro cess. This means that for regions of the input space where the mo del is more uncertain of what class to assign the output, p 2 will take on a higher v alue. T o obtain the estimates of p 1 and p 2 w e set up an F GSM (F ast Gradien t Sign Metho d) adv ersarial attac k scheme; see Y uan et al. [ 2019 ] for more details. F or eac h mo del we sample a random subset of the test set, and generate adversarial examples by adding small p erturbations to the input in the direction of the gradient of cross entrop y loss w.r.t. the input. The p erturbation is b ounded b y the ℓ ∞ -ball of radius ε and the threshold δ is chosen in fractions of ε . The FGSM attack is applied to eac h of the M = 100 p osterior netw ork samples, and the resulting adver- sarial outcomes are aggregated across samples to estimate b oth p 1 and p 2 . While p 1 v aries smo othly as a confidence-based measure, p 2 reflects whether adversarial p erturbations induce label changes and is therefore typically 0 or 1 at the run level, with intermediate v alues app earing only when a veraged. Consequen tly , we rep ort the results for p 2 binned into safe if p 2 = 0 , partially safe if p 2 ∈ (0 , 1) , and unsafe if p 2 = 1 , rather than treating it as a contin uous quan tity F rom Figure 10 w e observe that the DST model requires substan tially larger p erturbations to induce changes in the softmax outputs, indicating stronger lo cal stabilit y . This is consisten t with T able 10 , where DST achiev es the highest fraction of safe outcomes and one of the low est fractions of unsafe outcomes. The RHS mo del also p erforms well in terms of robustness, exhibiting relativ ely go od lo cal stabilit y and the smalle st fraction of unsafe outcomes o v erall. The DHS mo del ac hieves a high prop ortion of safe outcomes, but seems to b e more sensitiv e to lo cal p erturbations in terms of p 1 . In contrast, the Gaussian mo del shows weak er robustness, with the low est fraction of safe outcomes and the highest prop ortion of unsafe cases. 6 Discussion This work has presented a new class of sparsity-inducing priors, the Dirichlet Scale Mixture (DSM) priors, for Ba y esian neural netw orks. By utilizing the natural hierarc hy of neural net works, shrink age is imposed globally , at no de level and at w eight level. Each node is assigned with an a priori v ariance budget, whic h is distributed to the incoming w eights using the Dirichlet distribution. Th us, the priors encourage no de lev el sparsit y , as well as competition among the w eights mapping in to the same node. This leads to a more interpretable net work mo del, that can b e pruned extensively while main taining predictive performance. 24 5.0 1.0 0.5 0.1 0.05 0.01 / 0.09 0.16 0.35 0.37 0.18 0.29 0.48 0.76 0.22 0.34 0.55 0.79 0.37 0.49 0.66 0.84 0.44 0.55 0.68 0.85 0.60 0.66 0.75 0.88 Gauss / 0.08 0.12 0.19 0.22 0.18 0.24 0.34 0.55 0.22 0.30 0.39 0.61 0.38 0.45 0.53 0.72 0.47 0.52 0.59 0.77 0.64 0.67 0.71 0.85 RHS 0.01 0.05 0.1 0.25 5.0 1.0 0.5 0.1 0.05 0.01 / 0.12 0.16 0.24 0.29 0.24 0.32 0.47 0.69 0.31 0.40 0.53 0.73 0.47 0.55 0.62 0.79 0.56 0.63 0.69 0.82 0.75 0.78 0.82 0.87 DHS 0.01 0.05 0.1 0.25 / 0.05 0.06 0.08 0.12 0.16 0.19 0.24 0.44 0.21 0.24 0.30 0.51 0.38 0.41 0.50 0.66 0.48 0.52 0.59 0.74 0.75 0.77 0.79 0.84 DST 0.0 0.2 0.4 0.6 0.8 1.0 p 1 S o f t m a x S h i f t p r o b a b i l i t y p 1 Mo del S P U Gaussian 0.583 0.270 0.147 RHS 0.583 0.395 0.022 DHS 0.627 0.340 0.033 DST 0.761 0.211 0.029 Figure 10: Left: Robustness of the softmax probabilities in the classification on the breastcancer dataset. The x-axis displa ys the disturbance ε , and the y-axis displays the fraction δ/ε . Righ t: F ractions of safe (S), partially safe (P), and unsafe (U) outcomes from the M = 4000 samples, defined in terms of the probabilit y of adv ersarial label c hange p 2 , on the breast cancer dataset. W e first analyzed the dep endence structure induced among the v ariance com- p onen ts, sho wing that the sign of the co v ariance b et ween v ariance terms is gov erned b y dimensionality , geometry , and the tail behavior of the group-sp ecific prior. Sec- ondly , the marginal shrink age imposed was theoretically dev elop ed for linear re- gression mo dels, b efore lifting the concepts to a single hidden la yer neural net work. Then, a comprehensive empirical analysis of how the mo dels perform in practice w as carried out. A linear regression example serv ed as preliminary results, b efore BNNs w ere equipped with DSM priors. The experiments with the neural netw orks on b oth simulated and real datasets sho w that the DSM priors ha v e attractiv e prop erties. They express structured represen tations, allowing the net work to b e sparsified and sparsified to a greater exten t than competing priors. Compared to Gaussian and regularized horsesho e priors, the DSM priors achiev e comparable or b etter predictiv e p erformance with far few er effectiv e parameters, they show sup e- rior performance at high sparsity levels, and they remain relativ ely stable under adv ersarial p erturbations such as FGSM attacks. Imp ortantly , their performance is particularly strong in small to mo derate data regimes, a setting where Bay esian mac hine learning is especially beneficial due to its abilit y to pro vide calibrated uncertain ty estimates and incorp orate domain kno wledge. By concen trating prior probabilit y mass on a small subset of the w eights, the DSM priors enable netw orks that are somewhat in terpretable and offer a form of implicit feature selection in the input to hidden lay er connections. The DSM priors are marginally equiv alen t to placing indep enden t Beta distri- butions on the individual w eights. This b egs the question of ho w such a Beta prior 25 w ould perform compared to the Dirichlet-based mo dels. Our inv estigations found that the predictiv e p erformances are almost identical, and that the main differences can be seen in the num b er of effective parameters and when pruning the models. The Dirichlet mo dels use less parameters, and can b e pruned to the same, or to a larger, degree. Details regarding this inv estigation can b e found in Section 4 of the supplemen tary material 7 . Con vergence of MCMC samplers in Bay esian neural net works is well kno wn to b e c hallenging due to m ultimo dality and parameter non-iden tifiability . In Section 4 of the supplementary material, we presen t and discuss con v ergence diagnostics for the netw ork mo dels considered in this work. Man y asp ects of the DSM priors hav e not yet b een inv estigated, but this pre- liminary w ork op ens up a lot of p ossible pathw ays for further developmen t. One asp ect of particular interest is to study the b ehavior of heavy-tailed priors as the net work size increases, esp ecially in highly ov erparameterized regimes that are in- creasingly common in mo dern neural net work practice. Exploring such settings may require inference tec hniques b eyond standard HMC or substan tially increased com- putational resources, but recen t metho dological adv ances make this direction b oth feasible and relev an t. Another p ossibilit y , whic h could b e pursued indep endently or in com bination with the ab ov e, is to explore richer dep endence structures within the prior. Imp osing stronger structural constraints may lead to more efficient rep- resen tations, p oten tially reducing computational cost while also yielding a clearer picture of how different parts of the netw ork contribute to the final prediction. F unding This work was supported b y the Research Council of Norw ay through its Centre of Excellence Integreat – The Norwegian Centre for Kno wledge-driven Mac hine Learning, pro ject n umber 332645. 26 References Milton Abramo witz and Irene A. Stegun, editors. Handb o ok of Mathematic al F unc- tions with F ormulas, Gr aphs, and Mathematic al T ables , v olume 55 of Applie d Mathematics Series . U.S. Gov ernment Printing Office, W ashington, D.C., June 1964. T enth prin ting, December 1972, with corrections. George E. Andrews, Ric hard Askey , and Ranjan Roy . Sp e cial F unctions . Cam bridge Univ ersity Press, 1999. July an Arbel, K onstantinos Pitas, Mariia Vladimirov a, and Vincent F ortuin. A primer on ba yesian neural netw orks: Review and debates, 2023. URL http: //arxiv.org/abs/2309.16314 . Anirban Bhattac harya, Debdeep Pati, Natesh S. Pillai, and Da vid B. Dunson. Diric hlet–laplace priors for optimal shrink age. Journal of the A meric an Statistic al Asso ciation , 110(512):1479–1490, 2015. ISSN 0162-1459, 1537-274X. doi: 10. 1080/01621459.2014.960967. URL https://www.tandfonline.com/doi/full/ 10.1080/01621459.2014.960967 . Christopher M. Bishop. Neur al Networks for Pattern R e c o gnition . Oxford Uni- v ersity Press, Oxford, UK, 1995. URL http://users.cs.cf.ac.uk/Dave. Marshall/NeuralNet/ . Shahin Boluki, Randy Ardywib o wo, Siamak Zamani Dadaneh, Mingyuan Zhou, and Xiaoning Qian. Learnable b ernoulli drop out for bay esian deep learning. In Pr o c e e dings of the Twenty Thir d International Confer enc e on Artificial Intel li- genc e and Statistics , volume 108 of Pr o c e e dings of Machine L e arning R ese ar ch , pages 3905–3916. PMLR, 2020. URL https://proceedings.mlr.press/v108/ boluki20a.html . Luca Cardelli, Marta Kwiatk o wsk a, Luca Lauren ti, Nicola Paoletti, Andrea Patane, and Matthew Wick er. Statistical guaran tees for the robustness of bay esian neural net works, 2019. URL . Carlos M. Carv alho, Nic holas G. Polson, and James G. Scott. Handling sparsit y via the horsesho e. In Pr o c e e dings of the 12th International Confer enc e on A r- tificial Intel ligenc e and Statistics , v olume 5 of Pr o c e e dings of Machine L e arning R ese ar ch , pages 73–80. PMLR, 2009. URL https://proceedings.mlr.press/ v5/carvalho09a.html . Rohitash Chandra and Joshua Simmons. Ba yesian neural net works via MCMC: A p ython-based tutorial. IEEE A c c ess , 12:70519–70549, 2024. ISSN 2169-3536. doi: 10.1109/A CCESS.2024.3401234. URL https://ieeexplore.ieee.org/ document/10530647/ . 27 Vincen t F ortuin. Priors in bay esian deep learning: A review. International Statisti- c al R eview , 90(3):563–591, 2022. doi: h ttps://doi.org/10.1111/insr.12502. URL https://onlinelibrary.wiley.com/doi/abs/10.1111/insr.12502 . Vincen t F ortuin, A drià Garriga-Alonso, Sebastian W. Ob er, Florian W enzel, Gun- nar Rätsch, Richard E. T urner, Mark v an der Wilk, and Laurence Aitc hison. Ba yesian neural netw ork priors revisited. arXiv , March 2022. doi: 10.48550/ arXiv.2102.06571. URL https://doi.org/10.48550/arXiv.2102.06571 . Jonathan F rankle and Michael Carbin. The lottery tick et h yp othesis: Finding sparse, trainable neural netw orks, 2019. URL 03635 . Jerome H F riedman. Multiv ariate adaptiv e regression splines. The annals of statis- tics , 19(1):1–67, 1991. Y arin Gal and Zoubin Ghahramani. Drop out as a ba yesian approximation: Rep- resen ting mo del uncertaint y in deep learning. In Maria Florina Balcan and Kil- ian Q. W ein b erger, editors, Pr o c e e dings of The 33r d International Confer enc e on Machine L e arning , volume 48 of Pr o c e e dings of Machine L e arning R ese ar ch , pages 1050–1059, New Y ork, New Y ork, USA, 20–22 Jun 2016. PMLR. URL https://proceedings.mlr.press/v48/gal16.html . Soum ya Ghosh, Jia yu Y ao, and Finale Doshi-V elez. Mo del selection in bay esian neural netw orks via horsesho e priors. Journal of Machine L e arning R ese ar ch , 20 (182):1–46, 2019. Jiri Hron, Alexander G. de G. Matthews, and Zoubin Ghahramani. V ariational ba yesian dropout: Pitfalls and fixes, 2018. URL https://proceedings.mlr. press/v80/hron18a.html . Aliaksandr Hubin and Geir Storvik. V ariational inference for bay esian neural net- w orks under mo del and parameter uncertain ty . arXiv , May 2023. doi: 10.48550/ arXiv.2305.00934. URL https://doi.org/10.48550/arXiv.2305.00934 . Christos Louizos, Karen Ullrich, and Max W elling. Ba yesian compression for deep learning. In A dvanc es in Neur al Information Pr o c essing Systems , v olume 30, pages 3288–3298, 2017. URL https://proceedings.neurips.cc/paper_ files/paper/2017/file/69d1fc78dbda242c43ad6590368912d4- Paper.pdf . Scott M. Lundberg and Su-In Lee. A unified approac h to interpreting model predic- tions. In Pr o c e e dings of the 31st International Confer enc e on Neur al Information Pr o c essing Systems , NIPS’17, page 4768–4777, Red Ho ok, NY, USA, 2017. Cur- ran Asso ciates Inc. ISBN 9781510860964. Lundb erg, Scott M. and Lee, Su-In. shap.KernelExplainer — SHAP . The SHAP Dev elop ers, 2026. https://shap.readthedocs.io/en/latest/generated/ shap.KernelExplainer.html . 28 Da vid J.C. MacKa y . Bayesian Metho ds for A daptive Mo dels . PhD thesis, Cal- ifornia Institute of T echnology , 1992. URL https://resolver.caltech.edu/ CaltechETD:etd- 11202008- 153444 . Martin Marek, Bro oks Paige, and Pa v el Izmailov. Can a confiden t prior replace a cold p osterior?, 2024. URL . T oby J. Mitchell and John J. Beauc hamp. Ba yesian v ariable selection in linear regression. Journal of the A meric an Statistic al Asso ciation , 83(404):1023–1032, 1988. doi: 10.1080/01 621459.1988.10478694. URL https://doi.org/10.1080/ 01621459.1988.10478694 . Dmitry Molchano v, Arsenii Ash ukha, and Dmitry V etro v. V ariational drop out spar- sifies deep neural netw orks. In Doina Precup and Y ee Wh ye T eh, editors, Pr o- c e e dings of the 34th International Confer enc e on Machine L e arning , v olume 70 of Pr o c e e dings of Machine L e arning R ese ar ch , pages 2498–2507. PMLR, 06–11 Aug 2017. URL https://proceedings.mlr.press/v70/molchanov17a.html . Mic hael Nagel, Luk as Fischer, Tim P awlo wski, Thomas Augustin, and Augustin Kela v a. An alternative prior for estimation in high-dimensional settings. Struc- tur al Equation Mo deling: A Multidisciplinary Journal , 31(6):939–951, Nov ember 2024. doi: 10.1080/10705511.2023.2281279. URL https://doi.org/10.1080/ 10705511.2023.2281279 . Eric Nalisnic k, Jonathan Gordon, and Jose Miguel Hernandez-Lobato. Predic- tiv e complexity priors. In Arindam Banerjee and Kenji F ukumizu, editors, Pr o c e e dings of The 24th International Confer enc e on Artificial Intel ligenc e and Statistics , volume 130 of Pr o c e e dings of Machine L e arning R ese ar ch , pages 694– 702. PMLR, 13–15 Apr 2021. URL https://proceedings.mlr.press/v130/ nalisnick21a.html . W arwick Nash, T racy Sellers, Simon T alb ot, Andrew Ca wthorn, and W es F ord. Abalone. UCI Mac hine Learning Repository , 1994. DOI: h ttps://doi.org/10.24432/C55C7W. F rank W. J. Olv er, Daniel W. Lozier, Ronald F. Boisvert, and Charles W. Clark, editors. NIST Handb o ok of Mathematic al F unctions . Cam bridge Univ ersity Press, New Y ork, NY, 2010. ISBN 978-0-521-19225-5. URL http://dlmf.nist.gov/ . P ap erback ISBN: 978-0-521-14063-8. Juho Piironen and Aki V ehtari. Sparsit y information and regularization in the horsesho e and other shrink age priors. Ele ctr onic Journal of Statistics , 11(2): 5018–5051, 2017. doi: 10.1214/17- EJS1337SI. URL https://doi.org/10.1214/ 17- EJS1337SI . Nic holas G. P olson and James G. Scott. Shrink globally , act lo cally: Sparse ba yesian regularization and prediction. In José M. Bernardo, M. J. Bay arri, 29 James O. Berger, A. P . Dawid, Da vid Heck erman, Adrian F. M. Smith, and Mik e W est, editors, Bayesian Statistics 9 , page 0. Oxford Universit y Press, 2011. doi: 10.1093/acprof:oso/9780199694587.003.0017. URL https://doi.org/10. 1093/acprof:oso/9780199694587.003.0017 . Estev ão Prado, Rafael Moral, and Andrew P arnell. Bay esian additive regression trees with mo del trees. Statistics and Computing , 31, 05 2021. doi: 10.1007/ s11222- 021- 09997- 3. Daniel P . Simpson, Hå v ard Rue, Andrea Riebler, Thiago G. Martins, and Sigrunn H. Sørby e. Penalising mo del comp onen t complexity: A principled, practical approach to constructing priors. Statistic al Sci- enc e , 32(1):1–28, 2017. doi: 10.1214/16- STS576. URL https:// projecteuclid.org/journals/statistical- science/volume- 32/issue- 1/ Penalising- Model- Component- Complexity- - A- Principled- Practical- Approach- to/ 10.1214/16- STS576.full . Ba-Hien T ran, Simone Rossi, Dimitrios Milios, and Maurizio Filipp one. All you need is a goo d functional prior for ba yesian deep learning. J. Mach. L e arn. R es. , 23(1), January 2022. ISSN 1532-4435. Stéphanie v an der Pas, Botond Szab ó, and Aad v an der V aart. Adaptiv e poste- rior contraction rates for the horsesho e. Ele ctr onic Journal of Statistics , 11(2): 3196 – 3225, 2017. doi: 10.1214/17- EJS1316. URL https://doi.org/10.1214/ 17- EJS1316 . Mariia Vladimirov a, Jak ob V erbeek, Pablo Mesejo, and Julyan Arb el. Under- standing priors in ba yesian neural netw orks at the unit level. In Pr o c e e dings of the 36th International Confer enc e on Machine L e arning , pages 6458–6467. PMLR, 2019. URL https://proceedings.mlr.press/v97/vladimirova19a. html . ISSN: 2640-3498. Florian W enzel, Kevin Roth, Bastiaan S. V eeling, Jakub Światk owski, Linh T ran, Stephan Mandt, Jasper Snoek, Tim Salimans, Rodolphe Jenatton, and Sebastian No wozin. Ho w go o d is the ba yes p osterior in deep neural netw orks really?, 2020a. URL . Florian W enzel, Kevin Roth, Bastiaan S. V eeling, Jakub Świątk owski, Linh T ran, Stephan Mandt, Jasper Snoek, Tim Salimans, Rodolphe Jenatton, and Sebastian No wozin. How go od is the bay es p osterior in deep neural net works really?, 2020b. URL https://proceedings.mlr.press/v119/wenzel20a.html . William W olberg, Olvi Mangasarian, Nick Street, and W. Street. Breast Can- cer Wisconsin (Diagnostic). UCI Mac hine Learning Repository , 1993. DOI: h ttps://doi.org/10.24432/C5DW2B. Eric Y anchenk o, Ho ward D. Bondell, and Brian J. Reic h. The r2d2 prior for gener- alized linear mixed models. The Americ an Statistician , 79(1):40–49, 2025. doi: 30 10.1080/00031305.2024.2352010. URL https://doi.org/10.1080/00031305. 2024.2352010 . Xiao yong Y uan, P an He, Qile Zh u, and Xiaolin Li. Adv ersarial examples: At- tac ks and defenses for deep learning. IEEE tr ansactions on neur al networks and le arning systems , 30(9):2805–2824, 2019. 31 7 Supplemen tary Material The supplementary material is included b elo w, with fiv e sections: • Supplementary A: Dep endence structure deriv ations. • Supplementary B: Pro ofs of theoretical results. • Supplementary C: Details on the linearization of the BNN. • Supplementary D: A dditional results and exp eriments, exp erimen tal details and a conv ergence assessment. • Supplementary E: Stan code example of a DSM prior, and link to full co de on GitHub. Supplemen tary A: Dep endence structure deriv ations W e here give deriv ations of the dependence structure of the DSM priors. Co v ariance of v ariance terms. Let i = j and consider X j k = λ j ξ j k , X j l = λ j ξ j l , k = l ξ j = ( ξ j 1 , ..., ξ j p ) ∼ Diric hlet( α, . . . , α ) , λ j ⊥ ξ j , with λ j > 0 . By indep endence, we hav e Co v ( X j k , X j l ) = E [ λ 2 j ] E [ ξ j k ξ j l ] − E [ λ j ] 2 E [ ξ j k ] E [ ξ j l ] = E [ λ 2 j ] (Cov( ξ j k , ξ j l ) + E [ ξ j k ] E [ ξ j l ]) − E [ λ j ] 2 p 2 = E [ λ 2 j ] − 1 p 2 ( pα + 1) + 1 p 2 − E [ λ j ] 2 p 2 = pα p 2 ( pα + 1) (V ar( λ j ) + E [ λ j ] 2 ) − E [ λ j ] 2 p 2 = 1 p 2 ( pα + 1) pα V ar( λ j ) − E [ λ j ] 2 Since no prop erties of the distribution of λ j is used in the pro of, the expressions ab o ve are also v alid if λ j is replaced by the regularized version ˜ λ j . Supplemen tary B: Lemmas and pro ofs of theorems In this section, w e pro ve the theorems stated in the main text, which includes defin- ing and pro ving three lemmas and use of some auxillary Pochhammer identities. 32 Lemma 7.1 (Exp ectation of transformed Beta v ariable I) . Consider the Dirichlet c omp onent with mar ginal ξ j ∼ Beta( α, ( p − 1) α ) and the tr ansformation ξ j 7→ ξ k j (1+ sξ ) a , wher e s > − 1 is a c onstant indep endent of ξ j and a ∈ C . The exp e ctation of this tr ansform is then E ξ j " ξ k j (1 + sξ j ) a # = ( α ) k ( pα ) k ∞ X n =0 ( a ) n ( α + k ) n ( pα + k ) n ( − s ) n n ! = ( α ) k ( pα ) k 2 F 1 a, α + k pα + k ; − s wher e ( x ) n = Γ( x + n ) Γ( x ) denotes the Po chhammer symb ol [ Abr amowitz and Ste gun , 1964 ], and p F q ( a 1 , · · · , a p ; b 1 , · · · , b q ; z ) is the gener alize d hyp er ge ometric function as define d in [ Olver et al. , 2010 ]. Pro of of Lemma 6.1 Euler’s integral representation of the hypergeometric function 2 F 1 is B ( b, c − b ) 2 F 1 a, b c ; z = Z 1 0 t b − 1 (1 − t ) c − b − 1 (1 − z t ) a dt where B ( · , · ) denotes the Beta function. The minimal conditions for the integral represen tation of the hypergeometric function is that ℜ ( c ) > ℜ ( b ) > 0 , | arg (1 − z ) | < π where the latter is satisfied for real z when z / ∈ [1 , ∞ ) [ Andrews et al. , 1999 ]. No w, let ξ ∼ Beta( α, β ) and consider E ξ ξ k (1 + sξ ) a = 1 B ( α, β ) Z 1 0 ξ k + α − 1 (1 − ξ ) β − 1 (1 + sξ ) a dξ = 1 B ( α, β ) B ( α + k , β ) 2 F 1 a, α + k β + α + k ; − s = ( α ) k ( α + β ) k 2 F 1 a, α + k β + α + k ; − s where ( x ) n denotes the Pochhammer symbol. W e now c heck our conditions. With b = α + k and c = β + α + k it is clear that ℜ ( c ) > ℜ ( b ) > 0 as long as k > − α . F urthermore, if z / ∈ [1 , ∞ ) , then − z = s / ∈ ( −∞ , − 1] . ■ Lemma 7.2 (Expectation of transformed Beta v ariable II) . L et ξ j ∼ Beta( α, β ) , and let k , s, a b e as in L emma 7.1 . The exp e ctation of the tr ansform ξ j 7→ ξ k j (1+ s √ ξ ) a is E ξ ξ k (1 + s √ ξ ) a = ( α ) k ( α + β ) k " 3 F 2 a 2 , a +1 2 , α + k 1 2 , α + β + k ; s 2 − sa ( α + k ) 1 / 2 ( α + β + k ) 1 / 2 3 F 2 a +1 2 , a +2 2 , α + k + 1 2 3 2 , α + β + k + 1 2 ; s 2 # , 33 and for the sp e cial c ase β = ( p − 1) α, k = 0 , a = 1 we obtain for the tr ansform ξ j 7→ 1 1+ s √ ξ j that E ξ j " 1 1 + s p ξ j # = 2 F 1 1 , α pα ; s 2 − s ( α ) 1 / 2 ( pα ) 1 / 2 2 F 1 1 , α + 1 2 pα + 1 2 ; s 2 Auxiliary P o c hhammer iden tities T o ease the deriv ations in the pro of of Lemma 7.2 , w e state the following Pochham- mer identites ( 1 2 ) m ( 3 2 ) m = 1 2 ( 1 2 + 1) · · · ( 1 2 + m − 1) 3 2 ( 3 2 + 1) · · · ( 3 2 + m − 1) = 1 2 ( 3 2 + m − 1) = 1 2 m + 1 (23) (2 m )! = Γ(2 m + 1) = 2 2 m Γ( m + 1 2 )Γ( m + 1) √ π = 2 2 m 1 2 m √ π m ! √ π = 2 2 m m ! 1 2 m (24) ( a ) 2 m = 2 2 m a 2 m a + 1 2 m ( a ) 2 m +1 = a 2 2 m a + 1 2 m a + 2 2 m (25) ( a + b ) c + d = Γ( a + b + c + d ) Γ( a + b ) = Γ( a + b + c ) Γ( a + b ) Γ( a + b + c + d ) Γ( a + b + c ) = ( a + b ) c ( a + b + c ) d (26) a 2 m +1 = a 2 a 2 + 1 a 2 + 2 · · · a 2 + m = a 2 a + 2 2 m (27) Pro of of Lemma 6.2 Let ξ ∼ Beta( α, β ) , α, β > 0 . Let a ∈ N , a ≥ 1 , k > − α , then for an y real s > − 1 , w e prop ose that E ξ ξ k (1 + s √ ξ ) a = ( α ) k ( α + β ) k " 3 F 2 a 2 , a +1 2 , α + k 1 2 , α + β + k ; s 2 − sa ( α + k ) 1 / 2 ( α + β + k ) 1 / 2 3 F 2 a +1 2 , a +2 2 , α + k + 1 2 3 2 , α + β + k + 1 2 ; s 2 # where 3 F 2 is defined, following Andrews et al. [ 1999 ], as 3 F 2 a 1 , a 2 , a 3 b 1 , b 2 ; t = ∞ X n =0 ( a 1 ) n ( a 2 ) n ( a 3 ) n ( b 1 ) n ( b 2 ) n t n n ! . 34 T o prov e this prop osition, define F ( s ) : = E ξ ξ k (1 + s √ ξ ) a = 1 B ( α, β ) Z 1 0 1 (1 + s √ ξ ) a ξ k + α − 1 (1 − ξ ) β − 1 dξ H ( s ) : = ( α ) k ( α + β ) k " 3 F 2 ( . . . ; s 2 ) − sa ( α + k ) 1 / 2 ( α + β + k ) 1 / 2 3 F 2 ( . . . ; s 2 ) # Consider the case of | s | < 1 and the binomial series 1 + s p ξ − a = ∞ X n =0 − a n s n ξ n/ 2 = ∞ X n =0 ( a ) n n ! ( − s ) n ξ n/ 2 whic h is absolutely conv ergen t since ξ ∈ [0 , 1] . This gives F ( s ) = 1 B ( α, β ) Z 1 0 ∞ X n =0 ( a ) n n ! ( − s ) n ξ n/ 2 ξ k + α − 1 (1 − ξ ) β − 1 dξ No w define | f n ( ξ ) | := | ( a ) n n ! ( − s ) n ξ n/ 2 ξ k + α − 1 (1 − ξ ) β − 1 | and develop | f n | ≤ ( a ) n n ! | s | n ξ n/ 2 ξ k + α − 1 (1 − ξ ) β − 1 ≤ ( a ) n n ! | s | n ξ k + α − 1 (1 − ξ ) β − 1 suc h that Z 1 0 ∞ X n =0 | f n | ≤ Z 1 0 ∞ X n =0 ( a ) n n ! | s | n ξ k + α − 1 (1 − ξ ) β − 1 dξ = Z 1 0 ξ k + α − 1 (1 − ξ ) β − 1 ∞ X n =0 ( a ) n n ! | s | n dξ No w define S : = ∞ X n =0 ( a ) n n ! | s | n . Since a ∈ N , a ≥ 1 w e hav e ( a ) n n ! = Γ( a + n ) n !Γ( a ) = ( a + n − 1)! n !( a − 1)! = a + n − 1 n hence S = ∞ X n =0 a + n − 1 n | s | n , whic h is a negative binomial series, whic h for | s | < 1 satisfies S = ∞ X n =0 a + n − 1 n | s | n = (1 − | s | ) − a < ∞ . 35 Consequen tly , Z 1 0 ∞ X n =0 | f n | ≤ S Z 1 0 ξ k + α − 1 (1 − ξ ) β − 1 dξ < ∞ , and P ∞ n =0 | f n | ∈ L 1 (0 , 1) is absolutely in tegrable on (0 , 1) . This inv okes the F ubini- T onelli theorem, so a sw ap of the in tegral and summation is justified, yielding F ( s ) = 1 B ( α, β ) Z 1 0 ∞ X n =0 ( a ) n n ! ( − s ) n ξ n/ 2 ξ k + α − 1 (1 − ξ ) β − 1 dξ = 1 B ( α, β ) ∞ X n =0 ( a ) n n ! ( − s ) n Z 1 0 ξ k + α + n/ 2 − 1 (1 − ξ ) β − 1 dξ = 1 B ( α, β ) ∞ X n =0 ( a ) n n ! ( − s ) n B ( k + α + n/ 2 , β ) = ∞ X n =0 ( a ) n n ! ( − s ) n B ( k + α + n/ 2 , β ) B ( α, β ) = ∞ X n =0 ( a ) n ( α ) k + n/ 2 ( α + β ) k + n/ 2 ( − s ) n n ! = ( α ) k ( α + β ) k ∞ X n =0 ( a ) n ( α + k ) n/ 2 ( α + β + k ) n/ 2 ( − s ) n n ! T o ev aluate this expression, we wan t to split the series in to its even and odd parts. Since this is a regrouping of terms, we m ust first verify that the series is absolutely con vergen t (for | s | < 1 ) before splitting. Consider the representation F ( s ) = 1 B ( α, β ) ∞ X n =0 ( a ) n n ! ( − s ) n B k + α + n 2 , β . Using the integral form of the Beta function, B ( x, β ) = Z 1 0 t x − 1 (1 − t ) β − 1 dt, define, for fixed β > 0 , g x ( t ) := t x − 1 (1 − t ) β − 1 , t ∈ (0 , 1) . If x 2 > x 1 > 0 , then for all t ∈ (0 , 1) we ha ve t x 2 − 1 ≤ t x 1 − 1 , hence g x 2 ( t ) ≤ g x 1 ( t ) . Since g x ( t ) ≥ 0 and measurable, monotonicit y of the Leb esgue integral gives B ( x 2 , β ) = Z 1 0 g x 2 ( t ) dt ≤ Z 1 0 g x 1 ( t ) dt = B ( x 1 , β ) . 36 Th us x 7→ B ( x, β ) is decreasing on (0 , ∞ ) . In particular, since k + α > 0 , B k + α + n 2 , β ≤ B ( k + α, β ) for all n ≥ 0 . Therefore, ∞ X n =0 ( a ) n n ! ( − s ) n B ( k + α + n/ 2 , β ) B ( α, β ) ≤ C ∞ X n =0 ( a ) n n ! | s | n , C := B ( k + α, β ) B ( α, β ) . F or | s | < 1 , the right-hand side equals C (1 − | s | ) − a < ∞ , and hence the series is absolutely con vergen t. Consequently , we ma y regroup terms and split the series in to its even and o dd parts. Note the auxiliary identities of Supplementary 7 and first consider n = 2 m ∞ X n =0 ( a ) n ( α + k ) n/ 2 ( α + β + k ) n/ 2 ( − s ) n n ! = ∞ X m =0 ( a ) 2 m ( α + k ) m ( α + β + k ) m ( − s 2 ) m (2 m )! 24 , 25 = ∞ X m =0 2 2 m a 2 m a + 1 2 m ( α + k ) m ( α + β + k ) m 1 1 2 m 2 2 m ( − s 2 ) m m ! = 3 F 2 a 2 , a +1 2 , α + k 1 2 , α + β + k ; s 2 . Then consider n = 2 m + 1 ∞ X n =0 ( a ) n ( α + k ) n/ 2 ( α + β + k ) n/ 2 ( − s ) n n ! = ∞ X m =0 ( a ) 2 m +1 ( α + k ) m +1 / 2 ( α + β + k ) m +1 / 2 ( − s ) 2 m +1 (2 m + 1)! ( 24 ) , ( 25 ) , ( 26 ) = − s ( α + k ) 1 / 2 ( α + β + k ) 1 / 2 ∞ X m =0 2 2 m +1 a 2 m +1 a +1 2 m ( α + k + 1 2 ) m ( α + β + k + 1 2 ) m ( s 2 ) m (2 m + 1)(2 m )! ( 23 ) , ( 27 ) = − s ( α + k ) 1 / 2 ( α + β + k ) 1 / 2 ∞ X m =0 2 a 2 a +2 2 m a +1 2 m ( α + k + 1 2 ) m ( α + β + k + 1 2 ) m ( s 2 ) m (2 m + 1) 1 2 m m ! ( 24 ) = − sa ( α + k ) 1 / 2 ( α + β + k ) 1 / 2 ∞ X m =0 a +1 2 m a +2 2 m ( α + k + 1 2 ) m ( α + β + k + 1 2 ) m ( s 2 ) m 3 2 m m ! = − sa ( α + k ) 1 / 2 ( α + β + k ) 1 / 2 3 F 2 a +1 2 , a +2 2 , α + k + 1 2 3 2 , α + β + k + 1 2 ; s 2 and then we finally arrive at 37 F ( s ) = E ξ ξ k (1 + s √ ξ ) a = ( α ) k ( α + β ) k " 3 F 2 a 2 , a +1 2 , α + k 1 2 , α + β + k ; s 2 − sa ( α + k ) 1 / 2 ( α + β + k ) 1 / 2 3 F 2 a +1 2 , a +2 2 , α + k + 1 2 3 2 , α + β + k + 1 2 ; s 2 # = H ( s ) . No w, we ha ve shown that on the domain s ∈ S = ( − 1 , 1) , F ( s ) = H ( s ) . More- o ver, F is real analytic on ( − 1 , ∞ ) , since for every s 0 > − 1 , the integrand admits a p o wer series expansion in s − s 0 with a p ositive radius of conv ergence, meaning that it can be integrated term b y term to giv e a lo cally con vergen t pow er series represen tation of F ( s ) . The h yp ergeometric function H ( s ) is real analytic by defi- nition. As both F , H are analytic, the domain D = ( − 1 , ∞ ) is op en and connected with S ⊆ D and S has accumulation p oints in D , the identit y theorem allows us to analytically contin ue into domain D suc h that F ( s ) = H ( s ) on ( − 1 , ∞ ) . Thus, the exp ectation holds for all s > − 1 . F or the case of k = 0 , a = 1 , the expectation reduces b ecause of equal factors in the hypergeometric function, and by recalling that the marginal was parametrized b y ξ ∼ Beta( α, ( p − 1) α ) we obtain the expression in Lemma 7.2 : E ξ j " ξ 0 (1 + s p ξ j ) 1 # = E ξ j " 1 1 + s p ξ j # = 3 F 2 1 2 , 1 , α 1 2 , α + β ; s 2 − s ( α ) 1 / 2 ( α + β ) 1 / 2 3 F 2 1 , 3 2 , α + 1 2 3 2 , α + β + 1 2 ; s 2 = 2 F 1 1 , α pα ; s 2 − s ( α ) 1 / 2 ( pα ) 1 / 2 2 F 1 1 , α + 1 2 pα + 1 2 ; s 2 ■ Pro of of Theorem 4.1 for ν = 1 Let ξ j ∼ Beta( α, ( p − 1) α ) and derive the distribution using Lemma 7.1 with k = 1 2 , a = 1 38 p ( κ j | τ , σ ) = Z 1 0 p ( κ j | τ , σ, ξ j ) p ( ξ j ) dξ j = Z 1 0 1 π 1 √ κ j p 1 − κ j z j p ξ j ( ξ j z 2 j − 1) κ j + 1 p ( ξ j ) dξ j = Z 1 0 1 π z j √ κ j p 1 − κ j ξ 1 2 j (1 − κ j )(1 + κξ j z 2 j 1 − κ j ) p ( ξ j ) dξ j = 1 π z j (1 − κ j ) √ κ j p 1 − κ j Z 1 0 ξ 1 2 j (1 + sξ j ) p ( ξ j ) dξ j = 1 π z j (1 − κ j ) √ κ j p 1 − κ j E ξ j ξ 1 2 j 1 + sξ j = 1 π z j (1 − κ j ) √ κ j p 1 − κ j ( α ) 1 / 2 ( pα ) 1 / 2 2 F 1 1 , α + 1 2 pα + 1 2 ; − s where s = κ j z 2 j 1 − κ j . The exp ectation can b e derived, using Lemma 7.2 , as E ξ j [ κ j | τ , σ ] = E ξ j E λ j [ κ j | τ , σ, ξ j ] = E ξ j 1 1 + z j p ξ j = 2 F 1 1 , α pα ; z 2 j − z j ( α ) 1 / 2 ( pα ) 1 / 2 2 F 1 1 , α + 1 2 pα + 1 2 ; z 2 j 39 and the v ariance, again using Lemma 7.2 , V ar ξ j [ κ j | τ , σ ] = E ξ j [ V ar λ ( κ j ) | τ , σ, ξ j ] + V ar ξ j ( E λ [ κ j | τ , σ, ξ j ]) = E ξ j z j p ξ j 2(1 + z j p ξ j ) 2 + V ar ξ j 1 1 + z j p ξ j ! = z j 2 E ξ j p ξ j (1 + z j p ξ j ) 2 + E ξ j 1 (1 + z j p ξ j ) 2 − E ξ j 1 1 + z j p ξ j ! 2 = z j 2 ( α ) 1 / 2 ( pα ) 1 / 2 " 3 F 2 1 , 3 2 , α + 1 2 1 2 , pα + 1 2 ; z 2 j − 2 z j ( α + 1 2 ) 1 / 2 ( pα + 1 2 ) 1 / 2 2 F 1 2 , α + 1 pα + 1 ; z 2 j # + 3 F 2 1 , 3 2 , α 1 2 , pα ; z 2 j − 2 z j ( α + 1 2 ) 1 / 2 ( pα + 1 2 ) 1 / 2 2 F 1 2 , α + 1 2 pα + 1 2 ; z 2 j − " 2 F 1 1 , α pα ; z 2 j − z j ( α ) 1 / 2 ( pα ) 1 / 2 2 F 1 1 , α + 1 2 pα + 1 2 ; z 2 j # 2 ■ Lemma 7.3 (A priori distribution of shrink age factor for student T lo cal scale) . L et κ = 1 1+ z 2 λ 2 in which z is assume d fixe d, and λ fol low a p ositively trunc ate d Student T distribution with ν de gr e es of fr e e dom. Then κ fol lows the distribution p κ ( κ | z ) = Γ( ν +1 2 ) √ ν π Γ( ν 2 ) 1 (1 − κ ) ν 2 +1 ν ν +1 2 κ ν 2 − 1 z ν 1 + κν z 2 1 − κ − ν +1 2 Pro of of Lemma 6.3 Let κ = 1 1+ z 2 λ 2 in whic h s is assumed fixed, and λ follow a half Student T dis- tribution with ν degrees of freedom (half Cauch y coincides with ν = 1 ). W e thus ha ve p λ ( λ ) = 2Γ( ν +1 2 ) √ ν π Γ( ν 2 ) 1 + λ 2 ν − ν +1 2 , λ = 1 z r 1 − κ κ , dλ dκ = 1 2 z 1 κ 3 / 2 √ 1 − κ (28) whic h then means we obtain 40 p κ ( κ ) = p λ 1 z r 1 − κ κ ! dλ dκ = 2Γ( ν +1 2 ) √ ν π Γ( ν 2 ) 1 κ 3 / 2 √ 1 − κ 1 2 z 1 + 1 z q 1 − κ κ 2 ν − ν +1 2 = Γ( ν +1 2 ) √ ν π Γ( ν 2 ) 1 κ 3 / 2 √ 1 − κ 1 z 1 + 1 − κ ν z 2 κ − ν +1 2 = Γ( ν +1 2 ) √ ν π Γ( ν 2 ) 1 κ 3 / 2 √ 1 − κ 1 z ν z 2 κ + 1 − κ ν z 2 κ − ν +1 2 = Γ( ν +1 2 ) √ ν π Γ( ν 2 ) 1 κ 3 / 2 √ 1 − κ 1 z κ ( ν z 2 − 1) + 1 ν z 2 κ − ν +1 2 = Γ( ν +1 2 ) √ ν π Γ( ν 2 ) 1 κ 3 / 2 √ 1 − κ 1 z ν z 2 κ ν +1 2 κ ( ν z 2 − 1) + 1 − ν +1 2 = Γ( ν +1 2 ) √ ν π Γ( ν 2 ) 1 (1 − κ ) ν 2 +1 ν ν +1 2 z ν κ ν 2 − 1 1 + κν z 2 1 − κ − ν +1 2 As a sanity chec k, we insert ν = 1 to make sure w e agree with Piironen p κ ( κ ) = Γ(1) √ π Γ( 1 2 ) 1 + κz 2 1 − κ − 1 1 (1 − κ ) 1 2 +1 z κ 1 2 − 1 = z π 1 − κ ( κ ( z 2 − 1) + 1) − 1 1 (1 − κ ) 3 2 κ 1 2 = z π 1 ( κ ( z 2 − 1) + 1) 1 p κ (1 − κ ) whic h is exactly what Piironen and V ehtari [ 2017 ] has. Pro of of Theorem 4.1 for general ν The distribution of κ j , using Lemma 7.3 , can b e written as 41 p ( κ j | τ , σ ) = Z 1 0 p ( κ j | τ , σ, ξ j ) p ( ξ j ) dξ j = Z 1 0 Γ( ν +1 2 ) √ ν π Γ( ν 2 ) ν ν +1 2 z ν j κ ν 2 − 1 (1 − κ ) ν 2 +1 ξ ν / 2 j 1 + κν ξ j z 2 j 1 − κ ! − ν +1 2 p ( ξ j ) dξ j = ˜ C ( ν, z j ) κ ν 2 − 1 (1 − κ ) ν 2 +1 Z 1 0 ξ ν / 2 j 1 + κν ξ j z 2 j 1 − κ ! − ν +1 2 p ( ξ j ) dξ j = ˜ C ( ν, z j ) κ ν 2 − 1 (1 − κ ) ν 2 +1 Z 1 0 ξ ν / 2 j (1 + sξ j ) − ν +1 2 p ( ξ j ) dξ j = ˜ C ( ν, z j ) κ ν 2 − 1 (1 − κ ) ν 2 +1 E ξ j " ξ ν / 2 j (1 + sξ j ) ν +1 2 # where ˜ C ( ν, z j ) = Γ( ν +1 2 ) √ ν π Γ( ν 2 ) ν ν +1 2 z ν j s = κν z 2 j 1 − κ whic h by using Lemma 7.1 with k = ν / 2 , a = ν +1 2 yields p ( κ j | τ , σ ) = ˜ C ( ν, z j ) ( α ) ν / 2 ( pα ) ν / 2 κ ν 2 − 1 (1 − κ ) ν 2 +1 2 F 1 ν +1 2 , α + ν 2 pα + ν 2 ; − κν z 2 j 1 − κ ! . (29) Supplemen tary C: Linearization In this supplemen t we giv e the details underlying the linearized Gaussian mo del and p osterior for w 1 used in the article. Let X ∈ R n × p with ro ws x ⊤ i , and consider a single hidden lay er with w eights W 1 ∈ R H × p , biases b 1 ∈ R H , output weigh ts W L ∈ R 1 × H , and output bias b L . Define the hidden activ ations ϕ i = φ ( W 1 x i + b 1 ) ∈ R H , and collect them in the feature matrix Φ( w 1 , b 1 ) = ϕ ⊤ 1 . . . ϕ ⊤ n ∈ R n × H , 42 where w 1 = vec( W ⊤ 1 ) ∈ R pH and w L = vec( W ⊤ L ) ∈ R H . The netw ork output and observ ation model are f ( w 1 , b 1 , w L , b L ) = Φ( w 1 , b 1 ) w L + b L 1 n , y = f ( w 1 , b 1 , w L , b L ) + ε, ε ∼ N (0 , σ 2 I n ) . W e place a DSM prior on the input weigh ts and standard Gaussian priors on the remaining parameters w 1 ∼ N 0 , τ 2 Ψ , Ψ = diag( λ 2 1 ξ 1 , . . . , λ 2 pH ξ pH ) , b 1 ∼ N (0 , I H ) , w L ∼ N (0 , I H ) , b L ∼ N (0 , 1) , and linearize the netw ork around a reference p oin t ( w 1 , 0 , b 1 , 0 , w L, 0 , b L, 0 ) . W riting Φ 0 := Φ( w 1 , 0 , b 1 , 0 ) and defining the Jacobians J w = ∂ Φ( w 1 , b 1 ) w L ∂ w 1 ( w 1 , 0 , b 1 , 0 , w L, 0 ) ∈ R n × pH , J b = ∂ Φ( w 1 , b 1 ) w L ∂ b 1 ( w 1 , 0 , b 1 , 0 , w L, 0 ) ∈ R n × H , a first-order T aylor expansion yields Φ( w 1 , b 1 ) w L ≈ Φ 0 w L + J w ( w 1 − w 1 , 0 ) + J b ( b 1 − b 1 , 0 ) . Absorbing constants into the resp onse by letting y ∗ := y + J w w 1 , 0 + J b b 1 , 0 , the linearized mo del is y ∗ ≈ J w w 1 + J b b 1 + Φ 0 w L + b L 1 n + ε. Conditioning on ( τ , λ, ξ ) , we can integrate out ( b 1 , w L , b L ) to obtain the marginal lik eliho o d y ∗ | w 1 ∼ N ( J w w 1 , Σ y ) , with Σ y = J b J ⊤ b + Φ 0 Φ ⊤ 0 + 1 n 1 ⊤ n + σ 2 I n ∈ R n × n . T ogether with the prior w 1 ∼ N (0 , τ 2 Ψ) , this defines a Gaussian prior–likelihoo d pair. Linearized posterior distribution It is a well kno wn prop erty of the normal distributions that for w y ∗ ∼ N 0 0 , τ 2 Ψ τ 2 Ψ J ⊤ τ 2 J Ψ Σ y + τ 2 J Ψ J ⊤ , (30) 43 w e hav e w | y ∗ ∼ N ¯ w , ¯ Σ w , (31) ¯ w = τ 2 Ψ J ⊤ (Σ y + τ 2 J Ψ J ⊤ ) − 1 y ∗ , (32) ¯ Σ w = τ 2 Ψ − τ 2 Ψ J ⊤ (Σ y + τ 2 J Ψ J ⊤ ) − 1 J τ 2 Ψ . (33) This can b e rewritten by defining the matrices P = τ − 2 Ψ − 1 S = J ⊤ Σ − 1 y J , and using the W o o dbury identit y ( A + U C V ) − 1 = A − 1 − A − 1 U ( C − 1 + V A − 1 U ) − 1 V A − 1 F or the cov ariance matrix ¯ Σ w , the identit y is applied straigh tforward by defining the following relations A = τ − 2 Ψ − 1 U = J ⊤ V = J C = Σ − 1 y , to obtain ¯ Σ w = τ 2 Ψ − τ 2 Ψ J ⊤ (Σ y + τ 2 J ΨΨ J ⊤ ) − 1 J Ψ τ 2 Ψ = A − 1 − A − 1 U ( C − 1 + V A − 1 U ) − 1 V A − 1 = ( τ − 2 Ψ − 1 + J ⊤ Σ − 1 y J Ψ) − 1 = ( P + S ) − 1 . F or the exp ectation, ¯ w , define A = Σ y U = J V = J ⊤ C = τ 2 Ψ , suc h that ¯ w = τ 2 Ψ J ⊤ (Σ y + τ 2 J ΨΨ J ⊤ ) − 1 y ∗ = C V ( A + U C V ) − 1 y ∗ = C V A − 1 − A − 1 U ( C − 1 + V A − 1 U ) − 1 V A − 1 y ∗ = τ 2 Ψ J ⊤ Σ − 1 y − Σ − 1 y J ( τ − 2 Ψ − 1 + J ⊤ Σ − 1 y J ) − 1 J ⊤ Σ − 1 y y ∗ = P − 1 J ⊤ Σ − 1 y y ∗ − P − 1 S ( P + S ) − 1 J ⊤ Σ − 1 y y ∗ = P − 1 I − S ( P + S ) − 1 S ˆ w = P − 1 P ( P + S ) − 1 S ˆ w = ( P + S ) − 1 S ˆ w . where ˆ w = ( J ⊤ Σ − 1 y J ) − 1 J ⊤ Σ − 1 y y ∗ is the generalized least square estimator. Finally , using the identit y ( P + S ) − 1 S = I − ( P + S ) − 1 P , 44 w e obtain the shrink age matrix K := ( P + S ) − 1 S = I − ( P + S ) − 1 P , whic h is the form used in the main text for the analysis of shrink age in the diagonal and general cases of S . Whitening the shrink age matrix Note that S and P are symmetric PSD matrices, with P diagonal. W e can express the shrink age op erator as I − ( P + S ) − 1 P = ( P + S ) − 1 S = P 1 / 2 ( I + P − 1 / 2 S P − 1 / 2 ) P 1 / 2 − 1 S = P 1 / 2 ( I + G ) P 1 / 2 − 1 S = P − 1 / 2 ( I + G ) − 1 P − 1 / 2 P 1 / 2 GP 1 / 2 = P − 1 / 2 ( I + G ) − 1 GP 1 / 2 , where G = P − 1 / 2 S P − 1 / 2 . Since S and P are PSD, G is also symmetric and PSD G ⊤ = G, x ⊤ Gx = ( P − 1 / 2 x ) ⊤ S ( P − 1 / 2 x ) ≥ 0 . By the sp ectral theorem, let G = U Ω U ⊤ with diagonal Ω = diag( ω i ) , giving ( I − ( P + S ) − 1 P ) = P − 1 / 2 U ( I + Ω) − 1 Ω U ⊤ P 1 / 2 = P − 1 / 2 U diag ω j 1 + ω j U ⊤ P 1 / 2 j = 1 , ..., pH . The eigenv alues ω i are the generalized eigenv alues of ( S, P ) : S u j = ω j P u j , ω j = u ⊤ j S u j u ⊤ j P u j = τ 2 u ⊤ j S u j u ⊤ j Ψ − 1 u j . Defining the effective lo cal scale ψ 2 eff ,j ( u ) := 1 u ⊤ j Ψ − 1 u j , w e can rewrite ω j 1 + ω j = 1 − 1 1 + ψ 2 eff ,j ( u ) τ 2 u ⊤ j S u j , (34) iden tifying the mo de-wise shrink age factor. T o relate this to Piironen and V eh tari [ 2017 ], recall S = J ⊤ Σ − 1 y J , Σ y = J b J ⊤ b + Φ 0 Φ ⊤ 0 + 1 n 1 ⊤ n + σ 2 I n = QQ ⊤ + σ 2 I n , 45 where Q = [ J b Φ 0 1 n ] . Applying the W oo dbury identit y giv es Σ − 1 y = σ − 2 I − Q ( σ 2 I + Q ⊤ Q ) − 1 Q ⊤ . Since QQ ⊤ ⪰ 0 , w e hav e Σ y = σ 2 I + QQ ⊤ ⪰ σ 2 I , which implies Σ − 1 y ⪯ σ − 2 I . Con versely , b ecause λ max ( QQ ⊤ ) = ∥ Q ∥ 2 2 , the largest eigen v alue of Σ y satisfies λ max (Σ y ) ≤ σ 2 + ∥ Q ∥ 2 2 , and thus Σ − 1 y ⪰ 1 σ 2 + ∥ Q ∥ 2 2 I . Com bining these inequalities gives the sp ectral b ounds 1 σ 2 + ∥ Q ∥ 2 2 I ⪯ Σ − 1 y ⪯ σ − 2 I , 1 σ 2 + ∥ Q ∥ 2 2 J ⊤ J ⪯ S ⪯ 1 σ 2 J ⊤ J , and for any unit v ector v , ∥ J v ∥ 2 2 σ 2 + ∥ Q ∥ 2 2 ≤ v ⊤ S v ≤ σ − 2 ∥ J v ∥ 2 2 . F urthermore, let A 0 := X W ⊤ 1 , 0 + 1 n b 1 , 0 denote the activ ation in the reference p oin t, and define the elemen twise deriv ativ e matrix Φ ′ 0 := φ ′ ( A 0 ) ∈ R n × H . Then let R := Φ ′ 0 diag( w L, 0 ) ∈ R n × H with columns R h = w 2 , 0 ,h Φ ′ 0 ,h , to obtain J = ∂ (Φ( w 1 , b 1 ) w 2 ) ∂ w 1 = diag( R 1 ) X · · · diag( R H ) X . (35) Eac h blo ck diag( R h ) X corresp onds to one hidden unit and contributes one ro w p er data p oin t. Hence, for any Euclidean unit vector v ∈ R pH , v ⊤ J ⊤ J v = ∥ J v ∥ 2 2 = n X i =1 ( J i v ) 2 , whic h sho ws that ∥ J v ∥ 2 2 = Θ( n ) whenever the ro ws of J hav e b ounded norm. If the same bounded-rows argumen t applies to the columns of Q , then ∥ Q ∥ 2 2 = Θ( n ) . Consequen tly , v ⊤ S v scales appro ximately linearly with n if X is approximately orthonormal with bounded ro ws, | φ ′ | ≤ 1 , H is fixed and w 2 is b ounded. Recalling that u denotes the generalized eigen vectors of ( S, P ) satisfying S u = ω P u , the mo de-wise shrink age ( 34 ) satisfies 1 − 1 1 + ψ 2 eff ,j ( u ) τ 2 Θ( n ) σ 2 +Θ( n ) ≤ 1 − 1 1 + ψ 2 eff ,j ( u ) τ 2 u ⊤ j S u j ≤ 1 − 1 1 + ψ 2 eff ,j ( u ) τ 2 σ − 2 Θ( n ) . This mirrors the scalar Piironen form κ j = 1 / (1 + nσ − 2 τ 2 s 2 j λ 2 j ) exactly . 46 0 50 100 150 0.0 0.2 0.4 0.6 0.8 1.0 o f ( I + G ) 1 G Gauss Gauss median Gauss 10-90% 0 50 100 150 0.0 0.2 0.4 0.6 0.8 1.0 RHS RHS median RHS 10-90% 0 50 100 150 eigenvalue rank 0.0 0.2 0.4 0.6 0.8 1.0 o f ( I + G ) 1 G DHS DHS median DHS 10-90% 0 50 100 150 eigenvalue rank 0.0 0.2 0.4 0.6 0.8 1.0 DST DST median DST 10-90% (a) Indep enden t features 0 50 100 150 0.0 0.2 0.4 0.6 0.8 1.0 o f ( I + G ) 1 G Gauss Gauss median Gauss 10-90% 0 50 100 150 0.0 0.2 0.4 0.6 0.8 1.0 RHS RHS median RHS 10-90% 0 50 100 150 eigenvalue rank 0.0 0.2 0.4 0.6 0.8 1.0 o f ( I + G ) 1 G DHS DHS median DHS 10-90% 0 50 100 150 eigenvalue rank 0.0 0.2 0.4 0.6 0.8 1.0 DST DST median DST 10-90% (b) Correlated features Figure 11: Eigen v alue sp ectra of ( I + G ) − 1 G across differen t priors on the F riedman dataset under tw o input settings. Empirical analysis of the shrink age matrix T o analyse the shrink age matrix, w e use all our 4000 p osterior samples of parameters as reference p oin ts inserted in the linearization. This yields one set of matrices for all samples, and these are what w e now lo ok at. F riedman W e also giv e the sorted eigenv alue curv e for the whitened shrink age matrix ( I + G ) − 1 G in Figure 11 , which shows that DSM priors yield shrink age matrices with far more sparse eigenv alues. 47 Abalone W e now p erform the same complexity analysis for the Abalone mo dels as w as done for the F riedman mo dels. A particularly in teresting aspect of the Abalone mo del is ho w muc h more sparsifiable the Dirichlet mo dels are, compared to the Gaussian and the regularized horsesho e. F or the Gaussian, this was p erhaps exp ected, but for the regularized horsesho e the p o or p erformance is not obv ious. It is surprising to see that that to model the Abalone dataset the regularized horsesho e mo del needs ev en more effective parameters than the Gaussian model (Figure 12 ). The estimated num ber of nonzero parameters are still far less for the Dirichlet mo dels than for the Gaussian mo del. This can also b e seen from the eigenv alue curves in Figure 13 , where the regularized horsesho e mo del produces far more non-zero eigen v alues than the Dirichlet models and the Gaussian mo del. 10 15 20 25 30 35 40 t r ( ( P + S ) 1 S ) 0 50 100 150 200 250 300 F r equency Gauss RHS DHS DST Figure 12: The effectiv e n um b er of non-zero parameters for the different mo dels, as calculated from m eff = tr ( P + S ) − 1 S 0 50 100 0.0 0.2 0.4 0.6 0.8 1.0 o f ( I + G ) 1 G Gauss Gauss median Gauss 10-90% 0 50 100 0.0 0.2 0.4 0.6 0.8 1.0 RHS RHS median RHS 10-90% 0 50 100 eigenvalue rank 0.0 0.2 0.4 0.6 0.8 1.0 o f ( I + G ) 1 G DHS DHS median DHS 10-90% 0 50 100 eigenvalue rank 0.0 0.2 0.4 0.6 0.8 1.0 DST DST median DST 10-90% Figure 13: Eigen v alue curve 48 Supplemen tary D: A dditional results Here w e include supplementary material, additional results and conv ergence diag- nostics. Exp erimen tal details W e conducted several additional c hecks to assess the sensitivity of the mo dels to alternativ e scaling choices. In particular, we verified that replacing the sample size N by the hidden-la yer width H in the definition of τ 0 did not lead to quali- tativ ely different p osterior b eha vior. F or Dirichlet-based priors, the normalization constrain t P p i =1 ξ j i = 1 alters the marginal scale of the conditional v ariances, since E [ ξ j i ] = 1 /p under a symmetric Diric hlet prior. W e therefore considered rescal- ing the global parameter τ by a factor of √ p to match the marginal v ariance of the standard horsesho e prior. In practice , this adjustmen t had negligible impact on p osterior shrink age or predictiv e behavior, and all results in the main text are rep orted without this rescaling. Diric hlet and Beta t yp e priors Our theoretical inv estigations tac kle the marginal shrink age imp osed by the DSM priors. This exploits that the comp onen ts of a symmetric Dirichlet distribution marginally follow a Beta distribution. It is therefore natural to compare the DSM priors to the pure marginal mo del, defined b y w j k | τ , λ j , ξ j k ∼ N 0 , τ 2 λ 2 j ξ j k , ( ξ j 1 , . . . , ξ j p ) ∼ Beta( α, ( p − 1) α ) , λ j ∼ P λ , τ ∼ P τ . T o compare, we inv estigate the Beta Horsesho e prior, in which P λ = C + (0 , 1) and the Beta Student’s T prior, in which P λ = t + 3 (0 , 1) . As mentioned previously , tw o comp onen ts of a symmetric Dirichlet distribution hav e a correlation determined solely b y p , suc h that the num b er of cov ariates will b e the largest con tributor to the differences b etw een marginal and joint effects. W e present the same p erformance metrics on the F riedman data as previously seen (Figure 14 and T able 4 ), but no w compare the Dirichlet mo dels with the Beta mo dels. In terms of predictive p erformance the m odels are nearly indistinguishable. W e presen t the same performance metrics on the F riedman data as previously seen, but now compare the Diric hlet models with the Beta mo dels. In terms of predic- tiv e p erformance the models are nearly indistinguishable, except for the Dirichlet Horsesho e’s p erformance for N = 100 as w e ha ve already seen. This is not sur- prising, as all models induce function classes of comparable expressivity , and the primary role of the different priors is to regularize the parameter space rather than to fundamentally alter the representational capacity of the netw ork. 49 DHS DST BHS B ST 0.5 0.6 0.7 0.8 0.9 CRPS MEDIAN T rain size N=100 N=200 N=500 DHS DST BHS B ST 0.45 0.50 0.55 0.60 0.65 0.70 0.75 CRPS MEDIAN T rain size N=100 N=200 N=500 Figure 14: Bo xplot of aggregated median CRPS across mo dels and training sample sizes for the F riedman data. Uncorrelated Correlated Mo del N=100 N=200 N=500 N=100 N=200 N=500 DHS 2.359 1.243 1.106 1.846 1.232 1.057 DST 1.875 1.252 1.107 1.515 1.215 1.049 BHS 1.912 1.247 1.107 1.513 1.214 1.049 BST 1.897 1.248 1.107 1.510 1.215 1.048 T able 4: Comparison of aggregated p osterior RMSE for differen t mo dels and training sample sizes. Consequen tly , differences b et ween the priors are more naturally reflected in the mo delling complexit y and robustness to pruning. As seen from Figure 15 , the mo dels using indep enden t Beta distributions seem to use far more effectiv e non- zero parameters than the Dirichlet models. This can possibly b e attributed to the lac k of constraints on the Beta v ariables, allowing more to b e activ e sim ultaneously . F urthermore, Figure 16 lo oks at the b ehaviour of the mo dels when sub ject to prun- ing. W e hav e previously observed that the DHS prior outp erforms the Gaussian, RHS, and DST mo dels. In the present comparison, one might exp ect the BHS prior to exhibit similar b eha vior. How ever, this is not the case. Instead, the DST, BST, and BHS models display broadly comparable pruning patterns, with the DHS prior remaining the only mo del that consistently is robust to intensiv e pruning. 50 10 20 30 40 50 60 70 t r ( ( P + S ) 1 S ) 0 50 100 150 200 250 300 F r equency DHS DST BHS B ST (a) Indep enden t features 10 20 30 40 50 60 t r ( ( P + S ) 1 S ) 0 50 100 150 200 250 300 F r equency DHS DST BHS B ST (b) Correlated features Figure 15: Effective num b er of non-zero parameters m eff = tr ( P + S ) − 1 S for differen t mo dels on the F riedman dataset with indep endent and correlated input features. 2 4 6 8 10 P rune per sample RMSE N=100 N=200 DHS DST BHS B ST N=500 0.0 0.1 0.2 0.3 0.4 0.5 0.6 0.7 0.8 0.9 Sparsity 2 4 6 8 10 P osterior prune RMSE 0.0 0.1 0.2 0.3 0.4 0.5 0.6 0.7 0.8 0.9 Sparsity DHS DST BHS B ST 0.0 0.1 0.2 0.3 0.4 0.5 0.6 0.7 0.8 0.9 Sparsity Figure 16: Posterior mean RMSE as a function of sparsity level in the BNNs on the indep endent F riedman datasets. The upp er panels show results for the prune p er sample scheme, whereas the low er panel shows p osterior pruning. 51 2 4 6 8 P rune per sample RMSE N=100 N=200 DHS DST BHS B ST N=500 0.0 0.1 0.2 0.3 0.4 0.5 0.6 0.7 0.8 0.9 Sparsity 2 4 6 8 P osterior prune RMSE 0.0 0.1 0.2 0.3 0.4 0.5 0.6 0.7 0.8 0.9 Sparsity DHS DST BHS B ST 0.0 0.1 0.2 0.3 0.4 0.5 0.6 0.7 0.8 0.9 Sparsity Figure 17: Posterior mean RMSE as a function of sparsity level in the BNNs on the correlated F riedman datasets. The upp er panels show results for the prune p er sample scheme, whereas the low er panel shows p osterior pruning. F riedman regression In Figure 18 w e display the correlation coefficient matrix used to generate the correlated F riedman data. X1 X2 X3 X4 X5 X6 X7 X8 X9 X10 X1 X2 X3 X4 X5 X6 X7 X8 X9 X10 1.00 0.75 0.50 0.25 0.00 0.25 0.50 0.75 1.00 P earson cor r elation Figure 18: Correlation co efficien t matrix for the F riedman dataset Con vergence results Con vergence diagnostics for BNNs are a difficult task, as multimodality can hinder mixing of Marko v chains for individual weigh ts [ Chandra and Simmons , 2024 ]. As 52 noted by Chandra and Simmons [ 2024 ], p o or conv ergence of weigh ts do es not neces- sarily hinder goo d p erformance, but it does compromise the uncertain ty quantifica- tion. T o assess the conv ergence, we increase the burn-in p erio d to M warm up = 5000 and draw M = 2000 samples p er chain. The conv ergence diagnostics are summarized in T able 5 , a plot of ˆ R v alues are giv en in Figure 19 and Figure 20 displa y traceplots of four output instances. The ˆ R v alues are computed for the output parameters, whereas the remaining diagnostics summarize b ehavior at the lev el of the sampled mo del parameters. This distinc- tion is imp ortant, as the output-level diagnostics indicate reasonably go od mixing and the trace plots suggest stable p osterior b eha vior, while the corresp onding di- agnostics in weigh t space are generally weak er. This discrepancy is not unexp ected in Bay esian neural netw orks and likely reflects a combination of structural non- iden tifiability , multimodality induced by symmetries in the parameterization, and the highly curved and anisotropic geometry of the p osterior distribution. At the same time, clear differences across prior sp ecifications are observ ed. The Gaus- sian and RHS priors exhibit comparatively fa v orable diagnostics, whereas the DSM priors sho w more c hallenging sampling b ehavior. T o further in vestigate the rea- sons why , w e explored a range of sampler configurations, including smaller step sizes, increased tree depths, alternative w eakly informativ e hyperpriors, and less restrictiv e constraints in the parameterization. While these adjustments generally impro ved conv ergence diagnostics in w eight space, they did not lead to appreciable differences in predictiv e p erformance or posterior summaries at the output level. W e therefore interpret the observed diagnostics primarily as indicative of the gen- eral challenges asso ciated with sampling in deep Ba yesian mo dels, rather than as definitiv e evidence of pathological b ehavior of the prop osed metho d. 1.000 1.002 1.004 1.006 1.008 R 1 0 0 1 0 1 1 0 2 F r equency Gauss 1.0000 1.0005 1.0010 1.0015 1.0020 R RHS 1.000 1.001 1.002 1.003 1.004 1.005 R DHS 1.000 1.005 1.010 1.015 R DST N=100 N=200 N=500 Figure 19: Plot of ˆ R for the net w ork output v ariable across mo dels and datasets for the F riedman dataset with N ∈ { 100 , 200 , 500 } 53 T able 5: Sampler diagnostics Mo del max ˆ R Med ˆ R N div / M Med ESS tail / M Med ESS bulk / M N Gauss 1.001 1.000 0.004 0.901 0.895 100 Gauss 1.002 1.000 0.000 0.923 0.866 200 Gauss 1.009 1.001 0.000 0.853 0.610 500 RHS 1.002 1.000 0.007 0.886 0.717 100 RHS 1.002 1.000 0.000 0.921 0.849 200 RHS 1.002 1.000 0.000 0.845 0.644 500 DHS 1.005 1.001 0.586 0.560 0.236 100 DHS 1.002 1.000 0.224 0.794 0.574 200 DHS 1.004 1.001 0.186 0.753 0.487 500 DST 1.021 1.003 0.346 0.544 0.235 100 DST 1.002 1.000 0.222 0.776 0.574 200 DST 1.004 1.001 0.160 0.759 0.502 500 1.5 1.0 0.5 0.0 0.5 1.0 1.5 2.0 output 0 250 500 750 1000 1250 1500 1750 1 0 1 2 output (a) Gaussian 1.5 1.0 0.5 0.0 0.5 1.0 1.5 2.0 output 0 250 500 750 1000 1250 1500 1750 1 0 1 2 output (b) Regularized Horsesho e 1.5 1.0 0.5 0.0 0.5 1.0 1.5 2.0 output 0 250 500 750 1000 1250 1500 1750 2 1 0 1 2 output (c) Dirichlet Horsesho e 1.5 1.0 0.5 0.0 0.5 1.0 1.5 2.0 output 0 250 500 750 1000 1250 1500 1750 1 0 1 2 output (d) Dirichlet Student T Figure 20: T race plots for the four priors. 54 Supplemen tary E: Stan co de and h yp erparameter details In Stan, all hyperparameters in the DSM priors w ere generated directly from their resp ectiv e priors. F or each hidden unit, the no de-sp ecific scale c 2 j w as drawn from an Inv - Gamma(2 , 4) distribution, and the group scales λ j from indep endent Cauc hy(0 , 1) distributions. The Diric hlet w eights ϕ j w ere sampled from a sym- metric Dirichlet distribution with concentration parameter α = 0 . 1 . All first-lay er w eights w ere constructed using a non-cen tred parameterization, w j = τ ˜ λ j p ϕ j i z ij , z ij ∼ N (0 , 1) , (36) where ˜ λ j denotes the regularized lo cal scale. Bias parameters and output weigh ts w ere given standard normal priors, and the noise scale σ an Inv - Gamma(3 , 2) prior. The prior guess p 0 can b e mo dified based on the task. Below we include the Stan co de for the DHS with tanh activ ation, which can easily b e mo dified by changing activ ation, group scales and lo cal scales to obtain the mo dels used in the paper. The full rep ository can b e found on the authors github, https://github.com/ AugustArnstad/DirichletScaleMixtures . / / = = = = = = = = = = = = = = = = = = = = = / / P r i o r p r e d i c t i v e m o d e l w i t h n o n - c e n t e r e d p a r a m e t e r i z a t i o n / / = = = = = = = = = = = = = = = = = = = = = f u n c t i o n s { m a t r i x n n _ p r e d i c t ( m a t r i x X , m a t r i x W _ 1 , a r r a y [ ] m a t r i x W _ i n t e r n a l , a r r a y [ ] r o w _ v e c t o r h i d d e n _ b i a s , m a t r i x W _ L , r o w _ v e c t o r o u t p u t _ b i a s , i n t L ) { i n t N = r o w s ( X ) ; i n t o u t p u t _ n o d e s = c o l s ( W _ L ) ; i n t H = c o l s ( W _ 1 ) ; a r r a y [ L ] m a t r i x [ N , H ] h i d d e n ; h i d d e n [ 1 ] = t a n h ( X * W _ 1 + r e p _ v e c t o r ( 1 . 0 , N ) * h i d d e n _ b i a s [ 1 ] ) ; i f ( L > 1 ) { f o r ( l i n 2 : L ) h i d d e n [ l ] = t a n h ( h i d d e n [ l - 1 ] * W _ i n t e r n a l [ l - 1 ] + r e p _ v e c t o r ( 1 . 0 , N ) * h i d d e n _ b i a s [ l ] ) ; } m a t r i x [ N , o u t p u t _ n o d e s ] o u t p u t = h i d d e n [ L ] * W _ L ; o u t p u t + = r e p _ m a t r i x ( o u t p u t _ b i a s , N ) ; 55 r e t u r n o u t p u t ; } } d a t a { i n t < l o w e r = 1 > N ; i n t < l o w e r = 1 > P ; m a t r i x [ N , P ] X ; i n t < l o w e r = 1 > o u t p u t _ n o d e s ; m a t r i x [ N , o u t p u t _ n o d e s ] y ; i n t < l o w e r = 1 > L ; i n t < l o w e r = 1 > H ; i n t < l o w e r = 1 > N _ t e s t ; m a t r i x [ N _ t e s t , P ] X _ t e s t ; i n t < l o w e r = 1 > p _ 0 ; r e a l < l o w e r = 0 > a ; r e a l < l o w e r = 0 > b ; v e c t o r < l o w e r = 0 > [ P ] a l p h a ; } p a r a m e t e r s { v e c t o r < l o w e r = 0 > [ H ] l a m b d a _ n o d e ; a r r a y [ H ] s i m p l e x [ P ] p h i _ d a t a ; r e a l < l o w e r = 1 e - 6 > t a u ; v e c t o r < l o w e r = 0 > [ H ] c _ s q ; m a t r i x [ P , H ] W 1 _ r a w ; a r r a y [ m a x ( L - 1 , 1 ) ] m a t r i x [ H , H ] W _ i n t e r n a l ; a r r a y [ L ] r o w _ v e c t o r [ H ] h i d d e n _ b i a s ; m a t r i x [ H , o u t p u t _ n o d e s ] W _ L ; r o w _ v e c t o r [ o u t p u t _ n o d e s ] o u t p u t _ b i a s ; r e a l < l o w e r = 1 e - 6 > s i g m a ; } t r a n s f o r m e d p a r a m e t e r s { r e a l < l o w e r = 1 e - 6 > t a u _ 0 = ( p _ 0 * 1 . 0 ) / ( P - p _ 0 ) * 1 / s q r t ( N ) ; v e c t o r < l o w e r = 0 > [ H ] l a m b d a _ t i l d e _ n o d e ; f o r ( j i n 1 : H ) { 56 l a m b d a _ t i l d e _ n o d e [ j ] = f m a x ( 1 e - 1 2 , c _ s q [ j ] * s q u a r e ( l a m b d a _ n o d e [ j ] ) / ( c _ s q [ j ] + s q u a r e ( l a m b d a _ n o d e [ j ] ) * s q u a r e ( t a u ) ) ) ; } m a t r i x [ P , H ] W _ 1 ; f o r ( j i n 1 : H ) { f o r ( i i n 1 : P ) { r e a l s t d d e v = f m a x ( 1 e - 1 2 , t a u * s q r t ( l a m b d a _ t i l d e _ n o d e [ j ] ) * s q r t ( p h i _ d a t a [ j ] [ i ] ) ) / s q r t ( P ) ; W _ 1 [ i , j ] = s t d d e v * W 1 _ r a w [ i , j ] ; } } m a t r i x [ N , o u t p u t _ n o d e s ] o u t p u t = n n _ p r e d i c t ( X , W _ 1 , W _ i n t e r n a l , h i d d e n _ b i a s , W _ L , o u t p u t _ b i a s , L ) ; } m o d e l { t a u ~ c a u c h y ( 0 , t a u _ 0 ) ; c _ s q ~ i n v _ g a m m a ( a , b ) ; l a m b d a _ n o d e ~ c a u c h y ( 0 , 1 ) ; f o r ( j i n 1 : H ) p h i _ d a t a [ j ] ~ d i r i c h l e t ( a l p h a ) ; t o _ v e c t o r ( W 1 _ r a w ) ~ n o r m a l ( 0 , 1 ) ; i f ( L > 1 ) { f o r ( l i n 1 : ( L - 1 ) ) { f o r ( j i n 1 : H ) { W _ i n t e r n a l [ l ] [ , j ] ~ n o r m a l ( 0 , 1 ) ; } } } f o r ( l i n 1 : L ) h i d d e n _ b i a s [ l ] ~ n o r m a l ( 0 , 1 ) ; f o r ( j i n 1 : o u t p u t _ n o d e s ) 57 W _ L [ , j ] ~ n o r m a l ( 0 , 1 ) ; o u t p u t _ b i a s ~ n o r m a l ( 0 , 1 ) ; s i g m a ~ i n v _ g a m m a ( 3 , 2 ) ; / / L i k e l i h o o d f o r ( n i n 1 : N ) f o r ( j i n 1 : o u t p u t _ n o d e s ) y [ n , j ] ~ n o r m a l ( o u t p u t [ n , j ] , s i g m a ) ; } 58
Original Paper
Loading high-quality paper...
Comments & Academic Discussion
Loading comments...
Leave a Comment