CoMET: A Compressed Bayesian Mixed-Effects Model for High-Dimensional Tensors
Mixed-effects models are fundamental tools for analyzing clustered and repeated-measures data, but existing high-dimensional methods largely focus on penalized estimation with vector-valued covariates. Bayesian alternatives in this regime are limited…
Authors: Sreya Sarkar, Kshitij Khare, Sanvesh Srivastava
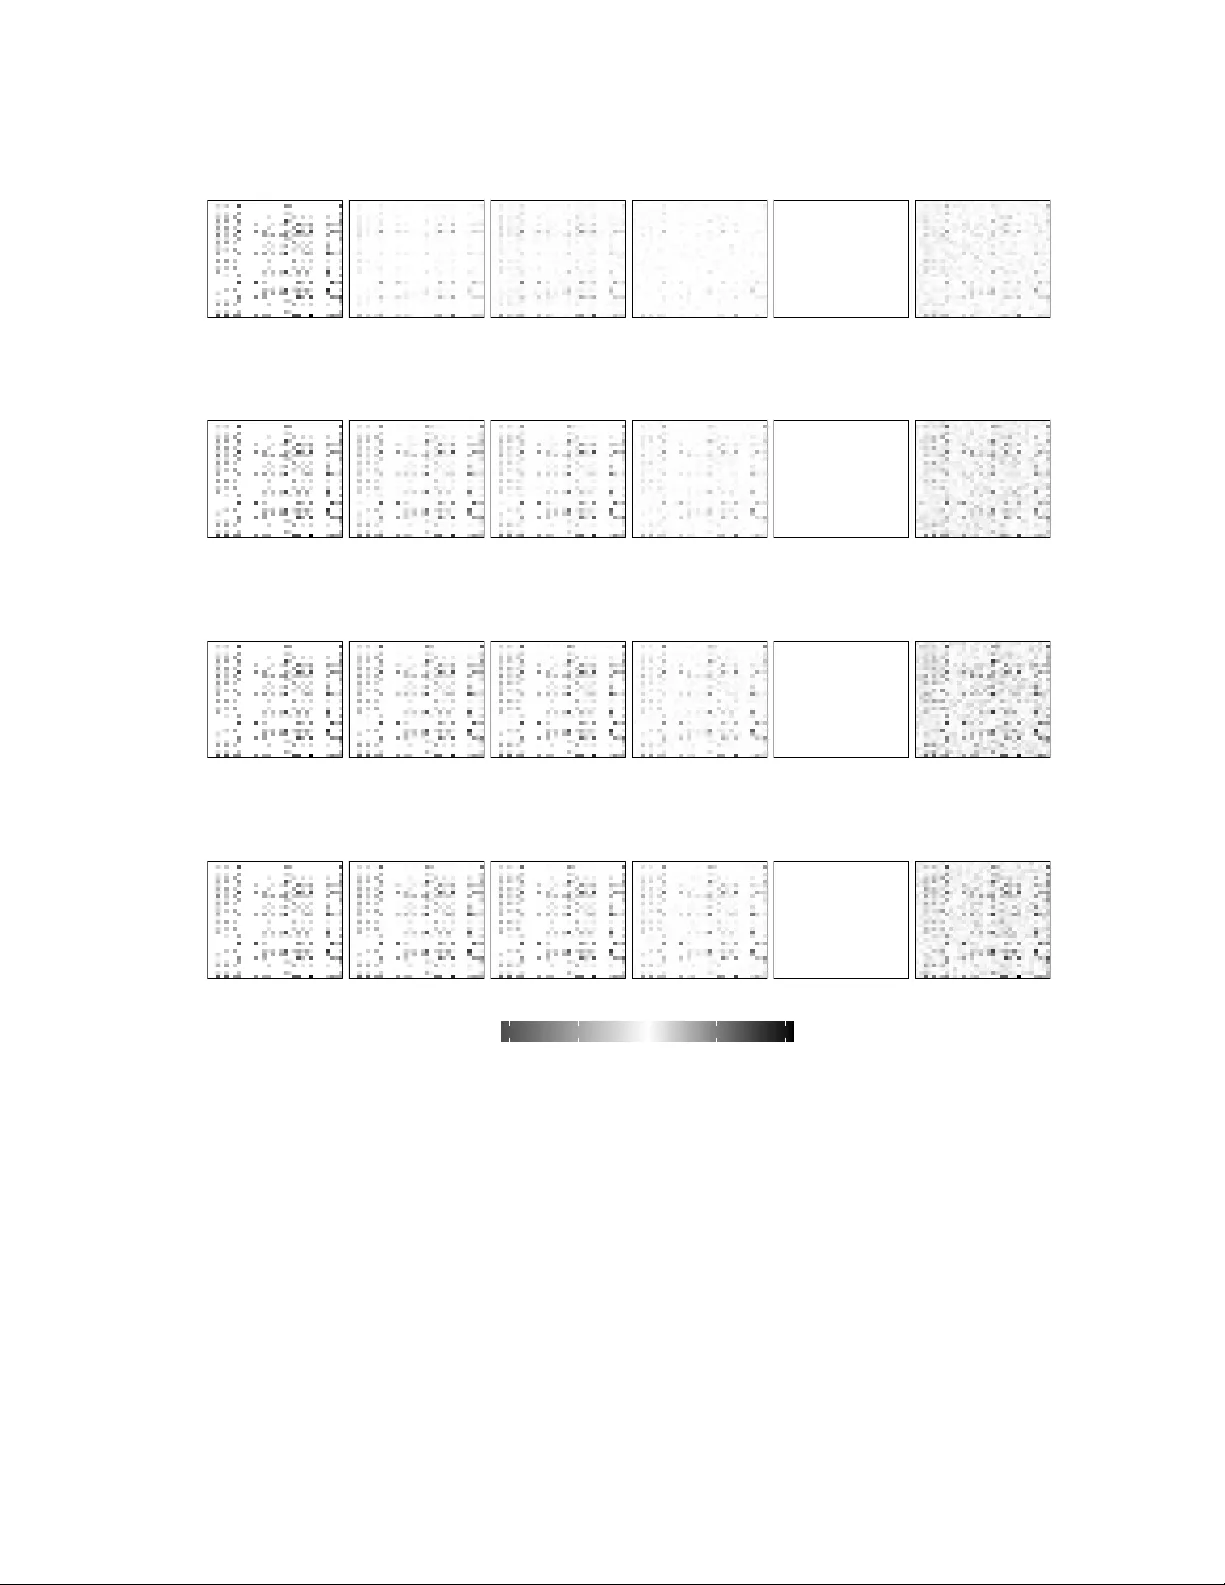
CoMET : A Compressed Bayesian Mix ed-Ef fects Model for High-Dimensional T ensors Sreya Sarkar * , Kshitij Khare † , San v esh Sri v asta v a ‡ Abstract Mixed-ef fects models are fundamental tools for analyzing clustered and repeated-measures data, but e xisting high-dimensional methods largely focus on penalized estimation with vector -v alued co v ari- ates. Bayesian alternativ es in this regime are limited, with no sampling-based mixed-ef fects frame- work that supports tensor-v alued fixed- and random-effects cov ariates while remaining computationally tractable. W e propose the Compressed Mixed-Ef fects T ensor (CoMET) model for high-dimensional repeated-measures data with scalar responses and tensor-v alued co v ariates. CoMET performs structured, mode-wise random projection of the random-effects cov ariance, yielding a lo w-dimensional cov ariance parameter that admits simple Gaussian prior specification and enables efficient imputation of compressed random-effects. For the mean structure, CoMET le v erages a lo w-rank tensor decomposition and margin- structured Horseshoe priors to enable fixed-effects selection. These design choices lead to an efficient collapsed Gibbs sampler whose computational comple xity gro ws approximately linearly with the tensor cov ariate dimensions. W e establish high-dimensional theoretical guarantees by identifying re gularity conditions under which CoMET’ s posterior predictive risk decays to zero. Empirically , CoMET out- performs penalized competitors across a range of simulation studies and two benchmark applications in v olving facial-e xpression prediction and music emotion modeling. K eyw ords: Gibbs sampling; mixed-ef fects model; random projection; tensor decomposition; uncertainty quantification 1 Intr oduction Mixed-ef fects models are flexible extensions of regression models that include random-ef fects to capture within-cluster dependence. Recent high-dimensional literature has largely focused on penalization-based methods for vector-v alued cov ariates, and, to our knowledge, there is no sampling-based Bayesian mixed- ef fects framework that accommodates tensor-v alued fixed- and random-effect covariates in high dimen- sions. T o fill this gap, we propose a Compressed Mixed-Ef fects T ensor (CoMET) model for sampling-based Bayesian inference in high-dimensional repeated measures data with a scalar response and tensor-v alued * PhD Candidate, Department of Statistics and Actuarial Science, The Univ ersity of Iowa † Professor , Department of Statistics, University of Florida ‡ Associate Professor , Department of Statistics and Actuarial Science, The University of Io wa 1 cov ariates. CoMET uses random projection-based compression of the random-effects cov ariance structure induced by tensor covariates to reduce the effecti ve dimension of the cov ariance parameter , bypassing the primary computational bottleneck in posterior computation. T ogether with a lo w-rank shrinkage prior on the fixed-ef fects coefficients, this approach yields an efficient collapsed Gibbs sampler for fixed-ef fects selection and prediction that outperforms penalized competitors across a range of simulated and real-data analyses. W e also provide theoretical support for empirical results by establishing regularity conditions under which CoMET’ s posterior predicti ve risk decays to zero. Modern vision and audio applications generate tensor-v alued cov ariates with within-cluster dependence. For example, a celebrity in the Labeled Faces in the W ild (LFW) database has multiple facial images and as- sociated expression intensity (e.g., smiling score) ( Learned-Miller et al. , 2016 ). Images of the same celebrity exhibit similar celebrity relationships between f acial features and expression intensity , moti vating regression models with random-slope ef fects for tensor cov ariates. Similarly , in the MediaEv al Database for Emotional Analysis in Music (DEAM), the valence or arousal of a song at a time point depends on the corresponding matrix-v alued spectral acoustic representation (e.g., acoustic feature summaries and their first-order deriv a- ti ves) ( Aljanaki et al. , 2017 ). The valence or arousal scores within a song are correlated across time points, and the co variate-response relationship can v ary across songs due to differences in spectral features. T ensor regression methods assume independence across observ ations, ignoring within-celebrity and within-song dependence. Mixed-ef fects methods fail to exploit tensor structure because they vectorize the cov ariates. CoMET fills this gap by extending random-slope mixed-ef fects modeling to tensor covariates while en- abling sampling-based Bayesian inference. There is an extensi ve literature on tensor regression for independent observations, which focuses on regressing a scalar response on a high-dimensional tensor-v alued predictor . The main idea is to impose a lo w-rank structure on the regression coef ficient tensor . Common notions of tensor rank include spectral rank, T ucker rank, and related multilinear ranks ( K olda and Bader , 2009 ). Non-Bayesian methods estimate the regression coefficient tensor via penalized (quasi) likelihood formulations, encouraging low-rank structure through spectral penalties, nuclear-norm relaxations, and other structured regularizers ( Zhou et al. , 2013 ; Zhou and Li , 2014 ; Slawski et al. , 2015 ; Zhao et al. , 2017 ; Lock , 2018 ; Raskutti et al. , 2019 ; Chen et al. , 2019 ; Peng et al. , 2025 ). Analogous Bayesian methods replace explicit penalties with structured priors on the coef ficient tensor and perform posterior inference via Monte Carlo algorithms. These include multi- way shrinkage priors and Gaussian priors on low-rank factorizations of the tensor coef ficient ( Guhaniyogi et al. , 2017 ; W ang and Xu , 2024 ). These approaches do not directly extend to mixed-ef fects models with tensor covariates, where repeated measurements induce within-subject dependence and inference requires estimating high-dimensional mean and cov ariance parameters. The literature on repeated-measures data with multi-dimensional features is limited, especially in mod- eling within-subject dependence. Zhang et al. ( 2019 ) dev eloped a scalar-on-tensor regression framework based on generalized estimating equations (GEE), imposing low-rank structure on the tensor regression co- ef ficient. The GEE-based approach has two limitations. First, it relies on a pre-specified w orking correlation structure to account for within-subject correlation. Second, it is not well suited to high-dimensional regimes because stable estimation requires a lar ge number of observations per cluster . Mixed-ef fects models can also 2 be applied to tensor-v alued clustered data by vectorizing the tensor covariates. Howe ver , this strategy fails to exploit the multilinear structure and cross-mode dependence of a tensor and becomes computationally prohibiti ve as the tensor dimensions grow . These limitations have moti vated recent extensions of mixed-effects models that directly accommodate tensor covariates. Y ue et al. ( 2020 ) proposed a tensor-on-tensor mixed model, but their framework has two limitations. First, it does not include tensor-v alued random-effects cov ariates, so it cannot model random- slope ef fects. Second, it requires the mode-specific random-effects cov ariance matrices to be positiv e def- inite, which can be restrictiv e in high-dimensional settings. Spencer et al. ( 2020 ) regress a tensor-v alued response on a scalar stimulus and a scalar subject-region-specific random intercept. This approach does not accommodate tensor-v alued random slopes, so it fails to model within-subject dependence across tensor modes. Addressing these issues, Hultman and Sriv astav a ( 2025 ) introduced a mix ed-effects model with ten- sor cov ariates that jointly estimates mean and cov ariance components under sparsity and low-rank assump- tions. A Bayesian extension of this frame work is impractical because it requires priors for high-dimensional mean and cov ariance parameters, leading to intractable posterior computation ev en at moderately large di- mensions. CoMET addresses these g aps through structured dimension reduction of the random-effects co variance. W e employ mode-wise random projections to represent random-ef fects slopes in a low-dimensional space. Because the resulting compressed cov ariance parameter is low-dimensional, we place a default Gaussian prior on it, which simplifies posterior updates and enables efficient imputation of the compressed random- ef fects. Similar to the tensor regression literature, we assume a lo w-rank decomposition for the regression coef ficient tensor , yielding linear scaling of the mean-parameter dimension. W e then assign Horseshoe priors structured according to the low-r margins of the mean parameter . T ogether , these design choices yield an ef ficient collapsed Gibbs sampler , with computational complexity that scales approximately linearly in the tensor cov ariate dimensions. Finally , CoMET’ s setup enables us to establish that the its posterior predictiv e risk decays to zero in the high-dimensional regime. Recently , compression of the random-effects cov ariance has been used to enable efficient Bayesian infer- ence in high-dimensional linear mixed-ef fects models ( Sarkar et al. , 2025 ). Applying this approach to tensor cov ariates via vectorization has two limitations. First, vectorization necessitates placing shrinkage priors on a coefficient vector whose dimension grows polynomially with the tensor dimensions. CoMET av oids this by imposing a lo w-rank decomposition on the coefficient tensor and assigning shrinkage priors to its lo w-dimensional margins, yielding linear scaling of the mean-parameter dimension. Second, vectorization- based cov ariance compression fails to exploit the mode-specific structure of tensor-v alued random-effects. CoMET instead imposes a separable cov ariance structure on the random-effects, enabling mode-wise com- pression via random projection matrices. In summary , our contrib utions are threefold. First, we develop CoMET , a compressed mixed-ef fects model for clustered data with scalar responses and tensor-v alued fixed- and random-ef fects cov ariates (Sec- tion 2 ). Le veraging the tensor regression literature, we impose sparsity in the mean structure via a lo w- rank factorization and perform fixed-ef fects selection through Horseshoe priors structured according to the lo w-rank margin factors. Second, we compress the random-ef fects cov ariance by imposing a separable co- 3 v ariance structure and performing mode-wise compression via random projections, which yields a tensor mixed-ef fects model with random slopes for tensor-v alued cov ariates. This substantially reduces the effec- ti ve dimensions of the mean and co variance parameters and e xpands modeling fle xibility relativ e to e xisting penalized and Bayesian alternati ves for tensor regression, while keeping posterior computation tractable. W e further provide theoretical support for these empirical findings by establishing regularity conditions un- der which CoMET’ s posterior predictive risk decays to zero (Section 3 ). Finally , we demonstrate across a range of simulation studies (Section 4 ) and two benchmark applications (a music database and an image database) that CoMET outperforms penalized competitors on multiple performance metrics (Section 5 ). 2 Methodology 2.1 Background Consider the setup of a mixed model with scalar response and tensor-v ariate fixed- and random-effects cov ariates. Let there be n subjects with m i observ ations recorded for the i -th subject and N = P n i =1 m i be the total sample size. For i = 1 , . . . , n and j = 1 , . . . , m i , suppose X ij ∈ R p 1 ×···× p D and Z ij ∈ R q 1 ×···× q D are D -th order tensors, respectiv ely , denoting the fixed- and random-effect cov ariates, and y ij ∈ R is the response for the i -th subject on the j -th occasion. A scalar-on-tensor mixed-ef fects model for relating y ij to ( X ij , Z ij ) is y ij = ⟨X ij , B ⟩ + ⟨Z ij , A i ⟩ + ϵ ij , A ij ⊥ ϵ ij , i = 1 , . . . , n, j = 1 , . . . , m i , (1) where B ∈ R p 1 ×···× p D is a D -th order tensor representing the population-specific mean parameter , and ⟨· , ·⟩ denotes the inner product between two tensors of the same order ( Hultman and Sriv astav a , 2025 ). The idiosyncratic errors ϵ ij s are independently and identically distributed (iid) as N (0 , τ 2 ) . The random- ef fect for subject i is A i ∈ R q 1 ×···× q D , A i s and ϵ ij s are mutually independent, and A i s are iid as N q 1 ,...,q D (0 , τ 2 Σ 1 , . . . , Σ D ) , where N q 1 ,...,q D denotes an order- D tensor normal distribution and Σ d is the symmetric positi ve semi-definite cov ariance matrix corresponding to mode- d ( Hof f , 2011 ). T ensor regression is recovered as a special case of ( 1 ) by setting A i = 0 and m i = 1 for all i . Existing regularization-based methods estimate B using penalties that promote low-rank structures, most commonly by expressing B as a small number of rank-one tensors ( Zhou et al. , 2013 ; Zhou and Li , 2014 ; Slawski et al. , 2015 ; Zhao et al. , 2017 ; Lock , 2018 ; Raskutti et al. , 2019 ; Chen et al. , 2019 ; Peng et al. , 2025 ). Their Bayesian counterparts place shrinkage priors on the rank-one tensor components, typically shrinking a subset of these components. For example, multiway Dirichlet generalized double Pareto priors induce adapti ve lasso-type shrinkage on the entries of B to promote rank reduction by simultaneously shrinking many rank-one components tow ards zero ( Guhaniyogi et al. , 2017 ; Spencer et al. , 2025 ). These methods quantify uncertainty in B by drawing samples from its posterior distribution. After vectorization, the model in ( 1 ) can be written as a linear mixed-effects (LME) model with a Kronecker -structured random-effects cov ariance. In particular , D = 1 corresponds to the standard LME model, and its recent quasi-likelihood extensions replace Σ 1 with a suitable proxy matrix to estimate the 4 fixed-ef fect parameter B ∈ R p 1 using sparsity-inducing penalties ( Fan and Li , 2012 ; Li et al. , 2022 ). For a general D , let x ij = v ec ( X ij ) ∈ R p ∗ and z ij = v ec ( Z ij ) ∈ R q ∗ denote the vectorized cov ariates, where p ∗ = Q D d =1 p d , q ∗ = Q D d =1 q d , and vec ( · ) vectorizes a tensor by stacking its entries so that the first- mode index varies fastest, followed by the second, and so on. Using this representation, ( 1 ) becomes an LME model with fixed- and random-ef fects cov ariates ( x ij , z ij ) , fix ed-effects parameter vec ( B ) ∈ R p ∗ , and random-ef fect vec ( A i ) ∈ R q ∗ with co variance τ 2 (Σ D ⊗ · · · ⊗ Σ 1 ) , where ⊗ denotes the Kroneck er product ( Hof f , 2011 ). This implies that the mean and co variance parameter dimensions are O ( p ∗ ) and O ( P D d =1 q 2 d ) . While existing penalized and quasi-likelihood approaches for high-dimensional LME models can be applied to this v ectorized form, they treat ( x ij , z ij ) ’ s as unstructured v ectors and fail to exploit the underlying tensor structure, leading to unnecessary computational burden and potentially suboptimal inference. GEE-based models keep the mean structure in ( 1 ) but model within-subject dependence through a marginal error term with cov ariance replaced by a scaled working correlation matrix. The marginal error plays the role of the random-effects and idiosyncratic errors in ( 1 ). Similar to tensor re gression, GEE-based methods use penalties that promote lo w-rank structures for estimating B ( Zhang et al. , 2019 ). The main limitation of these methods is that the working correlation structure is restricted to a small set of parametric forms (e.g., equicorrelation). Moreov er , they cannot adapt to the dependence structure in the data because they do not include an equiv alent of the random-effects term such as ⟨Z ij , A i ⟩ in ( 1 ). They are also not well-suited to high-dimensional regimes with N ≪ min { p ∗ , q ∗ } . Mixed model trace regression methods use ( 1 ) to obtain sparse estimates of the mean parameter and lo w-rank estimates of the cov ariance components in high-dimensional settings ( Hultman and Sriv astav a , 2025 ). Conditional on Σ 1 , . . . , Σ D , the regularized estimation of B follows from standard tensor regression methods that impose low-rank or sparse structures on B . The ke y additional step in the mixed-effects setting is to treat the random-effects A i s as latent v ariables and to model their separable cov ariance through a lo w-rank T ucker representation ( K olda and Bader , 2009 ): A i = D i × 1 L 1 × 2 · · · × D L D , D i ∼ N q 1 ,...,q D (0 , τ 2 I q 1 , . . . , I q D ) , d = 1 , . . . , D , (2) where L d is a (possibly lo w-rank) square-root factor of the mode- d cov ariance matrix Σ d , satisfying Σ d = L d L ⊤ d . The covariance components Σ d ’ s are estimated via their factors L d ’ s using an EM-type algorithm: the E-step uses the Gaussian conditional distrib ution of A i and the M-step sequentially updates L 1 , . . . , L D under a group-lasso penalty on their columns. Despite their flexibility , this approach becomes computationally prohibiti ve in high-dimensional applications and does not provide uncertainty estimates. A Bayesian extension of ( 1 ) is computationally prohibitive in high dimensions. The main challenge is specifying priors on Σ 1 , . . . , Σ D that still yield tractable posterior computation. Standard high-dimensional priors for covariance matrices, including the shrinkage in verse W ishart prior ( Berger et al. , 2020 ), require Σ d to be positive definite and are not suited for estimating O ( q 2 d ) cov ariance parameters when the number of observ ations per subject is limited. In the next section, we introduce the CoMET model, which addresses these limitations by using a quasi-likelihood based on mode-wise cov ariance compression to bypass high- dimensional cov ariance estimation. T ogether with a lo w-rank shrinkage prior on B , this formulation enables sampling-based posterior inference with uncertainty quantification. 5 2.2 CoMET : A Compressed Mixed-Effects T ensor Model The key idea behind CoMET’ s mode-wise cov ariance compression is to replace each high-dimensional random-ef fects cov ariance component with a low-dimensional proxy obtained by applying random projec- tions to a cov ariance factor . Let R d , S d ∈ R k d × q d be mode- d -specific random matrices with independent entries distributed as N (0 , 1 /k d ) , where k d ≪ q d . F or each mode d = 1 , . . . , D , the CoMET model compresses the square-root cov ariance factor L d in ( 2 ) by replacing it with Γ d = S d L d R ⊤ d ∈ R k d × k d . The CoMET model reformulates the tensor mixed-effects model in ( 1 ) using the compressed factors (Γ 1 , . . . , Γ D ) . Follo wing ( 2 ), the compressed random-slope tensor for subject i is defined as ˜ A i = ˜ D i × 1 Γ 1 × 2 · · · × D Γ D , ˜ D i ∼ N k 1 ,...,k D 0 , τ 2 R 1 R ⊤ 1 , . . . , R D R ⊤ D , (3) where ˜ D i = D i × 1 R 1 × 2 · · · × D R D is the compressed core tensor . T o match the dimension of ˜ A i and its random-ef fects covariates, we define ˜ Z ij = Z ij × 1 S 1 × 2 · · · × D S D . While the fixed-ef fects covariates X ij ’ s remain unchanged, we impose a lo w-rank structure on their coef ficient tensor B to reduce the ef fectiv e mean parameter dimension. The resulting CoMET model is y ij = ⟨X ij , B ⟩ + ⟨ ˜ Z ij , ˜ A i ⟩ + ϵ ij , ϵ ij ∼ N (0 , τ 2 ) , j = 1 , . . . , m i , i = 1 , . . . , n, (4) where τ 2 is the idiosyncratic error variance. The compressed inner product ⟨ ˜ Z ij , ˜ A i ⟩ in ( 4 ) is a low- dimensional proxy for ⟨Z ij , A i ⟩ in ( 1 ). This approximation is achieved by mode-wise multiplication of ( S 1 , . . . , S D ) to the cov ariates Z ij in ( 1 ) and ( R 1 , . . . , R D ) to the core random-effects tensor D i in ( 2 ). Compared to ( 1 ), the CoMET model in ( 4 ) reduces the mean and cov ariance parameter dimensions. First, the compressed co v ariance factors (Γ 1 , . . . , Γ D ) reduce the co v ariance parameter dimension from O ( q 2 1 + · · · + q 2 D ) to O ( k 2 1 + · · · + k 2 D ) , where k d ≪ q d for d = 1 , . . . , D . Second, we impose a rank- K CP structure on B as B = K X g =1 β ( g ) 1 ◦ · · · ◦ β ( g ) D , β ( g ) d ∈ R p d , g = 1 , . . . , K, d = 1 , . . . , D , (5) where K ≪ min { p 1 , . . . , p D } and ◦ denotes the vector outer product. Specifically , ( 5 ) implies that the ( j 1 , . . . , j D ) -th entry of B satisfies B j 1 ...j D = P K g =1 β ( g ) 1 j 1 · · · β ( g ) Dj D ( K olda and Bader , 2009 ). For d = 1 , . . . , D , let B d = β (1) d , · · · , β ( K ) d ∈ R p d × K be the mode- d mean factor matrix. This parametriza- tion replaces the O ( Q D d =1 p d ) free parameters in an unstructured B with O ( K P D d =1 p d ) parameters in ( B 1 , . . . , B D ) . Overall, CoMET reduces the parameter dimension from O ( Q D j =1 p j + max d q 2 d ) in ( 1 ) to O ( K P D j =1 p j + max d k 2 d ) . W e complete the CoMET model specification by assigning priors to { B 1 , . . . , B D , Γ 1 , . . . , Γ D , τ 2 } . Because B 1 , . . . , B D determine B through the CP representation in ( 5 ), we place Horseshoe priors on the entries of the factor matrices to promote shrinkage of the B entries and fixed-ef fects selection ( Carvalho et al. , 2010 ; van der Pas et al. , 2017 ; Bhattacharya et al. , 2022 ; Song and Liang , 2023 ). For g = 1 , . . . , K , 6 d = 1 , . . . , D , and j = 1 , . . . , p d , we specify prior on ( B , τ 2 ) using the following hierarchy β ( g ) d j | λ 2 g d j , δ 2 g , τ 2 ind ∼ N (0 , λ 2 g d j δ 2 g τ 2 ) , λ g d j ind ∼ C + (0 , 1) , δ g ind ∼ C + (0 , 1) , τ 2 ∼ I G ( a 0 , b 0 ) , (6) where C + (0 , 1) denotes the standard half-Cauchy distribution and I G ( a 0 , b 0 ) denotes the in verse-gamma distribution with the shape and scale parameters a 0 and b 0 , respecti vely . The global shrinkage parame- ter δ g controls ov erall shrinkage across all modes within the g -th rank-one component in ( 5 ), encouraging rank reduction by shrinking the entire component toward zero. The local shrinkage parameter λ g d j controls entry-specific shrinkage of β ( g ) d j , which impacts the shrinkage of the tensor entries B j 1 ...j D through the multi- plicati ve structure in ( 5 ) and promotes variable selection. Finally , independent of ( B , τ 2 ) , we place Gaussian priors, N (0 , σ 2 d I k 2 d ) , on γ d independently across d modes, where γ d = vec (Γ d ) and σ 2 d is a hyperparameter . 2.3 Fixed-Effects Selection and Pr ediction using CoMET W e de velop a collapsed Gibbs sampler for fixed-effects selection and prediction using the CoMET model. For simplicity , we present the sampler for three-dimensional tensors (i.e., D = 3 ), but the extension to a general order- D tensor is straightforward. The algorithm cycles between two blocks. In the first bock, we condition on ( B , τ 2 ) and update the compressed random-ef fects cores ˜ D i s in ( 4 ) gi ven (Γ 1 , Γ 2 , Γ 3 ) followed by updating (Γ 1 , Γ 2 , Γ 3 ) giv en ˜ D i s. In the second block, we update ( B , τ 2 ) conditional on (Γ 1 , Γ 2 , Γ 3 ) after marginalizing out ˜ D i s in ( 4 ). W e deri ve the joint distribution of the responses and random-ef fects under ( 4 ), which is ke y to obtaining analytically tractable full conditional distributions for the Gibbs sampler . Let Γ ∗ = Γ 3 ⊗ Γ 2 ⊗ Γ 1 , R ∗ = R 3 ⊗ R 2 ⊗ R 1 , and S ∗ = S 3 ⊗ S 2 ⊗ S 1 . Then, we can re-express the CoMET model in ( 4 ) as y ij = x ⊤ ij β + ˜ z ⊤ ij Γ ∗ ˜ d i + ϵ ij , ˜ d i ∼ N (0 , τ 2 R ∗ R ∗⊤ ) , (7) where x ij = vec ( X ij ) , β = vec ( B ) , ˜ z ij = vec ( ˜ Z ij ) = S ∗ vec ( Z ij ) , and ˜ d i = vec ( ˜ D i ) . For the i -th subject, we then stack y ij s, x ⊤ ij s, and ˜ z ⊤ ij s ro w-wise to construct y i ∈ R m i , X i ∈ R m i × p 1 p 2 p 3 , and ˜ Z i ∈ R m i × k 1 k 2 k 3 , respecti vely . The joint distribution of ( y i , ˜ d i ) is Gaussian: N m i + k 1 k 2 k 3 X i β 0 ! , τ 2 V y i ,y i V y i , ˜ d i V ⊤ y i , ˜ d i V ˜ d i , ˜ d i !! , (8) where V ˜ d i , ˜ d i = R ∗ R ∗⊤ , V y i , ˜ d i = ˜ Z i Γ ∗ R ∗ R ∗⊤ , and V y i ,y i = ˜ Z i Γ ∗ R ∗ R ∗⊤ Γ ∗⊤ ˜ Z ⊤ i + I m i . For the first block, we condition on ( B , τ 2 ) and deriv e the full conditional distributions for the com- pressed core random-effects ˜ D i s and the compressed covariance factors (Γ 1 , Γ 2 , Γ 3 ) . For i = 1 , . . . , n , the joint distribution in ( 8 ) implies that the full conditional distrib ution of ˜ d i gi ven y i and (Γ 1 , Γ 2 , Γ 3 ) is N k 1 k 2 k 3 ( µ ˜ d i | . , V ˜ d i | . ) , µ ˜ d i | . = V ⊤ y i , ˜ d i V − 1 y i ,y i ( y i − X i β ) , V ˜ d i | . = V ˜ d i , ˜ d i − V ⊤ y i , ˜ d i V − 1 y i ,y i V y i , ˜ d i . (9) 7 Conditional on ( B , τ 2 ) , ˜ d i s, and y i s, we sample Γ 1 , Γ 2 , and Γ 3 sequentially . For an y d = 1 , 2 , 3 , we hav e ⟨ ˜ Z ij , ˜ A i ⟩ = tr ( ˜ Z ⊤ ij ( d ) ˜ A i ( d ) ) = { v ec( ˜ Z ij ( d ) (Γ 3 ⊗ · · · ⊗ Γ d +1 ⊗ Γ d − 1 ⊗ · · · ⊗ Γ 1 ) ˜ D ⊤ i ( d ) ) } ⊤ γ d , (10) where tr ( · ) is the trace operator and ˜ Z ij ( d ) and ˜ D i ( d ) are mode- d matricization ( K olda and Bader , 2009 ) of the tensors ˜ Z ij and ˜ D i , respecti vely . Substituting ( 10 ) in ( 4 ) yields the following linear re gression model ˇ y = ˇ Z γ d γ d + ϵ, ϵ ∼ N (0 , τ 2 I N ) , γ d ∈ R k 2 d , π ( γ d ) ∼ N (0 , σ 2 d I k 2 d ) , (11) where ˇ y is obtained by stacking y ij − ⟨X ij , B ⟩ s row-wise and ˇ Z γ d ∈ R N × k 2 d is obtained by stacking { vec ( ˜ Z ij ( d ) (Γ 3 ⊗ · · · ⊗ Γ d +1 ⊗ Γ d − 1 ⊗ · · · ⊗ Γ 1 ) ˜ D ⊤ i ( d ) ) } ⊤ s row-wise for j = 1 , . . . , m i and i = 1 , . . . , n . The Gaussian likelihood and prior on γ d in ( 11 ) implies that the full conditional distribution of γ d is N ( µ γ d , Σ γ d ) , Σ γ d = τ − 2 ˇ Z ⊤ γ d ˇ Z γ d + σ − 2 d I k 2 d − 1 , µ γ d = τ − 2 Σ γ d ˇ Z ⊤ γ d ˇ y , d = 1 , . . . , 3 . (12) Using ( 12 ), we update Γ 1 , Γ 2 , and Γ 3 sequentially from their full conditional distributions, each conditioned on all remaining parameters. Before deriving the full conditionals in the second block, we restructure the model in ( 4 ) using ( 5 ) and identities based on the Khatri-Rao product ( K olda and Bader , 2009 ). Let X ij ( d ) and B ( d ) respecti vely denote the mode- d matricization of the tensors X ij and B . Then, lev eraging the CP decomposition ( 5 ), we can express the mode-wise matricizations of B in terms of the mode-specific factor matrices as follo ws B (1) = B 1 ( B 3 ⊙ B 2 ) ⊤ , B (2) = B 2 ( B 3 ⊙ B 1 ) ⊤ , B (3) = B 3 ( B 2 ⊙ B 1 ) ⊤ , (13) where B (1) ∈ R p 1 × p 2 p 3 , B (2) ∈ R p 2 × p 1 p 3 , and B (3) ∈ R p 3 × p 1 p 2 and the operator ⊙ denotes the Khatri-Rao product. For instance, B 3 ⊙ B 2 = [ β (1) 3 ⊗ β (1) 2 · · · β ( K ) 3 ⊗ β ( K ) 2 ] ∈ R p 3 p 2 × K , where β (1) 3 , β (1) 2 , . . . , β ( K ) 3 , β ( K ) 2 are defined in ( 5 ). Using ( 13 ), the marginal mean component in ( 4 ) satisfies ⟨X ij , B ⟩ = tr ( X ⊤ ij ( d ) B ( d ) ) = { vec ( X ij ( d ) B − d ) } ⊤ ˜ β d , ˜ β d = vec ( B d ) , d = 1 , 2 , 3 , (14) where B − 1 = B 3 ⊙ B 2 , B − 2 = B 3 ⊙ B 1 and B − 3 = B 2 ⊙ B 1 . W e re-express ( 4 ) using ( 14 ) as y ij = { vec ( X ij ( d ) B − d ) } ⊤ ˜ β d + ˜ z ⊤ ij Γ ∗ ˜ d i + ϵ ij , i = 1 , . . . , n, j = 1 , . . . , m i . (15) W e marginalize ov er ˜ d i s in ( 15 ) and deri ve the full conditional distribution of ( B 1 , B 2 , B 3 , τ 2 ) giv en (Γ 1 , Γ 2 , Γ 3 ) in the second block. After marginalization, ( 15 ) reduces to the following weighted regression model y i ∼ N m i ( ˜ X i ˜ β d , τ 2 C i ) , C i = V y i ,y i = ˜ Z i Γ ∗ R ∗ R ∗⊤ Γ ∗⊤ ˜ Z ⊤ i + I m i , i = 1 , . . . , n, (16) where ˜ X i ∈ R m i × K p d and { vec ( X ij ( d ) B − d ) } ⊤ is the j -th row of ˜ X i . W e scale y i and ˜ X i to obtain y ∗ i = C − 1 / 2 i y i and ˜ X ∗ i = C − 1 / 2 i ˜ X i , where C − 1 / 2 i is the square root of C − 1 i . Finally , we stack y ∗ i s and ˜ X ∗ i s 8 ro w-wise to obtain y ∗ ∈ R N and X ∗ B d ∈ R N × K p d , respecti vely , and obtain the following regression model y ∗ = X ∗ B d ˜ β d + ϵ ∗ , ϵ ∗ ∼ N (0 , τ 2 I N ) . (17) The mode-structured Horseshoe prior in ( 6 ) and the Gaussian likelihood in ( 17 ) yield the following full conditional distribution of the mode- d margins of B : ˜ β d ∼ N (Σ B d X ∗⊤ B d y ∗ ,τ 2 Σ B d ) , Σ B d = X ∗⊤ B d X ∗ B d + n diag ( δ 2 1 Λ 1 d , . . . , δ 2 K Λ K d ) o − 1 − 1 , (18) where Λ g d = diag ( λ 2 g d 1 , . . . , λ 2 g dp d ) for d = 1 , 2 , 3 and g = 1 , . . . , K ; therefore, after marginalization with respect to the compressed core random-effects, we use ( 18 ) to sequentially update the vectorized mean factor matrices ˜ β 1 , ˜ β 2 and ˜ β 3 , conditional on the observed data and all the remaining parameters. The second block updates are finished by updating τ 2 and the local and global shrinkage parameters, λ 2 g d j s and δ g s, given the observed data, factor margins ( B 1 , B 2 , B 3 ) , and compressed factors (Γ 1 , Γ 2 , Γ 3 ) . The vectorized factor margins ˜ β 1 , ˜ β 2 and ˜ β 3 yield B using the CP structure in ( 5 ). Giv en B and (Γ 1 , Γ 2 , Γ 3 ) , the Gaussian likelihood in ( 7 ) implies that the full conditional distrib ution of τ 2 is in verse-gamma. Exploit- ing a parameter-e xpanded representation of the half-Cauchy prior in ( 6 ), we obtain closed-form full condi- tional distributions for these shrinkage parameters, along with the associated auxiliary variables introduced through the reparameterization. Detailed deriv ations of these conditional updates are provided in Section C of the supplementary material. Algorithm 1 summarizes the overall sampling scheme including the analytic forms of the full conditional distributions. Gi ven the posterior samples of the CoMET model’ s parameters, posterior prediction for new subjects proceeds as follows. Let ( B ( t ) , τ 2( t ) , Γ ( t ) 1 , Γ ( t ) 2 , Γ ( t ) 3 ) denote the marginal parameter chain at the t -th iteration of Algorithm 1 . For a test subject with m ∗ observ ations and cov ariates ( X new , Z new ) , the posterior predictiv e distribution at iteration t is y ( t ) new ∼ N ( X new β ( t ) , τ 2( t ) ( Z new S ∗⊤ Γ ∗ ( t ) R ∗ R ∗⊤ Γ ∗ ( t ) ⊤ S ∗ Z ⊤ new + I m ∗ )) , (19) where β ( t ) = vec ( B ( t ) ) and Γ ∗ ( t ) = Γ ( t ) 3 ⊗ Γ ( t ) 2 ⊗ Γ ( t ) 1 , and R ∗ and S ∗ consist of the same random projection matrices used during posterior sampling of the parameters. Finally , we av erage over these mar ginal posterior predicti ve draws to obtain point estimates of the test response. For fixed-ef fects selection, we use the marginal chain ( B j 1 j 2 j 3 ) ∞ t =1 to construct cell-wise credible inter - v als. These intervals are used for uncertainty quantification at a desired nominal lev el. Additionally , we use the sequential 2-means algorithm ( Li and Pati , 2017 ) to perform fixed-effects selection. Applying this pro- cedure on the mar ginal chain ( B j 1 j 2 j 3 ) ∞ t =1 partitions the fixed-ef fect coef ficient tensor cells into two clusters corresponding to zero (inacti ve) and non-zero (activ e) cells. The selected fixed-ef fects corresponds to the indices of the non-zero cells. 9 Algorithm 1 Collapsed Gibbs sampler for CoMET 1. Set k d = O (log(max d ( q d ))) , K = O (log(max d ( p d ))) , a 0 = b 0 = 0 . 01 , σ 2 d = 1 for d = 1 , 2 , 3 . 2. Draw R d = (( r ij )) , r ij iid ∼ N (0 , 1 /k d ) and S d = (( s ij )) , s ij iid ∼ N (0 , 1 /k d ) , independently for d = 1 , 2 , 3 . 3. Initialize ( ˜ β (0) 1 , ˜ β (0) 2 , ˜ β (0) 3 , τ 2(0) , γ (0) 1 , γ (0) 2 , γ (0) 3 ) . For superscript t = 1 , 2 , . . . , ∞ , the t -th iteration of the Gibbs sampler cycles through the follo wing steps. (a) Given ( ˜ β ( t − 1) 1 , ˜ β ( t − 1) 2 , ˜ β ( t − 1) 3 , τ 2( t − 1) , γ ( t − 1) 1 , γ ( t − 1) 2 , γ ( t − 1) 3 ) , draw d ( t ) i ’ s using ( 9 ), indepen- dently for i = 1 , . . . , n . (b) Given ( d ( t ) 1 , . . . , d ( t ) n ) and ( ˜ β ( t − 1) 1 , ˜ β ( t − 1) 2 , ˜ β ( t − 1) 3 , τ 2( t − 1) ) , use ( 12 ) to sample γ ( t ) d gi ven ( γ ( t ) 1 , . . . , γ ( t ) d − 1 , γ ( t − 1) d +1 , . . . , γ ( t − 1) 3 ) , sequentially for d = 1 , 2 , 3 . (c) Given ( ˜ β ( t ) 1 , . . . , ˜ β ( t ) d − 1 , ˜ β ( t − 1) d +1 , . . . , ˜ β ( t − 1) 3 , τ 2( t − 1) , γ ( t ) 1 , γ ( t ) 2 , γ ( t ) 3 ) , use ( 15 )-( 18 ) sequentially for d = 1 , 2 , 3 to dra w i. ˜ β ( t ) d ∼ N (Σ B d X ∗⊤ B d y ∗ , τ 2( t − 1) Σ B d ) , ii. λ 2( t ) g d j ∼ I G 1 , 1 ν ( t − 1) gd j + β 2( g )( t ) d j 2 τ 2( t − 1) δ 2( t − 1) g , and ν ( t ) g d j ∼ I G 1 , 1 + 1 λ 2( t ) gd j , g = 1 , . . . , K , j = 1 , . . . , p d . (d) Given ( ˜ β ( t ) 1 , ˜ β ( t ) 2 , ˜ β ( t ) 3 , γ ( t ) 1 , γ ( t ) 2 , γ ( t ) 3 ) , for g = 1 . . . , K , draw δ 2( t ) g ∼ I G 1 + P 3 d =1 p d 2 , 1 ξ ( t − 1) g + 1 2 τ 2( t − 1) 3 X d =1 p d X j =1 β 2( g )( t ) d j λ 2( t ) g d j , and ξ ( t ) g ∼ I G 1 , 1 + 1 δ 2( t ) g ! (e) Given ( ˜ β ( t ) 1 , ˜ β ( t ) 2 , ˜ β ( t ) 3 , γ ( t ) 1 , γ ( t ) 2 , γ ( t ) 3 ) , compute β ( t ) = vec ( B ( t ) ) using ( 5 ) and sample τ 2( t ) ∼ I G a 0 + N + K P 3 d =1 p d 2 , b 0 + 1 2 ( y ∗ − X ∗ β ( t ) ) ⊤ ( y ∗ − X ∗ β ( t ) ) + K X g =1 3 X d =1 β 2( g )( t ) d j δ 2( t ) g λ 2( t ) g d j . 3 Theor etical Properties In this section, we examine the asymptotic behavior of mean square prediction risk of the CoMET model. Our approach is grounded in the (matrix-variate) methodology introduced by Sarkar et al. ( 2025 ). Here, we generalize those ideas by formulating and analyzing their tensor-v ariate counterparts. As emphasized in Sarkar et al. ( 2025 ), deri ving high-dimensional asymptotic properties for posterior distrib utions in Bayesian mixed-ef fects models is a very difficult problem that has received limited attention in the literature. The tensor-v ariate setting considered here introduces an additional layer of comple xity . Nonetheless, under a set of reasonable simplifying assumptions, we establish asymptotic results that offer both theoretical support and insight into the proposed methodology . W e focus on third-order tensor cov ariates without any loss of generality , noting that our results directly 10 extend to tensor co variates of any order . For this ev aluation, we consider a setting where the (marginalized) true data generating model for the i -th subject is gi ven by y i = X i β 0 + ϵ 0 i , ϵ 0 i ∼ N m i (0 , τ 2 0 V 0 i ) , V 0 i = Z i (Σ 0 3 ⊗ Σ 0 2 ⊗ Σ 0 1 ) Z ⊤ i + I m i , i = 1 , . . . , n, (20) where B 0 , τ 2 0 and Σ 0 = Σ 0 3 ⊗ Σ 0 2 ⊗ Σ 0 1 denote the "true" parameter v alues, β 0 = vec ( B 0 ) , and y i = y i 1 . . . y im i ∈ R m i , X i = vec ( X i 1 ) ⊤ . . . vec ( X im i ) ⊤ ∈ R m i × p ∗ , Z i = vec ( Z i 1 ) ⊤ . . . vec ( Z im i ) ⊤ ∈ R m i × q ∗ , (21) with p ∗ = p 1 p 2 p 3 , q ∗ = q 1 q 2 q 3 , k ∗ = k 1 k 2 k 3 . On the other hand, the (marginalized) working compressed model for the i -th subject is gi ven by y i = X i β + ϵ ′ i , ϵ ′ i ∼ N m i (0 , τ 2 0 C i ) , C i = Z i S ∗⊤ Γ ∗ R ∗ R ∗⊤ Γ ∗⊤ S ∗ Z ⊤ i + I m i , i = 1 , . . . , n, (22) where S ∗ = S 3 ⊗ S 2 ⊗ S 1 ∈ R k ∗ × q ∗ , R ∗ = R 3 ⊗ R 2 ⊗ R 1 ∈ R k ∗ × q ∗ , Γ ∗ = Γ 3 ⊗ Γ 2 ⊗ Γ 1 ∈ R k ∗ × k ∗ , β = vec ( B ) ∈ R p ∗ . (23) W e establish the asymptotic decay of CoMET’ s prediction risk under compressed covariance structure with an unstructured fixed-ef fect coefficient tensor . In particular, we avoid the CP structure for B in ( 5 ) and assume that B is full-rank for the purposes of this theoretical ev aluation. Consequently , the working model assigns element-wise Horseshoe priors for vec ( B ) , giv en by B j 1 j 2 j 3 | λ 2 j 1 j 2 j 3 , δ 2 , τ 2 ∼ N (0 , λ 2 j 1 j 2 j 3 δ 2 τ 2 ) , λ j 1 j 2 j 3 ∼ C + (0 , 1) , δ ∼ C + (0 , 1) , (24) independently for j d = 1 , . . . , p d and d = 1 , 2 , 3 . The squared global shrinkage parameter δ 2 promotes the ov erall sparsity in B and λ 2 j 1 j 2 j 3 controls cell-specific shrinkage. The priors for the other parameters in the working model are identical to those prescribed in Section 2.2 . Define C = diag( C 1 , . . . , C n ) , y ∈ R N with i -th row block y i , and X ∈ R N × p ∗ with i -th row block X i . Then, the compressed conditional posterior density of β given Λ , δ 2 , C (under the working model) is gi ven by β | Λ , δ 2 , C, y , X ∼ N { X ⊤ C − 1 X + ( δ 2 Λ) − 1 } − 1 X ⊤ C − 1 y , τ 2 0 { X ⊤ C − 1 X + ( δ 2 Λ) − 1 } − 1 , (25) where Λ = diag( λ 2 111 , λ 2 211 , . . . , λ 2 ( p 1 − 1) p 2 p 3 , λ 2 p 1 p 2 p 3 ) . The prediction risk of the compressed posterior based on the prior in ( 24 ) is 1 N E ∥ X β 0 − X ¯ β ( ϕ ) ∥ 2 2 = 1 N E R,S,X,Z E y { E ϕ | y ∥ X β 0 − X ¯ β ( ϕ ) ∥ 2 2 } , (26) 11 where the conditional posterior mean of β in ( 25 ) is denoted as ¯ β ( ϕ ) with ϕ = { Γ ∗ , Λ , δ 2 } , E R,S,X,Z , E y , and E ϕ | y respecti vely denote the expectations with respect to the distrib utions of ( R 1 , R 2 , R 3 , S 1 , S 2 , S 3 , X , Z 1 , . . . , Z n ) , y , and the conditional distribution of ϕ gi ven y , respectively . W e now describe the regularity assumptions needed for deriving the theoretical guarantees in the current frame work where the cov ariance parameter is compressed, but B is assumed to be full-rank. (A1) The error variance τ 2 is known and equals the true v alue τ 2 0 . The squared local shrinkage parameter λ 2 j 1 j 2 j 3 is supported on a compact domain [ a, 1 /a ] for a univ ersal constant a . (A2) The support for the Gaussian prior on γ d is restricted to the set { Γ d ∈ R k d × k d : ∥ Γ d ∥ ≤ b d } , where b d is a univ ersal constant for d = 1 , 2 , 3 , and ∥ · ∥ is the operator norm of a matrix. Consequently , using the fact that ∥ A ⊗ B ∥ = ∥ A ∥∥ B ∥ for any two matrices A and B , Γ ∗ belongs to a class of matrices G with bounded operator norm, i.e., G = { Γ ∗ ∈ R k ∗ × k ∗ : ∥ Γ ∗ ∥ ≤ b ∗ } , where b ∗ = b 1 b 2 b 3 . (A3) The entries of the tensor cov ariates X ij and Z ij are mutually independent Gaussian random v ariables with mean zero and variance σ 2 X and σ 2 Z , respectiv ely , where σ 2 X is a constant, and σ 2 Z satisfies nσ 4 Z Q 3 d =1 q 6 d /k 4 d + Q 3 d =1 m 2 max /k 4 d = O (1) , with m max = max( m 1 , . . . , m n ) . Assumption (A1) simplifies the setup by considering the error v ariance to be kno wn and the local shrink- age parameters to belong to a compact domain. Assumption (A2) models the mode-specific cov ariance structures as low-rank matrices through controlling the "sparsity" of the compressed cov ariance parameters Γ d s. Finally , Assumption (A3) specifies the distribution of the fixed- and random-ef fect covariates and fa- cilitates the deri vation of the mean square prediction risk, av eraged over the distributions of X ij s and Z ij s. Based on these assumptions, Theorem 3.1 quantifies the asymptotic behavior of the prediction risk under cov ariance compression. Theorem 3.1 If the assumptions (A1)-(A3) hold, p ∗ = o ( N ) , k ∗ 2 log k ∗ = o ( p ∗ ) , k ∗ 2 log log N = o ( p ∗ ) and ∥ β 0 ∥ 2 = o ( N ) , then the posterior pr edictive risk satisfies 1 N E ∥ X β 0 − X ¯ β ( ϕ ) ∥ 2 2 ≤ E X κ 4 ( X ) " 2 ∥ β 0 ∥ 2 2 N ( O nb ∗ 8 σ 8 Z 3 Y d =1 q 12 d k 8 d + 3 Y d =1 m 4 max k 8 d ! + nb ∗ 8 σ 8 Z !) + 4 τ 2 0 a 4 ( N − p ∗ N log N O nb ∗ 5 σ 6 Z 3 Y d =1 q 9 d k 6 d + 3 Y d =1 m 3 max k 6 d !! + p ∗ + 4 e − p ∗ / 8 N ! O nb ∗ 3 σ 4 Z 3 Y d =1 q 6 d k 4 d + 3 Y d =1 m 2 max k 4 d !! )# = o (1) , wher e κ ( X ) denotes the condition number of X . Theorem 3.1 justifies the practical utility of the CoMET model. It shows that the mode-specific com- pression dimensions ( k 1 , k 2 , k 3 ) can be chosen such that k ∗ ≪ p ∗ and k ∗ ≪ N while still yielding asymp- totically negligible predictiv e risk. These dimensions control the complexity of the covariance compression, 12 and computational tractability requires k d ≪ q d for d = 1 , 2 , 3 . In the random-slope setting we consider , q d ≤ p d for each mode d and q d = p d when Z ij uses the same tensor features as X ij ; therefore, choosing k d ≪ q d implies that k d ≪ p d , which satisfies the assumptions of the theorem. The proof of Theorem 3.1 is gi ven in Section A of the supplementary material. W e establish Theorem 3.1 under the simplified assumption that the fixed-ef fect coef ficient tensor B is unstructured. A natural extension would quantify predictive risk in terms of the CP-rank K of B , in addition to N , n , and p d , q d , k d for d = 1 , 2 , 3 . Proving such a result would require non-trivial extensions of the arguments used for Theorem 3.1 , and we leav e this analysis to future work. W e, howe ver , conjecture that an analogous result holds because our CoMET implementation combines cov ariance compression with shrinkage on a lo w-rank CP decomposition of B (see Algorithm 1 ), and the empirical results in the next section sho w strong performance in estimation accuracy , prediction, and uncertainty calibration. 4 Simulated Data Analyses 4.1 Setup W e ev aluated the CoMET model’ s empirical performance in simulations with tw o-way tensors ( D = 2 ). W e set p d = q d = 32 for d = 1 , 2 and generated B ∈ R 32 × 32 from the CP representation ( 5 ) with rank K = 4 . The factor matrices B d ∈ R 32 × 4 were generated by sampling ⌈ 0 . 25 p 1 K ⌉ entries of B 1 and ⌈ 0 . 25 p 2 K ⌉ entries of B 2 from {− 2 , − 1 , 1 , 2 } with replacement. All the remaining B 1 and B 2 entries are set to zero. For the random-effects, we used a separable cov ariance with an equicorrelation structure in each mode. Specifically , for d = 1 , 2 , we set (Σ d ) j j ′ = 0 . 5 for any j, j ′ ∈ { 1 , . . . , q d } if j = j ′ and (Σ d ) j j = 1 for any j ∈ { 1 , . . . , q d } . This full-rank mode-specific cov ariance structure allowed us to assess the performance of quasi-likelihood methods, including CoMET , that used low-rank co variance approximations. Finally , the idiosyncratic error v ariance was τ 2 = 0 . 1 . Using these parameters, we simulated the clustered data using ( 1 ) for n = 100 subjects with balanced cluster sizes m 1 = · · · = m n = m ∈ { 3 , 6 , 9 , 12 } . The entries of X ij s and Z ij s were independently generated from N (0 , 1) distrib ution. Each of these settings with four different sample sizes were replicated 25 times. An independent validation set of n ∗ = 50 new subjects was generated corresponding to each of these training datasets to assess the predicti ve performance. W e applied the CoMET model to the simulated data using Algorithm 1 and examined its sensitivity to dif ferent choices of fixed-effect ranks and cov ariance compression dimensions. For simplicity , we imposed the same compression dimensions across all modes, by setting k 1 = k 2 = k and varied k ∈ { log (32) ≈ 3 , 6 , 9 } and CP-rank K ∈ { 1 , 2 , 4 , 6 , 8 } . These design choices aligned with lo w-rank structural assumptions of CoMET . For a weakly informativ e prior specification, the hyperparameters in ( 6 ) were set as a 0 = b 0 = 0 . 01 and σ 2 d = 1 , for all d . W e ran the Gibbs sampler described in Algorithm 1 for 11,000 iterations and discarded the first 1,000 iterations as burn-in. W e compared the CoMET model against an oracle variant of CoMET (oracle), and penalized com- petitors based on quasi-likelihood (PQL) ( Fan and Li , 2012 ; Li et al. , 2022 ), and generalized estimating equations (GEE) ( Zhang et al. , 2019 ). The oracle fixes the cov ariance components in ( 1 ) at their true val- 13 ues and varies the CP-rank K of B . For each choice of K , the oracle draws ( B , τ 2 ) using Algorithm 1 while treating the cov ariance components as known. The oracle’ s performance serves as a benchmark for e valuating the impact of cov ariance misspecification in the CoMET model across different choices of K . The PQL methods have two v ariants, PQL-1 and PQL-2. W e applied them after vectorizing the fixed- and random-effects cov ariates in ( 1 ). PQL-1 approximates the q ∗ × q ∗ random-ef fects cov ariance matrix Σ = Σ 2 ⊗ Σ 1 using log ( N ) I nq ∗ as its proxy ( Fan and Li , 2012 ). In contrast, PQL-2 selects the scaling factor by cross-validation and incorporates a debiasing step for estimating B ( Li et al. , 2022 ). Follo wing Li et al. ( 2022 ), we set the penalty parameter for PQL-2 as λ = ˆ τ { log ( p ∗ ) / N } 1 / 2 , where ˆ τ is estimated using the scaled lasso ( Sun and Zhang , 2012 ). PQL-1 has no debiasing step, so we follow the PQL-2 method for debiasing B estimates and constructing confidence intervals using the penalty parameter that minimizes the cross-v alidation error (i.e., λ = λ min ). Finally , PQL methods are unaffected by the choices of k and K because they v ectorize the cov ariates and do not exploit the lo w-rank tensor structure. W e implemented the GEE approach using the Sparsereg MA TLAB package ( Zhou and Gaines , 2017 ) with an equicorrelation matrix as the working correlation structure for the mar ginal error term, together with a lasso penalty for estimating B . The tuning parameter in volv ed in penalization was chosen through cross- v alidation. Because this penalized GEE approach does not incorporate a debiasing procedure, we excluded it from the confidence interv al comparisons. Similar to the PQL methods, GEE’ s performance is unaf fected by the choices of k and K . W e compared the fi ve methods using metrics for fixed-ef fects estimation and inference and out-of- sample prediction. Fixed-ef fects estimation accuracy was assessed via the root mean square error (RMSE) of B , and inference was assessed using the empirical coverage and mean width of 95% credible or confi- dence intervals. The out-of-sample predicti ve accurac y w as assessed using the root mean squared prediction error (RMSPE). Specifically , RMSE( ˆ B ) = ( ∥B − ˆ B ∥ 2 F p ∗ ) 1 / 2 , RMSPE( ˆ y ) = 1 n ∗ n ∗ X i =1 1 m i m i X j =1 ( y ∗ ij − ˆ y ij ) 2 1 / 2 , (27) where ∥ · ∥ F denotes the Frobenius norm, y ∗ ij and ˆ y ij are the true and predicted j -th responses for test subject i , and n ∗ is the number of test subjects. A point estimate of B is denoted as ˆ B , which equals the posterior median for oracle and CoMET , and the regularized estimator for the PQL-1, POL-2, and GEE methods. Finally , we assessed posterior predictiv e uncertainty quantification by comparing CoMET and oracle in terms of the empirical cov erage and mean width of their 95% prediction intervals. 4.2 Empirical Results The CoMET model outperformed its penalized competitors in prediction and estimation of B for e very choice of CP-rank K and sample size when the compressed cov ariance dimension was fixed at k = 3 (Figure 1 ). In the small-sample regime ( m = 3 , 6 ), CoMET achiev ed lower RMSE and RMSPE than PQL- 1, PQL-2, and GEE methods, and closely matched the oracle benchmark across all choices of K . For lar ger sample sizes ( m = 9 , 12 ), PQL-1 outperformed CoMET and the oracle when K = 1 , b ut the performance 14 of CoMET and the oracle improved as K increased. CoMET’ s relativ ely poor performance at K = 1 is consistent with bias due to underspecification of the CP-rank of B . These findings are robust to the choice of compression dimension, with similar conclusions holding for k = 6 and k = 9 ; see Section B of the supplementary material. CoMET’ s strong performance despite the cov ariance misspecification highlights the ef fectiveness of its compression strate gy for both fixed-ef fect estimation and prediction. The credible interv als for B in the oracle and CoMET methods attain nominal coverage when the CP- rank K is suf ficiently large (Figure 2 ). When K is underspecified (i.e., K = 1 , 2 ), the credible intervals for both methods exhibit undercov erage. In contrast, for moderate CP-ranks (i.e., K = 4 , 6 , 8 ), CoMET achie ves near-nominal coverage and yields substantially narrower intervals than the debiased PQL-1 and PQL-2 estimators, while retaining a similar performance to the oracle. These patterns hold for higher sample sizes and cov ariance compression dimensions; see Section B of the supplementary material for results with k = 6 and k = 9 . The oracle and CoMET ha ve comparable posterior predictiv e uncertainty quantification. Across all combinations of k , K , and m , CoMET’ s 95% prediction interv als attain near-nominal empirical cov erage, closely matching the oracle’ s performance (T able 1 ). F or small cov ariance compression dimensions (i.e., k = 3 ), the widths of prediction intervals obtained using the oracle and CoMET are nearly identical (Fig- ure 3 ). For larger compression dimensions (i.e., k = 6 , 9 ), CoMET’ s prediction intervals are slightly wider than oracle’ s, but the gap decreases as the CP-rank K of the fixed-ef fects coefficients increases. These re- sults demonstrate that CoMET provides calibrated predictiv e uncertainty and that moderate choices of K strike a fa vorable balance between prediction-interval width and nominal coverage across a broad range of sample sizes and compression dimensions. In summary , with appropriate choices of the covariance compression dimension k and the fixed-ef fects coef ficient’ s CP-rank K , CoMET outperforms existing penalized methods in both prediction and fixed- ef fects inference. For these metrics, CoMET closely matches the oracle’ s performance, ev en when the compression dimensions are small relative to the true dimension of the covariance components. The stability of these results across different values of m highlights CoMET’ s practical utility for fixed-effects inference and prediction when the random-ef fects covariance structure is unkno wn and high-dimensional. 5 Real Data Analyses W e applied CoMET to two publicly av ailable datasets, DEAM and LFW , introduced earlier . In the DEAM analysis, we predicted a song’ s emotion scores using matrix-valued acoustic features observed repeatedly ov er time. In the LFW analysis, we predicted a celebrity’ s facial traits from multiple f ace images represented as third-order tensor covariates. W e compared CoMET’ s predicti ve performance with PQL-1, PQL-2 and GEE methods, with no fixed-effects estimation comparisons due to the absence of the ground truth. W e did not include the oracle because the true cov ariance structure was unkno wn in these data. 15 0.9 1.0 1.1 1.2 1.3 1.4 1 2 4 6 8 K m = 3 0.50 0.75 1.00 1.25 1.50 1.75 1 2 4 6 8 K m = 6 1 2 3 1 2 4 6 8 K m = 9 0.5 1.0 1.5 2.0 1 2 4 6 8 K m = 12 Cov ariance Compression at k = 3 Root Mean Square Error 40 45 50 55 60 1 2 4 6 8 K m = 3 40 50 60 1 2 4 6 8 K m = 6 40 60 80 100 1 2 4 6 8 K m = 9 30 40 50 60 70 80 1 2 4 6 8 K m = 12 Oracle CoMET PQL−1 PQL−2 GEE Root Mean Square Prediction Error Figure 1: Comparison of RMSE and RMSPE, defined in ( 27 ). CoMET substantially outperforms existing penalized quasi-likelihood methods in estimation of B (RMSE) and out-of-sample prediction (RMSPE) across various choices of fixed-ef fect rank K and cluster sizes m ∈ { 3 , 6 , 9 , 12 } . Results are presented for compressed cov ariance dimension k = 3 , summarized ov er 25 replications. CoMET , the compressed mixed-ef fects tensor model; oracle, the oracle benchmark; PQL-1, the penalized quasi-likelihood approach of Fan and Li ( 2012 ); PQL-2, the penalized quasi-likelihood approach of Li et al. ( 2022 ); GEE, the penalized generalized estimating equations method of Zhang et al. ( 2019 ). 16 0.80 0.95 1 2 4 6 8 K m = 3 0.80 0.95 1 2 4 6 8 K m = 6 0.80 0.95 1 2 4 6 8 K m = 9 0.80 0.95 1 2 4 6 8 K m = 12 Cov ariance Compression at k = 3 Credible Interval Covera g e Probability 5 10 1 2 4 6 8 K m = 3 2 4 6 8 1 2 4 6 8 K m = 6 2 4 6 1 2 4 6 8 K m = 9 1 2 3 4 5 1 2 4 6 8 K m = 12 Oracle CoMET PQL−1 PQL−2 Credible Interval Width Figure 2: Fixed-ef fects inference comparisons. The CoMET model produces narrower credible intervals for B entries than the PQL methods when k = 3 and K ∈ { 4 , 6 , 8 } , along with achieving near-nominal coverage across all cluster sizes m ∈ { 3 , 6 , 9 , 12 } . All metrics are summarized ov er 25 replications. CoMET , the compressed mixed-ef fects tensor model; oracle, the oracle v ariant of CoMET ; PQL-1, the penalized quasi- likelihood approach of F an and Li ( 2012 ); PQL-2, the penalized quasi-likelihood approach of Li et al. ( 2022 ). GEE, the penalized generalized estimating equations approach of Zhang et al. ( 2019 ), is excluded because of absence of debiasing technique for confidence interv als construction. 17 T able 1: Comparison of the empirical cov erage of CoMET’ s and oracle’ s posterior predictiv e interv als. CoMET yields 95% prediction intervals with near-nominal empirical coverage across all choices of com- pressed cov ariance dimension ( k ) and fixed-effect coefficient’ s rank ( K ) for various cluster sizes ( m ), and closely matches the oracle’ s performance. Reported v alues are the median coverage probability ov er 25 replications, with subscripts indicating the corresponding quartile de viation. k Cluster Sizes K 1 2 4 6 8 Oracle CoMET Oracle CoMET Oracle CoMET Oracle CoMET Oracle CoMET 3 m = 3 0 . 96 0 . 01 0 . 95 0 . 01 0 . 95 0 . 01 0 . 96 0 . 01 0 . 95 0 . 02 0 . 95 0 . 02 0 . 94 0 . 01 0 . 94 0 . 01 0 . 94 0 . 01 0 . 93 0 . 02 m = 6 0 . 96 0 . 01 0 . 95 0 . 01 0 . 96 0 . 01 0 . 96 0 . 01 0 . 95 0 . 01 0 . 96 0 . 02 0 . 95 0 . 02 0 . 95 0 . 02 0 . 95 0 . 01 0 . 95 0 . 02 m = 9 0 . 96 0 . 01 0 . 95 0 . 01 0 . 96 0 . 01 0 . 95 0 . 01 0 . 95 0 . 01 0 . 94 0 . 01 0 . 95 0 . 01 0 . 95 0 . 01 0 . 95 0 . 01 0 . 95 0 . 01 m = 12 0 . 96 0 . 00 0 . 95 0 . 00 0 . 96 0 . 01 0 . 95 0 . 01 0 . 95 0 . 01 0 . 95 0 . 01 0 . 95 0 . 01 0 . 95 0 . 01 0 . 95 0 . 01 0 . 95 0 . 01 6 m = 3 0 . 96 0 . 01 0 . 95 0 . 01 0 . 95 0 . 01 0 . 95 0 . 01 0 . 95 0 . 02 0 . 95 0 . 02 0 . 94 0 . 01 0 . 95 0 . 02 0 . 94 0 . 01 0 . 95 0 . 02 m = 6 0 . 96 0 . 01 0 . 97 0 . 01 0 . 96 0 . 01 0 . 96 0 . 01 0 . 95 0 . 01 0 . 96 0 . 01 0 . 95 0 . 02 0 . 95 0 . 01 0 . 95 0 . 01 0 . 95 0 . 01 m = 9 0 . 96 0 . 01 0 . 96 0 . 01 0 . 96 0 . 01 0 . 96 0 . 01 0 . 95 0 . 01 0 . 96 0 . 01 0 . 95 0 . 01 0 . 96 0 . 01 0 . 95 0 . 01 0 . 96 0 . 01 m = 12 0 . 96 0 . 00 0 . 95 0 . 00 0 . 96 0 . 01 0 . 96 0 . 01 0 . 95 0 . 01 0 . 96 0 . 00 0 . 95 0 . 01 0 . 95 0 . 01 0 . 95 0 . 01 0 . 96 0 . 01 9 m = 3 0 . 96 0 . 01 0 . 95 0 . 02 0 . 95 0 . 01 0 . 95 0 . 02 0 . 95 0 . 02 0 . 95 0 . 02 0 . 94 0 . 01 0 . 95 0 . 01 0 . 94 0 . 01 0 . 95 0 . 02 m = 6 0 . 96 0 . 01 0 . 96 0 . 01 0 . 96 0 . 01 0 . 96 0 . 01 0 . 95 0 . 01 0 . 95 0 . 01 0 . 95 0 . 02 0 . 95 0 . 01 0 . 95 0 . 01 0 . 95 0 . 01 m = 9 0 . 96 0 . 01 0 . 96 0 . 01 0 . 96 0 . 01 0 . 96 0 . 01 0 . 95 0 . 01 0 . 95 0 . 01 0 . 95 0 . 01 0 . 95 0 . 01 0 . 95 0 . 01 0 . 95 0 . 01 m = 12 0 . 96 0 . 00 0 . 99 0 . 00 0 . 96 0 . 01 0 . 98 0 . 00 0 . 95 0 . 01 0 . 98 0 . 00 0 . 95 0 . 01 0 . 98 0 . 01 0 . 95 0 . 01 0 . 97 0 . 01 1.02 1.03 1.04 1.05 1.06 1 2 4 6 8 K m = 3 1.00 1.04 1.08 1.12 1 2 4 6 8 K m = 6 0.95 1.00 1.05 1.10 1 2 4 6 8 K m = 9 1.0 1.1 1.2 1 2 4 6 8 K m = 12 k 3 6 9 Mean Relative Width of Prediction Intervals Figure 3: Posterior predictiv e interval widths of CoMET relati ve to those of the oracle. The 95% prediction interv als produced by CoMET are comparable in width to those by the oracle benchmark for all choices of cluster size ( m ), cov ariance compression dimension ( k ), and fixed-effect rank ( K ). For each replication, relati ve width is computed by dividing the width of a prediction interval of CoMET by that of oracle. Across 25 replicates, the relati ve widths show minimal v ariability with standard deviations on the order of 10 − 2 . 18 5.1 Music Emotion Recognition using DEAM Data Understanding human emotion perception through musical acoustics is a key problem in music emotion recognition. The DEAM data is one of the largest publicly av ailable data in this domain, comprising emotion annotations for 1802 songs spanning a wide range of genres ( Aljanaki et al. , 2017 ). For benchmarking the methods under consideration, we used the first 200 songs from DEAM’ s 2014 e valuation set. Each selected song is accompanied by time-varying annotations of two kinds of emotions: valence and arousal. V alence reflects the degree of positiv e or negati ve emotion expressed in the song, and arousal cap- tures the percei ved energy of the song. These av eraged dynamic annotations, generated at a 2Hz sampling rate, are measured on a continuous scale of [ − 1 , 1] . The DEAM data also includes 260 features, compris- ing mean, standard deviation, and first-deriv ativ e summaries of acoustic characteristics (e.g., MFCCs and spectral and timbre features), computed o ver the interv al from 15 to 43 . 5 seconds at 0 . 5 second increments. W e used the first principal component of valence and arousal as the response, which captures the dom- inant emotion dimension. W e focused on the 12 spectral descriptors in the data because spectral dynamics are primary driv ers of perceiv ed emotion ( Panda et al. , 2023 ). W e represented them as a two-way tensor cov ariates . The first mode indexed the spectral descriptors (e.g., centroid, flux, harmonicity), and the sec- ond mode index ed four statistics: mean, standard deviation, mean of first-order deriv ativ es, and standard de viation of first-order deri vati ves. This resulted in matrix-valued fixed- and random-effects cov ariates with dimensions p 1 = q 1 = 12 and p 2 = q 2 = 4 . W e standardized each cov ariate entry across all observations to hav e mean zero and variance one. For each song, we averaged the response and cov ariates ov er pairs of consecuti ve 0 . 5 second timestamps, resulting in m = 29 repeated measurements per song. W e randomly assigned 70% of the songs ( n = 140 ) to the training set and held out the remaining 30% as the test set ( n ∗ = 60 ). W e repeated this train-test split 25 times to assess the stability of the results. W e used Algorithm 1 to fit the CoMET model and examined the sensitivity of its performance across v arious combinations of ( k , K ) . Because B is a 12 × 4 matrix, its maximum CP-rank is 4; therefore, we set K ∈ { log (12) ≈ 2 , 4 } . Cov ariance compression was applied symmetrically across the two modes with k d = k ∈ { 2 , 4 } for d = 1 , 2 . Follo wing the simulation studies, we set the hyperparameters as σ 2 d = 1 for d = 1 , 2 , and a 0 = b 0 = 0 . 01 , and ran the Gibbs sampler for 11,000 iterations, discarding the first 1,000 iterations as burn-in. The setup for the penalized competitors was kept identical to that described in the simulations; see Section 4 . CoMET achiev ed the lowest RMSPE relative to PQL-1 and PQL-2 across all choices of ( k , K ) (Fig- ure 4 ), demonstrating strong out-of-sample predictive performance and robustness to the choice of com- pression dimension and fixed-effects coef ficients rank. Compared to GEE, CoMET yielded competitive predicti ve accuracy for all ( k , K ) , while exhibiting greater stability across data splits. T o assess predic- ti ve uncertainty , we examined CoMET’ s 95% posterior predictiv e intervals across ( k , K ) and found that ( k , K ) = (4 , 4) yields the narrowest intervals while maintaining a median empirical cov erage of 0.96 (T a- ble 2 ). At ( k , K ) = (4 , 4) , the CoMET estimate of B suggests that the av erage spectral centroid is most predicti ve of the dominant percei ved emotion (Figure 5 ). PQL-1 and GEE estimated B with similar sparsity patterns. Compared to CoMET , the non-zero entries estimated by PQL-1 exhibit stronger shrinkage resulting in smaller magnitudes, whereas those from GEE ha ve lar ger magnitudes. On the other hand, PQL-2 shrinks 19 nearly e very entry of B to zero. In summary , DEAM data analysis results indicate that CoMET captures the repeated measure structure of the acoustic features to improve emotion prediction, provides well-calibrated predicti ve uncertainty , and identifies the key acoustic features predicti ve of the dominant emotion. 5.2 F acial T rait Recognition using LFW Data The LFW data is a benchmark repeated-measures dataset in face recognition applications ( Huang et al. , 2007 ; Learned-Miller et al. , 2016 ). The database comprises over 13,000 publicly av ailable images and 73 real-v alued facial attributes of 5,749 indi viduals ( Kumar et al. , 2009 ). Each image of the face of an individual is accompanied by sev eral attributes capturing a wide range of characteristics measured on a continuous scale, including facial e xpressions (e.g., smiling, fro wning), facial features (e.g., nose and mouth shape, hair color), imaging conditions (e.g., lighting type and blurriness), among others. Our objectiv e is to predict these facial characteristics based on one or more images a vailable per indi vidual. W e pre-processed the dataset in three steps. First, we extracted individuals with at least 4 and at most 10 images. This filtering ensures that the data is computationally manageable. The resultant dataset consists of N = 2421 images for n = 447 subjects with m i ∈ { 4 , . . . , 10 } . Second, we computed the first principal component of the 73 facial attributes to construct a scalar response as an interpretable summary while retaining the largest proportion of variability among these related attrib utes. Finally , we resized each 250 × 250 × 3 image into a 32 × 32 × 3 tensor using the R package ima ger , where the first two modes represent the spatial pixel locations and the third mode index es the red-green-blue (RGB) color channels. This yielded three-way tensor -valued fixed- and random-ef fect covariates with dimensions p 1 = p 2 = q 1 = q 2 = 32 and p 3 = q 3 = 3 . W e standardized each covariate entry across all observations to have mean zero and variance one. T o implement the CoMET model, we allowed the cov ariance compression to vary across the modes, reflecting the fact that not all the modes are high-dimensional in this scenario. Specifically , for the first two modes corresponding to pixels, we set the compression dimensions as k 1 = k 2 = k ∈ { log(32) ≈ 3 , 6 , 9 } , while retaining the original dimension for the third mode with k 3 = q 3 = 3 . For simplicity , we varied the fixed-ef fect CP-rank over the same grid, K ∈ { 3 , 6 , 9 } . Similar to Section 4 , we ran the Gibbs sampler for 11,000 iterations, discarding the first 1,000 iterations as burn-in with the same choices of hyperparameters for CoMET . The tuning parameters for the penalized methods were also kept unchanged. The equicorrelation structure failed to produce a valid cov ariance matrix for the LFW data, so we used the independent working correlation structure because GEE remains consistent under working correlation misspecification ( Zhang et al. , 2019 ). W e compared the out-of-sample predictiv e performance of these methods by randomly choosing 70% of the subjects ( n = 313) for model training and using the remaining 30% indi viduals ( n ∗ = 134) for validation. W e repeated this test-train split 25 times. Across combinations of the cov ariance compression dimension k and fixed-ef fects coefficient’ s CP- rank K , CoMET achiev ed predictiv e accuracy that was comparable or better than its penalized competitors (Figure 4 ). CoMET’ s 95% posterior predictive intervals also attained near -nominal empirical coverage across all ( k , K ) (T able 2 ). Among all the choices of ( k , K ) , ( k , K ) = (9 , 6) provided the most fav orable tradeof f between the predicti ve interv al width and cov erage, yielding the narro west prediction interv als 20 with empirical coverage closest to 0.95. CoMET with ( k , K ) = (9 , 6) also outperforms its competitors in predictiv e accuracy . T o interpret the B estimates, we examined the frontal slices of B corresponding to the RGB channels. F or each channel, the CoMET estimate for ( k , K ) = (9 , 6) assigns the largest signal to the central facial region, indicating that this region is most informativ e for predicting the facial attrib ute (Figure 6 ). In contrast, the PQL methods produce substantially sparser coefficient estimates, possibly due to over -penalization. GEE, on the other hand, yields comparativ ely denser estimates of the frontal slices of B than CoMET , while producing the largest signals in the central region, consistent with the pattern observed for CoMET . In summary , these results suggest that when ( k , K ) are low-to-moderate relative to the original tensor dimensions, CoMET achieves accurate prediction, provides reliable predictiv e uncertainty quantification, and identifies image regions predicti ve of facial traits. K = 2 K = 4 k = 2 k = 4 1.0 1.5 2.0 1.0 1.5 2.0 Methods DEAM Data K = 3 K = 6 K = 9 k = 3 k = 6 k = 9 2.5 3.0 3.5 4.0 4.5 2.5 3.0 3.5 4.0 4.5 2.5 3.0 3.5 4.0 4.5 Methods LFW Data CoMET PQL−1 PQL−2 GEE Root Mean Square Prediction Error Figure 4: Comparison of RMSPE, defined in ( 27 ), in real-data applications ( Left: DEAM data and Right: LFW data). The CoMET model demonstrates either competitiv e or superior predictiv e accuracy across all cov ariance compression dimensions ( k ) and fixed-ef fects rank ( K ) compared to the penalized methods, PQL-1 ( Fan and Li , 2012 ), PQL-2 ( Li et al. , 2022 ) and GEE ( Zhang et al. , 2019 ). Results are summarized ov er 25 random splits of each of the datasets. 6 Discussion The proposed compressed scalar-on-tensor mixed-model allo ws for se veral extensions beyond the setup in ( 4 ). For simplicity , we adopted a mode-wise cov ariance compression strategy in this work. Other tensor- structured projection strategies can be considered to simultaneously reduce the number of tensor modes and mode-specific dimensions ( Casarin et al. , 2025 ). Beyond Gaussian random matrices, alternativ e con- structions of the random projection matrices are possible, including sparse or structured random matrices comprising independent and identically distributed entries with mean zero and finite fourth-order moment ( Mukhopadhyay and Dunson , 2020 ). Additionally , we have used a single realization of the random pro- 21 T able 2: Results for empirical coverage probability and width of 95% prediction intervals produced by CoMET in real-data applications ( Left: DEAM data and Right: LFW data). CoMET yields well-calibrated posterior predictiv e interv als for v arying cov ariance compression dimensions ( k ) and fixed-ef fect ranks ( K ). Reported v alues are median coverage probability summarized over 25 random splits of each of the real datasets, with quartile de viation reported in subscript to assess the variability across splits. (a) DEAM data k K 2 4 Cov erage 2 0 . 96 0 . 01 0 . 96 0 . 01 4 0 . 95 0 . 01 0 . 95 0 . 01 Interval W idth 2 1 . 74 0 . 02 1 . 73 0 . 02 4 1 . 71 0 . 03 1 . 69 0 . 03 (b) LFW data k K 3 6 9 Coverage 3 0 . 93 0 . 01 0 . 93 0 . 01 0 . 93 0 . 01 6 0 . 94 0 . 01 0 . 95 0 . 01 0 . 95 0 . 02 9 0 . 94 0 . 01 0 . 95 0 . 01 0 . 95 0 . 01 Interval W idth 3 9 . 53 0 . 28 9 . 32 0 . 26 9 . 27 0 . 26 6 10 . 98 0 . 19 10 . 46 0 . 42 10 . 76 0 . 32 9 10 . 63 0 . 40 10 . 18 0 . 24 10 . 20 0 . 42 CoMET PQL−1 PQL−2 GEE 1 6 12 1 6 12 1 6 12 1 6 12 1 2 3 4 Col Row V alue −1 0 1 2 3 4 Figure 5: Estimated 12 × 4 matrix-valued fixed-ef fect coefficient B (transposed for visualization), av eraged ov er 25 random training splits of the DEAM dataset. CoMET , the compressed mixed-ef fects model for tensors; PQL-1, the penalized quasi-likelihood method of Fan and Li ( 2012 ); and PQL-2, the penalized quasi-likelihood approach of Li et al. ( 2022 ); GEE, the penalized generalized estimating equations approach of Zhang et al. ( 2019 ). jection matrices for computational scalability . The prediction risk of the CoMET model can be further improv ed by averaging o ver an ensemble of random projections ( Slawski , 2018 ). The CoMET model’ s compression strategy can be naturally e xtended to a semi-parametric mixed-model frame work accounting for the temporal dependencies, including those in the DEAM data. Consider the follo wing reformulation of the tensor mixed-effects model in ( 1 ) y ij = ⟨X ij , B ⟩ + ⟨Z ( t ij ) , A i ⟩ + ϵ ij , Z ( t ) = V X v =1 ϕ ( v ) 1 ( t ) ◦ · · · ◦ ϕ ( v ) D ( t ) , A i ⊥ ϵ ij , (28) where the random-effects covariate tensors Z ij = Z ( t ij ) s admit a rank- V CP structure with every v -th rank-one component constructed using basis expansions of the observed time points t ij s. The function ϕ ( v ) d ( · ) ∈ R q d denotes a user-specified basis expansion to model the mode- d cov ariance structure. This 22 CoMET PQL−1 PQL−2 GEE 1 8 16 24 32 1 8 16 24 32 1 8 16 24 32 1 8 16 24 32 1 8 16 24 32 Col Row V alue −0.5 0.0 0.5 (a) Slice 1 (Red Channel) CoMET PQL−1 PQL−2 GEE 1 8 16 24 32 1 8 16 24 32 1 8 16 24 32 1 8 16 24 32 1 8 16 24 32 Col Row V alue −0.2 0.0 0.2 0.4 (b) Slice 2 (Green Channel) CoMET PQL−1 PQL−2 GEE 1 8 16 24 32 1 8 16 24 32 1 8 16 24 32 1 8 16 24 32 1 8 16 24 32 Col Row V alue −0.4 −0.2 0.0 0.2 0.4 (c) Slice 3 (Blue Channel) Figure 6: Estimated frontal slices of 32 × 32 × 3 fixed-ef fect coefficient B , corresponding to each of the 3 color channels, averaged ov er 25 random training splits of the LFW dataset. CoMET , the compressed mixed-ef fects model for tensors; PQL-1, the penalized quasi-likelihood approach of Fan and Li ( 2012 ); and PQL-2, the penalized quasi-likelihood approach of Li et al. ( 2022 ); GEE, the penalized generalized estimating equations approach of Zhang et al. ( 2019 ). construction induces a smooth temporal dependence separable across different modes. As a result, CoMET’ s cov ariance compression strategy admits a straightforward extension to model temporally indexed tensor- v alued acoustic features in the DEAM data for improved performance in music emotion recognition. The compression paradigm introduced in this work naturally generalizes to a tensor -on-tensor mod- eling framework for multimodal applications. For instance, instead of reducing arousal and valence to a scalar response via their first principal component for the DEAM data (see Section 5.1 ), we can model the two-dimensional emotion to examine how dif ferent acoustic features are associated with specific emotion 23 dimensions. W e are extending the current frame work to accommodate such multiv ariate responses using a tensor-on-tensor mixed-ef fects model formulation based on the contracted tensor product ( K olda and Bader , 2009 ). Declaration of the use of generativ e AI and AI-assisted technologies During the preparation of this work the authors used ChatGPT in order to check for grammatical errors. After using this tool the authors revie wed and edited the content as necessary and take full responsibility for the content of the publication. Acknowledgement Sreya Sarkar was supported by the National Science Foundation grant DMS-1854667 for this work. Kshi- tij Khare’ s work in this project was partially supported by the National Science Foundation grant DMS- 2506059. San vesh Sriv astav a was partially supported by the National Science Foundation grant DMS- 2506058 and the National Institutes of Health grant R01 HD121993. An open-source implementation of CoMET is av ailable in the R package BayesCoMET ( https://github.com/SreyaSarkar21/ BayesCoMET ) Refer ences Aljanaki, A., Y ang, Y .-H., and Soleymani, M. (2017). De veloping a benchmark for emotional analysis of music. PloS one , 12(3):e0173392. Berger , J. O., Sun, D., and Song, C. (2020). Bayesian analysis of the cov ariance matrix of a multiv ariate normal distribution with a ne w class of priors. The Annals of statistics , 48(4):2381–2403. Bhattacharya, S., Khare, K., and Pal, S. (2022). Geometric ergodicity of Gibbs samplers for the Horseshoe and its regularized v ariants. Electronic J ournal of Statistics , 16(1):1 – 57. Carv alho, C., Polson, N., and Scott, J. (2010). The horseshoe estimator for sparse signals. Biometrika , 97(2):465–480. Casarin, R., Craiu, R., and W ang, Q. (2025). Compressed bayesian tensor regression. Chen, H., Raskutti, G., and Y uan, M. (2019). Non-conv ex projected gradient descent for generalized low- rank tensor regression. J ournal of Machine Learning Resear ch , 20(5):1–37. Fan, Y . and Li, R. (2012). V ariable selection in linear mixed ef fects models. Annals of Statistics , 40(4):2043. Guhaniyogi, R., Qamar, S., and Dunson, D. B. (2017). Bayesian tensor regression. Journal of Machine Learning Resear ch , 18(79):1–31. 24 Harville, D. (1997). Matrix algebra from a statistician’ s perspectiv e. Springer -V erlag Inc., New Y ork . Hof f, P . D. (2011). Separable cov ariance arrays via the T ucker product, with applications to multiv ariate relational data. Bayesian Analysis , 6(2):179 – 196. Huang, G. B., Ramesh, M., Berg, T ., and Learned-Miller, E. (2007). Labeled faces in the wild: A database for studying face recognition in unconstrained en vironments. T echnical Report 07-49, Univ ersity of Massachusetts, Amherst. Hultman, I. and Sriv astav a, S. (2025). Regularized parameter estimation in mixed model trace regression. arXiv pr eprint arXiv:2503.13782 . Khare, K., Sarkar , P ., and Sri v astava, S. (2025). Moments of the condition number of a wishart matrix under high-dimensional scaling. Preprint, Department of Statistics, Univer sity of Florida . K olda, T . G. and Bader , B. W . (2009). T ensor decompositions and applications. SIAM Revie w , 51(3):455– 500. Kumar , N., Berg, A. C., Belhumeur, P . N., and Nayar , S. K. (2009). Attrib ute and simile classifiers for face verification. In 2009 IEEE 12th International Confer ence on Computer V ision , pages 365–372. Learned-Miller , E., Huang, G. B., RoyCho wdhury , A., Li, H., and Hua, G. (2016). Labeled F aces in the W ild: A Survey , pages 189–248. Springer International Publishing. Li, H. and Pati, D. (2017). V ariable selection using shrinkage priors. Computational Statistics & Data Analysis , 107:107–119. Li, S., Cai, T . T ., and Li, H. (2022). Inference for high-dimensional linear mixed-ef fects models: A quasi- likelihood approach. Journal of the American Statistical Association , 117(540):1835–1846. Lock, E. F . (2018). T ensor-on-tensor regression. Journal of Computational and Graphical Statistics , 27(3):638–647. PMID: 30337798. Mukhopadhyay , M. and Dunson, D. B. (2020). T argeted random projection for prediction from high- dimensional features. Journal of the American Statistical Association , 115(532):1998–2010. Panda, R., Malheiro, R., and Pai va, R. P . (2023). Audio features for music emotion recognition: A surve y . IEEE T r ansactions on Affective Computing , 14(1):68–88. Peng, J., Lin, H., and Lian, H. (2025). T ensor train re gression with con vex regularization. Statistics , 0(0):1– 22. Raskutti, G., Y uan, M., and Chen, H. (2019). Conv ex regularization for high-dimensional multiresponse tensor regression. The Annals of Statistics , 47(3):1554 – 1584. Sarkar , S., Khare, K., and Sri vasta va, S. (2025). Bayesian compressed mixed-ef fects models. arXiv pr eprint arXiv:2507.16961 . 25 Slawski, M. (2018). On principal components regression, random projections, and column subsampling. Electr onic J ournal of Statistics , 12:3673–3712. Slawski, M., Li, P ., and Hein, M. (2015). Regularization-free estimation in trace regression with symmetric positi ve semidefinite matrices. Advances in neural information pr ocessing systems , 28. Song, Q. and Liang, F . (2023). Nearly optimal bayesian shrinkage for high-dimensional regression. Science China Mathematics , 66(2):409–442. Spencer , D., Guhaniyogi, R., and Prado, R. (2020). Joint bayesian estimation of vox el activ ation and inter- regional connecti vity in fmri experiments. Psychometrika , 85(4):845–869. Spencer , D. A., Gutierrez, R., Guhaniyogi, R., Shinohara, R. T ., Prado, R., and Initiativ e, A. D. N. (2025). Bayesian scalar-on-tensor regression using the tucker decomposition for sparse spatial modeling. Bio- statistics , 26(1):kxaf029. Sun, T . and Zhang, C.-H. (2012). Scaled sparse linear regression. Biometrika , 99(4):879–898. v an der Pas, S., Szabó, B., and van der V aart, A. (2017). Adapti ve posterior contraction rates for the horseshoe. Electr onic Journal of Statistics , 11(2):3196–3225. W ainwright, M. J. (2019). High-Dimensional Statistics: A Non-Asymptotic V iewpoint . Cambridge Series in Statistical and Probabilistic Mathematics. Cambridge Uni versity Press. W ang, K. and Xu, Y . (2024). Bayesian tensor-on-tensor regression with efficient computation. Stat Interface , 17(2):199–217. Y ue, X., Park, J. G., Liang, Z., and Shi, J. (2020). T ensor mixed ef fects model with application to nanoman- ufacturing inspection. T echnometrics , 62(1):116–129. Zhang, X., Li, L., Zhou, H., Zhou, Y ., Shen, D., et al. (2019). T ensor generalized estimating equations for longitudinal imaging analysis. Statistica Sinica , 29(4):1977. Zhao, J., Niu, L., and Zhan, S. (2017). T race regression model with simultaneously low rank and ro w(column) sparse parameter . Computational Statistics & Data Analysis , 116:1–18. Zhou, H. and Gaines, B. (2017). Matlab SparseRe g T oolbox V ersion 1.0.0 . https://hua- zhou. github.io/SparseReg . Zhou, H. and Li, L. (2014). Regularized matrix regression. Journal of the Royal Statistical Society Series B: Statistical Methodology , 76(2):463–483. Zhou, H., Li, L., and Zhu, H. (2013). T ensor regression with applications in neuroimaging data analysis. J ournal of the American Statistical Association , 108(502):540–552. PMID: 24791032. 26 Supplementary Material f or “CoMET : A Compr essed Bayesian Mixed-Effects Model f or High-Dimensional T ensors" A Theor etical Properties of Mean Square Prediction Risk of CoMET A.1 Proof of Theor em 3.1 Consider the setup for establishing the theoretical properties of the compressed mixed model for tensor cov ariates of order three, without an y loss of generality . Let B 0 , τ 2 0 and Σ 0 = Σ 0 3 ⊗ Σ 0 2 ⊗ Σ 0 1 denote the true v alues of the parameters. The mar ginalized true data generating model and working covariance compression model for the i -th subject are y i = X i β 0 + ϵ 0 i , ϵ 0 i ∼ N m i (0 , τ 2 0 V 0 i ) , V 0 i = Z i (Σ 0 3 ⊗ Σ 0 2 ⊗ Σ 0 1 ) Z ⊤ i + I m i , y i = X i β + ϵ ′ i , ϵ ′ i ∼ N m i (0 , τ 2 0 C i ) , C i = Z i S ∗⊤ Γ ∗ R ∗ R ∗⊤ Γ ∗⊤ S ∗ Z ⊤ i + I m i , i = 1 , . . . , n, (29) respecti vely , where we define y i = y i 1 . . . y im i ∈ R m i , X i = vec ( X i 1 ) ⊤ . . . vec ( X im i ) ⊤ ∈ R m i × p ∗ , Z i = vec ( Z i 1 ) ⊤ . . . vec ( Z im i ) ⊤ ∈ R m i × q ∗ , S ∗ = S 3 ⊗ S 2 ⊗ S 1 ∈ R k ∗ × q ∗ , R ∗ = R 3 ⊗ R 2 ⊗ R 1 ∈ R k ∗ × q ∗ , Γ ∗ = Γ 3 ⊗ Γ 2 ⊗ Γ 1 ∈ R k ∗ × k ∗ , β = vec ( B ) ∈ R p ∗ , β 0 = vec ( B 0 ) , p ∗ = p 1 p 2 p 3 , q ∗ = q 1 q 2 q 3 , k ∗ = k 1 k 2 k 3 . (30) W e now set forth the assumptions needed for deriving the theoretical guarantees. Let the error variance τ 2 be known and equals the true value τ 2 0 . The support for the Gaussian prior on γ d is restricted to the set { Γ d ∈ R k d × k d : ∥ Γ d ∥ ≤ b d } where b d is a univ ersal constant for d = 1 , 2 , 3 , and ∥ · ∥ is the operator norm of a matrix. Using the fact that ∥ A ⊗ B ∥ = ∥ A ∥∥ B ∥ for any two matrices A and B , we define the set of matrices G = { Γ ∗ ∈ R k ∗ × k ∗ : ∥ Γ ∗ ∥ ≤ b ∗ } , where b ∗ = b 1 b 2 b 3 . The entries of the tensors X ij and Z ij are mutually independent Gaussian random variables with mean zero and variance σ 2 X and σ 2 Z , respecti vely , where σ 2 X is a constant, and σ 2 Z satisfies nσ 4 Z Q 3 d =1 q 6 d /k 4 d + Q 3 d =1 m 2 max /k 4 d = O (1) , with m max = max( m 1 , . . . , m n ) . For simplicity , we assume that B is full-rank as discussed in the main manuscript, and assign Horseshoe prior directly on the elements of vec ( B ) as follo ws: B j 1 j 2 j 3 | λ 2 j 1 j 2 j 3 , δ 2 , τ 2 ∼ N (0 , λ 2 j 1 j 2 j 3 δ 2 τ 2 ) , λ j 1 j 2 j 3 ∼ C + (0 , 1) , δ ∼ C + (0 , 1) , (31) 27 independently for j d = 1 , . . . , p d and d = 1 , 2 , 3 . The squared global shrinkage parameter δ 2 controlling the o verall sparsity in β can depend on N , p ∗ , q ∗ , and the squared local shrinkage parameter λ 2 j 1 j 2 j 3 for each cell of B is assumed to be supported on a compact domain [ a, 1 /a ] for a uni versal constant a . Define C = diag( C 1 , . . . , C n ) , y ∈ R N with i -th row block y i , and X ∈ R N × p ∗ with i -th row block X i . Then the compressed conditional posterior density of β giv en Λ , δ 2 , C is β | Λ , δ 2 , C, y , X ∼ N { X ⊤ C − 1 X + ( δ 2 Λ) − 1 } − 1 X ⊤ C − 1 y , τ 2 0 { X ⊤ C − 1 X + ( δ 2 Λ) − 1 } − 1 , (32) where we define Λ = diag( λ 2 111 , . . . , λ 2 p 1 p 2 p 3 ) . The prediction risk of the cov ariance compressed posterior is defined as 1 N E ∥ X β 0 − X ¯ β ( ϕ ) ∥ 2 2 = 1 N E R,S,X,Z E y { E ϕ | y ∥ X β 0 − X ¯ β ( ϕ ) ∥ 2 2 } , (33) where the conditional posterior mean of β in ( ?? ) is denoted as ¯ β ( ϕ ) with ϕ = { Γ , Λ , δ 2 } , E R,S,X,Z , E y , and E ϕ | y respecti vely denote the expectations with respect to the distrib utions of ( R 1 , R 2 , R 3 , S 1 , S 2 , S 3 , X , Z 1 , . . . , Z n ) , y and the conditional distribution of ϕ giv en y . W e restate Theorem 3.1 from Section 3 of the main manuscript belo w , followed by a detailed proof. Theorem A.1 If the assumptions (A1)-(A3) in Section 3 of the main manuscript hold, p ∗ = o ( N ) , k ∗ 2 log k ∗ = o ( p ∗ ) , k ∗ 2 log log N = o ( p ∗ ) and ∥ β 0 ∥ 2 = o ( N ) , then the posterior pr edictive risk satis- fies 1 N E ∥ X β 0 − X ¯ β ( ϕ ) ∥ 2 2 ≤ E X κ 4 ( X ) " 2 ∥ β 0 ∥ 2 2 N ( O nb ∗ 8 σ 8 Z 3 Y d =1 q 12 d k 8 d + 3 Y d =1 m 4 max k 8 d ! + nb ∗ 8 σ 8 Z !) + 4 τ 2 0 a 4 ( N − p ∗ N log N O nb ∗ 5 σ 6 Z 3 Y d =1 q 9 d k 6 d + 3 Y d =1 m 3 max k 6 d !! + p ∗ + 4 e − p ∗ / 8 N ! O nb ∗ 3 σ 4 Z 3 Y d =1 q 6 d k 4 d + 3 Y d =1 m 2 max k 4 d !! )# = o (1) , wher e κ ( X ) denotes the condition number of X . Proof W e begin with decomposing the squared loss with respect to the compressed posterior mean ¯ β ( ϕ ) as follo ws: ∥ X β 0 − X ¯ β ( ϕ ) ∥ 2 2 = X β 0 − X { X ⊤ C − 1 X + ( δ 2 Λ) − 1 } − 1 X ⊤ C − 1 y 2 2 = X β 0 − X { X ⊤ C − 1 X + ( δ 2 Λ) − 1 } − 1 X ⊤ C − 1 ( X β 0 + ϵ 0 ) 2 2 ≤ 2 h X − X { X ⊤ C − 1 X + ( δ 2 Λ) − 1 } − 1 X ⊤ C − 1 X i β 0 2 2 + 2 X { X ⊤ C − 1 X + ( δ 2 Λ) − 1 } − 1 X ⊤ C − 1 ϵ 0 2 2 . (34) 28 Lemma A.3 in Sarkar et al. ( 2025 ) implies that ( 34 ) reduces to ∥ X β 0 − X ¯ β ( ϕ ) ∥ 2 2 ≤ 2 ∥ C ( X δ 2 Λ X ⊤ + C ) − 1 X β 0 ∥ 2 2 + 2 ∥ X δ 2 Λ X ⊤ ( X δ 2 Λ X ⊤ + C ) − 1 ϵ 0 ∥ 2 2 ≡ 2 T 1 + 2 T 2 . (35) Lemma A.2 implies that T 1 in ( 35 ) satisfies 2 E ( T 1 ) ≤ 2 O nb ∗ 8 σ 8 Z 3 Y d =1 q 12 d k 8 d + 3 Y d =1 m 4 max k 8 d ! + nb ∗ 8 σ 8 Z ! E X κ 4 ( X ) ∥ β 0 ∥ 2 2 , (36) where κ ( X ) = s max ( X ) /s min ( X ) is the condition number, and s max ( X ) and s min ( X ) are the maximum and minimum singular v alues of X . Lemma A.1 implies that T 2 in ( 35 ) satisfies 2 E ( T 2 ) ≤ 4 τ 2 0 a 4 E X κ 4 ( X ) ( N − p ∗ log N O nb ∗ 5 σ 6 Z 3 Y d =1 q 9 d k 6 d + 3 Y d =1 m 3 max k 6 d !! + ( p ∗ + 4 e − p ∗ / 8 ) O nb ∗ 3 σ 4 Z 3 Y d =1 q 6 d k 4 d + 3 Y d =1 m 2 max k 4 d !! ) (37) Combining ( 36 ) and ( 37 ), we have the prediction risk Combining ( 36 ) and ( 37 ), we have the prediction risk 1 N E ∥ X β 0 − X ¯ β ( ϕ ) ∥ 2 2 ≤ E X κ 4 ( X ) " 2 ∥ β 0 ∥ 2 2 N ( O nb ∗ 8 σ 8 Z 3 Y d =1 q 12 d k 8 d + 3 Y d =1 m 4 max k 8 d ! + nb ∗ 8 σ 8 Z !) + 4 τ 2 0 a 4 ( N − p ∗ N log N O nb ∗ 5 σ 6 Z 3 Y d =1 q 9 d k 6 d + 3 Y d =1 m 3 max k 6 d !! + p ∗ + 4 e − p ∗ / 8 N ! O nb ∗ 3 σ 4 Z 3 Y d =1 q 6 d k 4 d + 3 Y d =1 m 2 max k 4 d !! )# = o (1) , since under Assumption (A3), E X κ 4 ( X ) = 1 + o (1) ; see Khare et al. ( 2025 ) for details. The theorem is prov ed. 29 A.2 Upper Bound for T 2 Lemma A.1 Under the assumptions of Theor em 1 in the main manuscript, E ( T 2 ) ≤ 2 τ 2 0 a 4 E X κ 4 ( X ) ( N − p ∗ log N O nb ∗ 5 σ 6 Z 3 Y d =1 q 9 d k 6 d + 3 Y d =1 m 3 max k 6 d !! + ( p ∗ + 4 e − p ∗ / 8 ) O nb ∗ 3 σ 4 Z 3 Y d =1 q 6 d k 4 d + 3 Y d =1 m 2 max k 4 d !! ) Proof The term T 2 = ∥ X δ 2 Λ X ⊤ ( X δ 2 Λ X ⊤ + C ) − 1 ϵ 0 ∥ 2 2 depends on X δ 2 Λ X ⊤ and X δ 2 Λ X ⊤ + C . Let the singular v alue decomposition of X and spectral decomposition of X δ 2 Λ X ⊤ be X = U " D 0 N − p ∗ × p ∗ # V ⊤ , X δ 2 Λ X ⊤ = U " D V ⊤ δ 2 Λ V D 0 p ∗ × N − p ∗ 0 N − p ∗ × p ∗ 0 N − p ∗ × N − p ∗ # U ⊤ , (38) where N > p ∗ , U and V are N × N and p ∗ × p ∗ orthonormal matrices, and D is a p ∗ × p ∗ diagonal matrix of singular values of X . If ˜ D = D V ⊤ δ 2 Λ V D and ˜ C = U ⊤ C U , then the second decomposition in ( 38 ) implies that X δ 2 Λ X ⊤ + C = X δ 2 Λ X ⊤ + U U ⊤ C U U ⊤ = U " ˜ D + ˜ C 11 ˜ C 12 ˜ C ⊤ 12 ˜ C 22 # U ⊤ , (39) where ˜ C ij is the ij -th block of the 2 × 2 block matrix ˜ C . Substituting ( 38 ) and ( 39 ) in T 2 implies that T 2 = U " ˜ D 0 p ∗ × N − p ∗ 0 N − p ∗ × p ∗ 0 N − p ∗ × N − p ∗ # U ⊤ U " ˜ D + ˜ C 11 ˜ C 12 ˜ C ⊤ 12 ˜ C 22 # − 1 U ⊤ ϵ 0 2 2 = " ˜ D 0 p ∗ × N − p ∗ 0 N − p ∗ × p ∗ 0 N − p ∗ × N − p ∗ # " ˜ D + ˜ C 11 ˜ C 12 ˜ C ⊤ 12 ˜ C 22 # − 1 ˜ ϵ 2 2 , (40) where the first U leaves the norm unchanged because U ⊤ U = I N and ˜ ϵ = U ⊤ ϵ 0 is distributed as N (0 , τ 2 0 I N ) because U is orthonormal. Furthermore, C is positiv e definite because C = diag ( C 1 , . . . , C n ) with C i (Γ ∗ ) = Z i S ∗⊤ Γ ∗ R ∗ Z i S ∗⊤ Γ ∗ R ∗ ⊤ + I m i , which implies that ˜ C = U ⊤ C U is also a positive defi- nite matrix due to orthonormality of U . Hence, ˜ C − 1 22 exists. If F = ˜ D + ˜ C 11 − ˜ C 12 ˜ C − 1 22 ˜ C ⊤ 12 , then the block matrix in version formula ( Harville , 1997 ) gi ves " ˜ D + ˜ C 11 ˜ C 12 ˜ C ⊤ 12 ˜ C 22 # − 1 = " F − 1 − F − 1 ˜ C 12 ˜ C − 1 22 − ˜ C − 1 22 ˜ C ⊤ 12 F − 1 ˜ C − 1 22 + ˜ C − 1 22 C ⊤ 12 F − 1 ˜ C 12 ˜ C − 1 22 # . (41) 30 Substituting this identity in ( 40 ) implies that " ˜ D 0 p ∗ × N − p ∗ 0 N − p ∗ × p ∗ 0 N − p ∗ × N − p ∗ # " ˜ D + ˜ C 11 ˜ C 12 ˜ C ⊤ 12 ˜ C 22 # − 1 = " ˜ D F − 1 − ˜ D F − 1 ˜ C 12 ˜ C − 1 22 0 N − p ∗ × p ∗ 0 N − p ∗ × N − p ∗ # . (42) Using ( 42 ), ( 40 ) is written as the quadratic form T 2 = ˜ ϵ ⊤ " F − 1 ˜ D 0 p ∗ × N − p ∗ − ˜ C − 1 22 ˜ C ⊤ 12 F − 1 ˜ D 0 N − p ∗ × N − p ∗ # " ˜ D F − 1 − ˜ D F − 1 ˜ C 12 ˜ C − 1 22 0 N − p ∗ × p ∗ 0 N − p ∗ × N − p ∗ # ˜ ϵ = ˜ ϵ ⊤ " F − 1 ˜ D 2 F − 1 − F − 1 ˜ D 2 F − 1 ˜ C 12 ˜ C − 1 22 − ˜ C − 1 22 ˜ C ⊤ 12 F − 1 ˜ D 2 F − 1 ˜ C − 1 22 ˜ C ⊤ 12 F − 1 ˜ D 2 F − 1 ˜ C 12 ˜ C − 1 22 # ˜ ϵ, (43) which is further simplified by partitioning ˜ ϵ into two blocks as ˜ ϵ ⊤ = ( ˜ ϵ ⊤ 1 , ˜ ϵ ⊤ 2 ) of dimensions p ∗ × 1 and ( N − p ∗ ) × 1 , respectiv ely . Using Cauchy-Schwartz inequality for quadratic forms in ( 43 ) giv es T 2 ≤ 2˜ ϵ ⊤ 1 F − 1 ˜ D 2 F − 1 ˜ ϵ 1 + 2˜ ϵ ⊤ 2 ˜ C − 1 22 ˜ C ⊤ 12 F − 1 ˜ D 2 F − 1 ˜ C 12 ˜ C − 1 22 ˜ ϵ 2 . (44) The first term in ( 44 ) satisfies ˜ ϵ ⊤ 1 F − 1 ˜ D 2 F − 1 ˜ ϵ 1 ≤ λ max ( ˜ D 2 ) ˜ ϵ ⊤ 1 F − 1 F − 1 ˜ ϵ 1 = λ 2 max ( ˜ D ) ˜ ϵ ⊤ 1 F − 2 ˜ ϵ 1 , (45) where λ max ( ˜ D ) is the maximum eigen value of ˜ D and λ max ( ˜ D 2 ) = λ 2 max ( ˜ D ) because ˜ D is a symmetric matrix. The Schur complement of ˜ C 22 in ˜ C is ˜ C 11 − ˜ C 12 ˜ C − 1 22 ˜ C ⊤ 12 , so λ min ( ˜ C 11 − ˜ C 12 ˜ C − 1 22 ˜ C ⊤ 12 ) ≥ 0 , where λ min ( A ) is the minimum eigen value of A . This implies that F − 1 = ( ˜ D + ˜ C 11 − ˜ C 12 ˜ C − 1 22 ˜ C ⊤ 12 ) − 1 ⪯ ˜ D − 1 ⪯ λ − 1 min ( ˜ D ) I p ∗ , F − 2 ⪯ λ − 2 min ( ˜ D ) I p ∗ , (46) where A ⪯ B for two positiv e semi-definite matrices A and B implies that λ min ( B − A ) ≥ 0 . Using ( 46 ) in ( 45 ) gi ves ˜ ϵ ⊤ 1 F − 1 ˜ D 2 F − 1 ˜ ϵ 1 ≤ λ 2 max ( ˜ D ) λ 2 min ( ˜ D ) ˜ ϵ ⊤ 1 ˜ ϵ 1 . (47) W e simplify ˜ D to find upper and lo wer bounds for λ max ( ˜ D ) and λ min ( ˜ D ) . The Assumption (A1) on the support of Λ implies that λ 2 j 1 j 2 j 3 ∈ [ a, 1 /a ] for j d = 1 , . . . , p d and d = 1 , 2 , 3 , so ˜ D = D V ⊤ δ 2 Λ V D ⪯ a − 1 δ 2 D V ⊤ V D = a − 1 δ 2 D 2 , ˜ D = D V ⊤ δ 2 Λ V D ⪰ aδ 2 D V ⊤ V D = aδ 2 D 2 . (48) Furthermore, ( 38 ) implies that D 11 = s max ( X ) and D p ∗ p ∗ = s min ( X ) , where s max ( X ) and s min ( X ) are 31 the maximum and minimum singular v alues of X . Using this in ( 48 ) giv es λ max ( ˜ D ) ≤ a − 1 δ 2 s 2 max ( X ) , λ min ( ˜ D ) ≥ aδ 2 s 2 min ( X ) , λ 2 max ( ˜ D ) λ 2 min ( ˜ D ) ≤ 1 a 4 s 4 max ( X ) s 4 min ( X ) . (49) Substituting the last inequality in ( 47 ) implies that ˜ ϵ ⊤ 1 F − 1 ˜ D 2 F − 1 ˜ ϵ 1 ≤ 1 a 4 κ 4 ( X ) ˜ ϵ ⊤ 1 ˜ ϵ 1 , (50) where κ ( X ) = s max ( X ) /s min ( X ) denotes the condition number of X . Finally , we take expectations on both sides in ( 50 ). The term ˜ ϵ ⊤ 1 ˜ ϵ 1 only depends on the distrib ution of ˜ ϵ and is independent of the distribution of X , implying that E (˜ ϵ ⊤ 1 F − 1 ˜ D 2 F − 1 ˜ ϵ 1 ) ≤ 1 a 4 E X { κ 4 ( X ) } E ˜ ϵ (˜ ϵ ⊤ 1 ˜ ϵ 1 ) = τ 2 0 a 4 E X { κ 4 ( X ) } p ∗ , (51) where E ˜ ϵ (˜ ϵ ⊤ 1 ˜ ϵ 1 ) = τ 2 0 p ∗ because ϵ 1 /τ 0 is distributed as N (0 , I p ∗ ) . Consider the second term in ( 44 ). The bounds in ( 47 ) and ( 49 ) imply that ˜ ϵ ⊤ 2 ˜ C − 1 22 ˜ C ⊤ 12 F − 1 ˜ D 2 F − 1 ˜ C 12 ˜ C − 1 22 ˜ ϵ 2 ≤ λ 2 max ( ˜ D ) λ 2 min ( ˜ D ) ˜ ϵ ⊤ 2 ˜ C − 1 22 ˜ C ⊤ 12 ˜ C 12 ˜ C − 1 22 ˜ ϵ 2 ≤ 1 a 4 κ 4 ( X ) ˜ ϵ ⊤ 2 ˜ C − 1 22 ˜ C ⊤ 12 ˜ C 12 ˜ C − 1 22 ˜ ϵ 2 . (52) The quadratic form ˜ ϵ ⊤ 2 ˜ C − 1 22 ˜ C ⊤ 12 ˜ C 12 ˜ C − 1 22 ˜ ϵ 2 is independent of the distribution of X , so taking expectation on both sides of ( 52 ) gi ves E (˜ ϵ ⊤ 2 ˜ C − 1 22 ˜ C ⊤ 12 F − 1 ˜ D 2 F − 1 ˜ C 12 ˜ C − 1 22 ˜ ϵ 2 ) ≤ 1 a 4 E X κ 4 ( X ) E (˜ ϵ ⊤ 2 ˜ C − 1 22 ˜ C ⊤ 12 ˜ C 12 ˜ C − 1 22 ˜ ϵ 2 ) . (53) Let E R,S,Z , E ˜ ϵ | R,S,Z and E Γ ∗ | y respecti vely denote the expectations with respect to the distributions of ( R 1 , R 2 , R 3 , S 1 , S 2 , S 3 , Z 1 , . . . , Z n ) , ˜ ϵ given ( R 1 , R 2 , R 3 , S 1 , S 2 , S 3 , Z 1 , . . . , Z n ) , and Γ ∗ gi ven y . Then, the second expectation on the right of ( 53 ) is E (˜ ϵ ⊤ 2 ˜ C − 1 22 ˜ C ⊤ 12 ˜ C 12 ˜ C − 1 22 ˜ ϵ 2 ) = E R,S,Z E ˜ ϵ | R,S,Z E Γ ∗ | y (˜ ϵ ⊤ 2 ˜ C − 1 22 ˜ C ⊤ 12 ˜ C 12 ˜ C − 1 22 ˜ ϵ 2 ) ≤ E R,S,Z E ˜ ϵ | R,S,Z { sup Γ ∗ : ∥ Γ ∗ ∥≤ b ∗ (˜ ϵ ⊤ 2 ˜ C − 1 22 ˜ C ⊤ 12 ˜ C 12 ˜ C − 1 22 ˜ ϵ 2 ) E Γ ∗ | y (1) } = E R,S,Z E ˜ ϵ | R,S,Z { sup Γ ∗ : ∥ Γ ∗ ∥≤ b ∗ (˜ ϵ ⊤ 2 ˜ C − 1 22 ˜ C ⊤ 12 ˜ C 12 ˜ C − 1 22 ˜ ϵ 2 ) } , (54) where b ∗ is a uni versal positiv e constant defined in Assumption (A3). W e use a cov ering argument to bound the last term in volving the supremum. Lemma A.3 shows that there is a 1 / log N -net, denoted as ˜ G , for the set G = { Γ ∗ ∈ R k ∗ × k ∗ : ∥ Γ ∗ ∥ ≤ b ∗ } such that the cardinality of ˜ G is ⌈ 2 b ∗ k ∗ log N ⌉ k ∗ 2 . This implies that for an y Γ ∗ ∈ G , there is a ˜ Γ ∗ ∈ ˜ G such that ∥ Γ ∗ − ˜ Γ ∗ ∥ ≤ 1 / log N . Let A (Γ ∗ ) = ˜ C 12 (Γ ∗ ) ˜ C 22 (Γ ∗ ) − 1 be the matrix that appears in ( 54 ), where the notation emphasizes the 32 dependence on Γ ∗ . W e show that the norms of terms inv olving A (Γ ∗ ) for any Γ ∗ ∈ G are controlled using A ( ˜ Γ ∗ ) for ˜ Γ ∗ ∈ ˜ G . Specifically , ˜ ϵ ⊤ 2 n A (Γ ∗ ) ⊤ A (Γ ∗ ) − A ( ˜ Γ ∗ ) ⊤ A ( ˜ Γ ∗ ) o ˜ ϵ 2 ≤ ∥ A (Γ ∗ ) ⊤ A (Γ ∗ ) − A ( ˜ Γ ∗ ) ⊤ A ( ˜ Γ ∗ ) ∥∥ ˜ ϵ 2 ∥ 2 ( i ) ≤ 4 b ∗ (2˘ c + 3 b ∗ 2 ˘ c 2 + b ∗ 4 ˘ c 3 ) ∥ Γ ∗ − ˜ Γ ∗ ∥ ( ii ) ≤ 4 b ∗ (2˘ c + 3 b ∗ 2 ˘ c 2 + b ∗ 4 ˘ c 3 ) / log N (55) where ( i ) follows from Lemma A.4 , ˘ c is defined in Lemma A.4 , and ( ii ) follows because ˜ G is a 1 / log N -net of G . Using ( 55 ) in ( 54 ) gi ves sup Γ ∗ : ∥ Γ ∗ ∥≤ b ∗ (˜ ϵ ⊤ 2 ˜ C − 1 22 ˜ C ⊤ 12 ˜ C 12 ˜ C − 1 22 ˜ ϵ 2 ) = sup Γ ∗ : ∥ Γ ∗ ∥≤ b ∗ ˜ ϵ ⊤ 2 hn A (Γ ∗ ) ⊤ A (Γ ∗ ) − A ( ˜ Γ ∗ ) ⊤ A ( ˜ Γ ∗ ) o + n A ( ˜ Γ ∗ ) ⊤ A ( ˜ Γ ∗ ) oi ˜ ϵ 2 ≤ 4 b ∗ log N (2˘ c + 3 b ∗ 2 ˘ c 2 + b ∗ 4 ˘ c 3 ) ∥ ˜ ϵ 2 ∥ 2 + max ˜ Γ ∗ ∈ ˜ G ˜ ϵ ⊤ 2 n A ( ˜ Γ ∗ ) ⊤ A ( ˜ Γ ∗ ) o ˜ ϵ 2 , E ˜ ϵ | R,S,Z ( sup Γ ∗ : ∥ Γ ∗ ∥≤ b ∗ (˜ ϵ ⊤ 2 ˜ C − 1 22 ˜ C ⊤ 12 ˜ C 12 ˜ C − 1 22 ˜ ϵ 2 ) ) ≤ 4 b ∗ log N (2˘ c + 3 b ∗ 2 ˘ c 2 + b ∗ 4 ˘ c 3 ) E ˜ ϵ | R,S,Z ∥ ˜ ϵ 2 ∥ 2 + E ˜ ϵ | R,S,Z max ˜ Γ ∗ ∈ ˜ G ˜ ϵ ⊤ 2 n A ( ˜ Γ ∗ ) ⊤ A ( ˜ Γ ∗ ) o ˜ ϵ 2 ( i ) = 4 b ∗ τ 2 0 ( N − p ∗ ) log N (2˘ c + 3 b ∗ 2 ˘ c 2 + b ∗ 4 ˘ c 3 )+ E ˜ ϵ | R,S,Z max ˜ Γ ∗ ∈ ˜ G ˜ ϵ ⊤ 2 n A ( ˜ Γ ∗ ) ⊤ A ( ˜ Γ ∗ ) o ˜ ϵ 2 , (56) where ( i ) follows because ϵ 2 /τ 0 is distributed as N (0 , I N − p ∗ ) . F or every ˜ Γ ∗ ∈ ˜ G , the rank of A ( ˜ Γ ∗ ) = ˜ C 12 ( ˜ Γ ∗ ) ˜ C 22 ( ˜ Γ ∗ ) − 1 is min { k ∗ , p ∗ } and ( 74 ) implies that ∥ A ( ˜ Γ ∗ ) ∥ is bounded abov e by c ∗ , where c ∗ = 1 + b ∗ 2 ˇ c is the upper bound on ∥ C ∥ . This in turn implies that ∥ A ( ˜ Γ ∗ ) ∥ 2 2 is stochastically dominated by c 2 ∗ τ 2 0 ∥ ˘ ϵ ∥ 2 , where ˘ ϵ is distributed as N (0 , I min( k ∗ ,p ∗ ) ) and ∥ ˘ ϵ ∥ 2 is distributed as χ 2 min( k ∗ ,p ∗ ) . Using this fact, 33 we provide an upper bound for the e xpectation in ( 56 ) as follows E ˜ ϵ | R,S,Z max ˜ Γ ∗ ∈ ˜ G ˜ ϵ ⊤ 2 A ( ˜ Γ ∗ ) ⊤ A ( ˜ Γ ∗ )˜ ϵ 2 = Z ∞ 0 P max ˜ Γ ∗ ∈ ˜ G ∥ A ( ˜ Γ ∗ )˜ ϵ 2 ∥ 2 2 > t dt = 2 c 2 ∗ τ 2 0 p ∗ + Z ∞ 2 c 2 ∗ τ 2 0 p ∗ P max ˜ Γ ∗ ∈ ˜ G ∥ A ( ˜ Γ ∗ )˜ ϵ 2 ∥ 2 2 > t dt, Z ∞ 2 c 2 ∗ τ 2 0 p ∗ P max ˜ Γ ∗ ∈ ˜ G ∥ A ( ˜ Γ ∗ )˜ ϵ 2 ∥ 2 2 > t dt ( i ) ≤ X ˜ Γ ∗ ∈ ˜ G Z ∞ 2 c 2 ∗ τ 2 0 p ∗ P n ∥ A ( ˜ Γ ∗ )˜ ϵ 2 ∥ 2 2 > t o dt ( ii ) ≤ X ˜ Γ ∗ ∈ ˜ G Z ∞ 2 c 2 ∗ τ 2 0 p ∗ P n c 2 ∗ τ 2 0 χ 2 min( k ∗ ,p ∗ ) > t o dt ( iii ) ≤ X ˜ Γ ∗ ∈ ˜ G Z ∞ 2 c 2 ∗ τ 2 0 p ∗ P χ 2 p ∗ > t/c 2 ∗ τ 2 0 dt ( iv ) = c 2 ∗ τ 2 0 ⌈ 2 b ∗ k ∗ log N ⌉ k ∗ 2 Z ∞ p ∗ P χ 2 p ∗ − p ∗ > u du, (57) where ( i ) follows from the union bound, ( ii ) follo ws because c 2 ∗ τ 2 0 ∥ ˘ ϵ ∥ 2 stochastically dominates ∥ A ( ˜ Γ ∗ )˜ ϵ 2 ∥ 2 2 , ( iii ) follows because χ 2 p ∗ stochastically dominates χ 2 min( k ∗ ,p ∗ ) , and ( iv ) follo ws from the sub- stitution u = t/c 2 ∗ τ 2 0 − p ∗ . Definition 2.7 in W ainwright ( 2019 ) implies that if f follows χ 2 p distribution, then its moment generating function is E { e λ ( f − p ) } = e − λp (1 − 2 λ ) p/ 2 ≤ e 4 pλ 2 / 2 , | λ | < 1 / 4 , and it is subexponential with parameters ( ν, α ) = (2 √ p, 4) . Proposition 2.9 in W ainwright ( 2019 ) gives Z ∞ p P χ 2 p − p > u du ≤ Z ∞ p e − u 8 du = 8 e − p/ 8 . (58) Using ( 58 ) in ( 57 ) gi ves E ˜ ϵ | R,S,Z max ˜ Γ ∗ ∈ ˜ G ˜ ϵ ⊤ 2 A ( ˜ Γ ∗ ) ⊤ A ( ˜ Γ ∗ )˜ ϵ 2 ≤ 2 c 2 ∗ τ 2 0 p ∗ + 8 c 2 ∗ τ 2 0 ⌈ 2 b ∗ k ∗ log N ⌉ k ∗ 2 e − p ∗ / 8 = 2 c 2 ∗ τ 2 0 p ∗ + 8 c 2 ∗ τ 2 0 e k ∗ 2 log ⌈ 2 b ∗ k ∗ log N ⌉− p ∗ / 8 ≤ 2 c 2 ∗ τ 2 0 p ∗ + 8 c 2 ∗ τ 2 0 e k ∗ 2 log { (2 b ∗ +1) k ∗ log N }− p ∗ / 8 = 2 c 2 ∗ τ 2 0 p ∗ + 8 c 2 ∗ τ 2 0 e k ∗ 2 log(2 b ∗ +1)+ k ∗ 2 log k ∗ + k ∗ 2 log log N − p ∗ / 8 ( i ) = 2 c 2 ∗ τ 2 0 p ∗ + 8 c 2 ∗ τ 2 0 e − p ∗ / 8 { 1+ o (1) } , (59) where ( i ) follo ws if k ∗ 2 log k ∗ = o ( p ∗ ) and k ∗ 2 log log N = o ( p ∗ ) . W e combine ( 54 ), ( 56 ), ( 59 ) and use 34 them in ( 53 ) to obtain E (˜ ϵ ⊤ 2 ˜ C − 1 22 ˜ C ⊤ 12 F − 1 ˜ D 2 F − 1 ˜ C 12 ˜ C − 1 22 ˜ ϵ 2 ) ≤ τ 2 0 a 4 E X κ 4 ( X ) E R,S,Z 4 b ∗ ( N − p ∗ ) log N (2˘ c + 3 b ∗ 2 ˘ c 2 + b ∗ 4 ˘ c 3 ) + 2 c 2 ∗ p ∗ + 8 c 2 ∗ e − p ∗ / 8 = 2 τ 2 0 a 4 E X κ 4 ( X ) E R,S,Z 2 b ∗ ( N − p ∗ ) log N (2˘ c + 3 b ∗ 2 ˘ c 2 + b ∗ 4 ˘ c 3 ) + (1 + b ∗ 4 ˘ c 2 + 2 b ∗ 2 ˘ c )( p ∗ + 4 e − p ∗ / 8 ) = 2 τ 2 0 a 4 E X κ 4 ( X ) n ( p ∗ + 4 e − p ∗ / 8 ) + a 1 E R,S,Z (˘ c ) + a 2 E R,S,Z (˘ c 2 ) + a 3 E R,S,Z (˘ c 3 ) o , a 1 = 4 b ∗ ( N − p ∗ ) log N + 2 b ∗ 2 ( p ∗ + 4 e − p ∗ / 8 ) , a 2 = 6 b ∗ 3 ( N − p ∗ ) log N + b ∗ 4 ( p ∗ + 4 e − p ∗ / 8 ) , a 3 = 2 b ∗ 5 ( N − p ∗ ) log N . (60) Finally , taking expectation on both sides of ( 44 ), and substituting ( 51 ), ( 60 ), and using r = 1 , 2 , 3 in Lemma A.5 gi ves E ( T 2 ) ≤ 2 τ 2 0 a 4 E X κ 4 ( X ) h 3 p ∗ + 8 e − p ∗ / 8 + 2 8 b ∗ σ 2 Z n 2( N − p ∗ ) log N + b ∗ ( p ∗ + 4 e − p ∗ / 8 ) o 3 Y d =1 1 k 2 d ( q d + k d + 2) 2 { n ( q ∗ + 2) + N } + 2 19 b ∗ 3 σ 4 Z n 6( N − p ∗ ) log N + b ( p ∗ + 4 e − p ∗ / 8 ) o 3 Y d =1 1 k 4 d q 2 d + k 2 d + 2 2 n n ( q ∗ 2 + 2) + n X i =1 m 2 i o + 2 32 b ∗ 5 σ 6 Z N − p ∗ log N 3 Y d =1 1 k 6 d q 3 d + k 3 d + 3 2 n n ( q ∗ 3 + 3) + n X i =1 m 3 i oi ( i ) ≤ 2 τ 2 0 a 4 E X κ 4 ( X ) h 3 p ∗ + 8 e − p ∗ / 8 + 2 8 b ∗ σ 2 Z n 2( N − p ∗ ) log N + b ∗ ( p ∗ + 4 e − p ∗ / 8 ) o 3 Y d =1 1 k 2 d (4 q 2 d + 4 k 2 d + 8) { n ( q ∗ + 2) + N } + 2 19 b ∗ 3 σ 4 Z n 6( N − p ∗ ) log N + b ∗ ( p ∗ + 4 e − p ∗ / 8 ) o 3 Y d =1 1 k 4 d (4 q 4 d + 4 k 4 d + 8) n n ( q ∗ 2 + 2) + nm 2 max o + 2 32 b ∗ 5 σ 6 Z N − p ∗ log N 3 Y d =1 1 k 6 d (4 q 6 d + 4 k 6 d + 18) n n ( q ∗ 3 + 3) + nm 3 max oi , = 2 τ 2 0 a 4 E X κ 4 ( X ) ( N − p ∗ log N O nb ∗ 5 σ 6 Z 3 Y d =1 q 9 d k 6 d + 3 Y d =1 m 3 max k 6 d !! + ( p ∗ + 4 e − p ∗ / 8 ) O nb ∗ 3 σ 4 Z 3 Y d =1 q 6 d k 4 d + 3 Y d =1 m 2 max k 4 d !! ) where ( i ) follows from the inequality ( u + v ) 2 ≤ 2( u 2 + v 2 ) . The lemma is proved. 35 A.3 Upper Bound for T 1 Lemma A.2 Under the assumptions of Theor em 1 in the main manuscript, E ( T 1 ) ≤ O nb ∗ 8 σ 8 Z 3 Y d =1 q 12 d k 8 d + 3 Y d =1 m 4 max k 8 d ! + nb ∗ 8 σ 8 Z ! E X κ 4 ( X ) ∥ β 0 ∥ 2 2 Proof The term T 1 satisfies T 1 ≤ ∥ C ∥ 2 ∥ ( X δ 2 Λ X ⊤ + C ) − 1 X β 0 ∥ 2 2 ≤ c 2 ∗ ∥ ( X δ 2 Λ X ⊤ + C ) − 1 X β 0 ∥ 2 2 , (61) where c ∗ = 1 + b ∗ 2 ˘ c is the upper bound of ∥ C ∥ in ( 70 ). Using ( 38 ), ( 39 ) and ( 41 ), we get ( X δ 2 Λ X ⊤ + C ) − 1 X β 0 = U " F − 1 − F − 1 ˜ C 12 ˜ C − 1 22 − ˜ C − 1 22 ˜ C ⊤ 12 F − 1 ˜ C − 1 22 + ˜ C − 1 22 C ⊤ 12 F − 1 ˜ C 12 ˜ C − 1 22 # U ⊤ U " D 0 N − p × p # V ⊤ β 0 = U " F − 1 D V ⊤ β 0 − ˜ C − 1 22 ˜ C ⊤ 12 F − 1 D V ⊤ β 0 # . (62) This further implies that the second term on the right-hand side of ( 61 ) satisfies ∥ ( X δ 2 Λ X ⊤ + C ) − 1 X β 0 ∥ 2 2 = ∥ F − 1 D V ⊤ β 0 ∥ 2 2 + ∥ ˜ C − 1 22 ˜ C ⊤ 12 F − 1 D V ⊤ β 0 ∥ 2 2 ≤ β 0 ⊤ V D F − 2 D V ⊤ β 0 + ∥ ˜ C − 1 22 ˜ C ⊤ 12 ∥ 2 ∥ F − 1 D V ⊤ β 0 ∥ 2 2 = β 0 ⊤ V D F − 2 D V ⊤ β 0 + ∥ A (Γ) ⊤ ∥ 2 β 0 ⊤ V D F − 2 D V ⊤ β 0 ≤ { 1 + (1 + b ∗ 2 ˘ c ) 2 } β 0 ⊤ V D F − 2 D V ⊤ β 0 , (63) which follo ws from ( 74 ) in Lemma A.4 . Follo wing the same arguments to deri ve ( 51 ), we obtain that β 0 ⊤ V D F − 2 D V ⊤ β 0 ≤ 1 λ 2 min ( ˜ D ) β 0 ⊤ V D 2 V ⊤ β 0 ≤ λ 2 max ( D ) λ 2 min ( ˜ D ) β 0 ⊤ V V ⊤ β 0 = λ 2 max ( D ) λ 2 min ( ˜ D ) ∥ β 0 ∥ 2 2 = κ 4 ( X ) ∥ β 0 ∥ 2 2 . (64) 36 Substituting ( 64 ) and ( 63 ) in ( 61 ) gi ves T 1 ≤ (1 + b ∗ 2 ˘ c ) 2 { 1 + (1 + b ∗ 2 ˘ c ) 2 } κ 4 ( X ) ∥ β 0 ∥ 2 2 = { (1 + b ∗ 2 ˘ c ) 2 + (1 + b ∗ 2 ˘ c ) 4 } κ 4 ( X ) ∥ β 0 ∥ 2 2 ≤ { 2(1 + b ∗ 4 ˘ c 2 ) + 2 3 (1 + b ∗ 8 ˘ c 4 ) } κ 4 ( X ) ∥ β 0 ∥ 2 2 , (65) which follows from the inequality ( u + v ) r ≤ 2 r − 1 ( u r + v r ) . T aking expectations on both sides of ( 65 ) implies that E ( T 1 ) ≤ E R,S,Z 2(1 + b ∗ 4 ˘ c 2 ) + 2 3 (1 + b ∗ 8 ˘ c 4 ) E X κ 4 ( X ) ∥ β 0 ∥ 2 2 ( i ) ≤ h 10 + 2 19 b ∗ 4 σ 4 Z 3 Y d =1 1 k 4 d ( q 2 d + k 2 d + 2) 2 n n ( q ∗ 2 + 2) + n X i =1 m 2 i o + 2 45 b 8 σ 8 Z 3 Y d =1 1 k 8 d ( q 4 d + k 4 d + 6) 2 n n ( q ∗ 4 + 6) + n X i =1 m 4 i oi E X κ 4 ( X ) ∥ β 0 ∥ 2 2 ( ii ) ≤ h 10 + 2 19 b ∗ 4 σ 4 Z 3 Y d =1 1 k 4 d (4 q 4 d + 4 k 4 d + 8) n n ( q ∗ 2 + 2) + n X i =1 m 2 i o + 2 45 b ∗ 8 σ 8 Z 3 Y d =1 1 k 8 d (4 q 8 d + 4 k 8 d + 72) n n ( q ∗ 4 + 6) + n X i =1 m 4 i oi E X κ 4 ( X ) ∥ β 0 ∥ 2 2 ≤ h 10 + 2 19 b ∗ 4 σ 4 Z 3 Y d =1 1 k 4 d (4 q 4 d + 4 k 4 d + 8) n n ( q ∗ 2 + 2) + nm 2 max o + 2 45 b ∗ 8 σ 8 Z 3 Y d =1 1 k 8 d (4 q 8 d + 4 k 8 d + 72) n n ( q ∗ 4 + 6) + nm 4 max oi E X κ 4 ( X ) ∥ β 0 ∥ 2 2 = O nb ∗ 8 σ 8 Z 3 Y d =1 q 12 d k 8 d + 3 Y d =1 m 4 max k 8 d ! + nb ∗ 8 σ 8 Z ! E X κ 4 ( X ) ∥ β 0 ∥ 2 2 , where ( i ) holds by using r = 2 and r = 4 in Lemma A.5 and ( ii ) follows from the inequality ( u + v ) 2 ≤ 2( u 2 + v 2 ) . The lemma is proved. A.4 A uxiliary Lemmas Lemma A.3 Consider the set of matrices G d = { Γ d ∈ R k d × k d : ∥ Γ d ∥ ≤ b d } for all mode d = 1 , 2 , 3 . Define, G = { Γ ∗ ∈ R k ∗ × k ∗ : ∥ Γ ∗ ∥ ≤ b ∗ } with b ∗ = b 1 b 2 b 3 . Then, there is a 1 / (log N ) -cover for the metric space ( G , ∥ · ∥ ) with car dinality ⌈ 2 b ∗ k ∗ log N ⌉ k ∗ 2 , wher e k ∗ = k 1 k 2 k 3 . Proof Consider the approximation of [ − b ∗ , b ∗ ] by a uniform grid with ⌈ 2 b ∗ k ∗ log N ⌉ partitions. Every partition in the grid has length less than or equal to 1 / ( k ∗ log N ) . If the center of the l -th partition is g l , then we can 37 form at most ⌈ 2 b ∗ k ∗ log N ⌉ k ∗ 2 k ∗ × k ∗ matrices using { g l : l = 1 , . . . , ⌈ 2 b ∗ k ∗ log N ⌉} . Denote the set formed using these matrices as ˜ G = { ˜ Γ ∗ l ∈ R k ∗ × k ∗ : l = 1 , . . . , ⌈ 2 b ∗ k ∗ log N ⌉ k ∗ 2 } . W e prov e the lemma by showing that ˜ G is a 1 / (log N ) -net for the metric space ( G , ∥ · ∥ ) . For any Γ ∗ ∈ G and i, j = 1 , . . . , k ∗ , Γ ∗ ij ∈ [ − b ∗ , b ∗ ] because ∥ Γ ∗ ∥ ≤ b ∗ . The construction of ˜ G implies that there exists a ˜ Γ ∗ ∈ ˜ G such that | Γ ∗ ij − ˜ Γ ∗ ij |≤ 1 / ( k ∗ log N ) for i, j = 1 , . . . , k ∗ . Furthermore, summing this inequality ov er rows and columns gi ves k ∗ X j =1 | Γ ∗ ij − ˜ Γ ∗ ij |≤ 1 log N , k ∗ X i =1 | Γ ∗ ij − ˜ Γ ∗ ij |≤ 1 log N . (66) Using ( 66 ), in the definitions of ∥ · ∥ ∞ , ∥ · ∥ 1 , and ∥ · ∥ norms for matrices implies that ∥ Γ ∗ − ˜ Γ ∗ ∥ ∞ = max 1 ≤ i ≤ k ∗ k ∗ X j =1 | Γ ∗ ij − ˜ Γ ∗ ij |≤ 1 log N , ∥ Γ ∗ − ˜ Γ ∗ ∥ 1 = max 1 ≤ j ≤ k ∗ k X i =1 | Γ ∗ ij − ˜ Γ ∗ ij |≤ 1 log N , ∥ Γ ∗ − ˜ Γ ∗ ∥ ≤ ∥ Γ ∗ − ˜ Γ ∗ ∥ 1 ∥ Γ ∗ − ˜ Γ ∗ ∥ ∞ 1 / 2 ≤ 1 log N , (67) where the last inequality proves that ˜ G is a 1 / (log N ) -cover for the metric space ( G , ∥ · ∥ ) . The lemma is prov ed. Lemma A.4 Let G = { Γ ∗ ∈ R k ∗ × k ∗ : ∥ Γ ∗ ∥ ≤ b ∗ } be the set used in in Lemma A.3 with ˜ G as its 1 / log N - net and A (Γ ∗ ) = ˜ C 12 (Γ ∗ ) ˜ C 22 (Γ ∗ ) − 1 be the matrix that appears in ( 54 ) , wher e the notation emphasizes the dependence on Γ ∗ . Then, for any Γ ∗ ∈ G and ˜ Γ ∗ ∈ ˜ G , ∥ A (Γ ∗ ) ⊤ A (Γ ∗ ) − A ( ˜ Γ ∗ ) ⊤ A ( ˜ Γ ∗ ) ∥ ≤ 4 b ∗ (2˘ c + 3 b ∗ 2 ˘ c 2 + b ∗ 4 ˘ c 3 ) ∥ Γ ∗ − ˜ Γ ∗ ∥ , ˘ c = 3 Y d =1 ∥ S d ∥ 2 ∥ R d ∥ 2 max( ∥ Z 1 ∥ 2 , . . . , ∥ Z n ∥ 2 ) . (68) Proof Recall that C i (Γ ∗ ) = Z i S ∗⊤ Γ ∗ R ∗ R ∗⊤ Γ ∗⊤ S ∗ Z ⊤ i + I m i . For any Γ ∗ ∈ G , 1 ( i ) ≤ λ min { C i (Γ ∗ ) } ≤ λ max { C i (Γ ∗ ) } ≤ 1 + ∥ Z i S ∗⊤ Γ ∗ R ∗ ∥ 2 ≤ 1 + b ∗ 2 ∥ S ∗ ∥ 2 ∥ R ∗ ∥ 2 ∥ Z i ∥ 2 , 1 ( ii ) ≤ λ min { C (Γ ∗ ) } ≤ λ max { C (Γ ∗ ) } ( iii ) ≤ 1 + b ∗ 2 ∥ S ∗ ∥ 2 ∥ R ∗ ∥ 2 max( ∥ Z 1 ∥ 2 , . . . , ∥ Z n ∥ 2 ) , (69) where ( i ) follows because C i (Γ ∗ ) = Z i S ∗⊤ Γ ∗ R ∗ Z i S ∗⊤ Γ ∗ R ∗ ⊤ + I m i , ( ii ) follows because λ min { C (Γ ∗ ) } = min i λ min { C i (Γ ∗ ) } , and ( iii ) follo ws because λ max { C (Γ ∗ ) } = max i λ max { C i (Γ ∗ ) } . Finally , using the fact that ∥ A ⊗ B ∥ = ∥ A ∥∥ B ∥ for any two matrices A and B , for any Γ ∗ ∈ G , we can 38 provide an upper bound for the operator norm of the w orking covariance matrix as ∥ C (Γ ∗ ) ∥ = λ max { C (Γ ∗ ) } ≤ 1 + b ∗ 2 3 Y d =1 ∥ S d ∥ 2 ∥ R d ∥ 2 max( ∥ Z 1 ∥ 2 , . . . , ∥ Z n ∥ 2 ) ≡ 1 + b ∗ 2 ˘ c. (70) For an y Γ ∗ ∈ G and ˜ Γ ∗ ∈ ˜ G , ∥ C i (Γ ∗ ) − C i ( ˜ Γ ∗ ) ∥ = ∥ Z i S ∗⊤ Γ ∗ R ∗ R ∗⊤ Γ ∗⊤ S ∗ Z ⊤ i − Z i S ∗⊤ ˜ Γ ∗ R ∗ R ∗⊤ ˜ Γ ∗⊤ S ∗ Z ⊤ i ∥ = ∥ Z i S ∗⊤ (Γ ∗ − ˜ Γ ∗ ) R ∗ R ∗⊤ Γ ∗⊤ S ∗ Z ⊤ i + Z i S ∗⊤ ˜ Γ ∗ R ∗ R ∗⊤ (Γ ∗⊤ − ˜ Γ ∗⊤ ) S ∗ Z ⊤ i ∥ ≤ ∥ Z i S ∗⊤ ∥∥ R ∗ R ∗⊤ Γ ∗⊤ S ∗ Z ⊤ i ∥∥ Γ ∗ − ˜ Γ ∗ ∥ + ∥ Z i S ∗⊤ ˜ Γ ∗ R ∗ R ∗⊤ ∥∥ S ∗ Z ⊤ i ∥∥ Γ ∗ − ˜ Γ ∗ ∥ ≤ 2 b ∗ ∥ Z i S ∗⊤ ∥ ∥ R ∗ R ∗⊤ ∥ ∥ S ∗ Z ⊤ i ∥ ∥ Γ ∗ − ˜ Γ ∗ ∥ = 2 b ∗ ∥ Z i ∥ 2 ∥ S ∗ ∥ 2 ∥ R ∗ ∥ 2 ∥ Γ ∗ − ˜ Γ ∗ ∥ = 2 b ∗ ∥ Z i ∥ 2 3 Y d =1 ∥ S d ∥ 2 ∥ R d ∥ 2 ∥ Γ ∗ − ˜ Γ ∗ ∥ , (71) which implies ∥ C (Γ ∗ ) − C ( ˜ Γ ∗ ) ∥ = max i ∥ C i (Γ ∗ ) − C i ( ˜ Γ ∗ ) ∥ = 2 b ∗ 3 Y d =1 ∥ S d ∥ 2 ∥ R d ∥ 2 max( ∥ Z 1 ∥ 2 , . . . , ∥ Z n ∥ 2 ) ∥ Γ ∗ − ˜ Γ ∗ ∥ ≡ 2 b ∗ ˘ c ∥ Γ ∗ − ˜ Γ ∗ ∥ . (72) Consider the term ∥ A (Γ ∗ ) ⊤ A (Γ ∗ ) − A ( ˜ Γ ∗ ) ⊤ A ( ˜ Γ ∗ ) ∥ = ∥ A (Γ ∗ ) ⊤ A (Γ ∗ ) − A ( ˜ Γ ∗ ) ⊤ A (Γ ∗ ) + A ( ˜ Γ ∗ ) ⊤ A (Γ ∗ ) − A ( ˜ Γ ∗ ) ⊤ A ( ˜ Γ ∗ ) ∥∥ = ∥{ A (Γ ∗ ) ⊤ − A ( ˜ Γ ∗ ) ⊤ } A (Γ ∗ ) + A ( ˜ Γ ∗ ) ⊤ { A (Γ ∗ ) − A ( ˜ Γ ∗ ) }∥ ≤ {∥ A (Γ ∗ ) ∥ + ∥ A ( ˜ Γ ∗ ) ∥} ∥ A (Γ ∗ ) − A ( ˜ Γ ∗ ) ∥ . (73) For an y Γ ∗ ∈ G , ∥ A (Γ ∗ ) ∥ = ∥ ˜ C 12 (Γ ∗ ) ˜ C 22 (Γ ∗ ) − 1 ∥ ≤ ∥ ˜ C 12 (Γ ∗ ) ∥∥ ˜ C 22 (Γ ∗ ) − 1 ∥ = ∥ ˜ C 12 (Γ ∗ ) ∥ 1 λ min { ˜ C 22 (Γ ∗ ) } ( i ) ≤ ∥ ˜ C (Γ ∗ ) ∥ λ min { ˜ C 22 (Γ ∗ ) } ( ii ) ≤ ∥ C (Γ ∗ ) ∥ λ min { C (Γ ∗ ) } ( iii ) ≤ ∥ C (Γ ∗ ) ∥ ( iv ) ≤ 1 + b ∗ 2 ˘ c, (74) where ( i ) follows from Cauchy’ s interlacing theorem, ( ii ) follows from Cauchy’ s interlacing theorem and 39 the fact that ∥ ˜ C ∥ = ∥ U ⊤ C U ∥ = ∥ C ∥ because U is an orthonormal matrix, and ( iii ) and ( iv ) follow from ( 69 ) and ( 70 ) respecti vely . Consider the last term in ( 73 ), ∥ A (Γ ∗ ) − A ( ˜ Γ ∗ ) ∥ = ∥ A (Γ ∗ ) − ˜ C 12 ( ˜ Γ ∗ ) ˜ C 22 (Γ ∗ ) − 1 + ˜ C 12 ( ˜ Γ ∗ ) ˜ C 22 (Γ ∗ ) − 1 − A ( ˜ Γ ∗ ) ∥ = ∥{ ˜ C 12 (Γ ∗ ) − ˜ C 12 ( ˜ Γ ∗ ) } ˜ C 22 (Γ ∗ ) − 1 + ˜ C 12 ( ˜ Γ ∗ ) { ˜ C 22 (Γ ∗ ) − 1 − ˜ C 22 ( ˜ Γ ∗ ) − 1 }∥ ≤ ∥ ˜ C 22 (Γ ∗ ) − 1 ∥∥ ˜ C 12 (Γ ∗ ) − ˜ C 12 ( ˜ Γ ∗ ) ∥ + ∥ ˜ C 12 ( ˜ Γ ∗ ) ∥∥ ˜ C 22 (Γ ∗ ) − 1 − ˜ C 22 ( ˜ Γ ∗ ) − 1 ∥ = ∥ ˜ C 22 (Γ ∗ ) − 1 ∥∥ ˜ C 12 (Γ ∗ ) − ˜ C 12 ( ˜ Γ ∗ ) ∥ + ∥ ˜ C 12 ( ˜ Γ ∗ ) ∥∥ ˜ C 22 (Γ ∗ ) − 1 { ˜ C 22 ( ˜ Γ ∗ ) − ˜ C 22 (Γ ∗ ) } ˜ C 22 ( ˜ Γ ∗ ) − 1 ∥ ( i ) ≤ ∥ ˜ C 22 (Γ ∗ ) − 1 ∥∥ C (Γ ∗ ) − C ( ˜ Γ ∗ ) ∥ + ∥ ˜ C 12 ( ˜ Γ ∗ ) ∥∥ ˜ C 22 (Γ ∗ ) − 1 ∥∥ ˜ C 22 ( ˜ Γ ∗ ) − 1 ∥∥ C ( ˜ Γ ∗ ) − C (Γ ∗ ) ∥ = λ − 1 min { ˜ C 22 (Γ ∗ ) } (1 + ∥ ˜ C 12 ( ˜ Γ ∗ ) ∥∥ ˜ C 22 ( ˜ Γ ∗ ) − 1 ∥ ) ∥ C (Γ ∗ ) − C ( ˜ Γ ∗ ) ∥ ( ii ) ≤ λ − 1 min { C (Γ ∗ ) } (1 + ∥ C (Γ ∗ ) ∥ ) ∥ C (Γ ∗ ) − C ( ˜ Γ ∗ ) ∥ ( iii ) ≤ (2 + b ∗ 2 ˘ c ) ∥ C (Γ ∗ ) − C ( ˜ Γ ∗ ) ∥ ( iv ) ≤ (2 + b ∗ 2 ˘ c ) 2 b ∗ ˘ c ∥ Γ ∗ − ˜ Γ ∗ ∥ = (4 b ∗ ˘ c + 2 b ∗ 3 ˘ c 2 ) ∥ Γ ∗ − ˜ Γ ∗ ∥ , (75) where ( i ) holds because ˜ C 12 (Γ ∗ ) − ˜ C 12 ( ˜ Γ ∗ ) and ˜ C 22 (Γ ∗ ) − ˜ C 22 ( ˜ Γ ∗ ) are p × ( N − p ) and ( N − p ) × ( N − p ) submatrices of ˜ C (Γ ∗ ) − ˜ C ( ˜ Γ ∗ ) , ( ii ) and ( iii ) follo w from the arguments used in ( 74 ), and ( iv ) follows from ( 72 ). Combining ( 73 ), ( 74 ) and ( 75 ) implies that ∥ A (Γ ∗ ) ⊤ A (Γ ∗ ) − A ( ˜ Γ ∗ ) ⊤ A ( ˜ Γ ∗ ) ∥ ≤ 2(1 + b ∗ 2 ˘ c )(4 b ∗ ˘ c + 2 b ∗ 3 ˘ c 2 ) ∥ Γ ∗ − ˜ Γ ∗ ∥ = 4 b ∗ (2˘ c + 3 b ∗ 2 ˘ c 2 + b ∗ 4 ˘ c 3 ) ∥ Γ ∗ − ˜ Γ ∗ ∥ . The lemma is prov ed. Lemma A.5 Let R ∗ , S ∗ , Z 1 , . . . , Z n be the matrices defined in ( 30 ) used to define the compr essed model ( 29 ) . Then, for any r ≥ 1 , E R,S,Z (˘ c r ) ≤ 2 12 r − 6 σ 2 r Z 3 Y d =1 1 k 2 r d q r d + k r d + 2 2 − r r Γ( r ) 2 ( nq ∗ r + n 2 2 − r r Γ( r ) + n X i =1 m r i ) , wher e we define ˘ c = Q 3 d =1 ∥ S d ∥ 2 ∥ R d ∥ 2 max( ∥ Z 1 ∥ 2 , . . . , ∥ Z n ∥ 2 ) . Proof 40 Consider any r ≥ 1 . Then, using the independence of the distributions of R d ’ s and S d ’ s, E R,S,Z (˘ c r ) = E R,S,Z ( 3 Y d =1 ∥ S d ∥ 2 r ∥ R d ∥ 2 r max( ∥ Z 1 ∥ 2 r , . . . , ∥ Z n ∥ 2 r ) ) = 3 Y d =1 E S d ∥ S d ∥ 2 r E R d ∥ R d ∥ 2 r E Z max( ∥ Z 1 ∥ 2 r , . . . , ∥ Z n ∥ 2 r ) ( i ) ≤ 3 Y d =1 " 1 k 2 r/ 2 d 2 4 r − 2 { q 2 r/ 2 d + k 2 r/ 2 d + 2 1 − 2 r/ 2 (2 r )Γ(2 r / 2) } # 2 σ 2 r Z 2 4 r − 2 " n ( q ∗ ) 2 r/ 2 + n 2 1 − 2 r/ 2 (2 r )Γ(2 r / 2) + n X i =1 m 2 r/ 2 i # = 2 12 r − 6 σ 2 r Z 3 Y d =1 1 k 2 r d q r d + k r d + 2 2 − r r Γ( r ) 2 ( nq ∗ r + n 2 2 − r r Γ( r ) + n X i =1 m r i ) where ( i ) follows from Lemma A.6 in Sarkar et al. ( 2025 ). The lemma is prov ed. B Additional Numerical Results In this section, we report the empirical findings corresponding to the larger cov ariance compression dimen- sions ( k = 6 , 9 ) considered in the simulation study . The experimental setup remains same as that described in Section 4.1 of the main manuscript. The additional simulation results allows us to assess the robustness of CoMET to the choice of cov ariance compression dimensions. Similar to the findings for k = 3 in the main manuscript, across different choices of fixed-ef fect CP- rank ( K ) and cluster size ( m ), the CoMET model exhibits superior estimation and prediction accuracy at both k = 6 and k = 9 , compared to its regularized competitors (Figures 7 and 8 ). Similarly , CoMET’ s performance in fixed-ef fects inference for k = 6 and k = 9 remain consistent with that for k = 3 . For moderate choices of the fixed-ef fect coefficient’ s rank ( K = 4 , 6 , 8 ), CoMET consistently yields narrower credible intervals than the PQL methods, along with attaining near-nominal coverage (Figures 9 and 10 ). Additionally , the CoMET model more accurately identifies the true sparsity patterns in the fixed-ef fect coef ficient tensor B compared to the penalized methods, while closely matching the performance of the oracle benchmark (Figure 11 ). These findings further strengthen the ef fecti veness of our proposed model in fixed-ef fects estimation, prediction, and uncertainty quantification. C P osterior Computation This section presents the detailed deriv ation of the posterior distributions outlined in Algorithm 1 of the main manuscript. W e first consider the posterior sampling of the compressed cov ariance parameters. For e very mode d = 1 , 2 , 3 , let ˇ Z γ d be the design matrix consisting of the compressed co variance parameters for 41 0.9 1.0 1.1 1.2 1.3 1.4 1 2 4 6 8 K m = 3 0.50 0.75 1.00 1.25 1.50 1 2 4 6 8 K m = 6 1 2 3 1 2 4 6 8 K m = 9 0.5 1.0 1.5 2.0 1 2 4 6 8 K m = 12 Cov ariance Compression at k = 6 Root Mean Square Error 40 45 50 55 60 1 2 4 6 8 K m = 3 40 50 60 1 2 4 6 8 K m = 6 40 60 80 100 1 2 4 6 8 K m = 9 30 40 50 60 70 80 1 2 4 6 8 K m = 12 Oracle CoMET PQL−1 PQL−2 GEE Root Mean Square Prediction Error Figure 7: CoMET substantially outperforms existing penalized quasi-lik elihood methods in estimation of B (RMSE) and out-of-sample prediction (RMSPE) across various choices of fixed-effect rank K and cluster sizes m ∈ { 3 , 6 , 9 , 12 } . Results are presented for compressed cov ariance dimension k = 6 , summarized ov er 25 replications. CoMET , compressed mix ed-effects tensor model; Oracle, the oracle benchmark; PQL- 1, the penalized quasi-likelihood approach of Fan and Li ( 2012 ); PQL-2, the penalized quasi-likelihood approach of Li et al. ( 2022 ); GEE, the penalized generalized estimating equations method of Zhang et al. ( 2019 ). 42 0.9 1.0 1.1 1.2 1.3 1.4 1 2 4 6 8 K m = 3 0.50 0.75 1.00 1.25 1.50 1 2 4 6 8 K m = 6 1 2 3 1 2 4 6 8 K m = 9 0.5 1.0 1.5 2.0 1 2 4 6 8 K m = 12 Cov ariance Compression at k = 9 Root Mean Square Error 40 45 50 55 60 1 2 4 6 8 K m = 3 40 50 60 1 2 4 6 8 K m = 6 40 60 80 100 1 2 4 6 8 K m = 9 30 40 50 60 70 80 1 2 4 6 8 K m = 12 Oracle CoMET PQL−1 PQL−2 GEE Root Mean Square Prediction Error Figure 8: CoMET substantially outperforms existing penalized quasi-lik elihood methods in estimation of B (RMSE) and out-of-sample prediction (RMSPE) across various choices of fixed-effect rank K and cluster sizes m ∈ { 3 , 6 , 9 , 12 } . Results are presented for compressed cov ariance dimension k = 9 , summarized ov er 25 replications. CoMET , compressed mix ed-effects tensor model; Oracle, the oracle benchmark; PQL- 1, the penalized quasi-likelihood approach of Fan and Li ( 2012 ); PQL-2, the penalized quasi-likelihood approach of Li et al. ( 2022 ); GEE, the penalized generalized estimating equations method of Zhang et al. ( 2019 ). 43 0.80 0.95 1 2 4 6 8 K m = 3 0.80 0.95 1 2 4 6 8 K m = 6 0.80 0.95 1 2 4 6 8 K m = 9 0.80 0.95 1 2 4 6 8 K m = 12 Cov ariance Compression at k = 6 Coverage Pr obability 5 10 1 2 4 6 8 K m = 3 2 4 6 8 1 2 4 6 8 K m = 6 2 4 6 1 2 4 6 8 K m = 9 1 2 3 4 5 1 2 4 6 8 K m = 12 Oracle CoMET PQL−1 PQL−2 Interval Width Figure 9: Fixed-ef fects inference comparisons. The CoMET model produces narrower credible intervals for B entries than the PQL methods when k = 6 and K ∈ { 4 , 6 , 8 } , along with achieving near-nominal coverage across all cluster sizes m ∈ { 3 , 6 , 9 , 12 } . All metrics are summarized ov er 25 replications. CoMET , the compressed mixed-ef fects tensor model; oracle, the oracle v ariant of CoMET ; PQL-1, the penalized quasi- likelihood approach of F an and Li ( 2012 ); PQL-2, the penalized quasi-likelihood approach of Li et al. ( 2022 ). GEE, the penalized generalized estimating equations approach of Zhang et al. ( 2019 ), is excluded because of absence of debiasing technique for confidence interv als construction. 44 0.80 0.95 1 2 4 6 8 K m = 3 0.80 0.95 1 2 4 6 8 K m = 6 0.80 0.95 1 2 4 6 8 K m = 9 0.80 0.95 1 2 4 6 8 K m = 12 Cov ariance Compression at k = 9 Coverage Pr obability 5 10 1 2 4 6 8 K m = 3 2 4 6 8 1 2 4 6 8 K m = 6 2 4 6 1 2 4 6 8 K m = 9 1 2 3 4 5 1 2 4 6 8 K m = 12 Oracle CoMET PQL−1 PQL−2 Interval Width Figure 10: Fixed-ef fects inference comparisons. The CoMET model produces narrower credible intervals for B entries than the PQL methods when k = 9 and K ∈ { 4 , 6 , 8 } , along with achie ving near -nominal co v- erage across all cluster sizes m ∈ { 3 , 6 , 9 , 12 } . All metrics are summarized ov er 25 replications. CoMET , the compressed mixed-ef fects tensor model; oracle, the oracle v ariant of CoMET ; PQL-1, the penalized quasi-likelihood approach of F an and Li ( 2012 ); PQL-2, the penalized quasi-likelihood approach of Li et al. ( 2022 ). GEE, the penalized generalized estimating equations approach of Zhang et al. ( 2019 ), is excluded because of absence of debiasing technique for confidence interv als construction. 45 T ruth Oracle CoMET PQL−1 PQL−2 GEE 1 16 321 16 32 1 16 321 16 321 16 321 16 32 1 16 32 Col Row (a) m = 3 T ruth Oracle CoMET PQL−1 PQL−2 GEE 1 16 321 16 32 1 16 321 16 321 16 321 16 32 1 16 32 Col Row (b) m = 6 T ruth Oracle CoMET PQL−1 PQL−2 GEE 1 16 321 16 32 1 16 321 16 321 16 321 16 32 1 16 32 Col Row (c) m = 9 T ruth Oracle CoMET PQL−1 PQL−2 GEE 1 16 321 16 32 1 16 321 16 321 16 321 16 32 1 16 32 Col Row V alue −6 −3 0 3 6 (d) m = 12 Figure 11: Estimated 32 × 32 fixed-ef fect coef ficient matrix B , a veraged ov er 25 simulated training datasets. CoMET accurately recovers the true sparsity patterns in B , closely mimicing the oracle. Results for oracle and CoMET are presented at K = 4 and k = 3 . Truth, the data generating B ; Oracle, the oracle benchmark with kno wn random-effects co variance structure; CoMET , the compressed mixed-ef fects model for tensors; PQL-1, the penalized quasi-likelihood approach of Fan and Li ( 2012 ); and PQL-2, the penalized quasi- likelihood approach of Li et al. ( 2022 ); GEE, the penalized generalized estimating equation approach of Zhang et al. ( 2019 ) with equicorrelation working correlation specification. the remaining modes, and ˇ y be the residual v ector obtained by stacking the dif ference between the observed response and the fitted v alues computed using B ; see the model in ( 11 ). Giv en the observed data, the imputed compressed random-effects ˜ d i = v ec( ˜ D i ) s, ( B , τ 2 ) , and γ d ′ ( d ′ = d ) s, the Gaussian prior on γ d along with 46 its Gaussian likelihood yields the full conditional density as follo ws: f ( γ d | y , ˜ d 1 , . . . , ˜ d n , γ 1 , . . . , γ d − 1 , γ d +1 , . . . , γ 3 , B , τ 2 ) ∝ f ( ˇ y | γ 1 , γ 2 , γ 3 , B , τ 2 ) f ( γ d ) ∝ ( τ 2 ) − N 2 exp − 1 2 τ 2 ( ˇ y − ˇ Z γ d γ d ) ⊤ ( ˇ y − ˇ Z γ d γ d ) ( σ 2 d ) − k 2 d 2 exp − 1 2 σ 2 d γ ⊤ d γ d ∝ ( σ 2 d ) − k 2 d 2 exp − 1 2 γ ⊤ d 1 τ 2 ˇ Z ⊤ γ d ˇ Z γ d + 1 σ 2 d I k 2 d γ − 2 τ 2 ˇ y ⊤ ˇ Z γ d γ d ∝ exp − 1 2 ( γ d − µ γ d ) ⊤ Σ − 1 γ d ( γ d − µ γ d ) , ≡ N ( µ γ d , Σ γ d ) , (76) where µ γ d = τ − 2 Σ γ d ˇ Z ⊤ γ d ˇ y , and Σ γ d = τ − 2 ˇ Z ⊤ γ d ˇ Z γ d + σ − 2 d I k 2 d − 1 respecti vely denote the mean and co- v ariance parameters of the Gaussian density . W e now derive the full conditional distributions of the factor matrices ( B 1 , B 2 , B 3 ) of the three- dimensional fixed-effect coefficient tensor B , and the idiosyncratic error v ariance τ 2 , based on the lik elihood marginalized ov er the imputed compressed random-ef fects ˜ D i s; see model ( 17 ) in the main manuscript. Us- ing the scale mixture representation of the half-Cauchy distribution assigned a priori to the global and local shrinkage parameters in the mar gin-structured Horseshoe prior in ( 6 ) in Section 2.2 of the main manuscript, we obtain the parameter expanded prior specification as β ( g ) d j | λ 2 g d j , δ 2 g , τ 2 ind ∼ N (0 , λ 2 g d j δ 2 g τ 2 ) , λ 2 g d j | ν g d j ind ∼ I G (1 / 2 , 1 /ν g d j ) , δ 2 g | ξ g ind ∼ I G (1 / 2 , 1 /ξ g ) , τ 2 ∼ I G ( a 0 , b 0 ) , ν g d j , ξ g iid ∼ I G (1 / 2 , 1) , g = 1 , . . . , K , d = 1 , 2 , 3 , j = 1 , . . . , p d , (77) where I G ( a, b ) denotes the in v erse-gamma distrib ution with shape parameter a and scale parameter b . The conditional posterior density of the vectorized mode- d factor matrix ˜ β ⊤ d = ( β ⊤ 1 d , . . . , β ⊤ K d ) is then 47 gi ven by f ( ˜ β d | ˜ β 1 , . . . , ˜ β d − 1 , ˜ β d +1 , . . . , ˜ β 3 , τ 2 , γ 1 , γ 2 , γ 3 , λ 2 111 , . . . , λ 2 K 3 p 3 , δ 2 1 , . . . , δ 2 K , ν 2 111 , . . . , ν 2 K 3 p 3 , ξ 1 , . . . , ξ K ) ∝ ( τ 2 ) − N 2 exp − 1 2 τ 2 ( y ∗ − X ∗ B d ˜ β d ) ⊤ ( y ∗ − X ∗ B d ˜ β d ) K Y g =1 ( τ 2 ) − p d 2 exp − 1 2 τ 2 β ⊤ K d ( δ 2 K Λ K d ) − 1 β K d ∝ ( τ 2 ) − N + K p d 2 exp − 1 2 τ 2 ( y ∗ − X ∗ B d ˜ β d ) ⊤ ( y ∗ − X ∗ B d ˜ β d ) exp − 1 2 τ 2 ˜ β ⊤ d { diag ( δ 2 1 Λ 1 d , . . . , δ 2 K Λ K d ) } − 1 ˜ β d ≡ N ( µ B d , τ 2 Σ B d ) , (78) where Σ B d = h X ∗⊤ B d X ∗ B d + { diag ( δ 2 1 Λ 1 d , . . . , δ 2 K Λ K d ) } − 1 i − 1 is a K p d × K p d positi ve definite matrix and Λ g d = diag ( λ 2 g d 1 , . . . , λ 2 g dp d ) is a p d × p d diagonal matrix for g = 1 , . . . , K and d = 1 , 2 , 3 . The conditional posterior density of the squared local shrinkage parameter λ 2 g d j is f ( λ 2 g d j | β , τ 2 , γ 1 , γ 2 , γ 3 , δ 1 , . . . , δ K , ν 2 111 , . . . , ν 2 K 3 p 3 , ξ 1 , . . . , ξ K ) ∝ 1 ( | δ 2 g Λ g d | ) 1 / 2 exp − 1 2 τ 2 β ⊤ g d ( δ 2 g Λ g d ) − 1 β g d ( λ 2 g d j ) − 1 2 − 1 exp − 1 /ν g d j λ 2 g d j ! ∝ p d Y j =1 λ 2 g d j − 1 2 exp − 1 2 τ 2 δ 2 g p d X j =1 β 2( g ) d j λ 2 g d j ( λ 2 g d j ) − 1 2 − 1 exp − 1 /ν g d j λ 2 g d j ! ∝ ( λ 2 g d j ) − 1 − 1 exp − 1 λ 2 g d j 1 ν g d j + β 2( g ) d j 2 τ 2 δ 2 g ≡ I G 1 , 1 ν g d j + β 2( g ) d j 2 τ 2 δ 2 g , g = 1 , . . . , K , d = 1 , 2 , 3 , j = 1 , . . . , p d . (79) The conditional posterior density of the squared global shrinkage parameter δ 2 g corresponding to the g -th 48 rank-1 component in CP decomposition of B is f ( δ 2 g | β , τ 2 , γ 1 , γ 2 , γ 3 , λ 2 111 , . . . , λ 2 K 3 p 3 , ν 2 111 , . . . , ν 2 K 3 p 3 , ξ 1 , . . . , ξ K ) ∝ 3 Y d =1 1 ( | δ 2 g Λ g d | ) 1 / 2 exp − 1 2 τ 2 β ⊤ g d ( δ 2 g Λ g d ) − 1 β g d ( δ 2 g ) − 1 2 − 1 exp − 1 /ξ g δ 2 g ∝ 3 Y d =1 ( δ 2 g ) − p d 2 exp − 1 2 τ 2 δ 2 g p d X j =1 β 2( g ) d j λ 2 g d j ( δ 2 g ) − 1 2 − 1 exp − 1 /ξ g δ 2 g ∝ ( δ 2 g ) − 1+ P 3 d =1 p d 2 − 1 exp − 1 δ 2 g 1 ξ g + 1 2 τ 2 3 X d =1 p d X j =1 β 2( g ) d j λ 2 g d j ≡ I G 1 + P 3 d =1 p d 2 , 1 ξ g + 1 2 τ 2 3 X d =1 p d X j =1 β 2( g ) d j λ 2 g d j , g = 1 , . . . , K . (80) The conditional posterior density of the error v ariance τ 2 is f ( τ 2 | β , γ 1 , γ 2 , γ 3 , λ 2 111 , . . . , λ 2 K 3 p 3 , δ 1 , . . . , δ K , ν 2 111 , . . . , ν 2 K 3 p 3 , ξ 1 , . . . , ξ K ) ∝ ( τ 2 ) − N 2 exp − 1 2 τ 2 ( y ∗ − X ∗ β ) ⊤ ( y ∗ − X ∗ β ) K Y g =1 3 Y d =1 1 ( | τ 2 δ 2 g Λ g d | ) 1 / 2 exp − 1 2 τ 2 β ⊤ g d ( δ 2 g Λ g d ) − 1 β g d ( τ 2 ) − a 0 − 1 exp − b 0 τ 2 ∝ ( τ 2 ) − a 0 − ( N + K P 3 d =1 p d ) / 2 − 1 exp − 1 τ 2 ( y ∗ − X ∗ β ) ⊤ ( y ∗ − X ∗ β ) / 2 + K X g =1 3 X d =1 β 2( g ) d j 2 δ 2 g λ 2 g d j + b 0 ≡ I G a 0 + N + K P 3 d =1 p d 2 , b 0 + 1 2 ( y ∗ − X ∗ β ) ⊤ ( y ∗ − X ∗ β ) + K X g =1 3 X d =1 β 2( g ) d j δ 2 g λ 2 g d j (81) Finally , we outline the full conditional densities of the auxiliary variables ξ g and ν g d j ( g = 1 , . . . , K ; d = 49 1 , 2 , 3; j = 1 , . . . , p d ) as follows: f ( ξ g | β , τ 2 , γ 1 , γ 2 , γ 3 , δ 1 , . . . , δ K , λ 2 111 , . . . , λ 2 K 3 p 3 , ν 2 111 , . . . , ν 2 K 3 p 3 , ξ 1 , . . . , ξ g − 1 , ξ g +1 , . . . , ξ K ) ∝ ( ξ g ) − 1 2 ( δ 2 g ) − 1 2 − 1 exp − 1 /ξ g δ 2 g ( ξ g ) − 1 2 − 1 exp − 1 ξ g ∝ ( ξ g ) − 1 − 1 exp − 1 ξ g 1 + 1 δ 2 g ≡ I G 1 , 1 + 1 δ 2 g , (82) and f ( ν g d j | β , τ 2 , γ 1 , γ 2 , γ 3 , ν g ′ d ′ j ′ , λ 2 111 , . . . , λ 2 K 3 p 3 , δ 1 , . . . , δ K , ξ 1 , . . . , ξ K ) ∝ ( ν g d j ) − 1 2 ( λ 2 g d j ) − 1 2 − 1 exp − 1 /ν g d j λ 2 g d j ! ( ν g d j ) − 1 2 − 1 exp − 1 ν g d j ∝ ( ν g d j ) − 1 − 1 exp ( − 1 ν g d j 1 + 1 λ 2 g d j !) ≡ I G 1 , 1 + 1 λ 2 g d j ! , g ′ = g , d ′ = d, j ′ = j. (83) 50
Original Paper
Loading high-quality paper...
Comments & Academic Discussion
Loading comments...
Leave a Comment