Beyond Procedure: Substantive Fairness in Conformal Prediction
Conformal prediction (CP) offers distribution-free uncertainty quantification for machine learning models, yet its interplay with fairness in downstream decision-making remains underexplored. Moving beyond CP as a standalone operation (procedural fai…
Authors: Pengqi Liu, Zijun Yu, Mouloud Belbahri
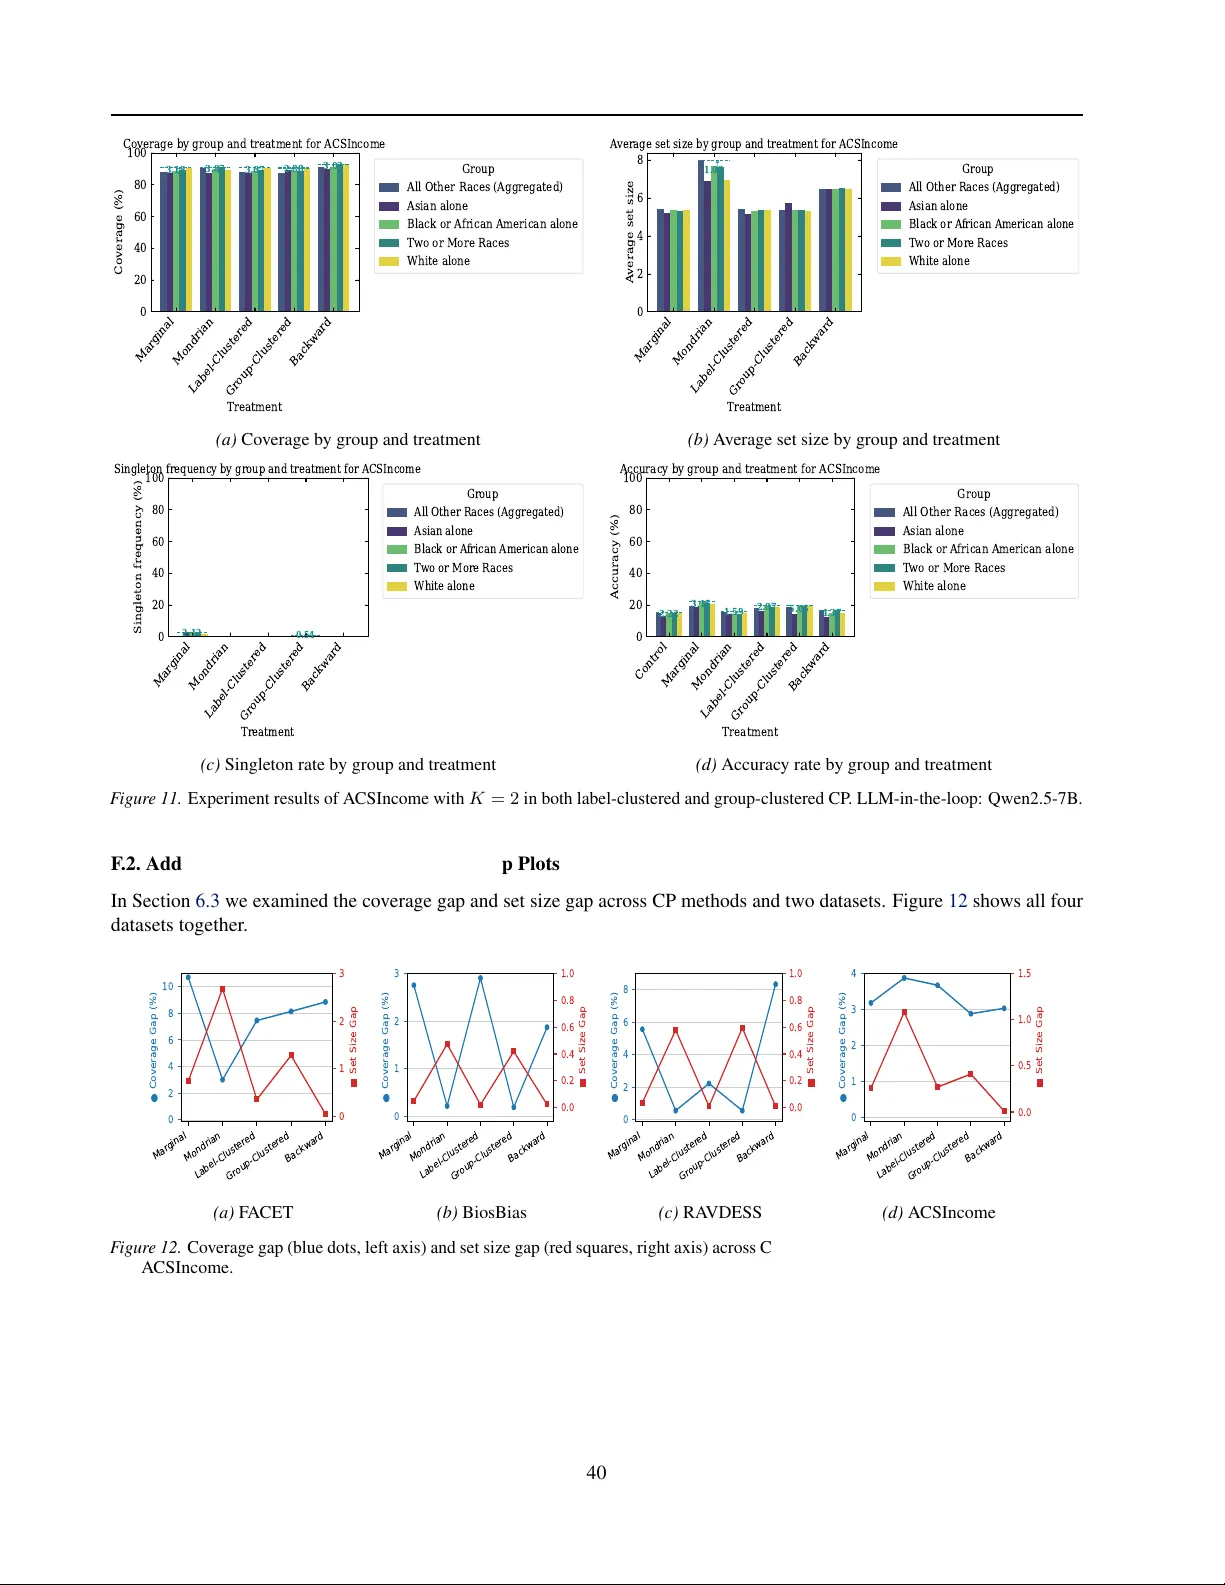
Bey ond Pr ocedure: Substantiv e F airness in Conf ormal Pr ediction Pengqi Liu * 1 Zijun Y u * 1 Mouloud Belbahri 2 Arthur Charpentier 3 Masoud Asgharian 1 Jesse C. Cr esswell 4 Abstract Conformal prediction (CP) offers distrib ution- free uncertainty quantification for machine learn- ing models, yet its interplay with fairness in downstream decision-making remains underex- plored. Moving beyond CP as a standalone operation ( pr ocedural fairness), we analyze the holistic decision-making pipeline to ev aluate sub- stantive fairness—the equity of do wnstream out- comes. Theoretically , we deriv e an upper bound that decomposes prediction-set size disparity into interpretable components, clarifying ho w label- clustered CP helps control method-driven con- tributions to unfairness. T o facilitate scalable empirical analysis, we introduce an LLM-in- the-loop ev aluator that approximates human as- sessment of substantiv e fairness across di verse modalities. Our experiments rev eal that label- clustered CP variants consistently deliv er supe- rior substantiv e fairness. Finally , we empiri- cally show that equalized set sizes, rather than cov erage, strongly correlate with improved sub- stantiv e fairness, enabling practitioners to design more fair CP systems. Our code is av ailable at ht tp s: // gi th ub .c om /l ay er 6a i- la bs /l l m- in- the- loop- conformal- fairness . 1. Introduction Conformal prediction (CP) ( V ovk et al. , 2005 ; Shafer & V ovk , 2008 ) pro vides finite-sample, distrib ution-free sta- tistical guarantees through a well-defined procedure; yet, whether these pr ocedural guarantees translate into equitable outcomes in downstream decision-making remains unclear . In high-stakes domains, reliable uncertainty quantification is essential for building trustworthy models. Unlike other methods that rely on strong assumptions about the data distribution ( Gal & Ghahramani , 2016 ; Lakshminarayanan * Equal contribution, alphabetical order . 1 McGill University , Montreal, Canada 2 TD Insurance, Montreal, Canada 3 UQAM, Montreal, Canada 4 Layer 6 AI, T oronto, Canada. Correspondence to: Pengqi Liu < pengqi.liu@mail.mcgill.ca > . Pr eprint. F ebruary 20, 2026. et al. , 2017 ) or require architectural modifications ( Neal , 2012 ), CP is distribution-free, model-agnostic, and applies directly to any black-box predictor ( Angelopoulos & Bates , 2021 ). Howe ver , the rigorous procedural nature of CP does not automatically ensure equitable outcomes, necessitating a deeper in vestigation into ho w these statistical bounds in- fluence fairness in practice. Fairness in machine learning ( Barocas et al. , 2023 ), par - ticularly in regulated fields such as healthcare and finance, is commonly understood through two complementary per- spectiv es: pr ocedural fairness , which concerns the integrity of the decision process (e.g., fairness through unaw areness ( Zemel et al. , 2013 ; Kusner et al. , 2017 )); and substantive fairness , which focuses on equitable outcomes across groups (e.g., Equalized Odds ( Hardt et al. , 2016 )). Prior research in CP has mainly focused on procedural f airness, treating CP as a standalone process ( Romano et al. , 2020a ). In practice, CP constitutes one step in a larger pipeline that includes downstream decisions. The interactions of CP with pro- cedural and substantiv e notions of fairness in this broader context remain less well understood ( Cresswell , 2025 ). In this work, we mo ve beyond vie wing CP as a standalone operation to analyze the holistic decision-making pipeline. While ultimate fairness is defined by substanti ve outcomes, procedural choices within CP play a critical role in shaping these results. W e aim to unco ver the specific connections between procedural properties and substanti ve fairness, en- abling the design of procedures that positi vely influence downstream equity . By ev aluating fairness as an emer gent property of the entire pipeline, we can distinguish between procedural metrics that are merely performati ve and those that genuinely driv e fair outcomes. Our main contributions are threefold: Scalable LLM-in-the-loop fair ness evaluation. T o ov er- come the resource constraints of human-subject experi- ments, we leverage large language models (LLMs) in an ev aluation protocol that approximates human decision be- havior . W e validate that this e valuator produces results comparable to human-in-the-loop benchmarks, enabling us to scale our analysis of substantiv e fairness across a broader range of datasets and algorithms than prior work. Connecting procedural pr operties to substantive fair - ness. W e explicitly map the relationships between procedu- 1 Beyond Pr ocedure: Substantive F airness in Conformal Pr ediction ral CP metrics and substantive outcomes. Crucially , we find that Equalized Set Size correlates strongly with improv ed substanti ve fairness, whereas the standard goal of Equalized Covera ge often has ne gativ e effects. This insight shifts the design objectiv e from coverage parity to set size parity . Theoretical and empirical validation of Label-Cluster ed CP . Guided by the connection between set sizes and sub- stanti ve fairness, we analyze Label-Clustered CP . W e derive a theoretical upper bound decomposing the set size disparity into interpretable components. Experimentally , we confirm that Label-Clustered CP reduces set size disparity more ef- fectiv ely than marginal or group-conditional approaches, and consistently achiev es the best substantiv e fairness re- sults in our ev aluations. 2. Background 2.1. Conformal Set Pr edictors Consider inputs x ∈ X ⊂ R d with ground truth labels y ∈ Y = [ m ] := { 1 , . . . , m } , dra wn from a joint distri- bution ( x, y ) ∼ P . Let f : X → ∆ m − 1 ⊂ R m be a classifier outputting predicted probabilities, where ∆ m − 1 is the ( m − 1) -dimensional probability simplex. CP con- structs a set-valued function C : X → P ( Y ) where P ( Y ) denotes the po wer set of Y , such that the follo wing marginal covera ge guarantee holds, P [ y ∈ C ( x )] ≥ 1 − α, (1) where α ∈ [0 , 1] is user-specified ( V o vk et al. , 1999 ; 2005 ). CP achiev es cov erage by varying set size |C ( x ) | based on a calibrated notion of model confidence. Calibration relies on a held-out dataset D cal = { ( x i , y i ) } n cal i =0 consisting of n cal datapoints drawn from P . A conformal scor e function s : X × Y → R measures non-conformity between a candidate label and an input datapoint x , with higher scores indicating poorer agreement. The score function is often defined to make use of information from the classifier f in judging the lev el of agreement. Let S i := s ( x i , y i ) for i ∈ [ n cal ] , and define τ α := ⌈ ( n cal + 1)(1 − α ) ⌉ n cal ∈ (0 , 1] . (2) The empirical conformal threshold is then giv en by ˆ q α := Quan tile τ α ( S 1 , . . . , S n cal ) ∈ R . (3) For a test point x test drawn from the x -marginal of distrib u- tion P , a conformal pr ediction set is constructed as C ˆ q α ( x test ) := { y ∈ Y | s ( x test , y ) ≤ ˆ q α } . (4) Sets constructed this w ay will satisfy 1 − α cov erage (Equa- tion ( 1 )) for any score function s , but smaller sets are more useful for downstream uncertainty quantification applica- tions ( Cresswell et al. , 2024 ). The av erage set size E [ |C | ] is dictated by the quality of s , and in turn by the accuracy and calibration of the classifier f . Efficient score functions like APS ( Romano et al. , 2020b ), RAPS ( Angelopoulos et al. , 2021 ), and SAPS ( Huang et al. , 2024 ) aim to minimize E [ |C | ] while maintaining coverage. 2.2. Fair ness Notions for Set Predictors W e briefly re view common fairness notions in machine learn- ing and discuss how the y apply to conformal set predictors. Let A = [ k g ] denote a finite set of sensiti ve group labels, and let g : X → A be a group assignment function. Each group is defined as G a := { x ∈ X : g ( x ) = a } , a ∈ A . (5) Fair ness via non-discrimination criteria. In classical su- pervised learning with point predictions, statistical fairness notions often require parity of prediction behavior across groups. For example, demographic parity requires P ( ˆ y = 1 | X ∈ G a ) = P ( ˆ y = 1 | X ∈ G b ) , ∀ a, b ∈ A , with y = 1 denoting some important outcome, while Equalized Odds further conditions on the true label ( Hardt et al. , 2016 ). These criteria aim to ensure that outcomes are not systematically ske wed by group membership, and hence are aligned with substanti ve fairness—the predomi- nant paradigm for fairness in regulatory frame works ( OCC , 2026 ), and in machine learning ( Green , 2022 ). In CP , non-discrimination fairness is commonly formulated in terms of gr oup-conditional coverag e , where C satisfies P y ∈ C ( x ) | x ∈ G a ≥ 1 − α, ∀ a ∈ A . (6) Each group receives the same nominal statistical guaran- tee, achieving Equalized Co verag e ( Romano et al. , 2020a ). Mondrian CP achiev es Equation ( 6 ) by using the prede- fined grouping function g to calibrate conformal thresholds separately within each group ( V ovk et al. , 2003 ). Since this means partitioning the calibration set D cal , each group is calibrated on a smaller sample, leading to increased variance of empirical cov erage ( Zwart , 2025 ; Gibbs et al. , 2025 ). Howe ver , Equalized Coverage focuses on the construction of prediction sets—an intermediate tool for uncertainty quantification. Hence it is a procedural notion, ignoring how sets are used and what their downstream impact may be. Cresswell et al. ( 2025 ) sho wed via randomized controlled trials that equalizing cov erage causes disparate impact in downstream tasks where people use prediction sets as deci- sion aids. Equalized Set Size was proposed as an alternative fairness notion for CP . While still procedural in nature, this notion better correlated with reduced disparate impact. 2 Beyond Pr ocedure: Substantive F airness in Conformal Pr ediction 2.3. Advanced Conf ormal Prediction V ariants Beyond mar ginal and group-conditional co verage, se veral CP variants target alternati ve statistical guarantees. Exact conditional cov erage at ev ery x ∈ X is known to be impos- sible without strong assumptions ( V ovk , 2012 ; Lei et al. , 2013 ; Foygel Barber et al. , 2021 ). Instead, clustered con- formal prediction ( Ding et al. , 2023 ) seeks approximate conditional coverage by partitioning the label space into clusters via a learned clustering function h : Y → [ K ] , and calibrating independent thresholds ˆ q k for each cluster k ∈ [ K ] . F or a test input x test , each label y is included in C ( x test ) if its score s ( x test , y ) is below the threshold ˆ q h ( y ) . Clustered conditional cov erage follows as P [ y test ∈ C ( x test ) | h ( y test ) = k ] ≥ 1 − α, (7) for all clusters. This adapts thresholds to label-specific diffi- culty , yielding empirically improv ed conditional cov erage without requiring predefined instance groups. The same partitioning-through-clustering strate gy also ap- plies when we partition the gr oup space into clusters via a learned clustering function ˜ h : A → [ K ] , and calibrate independent thresholds for each cluster of groups. W e re- fer to these two methods as Label-Clustered and Gr oup- Clustered CP , respectiv ely . Backward CP ( Gauthier et al. , 2025 ) re verses the usual prioritization: instead of fixing the coverage lev el α and accepting variable set sizes, it constrains the set size via a data-dependent rule T while providing a relax ed marginal cov erage guarantee: P [ y test ∈ C ( x test )] ≥ 1 − E [ ˜ α ] , (8) where the random v ariable ˜ α > 0 is chosen to respect the size constraint. The prediction set is constructed using e-values ( V o vk , 2025 ) deriv ed from the non-conformity scores; labels with suf ficiently small e-v alues are included until the size constraint is reached. Detailed mathematical formulations and pseudocode for Marginal, Mondrian, Label-Clustered, Group-Clustered, and Backward CP are provided in Appendix B . 3. Related W ork The study of f airness in applications of CP is an emergent field, and several alternativ e directions have recently been in- troduced. Initially researchers adopted Equalized Coverage ( Romano et al. , 2020a ; Zhou & Sesia , 2024 ) and suggested pursuing it in deployments of CP ( Lu et al. , 2022 ; Zerv a & Martins , 2024 ; Garcia-Galindo et al. , 2025 ). More recently this standard has been reexamined, with significant concerns being raised about its practical consequences ( Cresswell et al. , 2025 ). More broadly , researchers have applied ex- isting group algorithmic fairness notions to prediction sets, including demographic parity ( Liu et al. , 2022 ), Equal Op- portunity ( W ang et al. , 2024 ), and others ( V adlamani et al. , 2025 ). Individual f airness notions like counterfactual fair - ness ( Kusner et al. , 2017 ) hav e also been extended to CP ( Guldogan et al. , 2025 ). While these notions have been applied in various settings ( Kuchibhotla & Berk , 2023 ; Berk et al. , 2023 ; Srini vasan et al. , 2025 ), the fairness definitions abov e pertain only to coverage and the construction of prediction sets, rather than impact in downstream tasks. One exception is the work of T asar ( 2025 ), which defers decisions to an alternate process—such as a human-in-the-loop—unless the model expresses confidence via a singleton prediction set. They propose the deferral gap —the difference in deferral rates across groups—as a substanti ve fairness metric. Howe ver , they only instantiated the alternate process through random class assignment which decouples the assessment of fair - ness and prediction set properties from do wnstream task performance. In contrast, we incorporate downstream usage directly into our definition and measurement of fairness. 4. Methodology Group-conditional cov erage (Equation ( 6 )) is a natural pr o- cedural fairness goal for CP , but coverage alone does not fully characterize fairness in do wnstream decision-making. In particular , prediction sets with equal coverage may dif- fer systematically across groups in size or informati veness, leading to unequal benefits when these sets are used by hu- mans or automated decision rules ( Cresswell et al. , 2025 ). Our ultimate goal is to promote substantive fairness in do wn- stream decision-making by using prediction sets. T o this end, we de velop a rob ust e valuation framew ork for assessing substantiv e fairness of CP methods. Using this pipeline, we study how procedural f airness notions (e.g., Equalized Cov- erage and Equalized Set Size) affect substantiv e fairness, how substanti ve fairness changes with dif ferent prediction- set characteristics, and which CP methods are most ef fectiv e for supporting equitable downstream performance. As noted by Cresswell et al. ( 2025 ), equalizing cov erage can increase set size disparities, which may in turn amplify substantiv e unfairness. Motiv ated by this finding, we focus our analytical work on approaches that prioritize equalizing set size rather than equalizing coverage. Concretely , we con- sider Label-Clustered CP , discussed in Section 2.3 , which mitigates set size disparity by clustering similar datapoints regardless of group. In this section we theoretically justify why Label-Clustered CP reduces set size gaps, then present our ev aluation framework for assessing substanti ve fairness in CP . 3 Beyond Pr ocedure: Substantive F airness in Conformal Pr ediction 4.1. Label-Clustered CP Reduces Set Size Disparity Let A ∈ A be the protected attribute and consider groups a, b ∈ A . The expected set size disparity between groups is ∆ a,b = E |C ( X ) | | A = a − E |C ( X ) | | A = b . (9) For Label-Clustered CP we deri ve an upper bound that de- composes ∆ a,b into three interpretable components which can explain why label clustering often empirically yields smaller ∆ a,b than Marginal or Mondrian CP . This bound makes explicit how the number of clusters K af fects method- driv en components in ∆ a,b . Theorem 4.1 (Label-Clustered CP set size disparity bound) . F ix any label-clustering map h : Y → [ K ] and let Y k := { y ∈ Y : h ( y ) = k } . Consider a label-clustered conformal set pr edictor C that uses cluster-specific thr esholds. F or any y ∈ Y , k ∈ [ K ] , and gr oup a ∈ A , define µ k,a := E [ |C ( X ) | | h ( Y ) = k , A = a ] , (10) r y ,a := E [ |C ( X ) | | Y = y , A = a ] , and (11) ϵ k,a := max y ∈Y k r y ,a − min y ∈Y k r y ,a . (12) Then, for any two gr oups a, b , ∆ a,b ≤ max k =1 ,...,K ϵ k,a | {z } (I): Intra-cluster label heterogeneity + max k =1 ,...,K µ k,a − min k =1 ,...,K µ k,a | {z } (II): Cross-cluster spread + X y ∈Y P ( Y = y | A = b )( r y ,a − r y ,b ) | {z } (III): Intra-label cross-group disparity . (13) The proof of Theorem 4.1 is given in Appendix A , with a detailed justification of wh y Label-Clustered CP reduces set size disparity across groups. Here, we provide interpreta- tions and implications of Theorem 4.1 . The quantities we define each break do wn labels, groups, and clusters in dif- ferent ways: µ k,a represents the expected set size of a gi ven group in a gi ven cluster (across labels), while r y ,a looks at label y within group a (across clusters). ϵ k,a is the spread of set size across labels in cluster k , conditioned on one group. Theorem 4.1 highlights three driv ers of set size disparity: (I) Intra-cluster label heter ogeneity : If clusters bring to- gether labels with similar dif ficulty le vels, then labels within each cluster tend to have similar e xpected set sizes, making each ϵ k,a small. This explains why K = 1 (Marginal CP) can yield a large ϵ 1 ,a – all labels are forced into a single cluster , so intra-cluster label heterogeneity can be high. (II) Cross-cluster spread : Consider the case of K = |Y | where each label forms a cluster . Although the intra-cluster label heterogeneity is minimized ( ϵ k,a = 0 ), conformal thresholds become unstable for rare labels, yielding large disparity in set size between clusters. W ith a proper choice of K , Label-Clustered CP can make the expected set size more comparable across clusters while controlling ϵ k,a . (III) Intra-label cross-gr oup disparity captures set size disparity between groups but within labels. Compared to Mondrian CP , Label-Clustered CP avoids inflating this com- ponent because it uses shared thresholds across protected groups (within each label-cluster) and pools calibration data across groups, reducing v ariance and preventing artificial group differences; see Appendix A for detailed comparison. Overall, the bound in Equation ( 13 ) highlights two clustering-dependent driv ers: intra-cluster label heterogene- ity and cross-cluster spread. In our experiments we study the behaviour of these terms indi vidually . 4.2. LLM-in-the-loop Substantive F airness Evaluation Evaluating the downstream impact of CP on decision- making typically requires expensi ve and dif ficult-to-scale human trials. T o address this, we propose an LLM-in-the- loop ev aluation framework which offers k ey adv antages: (i) LLMs exhibit approximate i.i.d. behavior across e valuations, av oiding human fatigue, learning effects, and temporal drift which all increase v ariance; (ii) they are adaptable to hetero- geneous tasks across div erse data modalities; (iii) the y allo w for scalable, robust statistical e valuation. Most importantly , we show that our LLM-in-the-loop e valuator reproduces the same qualitativ e ordering of substantive fairness metrics ob- served in prior human-in-the-loop e xperiments ( Cresswell et al. , 2025 )—particularly that Mondrian CP e xhibits higher disparate impact than Mar ginal (see Section 6.1 and Ap- pendix E.1 ). In this section, we define substanti ve fairness within this frame work and detail our estimation procedure using Generalized Estimating Equations (GEE). Substantive fairness as decision impr ovement. W e ground our definition of substantiv e fairness in the concrete benefit provided to the decision-maker . Let Acc( x, ˆ y , C ( x )) denote the decision accuracy achiev ed by the agent that pre- dicts ˆ y giv en input x and prediction set C ( x ) . W e define the gr oup-specific impr ovement as the e xpected lift in utility pro- vided by the CP method relative to a control baseline where the agent acts without a prediction set (i.e., C ( x ) = ∅ ). For a protected group a ∈ A , this is giv en by δ t,a := E Acc( x, y , C t ( x )) − Acc( x, y , ∅ ) | x ∈ G a , where t stands for a CP method. For substanti ve fairness we require that the improvement be consistent across groups, i.e., there is no disparate impact. Hence, we quantify unfair- ness as the maximum disparity between groups: ∆ t := max a,b ∈A δ t,a − δ t,b . (14) A disparity ∆ t ≈ 0 indicates that the CP method t improv es downstream decision-making equally for all groups. Estimation of ∆ t via Generalized Estimating Equations. Directly computing empirical averages for Equation ( 14 ) 4 Beyond Pr ocedure: Substantive F airness in Conformal Pr ediction is prone to confounding factors, such as systematic v aria- tions in task difficulty and the agent’ s willingness to rely on the provided sets. T o obtain robust, statistically valid esti- mates of ∆ t , and to take into account the correlation among predictions made for the same task under the assistance of different CP sets, we emplo y a logistic GEE regression. For any data modality we assume access to a predictiv e model used to generate conformal sets via a CP algorithm t and fixed score function. W e then provide an LLM (or multi- modal foundation model) with a description of the task, a test datapoint x j , corresponding prediction set C t ( x j ) , and a statement of the coverage guarantee (i.e., 1 − α ). The LLM is used to generate M independent predictions ˆ y m j t , m ∈ [ M ] . Then we define R j t := 1 M P M m =1 1 { ˆ y m j t = y j } , the proportion of correctly predicted responses for x j with CP method t . W e model the probability of correctness with key cov ariates and clustering by task to account for intra- instance correlations, for which GEEs are suitable ( Liang & Zeger , 1986 ). The regression model is specified as logit ( E [ R j t ]) ∼ treat t × group j + diff j + adoption j t . (15) Here, group j is the group that x j belongs to, treat t × group j captures the interaction of interest; diff j approximates task difficulty (using Mar ginal CP set size); and adoption j t mea- sures the proportion of the agent’ s predictions adopted from the provided set C t ( x j ) . This adoption cov ariate is crucial for generalizing results, as it accounts for v arying lev els of faith the agent places in the CP sets it is sho wn. Quantifying fairness with maxR OR. From the fitted GEE model, we compute the marginal probability p t,a of a correct response for treatment t and group a . W e con vert these probabilities into odds ratios (ORs) relative to the control baseline: OR t,a := p t,a / (1 − p t,a ) p control ,a / (1 − p control ,a ) . (16) OR t,a > 1 indicates that treatment t improv es the LLM’ s accuracy for group a , compared to the control. T o measure the disparity of improvement across groups a and b , we com- pute the ratio of odds ratios (R OR) and take the maximum ov er all pairs. This yields our primary metric for substantiv e fairness, the maxR OR : maxR OR t := max a,b ∈A OR t,a OR t,b − 1 . (17) maxR OR is a principled way of measuring disparity (Equa- tion ( 14 )) that accounts for factors such as the difference in difficulty between groups. A maxR OR t close to zero implies no downstream disparate impact from the use of CP method t , while a value of 0.10 (10%), for example, indi- cates that one group benefited 10% more than another . W e primarily report maxR OR % values from our LLM-in-the- loop e valuator to quantify substanti ve fairness. Additional technical details on the ev aluator are giv en in Appendix C . 5. Experimental Setup 5.1. Experimental Design Our experiments in vestigate the interplay of procedural and substantiv e fairness notions in CP . W e employ the LLM-in- the-loop e valuator described in Section 4.2 to answer four core research questions: RQ1 Alignment: Does the LLM-in-the-loop evaluator faith- fully reflect decision-making behaviors observed in humans? W e validate that our LLM-in-the-loop e valuator aligns with prior human-subject studies, showing that it is a meaningful proxy , enabling scalable substanti ve fairness e valuation. RQ2 Substantive Benchmarking: Which CP methods achie ve substantive fairness, while still being useful? W e ev aluate sev eral CP methods to determine which is most fair in downstream tasks (lowest maxR OR ), with ov erall utility of the prediction sets in mind. RQ3 Metric Correlation: Do pr ocedural fairness metrics corr elate with substantive fairness? W e analyze the relationship between procedural notions (Equalized Cov erage, Equalized Set Size) and our substan- tiv e metric ( maxR OR ) to determine if procedural metrics can be diagnostic indicators of downstream f airness. RQ4 Theoretical V erification: Can our theor etical analy- sis of Label-Cluster ed CP be experimentally verified? W e validate our theoretical analysis of set size disparity for Label-Clustered CP (Section 4.1 ) through ablations and numerical studies. Further details on datasets, CP score functions, hyperparam- eter tuning, and prompt engineering for the LLM-in-the- loop are provided in Appendix D . Our code implementing CP methods and the LLM e v aluator on these tasks is av ail- able at this Github repo . 5.2. T asks, Datasets, and Models W e ev aluate our methods on four prediction tasks spanning vision, text, audio, and tabular modalities, using open-access datasets commonly studied in algorithmic fairness. In all settings, CP is applied to the outputs of task-specific base models to construct prediction sets, and a foundation model uses those sets as decision aids on the downstream task. Image Classification. W e use the F A CET dataset ( Gustafson et al. , 2023 ), predicting one of 20 occupation classes from images. Age (Y ounger , Middle, Older, Un- known) defines the protected groups. Prediction sets are generated using a zero-shot CLIP V iT -L/14 model as the base model ( Dosovitskiy et al. , 2021 ; Radford et al. , 2021 ), while Qwen2.5-VL-7B-Instruct is used as the LLM-in-the- loop for its vision-language capabilities ( Bai et al. , 2025 ). T ext Classification. W e consider occupation prediction on 5 Beyond Pr ocedure: Substantive F airness in Conformal Pr ediction T able 1. Base Model and CP Method Metrics on D test . T ask Acc ∆ Acc CP Method Cvg Size F A CET 70.0 22.2 Marginal 89.9 2.62 Mondrian 89.9 2.66 Label-Clustered 89.1 2.92 Group-Clustered 89.3 2.51 Backward 90.1 3.50 BiosBias 78.9 2.70 Marginal 89.5 1.68 Mondrian 90.0 1.80 Label-Clustered 90.3 1.75 Group-Clustered 90.2 1.75 Backward 91.5 2.50 RA VDESS 70.3 6.11 Marginal 88.3 1.89 Mondrian 87.5 1.86 Label-Clustered 87.8 1.92 Group-Clustered 87.5 1.90 Backward 91.9 2.48 A CSIncome 31.0 5.71 Marginal 89.8 5.35 Mondrian 89.5 7.16 Label-Clustered 89.9 5.33 Group-Clustered 89.8 5.37 Backward 92.3 6.50 T able 2. Human vs. LLM Evaluator Comparison (maxR OR %). Human-in-the-loop LLM-in-the-loop Dataset Marginal Mondrian Marginal Mondrian F A CET 26 51 9.0 38 BiosBias 12 33 6.9 8.1 RA VDESS 1.0 28 11 79 the BiosBias dataset ( De-Arteaga et al. , 2019 ), restricted to the 10 most frequent classes with binary gender as the sen- sitiv e attribute. A linear classifier trained on frozen BER T representations ( Devlin et al. , 2019 ) acts as the base model, and GPT -4o-mini as the LLM-in-the-loop ( OpenAI , 2024 ). A udio Emotion Recognition. W e use the RA VDESS dataset ( Livingstone & Russo , 2018 ) to classify audio clips into eight emotion classes, with binary gender as the group attribute. Base predictions are obtained from a fine-tuned wa v2vec 2.0 model ( Bae vski et al. , 2020 ), and GPT -4o- audio-previe w acts as the LLM-in-the-loop for its audio capabilities ( OpenAI , 2026 ). T abular Prediction. W e predict income brackets on the A CSIncome dataset from Folktables ( Ding et al. , 2021 ), using race (aggregated) as the group attribute. An XGBoost classifier ( Chen & Guestrin , 2016 ) is the base model, while Qwen2.5-7B is the LLM-in-the-loop ( Y ang et al. , 2024a ). T able 1 shows a summary of base model and CP metrics on the test set, including accuracy and the maximum accurac y gap between groups, ∆ Acc . Cvg is the empirical cov erage, and Size is the a verage set size, where 1 − α = 0 . 9 . Metrics are not av eraged across calibration-test splits. F ACET BiosBias RA VDES S ACSIncome 0 20 40 60 80 100 maxROR (%) maxROR (%) by Dataset and Treatment Treatment Marginal Mondrian Label-Clustered Group-Clustered Backward F igure 1. maxR OR (%) of each CP method across four tasks. Lower is more substanti vely fair . F ACET BiosBias RA VDES S ACSIncome 0 5 10 15 20 25 Accuracy Improvement (%) Accuracy Improvement by Dataset and Treatment Treatment Marginal Mondrian Label-Clustered Group-Clustered Backward F igure 2. Accuracy impro vement (%) relati ve to Control of each CP method, across four tasks. Higher is better . 6. Results 6.1. RQ1: V alidation of LLM-in-the-loop Evaluation First, we v alidate that our LLM-in-the-loop ev aluator re- produces a key qualitativ e pattern of substantive fairness reported in prior human-in-the-loop experiments. Due to the cost of human e valuation, Cresswell et al. ( 2025 ) only ev aluated two CP methods, Marginal and Mondrian, on three datasets, F A CET , BiosBias, and RA VDESS. They found that Mondrian CP induced greater disparate impact on downstream prediction accurac y compared to Marginal. In T able 2 we compare maxROR measurements between the human experiment data collected by Cresswell et al. ( 2025 ), and with our LLM ev aluator . LLM-in-the-loop consistently reproduces the qualitati ve maxROR ordering for Marginal and Mondrian CP , with Mondrian showing greater unfairness across all three datasets. This consistency supports the use of our LLM-in-the-loop e valuator as a scalable proxy for diagnosing substantive fairness trends and rankings across CP methods. See Appendix E.1 for further calibration details of the LLM-in-the-loop ev aluator . 6.2. RQ2: Substantive F airness Benchmarking Having verified that our LLM-in-the-loop ev aluator has similar qualitative beha viour to human decision-makers, we address the question: Which CP methods ar e most fair 6 Beyond Pr ocedure: Substantive F airness in Conformal Pr ediction Mar ginal Mondrian Label-Cluster ed Gr oup-Cluster ed Backwar d 0 1 2 3 Coverage Gap (%) 0.0 0.2 0.4 0.6 0.8 1.0 Set Size Gap (a) BiosBias Mar ginal Mondrian Label-Cluster ed Gr oup-Cluster ed Backwar d 0 2 4 6 8 Coverage Gap (%) 0.0 0.2 0.4 0.6 0.8 1.0 Set Size Gap (b) RA VDESS F igure 3. Coverage gap (blue dots, left axis) and set size gap (red squares, right axis) across CP methods. The two procedural fairness metrics are in direct tension. Corresponding plots for F A CET and A CSIncome are in Appendix F . in downstr eam tasks? W e again measure the maxR OR metric, b ut co ver a wider v ariety of CP methods and datasets than prior research. In addition, sets should be helpful as a decision aid, so we also consider the ov erall accuracy of the LLM-in-the-loop on its task, relativ e to the control where no prediction set is provided. Our results in Figure 1 identify Backward and Label-Clustered CP as the most substantively fair methods on a verage, b ut also that Label- Clustered CP is the more helpful of the two (Figure 2 ). On F ACET and BiosBias, Backward CP achie ved the lo west maxR OR . Howe ver , Backward CP suf fers from larger set size than other CP methods, partially due to its conservati ve empirical cov erage (T able 1 ), and hence also is less help- ful for the task as seen by lo wer accuracy impro vement in all comparisons. Meanwhile, Label-Clustered CP offers a robust balance between ef ficiency and substantiv e fairness. Its maxROR was considerably lo wer than Backward on RA VDESS and A CSIncome, with much greater helpfulness to the decision maker . In contrast, Mondrian and Group-Clustered CP are nev er optimal in terms of maxR OR and induced by far the most unfair outcomes for F A CET and RA VDESS. For BiosBias they lead to the highest accuracy impro vements, b ut clearly these improv ements are not shared equally across groups in the data. Mondrian and Group-Clustered CP by design equalize cov erage across groups, but this may be in opposi- tion to downstream equity . Extended details on these experiments are in Appendix E.2 , including an ablation with a different LLM on BiosBias. 6.3. RQ3: Procedural and Substantive Corr elations Next, we ask: Which pr ocedural fairness metric corr elates most str ongly with substantive fairness? T raditionally , re- searchers ha ve focused on minimizing the coverage g ap ( Romano et al. , 2020a ), with more recent studies recom- mending set size gap as an alternative ( Cresswell et al. , 2025 ). Figure 3 demonstrates that these tw o procedural met- 0 2 4 6 8 10 Coverage Gap (%) 0 20 40 60 80 100 maxROR (%) 0.0 0.5 1.0 1.5 2.0 2.5 Set Size Gap F ACET Marginal Mondrian Label-Clustered Group-Clustered Backward BiosBias Marginal Mondrian Label-Clustered Group-Clustered Backward RA VDES S Marginal Mondrian Label-Clustered Group-Clustered Backward ACSIncome Marginal Mondrian Label-Clustered Group-Clustered Backward F igure 4. maxROR (%) compared to the coverage gap (Left) and set size gap (Right) between groups, across CP methods and datasets. Regression lines are fitted for each dataset individually to show trends. rics are in diametric opposition; CP methods optimize one at the expense of the other . Understanding which of these metrics correlates with substanti ve fairness enables its use as an early diagnostic signal of unfairness before expensi ve downstream deplo yments are undertaken. In Figure 4 we plot the procedural f airness metrics against our substanti ve metric, maxR OR for each dataset and CP method. Since the metrics are on dif ferent scales between datasets, we also plot indi vidual regression lines for the data from each dataset. W e clearly see that all four re gressions for the coverage gap have negati ve slope; decreasing the cov erage gap (equalizing cov erage between groups) leads to higher maxROR (greater unfairness). The set size gap data on the other hand shows positiv e slopes, such that decreasing it (equalizing set size) also decreases maxROR . From these consistent trends across datasets it is evident that Equalized Set Size as a procedural fairness notion is also aligned with substanti ve fairness goals of do wnstream equity , whereas Equalized Cov erage is activ ely inequitable. 6.4. RQ4: Effect of Label-Clustered CP on Set Size Gap Knowing that set size gap is a relev ant predictor of do wn- stream fairness, we revisit our theoretical analysis from Section 4.1 and verify its insights experimentally . In Theo- rem 4.1 we decomposed the set size disparity ∆ a,b (Equa- tion ( 14 )) into three components that are af fected by label clusters and groups in the data. W e now examine the be- haviour of the bound ov erall, the interplay of the three terms, and the effect of Label-Clustering CP’ s main hyperparame- ter—the number of clusters K . First, using the BiosBias and RA VDESS datasets in Figure 5 , we v ary the number of clusters from K = 1 (Marginal CP) up to the total number of classes m , and compute the av erage set size gap for Label-Clustered CP o ver 10 random calibration–test splits. The observed relationship between K and ∆ a,b exhibits a clear V -shaped pattern with a minimum of set size disparity at K = 2 , and sharp increase for K = 1 . This connects back to Label-Clustered CP’ s ability to reduce 7 Beyond Pr ocedure: Substantive F airness in Conformal Pr ediction 1 2 3 4 5 6 7 8 9 10 Number of Clusters (K) 0.060 0.065 0.070 0.075 0.080 0.085 A vg. Set Size Gap |F emale - Male| (a) BiosBias 1 2 3 4 5 6 7 8 Number of Clusters (K) 0.03 0.04 0.05 0.06 0.07 A vg. Set Size Gap |F emale - Male| (b) RA VDESS F igure 5. A verage prediction set size gap between Female and Male on the BiosBias and RA VDESS datasets ov er 10 random splits. The maximum standard error of the ave rage set size gap is .016 in (a) and .010 in (b). substantiv e unfairness compared to Marginal (Figure 1 ) by reducing the set size gap; clustering combines datapoints with similar labels regardless of group such that model confidence can be calibrated accurately within the clusters. W e show more detail on the behaviour of the three terms separately for RA VDESS in Figure 6 . While term III is generally the lar gest and gi ves rise to the distinctive V shape with a minimum at K = 2 , the other terms’ beha vior closely aligns with the discussion in Section 4.1 . When K = 1 (Marginal CP), term II, the cross-cluster spread of expected set sizes, is of course minimized, but term I remains large due to substantial label heterogeneity within the single clus- ter . Increasing K reduces intra-cluster label heterogeneity I, while the cross-cluster spread II increases as calibration becomes less stable for small clusters. Finally , in Figure 7 we demonstrate the tightness of the bound on RA VDESS by numerically computing ∆ a,b vs. the sum of all three terms. The bound is reasonably tight, demonstrating a regular and small bias, allo wing us to rely on the interpretations of the three individual terms. Overall, these e xperiments v alidate the theoretical statement that, with a carefully chosen number of clusters, Label- Clustered CP can more ef fectiv ely balance label adaptivity and calibration stability to improve set size disparity , which correlates strongly with substantive fairness. Our decom- position gi ves insight into why Label-Clustered CP is able to achieve better procedural fairness (Equalized Set Size) than other CP methods (Figure 3 ), and by e xtension better substantiv e fairness (Figure 1 ). 6.5. Practical Guidelines Based on these theoretical and empirical findings, we of- fer the follo wing recommendations for deploying CP in fairness-critical decision pipelines: Evaluate both procedural and substantive fairness: Equality and equity are both noble pursuits, b ut can some- times be at odds (Figure 4 left). Determine which criteria 1 2 3 4 5 6 7 8 Number of Clusters (K) 0.00 0.02 0.04 0.06 0.08 0.10 T er m (I) T er m (II) T er m (III) (a) All three terms 1 2 3 4 5 6 7 8 Number of Clusters (K) 0.000 0.002 0.004 0.006 0.008 0.010 0.012 T er m (I) T er m (II) (b) T erms I and II F igure 6. Numerical computation of the three terms in Equa- tion ( 13 ) vs. number of clusters K on RA VDESS. 1 2 3 4 5 6 7 8 Number of Clusters (K) 0.02 0.04 0.06 0.08 0.10 a , b Upper Bound F igure 7. Numerical computation of ∆ a,b vs. the upper bound from Equation ( 13 ) on RA VDESS with Label-Clustered CP . The bound is reasonably tight and faithfully reflects the shape of ∆ a,b as K is v aried. cannot be compromised on prior to building CP systems, and ev aluate metrics reflecting both notions throughout de- velopment. Prioritize minimizing set size gaps: Do not optimize for Equalized Cov erage in isolation. Equalized Set Size corre- lates strongly with substantiv e fairness, whereas equalizing cov erage tends to increase maxROR (Figure 4 ). A void demographic conditioning: Methods that explicitly condition on the protected group (e.g., Mondrian, Group- Clustered) tend to amplify set size disparity to satisfy co v- erage constraints. Instead, conditioning on labels (Label- Clustered CP) calibrates thresholds within clusters of similar difficulty , which naturally balances sets without baking in group biases. 7. Conclusion In this work, we mo ved be yond the view of conformal pre- diction as a standalone procedure, and e valuated its impact on substantive fairness in downstream decision-making. By designing a scalable LLM-in-the-loop ev aluator , we demon- strated that the standard procedural f airness notion, Equal- ized Coverage, often fails to translate into equitable out- comes. Instead, our findings highlight that equalizing set size is the critical procedural le ver that correlates with sub- stantiv e fairness, with Label-Clustered CP achieving the 8 Beyond Pr ocedure: Substantive F airness in Conformal Pr ediction most effecti ve balance of utility and equity . A promising av enue for future work is to deepen the causal analysis of these interactions. While our current study iden- tifies strong correlations, e xplicitly controlling the adoption rate of the LLM ev aluator (systematically varying ho w much the agent relies on the prediction set) would allow for a rigorous isolation of the causal effects of set properties on substantiv e decision outcomes. Impact Statement In this work we study the interactions between uncertainty quantification methods and fairness, pointing out a gap in the w ay f airness has been quantified in pre vious studies. The impact of our work is to raise awareness on issues of equity in machine learning, and as such we do not expect negati ve societal impacts to arise. References Akiba, T ., Sano, S., Y anase, T ., Ohta, T ., and Koyama, M. Optuna: A next-generation hyperparameter optimization framew ork. In Pr oceedings of the 25th ACM SIGKDD international confer ence on knowledge discovery & data mining , pp. 2623–2631, 2019. 27 Angelopoulos, A. N. and Bates, S. A gentle introduction to conformal prediction and distribution-free uncertainty quantification. , 2021. 1 Angelopoulos, A. N., Bates, S., Jordan, M., and Malik, J. Uncertainty sets for image classifiers using conformal prediction. In International Conference on Learning Repr esentations , 2021. 2 , 26 Baevs ki, A., Zhou, Y ., Mohamed, A., and Auli, M. wa v2vec 2.0: A Framework for Self-Supervised Learning of Speech Representations. In Advances in Neural Informa- tion Pr ocessing Systems , volume 33, pp. 12449–12460, 2020. 6 , 25 Bai, S., Chen, K., Liu, X., W ang, J., Ge, W ., Song, S., Dang, K., W ang, P ., W ang, S., T ang, J., Zhong, H., Zhu, Y ., Y ang, M., Li, Z., W an, J., W ang, P ., Ding, W ., Fu, Z., Xu, Y ., Y e, J., Zhang, X., Xie, T ., Cheng, Z., Zhang, H., Y ang, Z., Xu, H., and Lin, J. Qwen2.5-VL T echnical Report. arXiv:2502.13923 , 2025. 5 Barocas, S., Hardt, M., and Narayanan, A. F airness and machine learning: Limitations and opportunities . MIT press, 2023. 1 Berk, R. A., Kuchibhotla, A. K., and Tchetgen, E. T . Im- proving fairness in criminal justice algorithmic risk as- sessments using optimal transport and conformal predic- tion sets. Sociolo gical Methods & Resear ch , 2023. doi: 10.1177/00491241231155883. 3 Buolamwini, J. and Gebru, T . Gender Shades: Intersectional Accuracy Disparities in Commercial Gender Classifica- tion. In Pr oceedings of the 1st Conference on F airness, Accountability and T ranspar ency , volume 81, pp. 77–91, 2018. 25 Chen, T . and Guestrin, C. XGBoost: A Scalable T ree Boost- ing System. In Pr oceedings of the 22nd ACM SIGKDD International Confer ence on Knowledge Discovery and Data Mining , pp. 785–794, 2016. ISBN 9781450342322. doi: 10.1145/2939672.2939785. 6 , 25 Cresswell, J. C. T rustworthy AI Must Account for Interac- tions. , 2025. 1 Cresswell, J. C., Sui, Y ., K umar , B., and V ouitsis, N. Con- formal prediction sets impro ve human decision making. In Pr oceedings of the 41st International Conference on Machine Learning , 2024. 2 Cresswell, J. C., Kumar , B., Sui, Y ., and Belbahri, M. Con- formal prediction sets can cause disparate impact. In The Thirteenth International Confer ence on Learning Repr e- sentations , 2025. 2 , 3 , 4 , 6 , 7 , 22 , 31 De-Arteaga, M., Romanov , A., W allach, H., Chayes, J., Borgs, C., Chouldecho v a, A., Geyik, S., K enthapadi, K., and Kalai, A. T . Bias in Bios: A Case Study of Semantic Representation Bias in a High-Stakes Setting. In Pr oceed- ings of the Confer ence on F airness, Accountability , and T ranspar ency , pp. 120–128, 2019. ISBN 9781450361255. doi: 10.1145/3287560.3287572. 6 , 25 Devli n, J., Chang, M.-W ., Lee, K., and T outanov a, K. BER T : Pre-training of Deep Bidirectional T ransformers for Lan- guage Understanding. In Pr oceedings of the 2019 Confer - ence of the North American Chapter of the Association for Computational Linguistics: Human Language T echnolo- gies, V olume 1 (Long and Short P apers) , pp. 4171–4186, 2019. doi: 10.18653/v1/N19- 1423. 6 , 25 Ding, F ., Hardt, M., Miller, J., and Schmidt, L. Retiring Adult: New Datasets for Fair Machine Learning. In Advances in Neural Information Pr ocessing Systems , vol- ume 34, pp. 6478–6490, 2021. 6 , 25 Ding, T ., Angelopoulos, A., Bates, S., Jordan, M., and T ibshirani, R. J. Class-conditional conformal prediction with many classes. In Advances in Neural Information Pr ocessing Systems , volume 36, pp. 64555–64576, 2023. 3 , 18 , 19 , 27 Dosovitskiy , A., Beyer , L., Kolesnik ov , A., W eissenborn, D., Zhai, X., Unterthiner , T ., Dehghani, M., Minderer , M., Heigold, G., Gelly , S., Uszk oreit, J., and Houlsby , 9 Beyond Pr ocedure: Substantive F airness in Conformal Pr ediction N. An Image is W orth 16x16 W ords: T ransformers for Image Recognition at Scale. In International Conference on Learning Repr esentations , 2021. 5 Drukker , K., Chen, W ., Gichoya, J., Gruszauskas, N., Kalpathy-Cramer , J., Ko yejo, S., Myers, K., S ´ a, R. C., Sahiner , B., Whitney , H., et al. T o ward fairness in artifi- cial intelligence for medical image analysis: identification and mitigation of potential biases in the roadmap from data collection to model deployment. Journal of Medical Imaging , 10(6):061104–061104, 2023. 25 Fadel, W . Fine-tuned XLSR-53 large model for speech emotion recognition on ravdess dataset, 2023. URL ht t ps : / /h u gg i ng f ac e .c o /W i a m/ w av 2 ve c 2- l a r g e - x l s r- 5 3- e n g l i s h- f i n et u n e d - r a v d e s s - v 5 . Accessed 2025-10-01. 25 Foygel Barber , R., Candes, E. J., Ramdas, A., and Tibshirani, R. J. The limits of distrib ution-free conditional predicti ve inference. Information and Inference: A Journal of the IMA , 10(2):455–482, 2021. 3 , 16 Gal, Y . and Ghahramani, Z. Dropout as a Bayesian Ap- proximation: Representing Model Uncertainty in Deep Learning. In Pr oceedings of The 33rd International Con- fer ence on Mac hine Learning , volume 48, pp. 1050–1059, 2016. 1 Garcia-Galindo, A., Lopez-De-Castro, M., and Armananzas, R. Fair prediction sets through multi-objective hyper- parameter optimization. Machine Learning , 114(1):27, 2025. 3 Gauthier , E., Bach, F ., and Jordan, M. I. Backward con- formal prediction. In Advances in Neural Information Pr ocessing Systems , volume 38, 2025. 3 , 19 Gibbs, I., Cherian, J. J., and Cand ` es, E. J. Conformal prediction with conditional guarantees. Journal of the Royal Statistical Society Series B: Statistical Method- ology , 87(4):1100–1126, 2025. ISSN 1369-7412. doi: 10.1093/jrsssb/qkaf008. 2 Grattafiori, A. et al. The Llama 3 Herd of Models. arXiv:2407.21783 , 2024. 32 Green, B. Escaping the impossibility of fairness: From formal to substantiv e algorithmic fairness. Philosophy & T echnology , 35(4):90, 2022. 2 Grosman, J. Fine-tuned XLSR-53 large model for speech recognition in English. https://huggingface.co/j on at a sg ro sm a n/ wa v2 v ec 2- l a rg e- x ls r- 5 3- en g lish , 2021. 25 Guldogan, O., Sarna, N., Li, Y ., and Berger , M. Counter- factually fair conformal prediction. , 2025. 3 Gustafson, L., Rolland, C., Ravi, N., Duval, Q., Adcock, A., Fu, C.-Y ., Hall, M., and Ross, C. F A CET : Fairness in computer vision e valuation benchmark. In Pr oceedings of the IEEE/CVF International Confer ence on Computer V ision , pp. 20370–20382, 2023. 5 , 25 Hardt, M., Price, E., and Srebro, N. Equality of Oppor - tunity in Supervised Learning. In Advances in Neural Information Pr ocessing Systems , volume 29, 2016. 1 , 2 Huang, J., Xi, H., Zhang, L., Y ao, H., Qiu, Y ., and W ei, H. Conformal prediction for deep classifier via label ranking. In Pr oceedings of the 41st International Conference on Machine Learning , v olume 235, pp. 20331–20347, 2024. 2 , 26 Kuchibhotla, A. K. and Berk, R. A. Nested conformal prediction sets for classification with applications to pro- bation data. The Annals of Applied Statistics , 17(1):761– 785, 2023. 3 Kusner , M. J., Loftus, J., Russell, C., and Silva, R. Coun- terfactual fairness. In Advances in Neural Information Pr ocessing Systems , volume 30, 2017. 1 , 3 Lakshminarayanan, B., Pritzel, A., and Blundell, C. Simple and scalable predictiv e uncertainty estimation using deep ensembles. In Advances in Neur al Information Pr ocess- ing Systems , volume 30, 2017. 1 Lei, J., Robins, J., and W asserman, L. Distribution-free prediction sets. J ournal of the American Statistical Asso- ciation , 108(501):278–287, 2013. doi: 10.1080/016214 59.2012.751873. 3 Liang, K.-Y . and Zeger , S. L. Longitudinal data analysis using generalized linear models. Biometrika , 73(1):13– 22, 1986. 5 Liu, M., Ding, L., Y u, D., Liu, W ., K ong, L., and Jiang, B. Conformalized fairness via quantile regression. In Advances in Neural Information Pr ocessing Systems , vol- ume 35, 2022. 3 Livingstone, S. R. and Russo, F . A. The Ryerson Audio-V isual Database of Emotional Speech and Song (RA VDESS), April 2018. URL https://doi.org/10 .5281/zenodo.1188976 . 6 , 25 Lu, C., Lemay , A., Chang, K., H ¨ obel, K., and Kalpathy- Cramer , J. Fair conformal predictors for applications in medical imaging. In Pr oceedings of the AAAI Confer ence on Artificial Intelligence , volume 36, pp. 12008–12016, 2022. 3 Neal, R. M. Bayesian learning for neural networks , v olume 118. Springer Science & Business Media, 2012. 1 10 Beyond Pr ocedure: Substantive F airness in Conformal Pr ediction Office of the Comptroller of the Currency. Fair lending, 2026. URL https ://ww w.occ .treas .gov/ topic s /con sumer s- a nd- commu nitie s/con sumer- pr ote ction /fair- lend ing/ind ex- fair- lendin g.htm l . Accessed: 2026-01-25. 2 OpenAI. GPT -4o mini: advancing cost-efficient intelligence, 2024. URL h t t p s : / / o p e n a i . c o m /i n d e x / g p t - 4 o- mi ni- adva ncing- cost- ef ficient- intellige nce/ . Accessed: 2026-01-26. 6 OpenAI. Gpt-4o audio model, 2026. URL https://plat fo r m. o pe n ai . co m /d o cs / mo d el s/ g pt- 4o- a u di o - preview . Accessed: 2026-01-26. 6 Radford, A., Kim, J. W ., Hallacy , C., Ramesh, A., Goh, G., Agarwal, S., Sastry , G., Askell, A., Mishkin, P ., Clark, J., Krueger , G., and Sutske ver , I. Learning T ransferable V isual Models From Natural Language Supervision. In Pr oceedings of the 38th International Conference on Ma- chine Learning , volume 139, pp. 8748–8763, 2021. 5 , 25 Romano, Y ., Barber , R. F ., Sabatti, C., and Cand ` es, E. W ith Malice T oward None: Assessing Uncertainty via Equalized Cov erage. Harvar d Data Science Re view , 2(2), 2020a. 1 , 2 , 3 , 7 Romano, Y ., Sesia, M., and Candes, E. Classification with v alid and adapti ve co verage. In Advances in Neur al Infor - mation Pr ocessing Systems , volume 33, pp. 3581–3591, 2020b. 2 Shafer , G. and V ovk, V . A tutorial on conformal prediction. Journal of Mac hine Learning Researc h , 9(3), 2008. 1 Sriniv asan, A., V adlamani, A. T ., Meghrazi, A., and Parthasarathy , S. FedCF: Fair Federated Conformal Pre- diction. , 2025. 3 T asar , D. E. The cov erage-deferral trade-off: Fairness im- plications of conformal prediction in human-in-the-loop decision systems. Pr eprints , 2025. doi: 10.20944/prepr ints202512.2631.v1. 3 V adlamani, A. T ., Sriniv asan, A., Maneriker , P ., Payani, A., and Parthasarath y , S. A generic framew ork for conformal fairness. In The Thirteenth International Confer ence on Learning Repr esentations , 2025. 3 V ovk, V . Conditional validity of inducti ve conformal predic- tors. In Pr oceedings of the Asian Confer ence on Machine Learning , volume 25, pp. 475–490, 2012. 3 , 16 V ovk, V . Conformal e-prediction. P attern Recognition , 166: 111674, 2025. ISSN 0031-3203. doi: 10.1016/j.pa tcog.2 025.111674. 3 V ovk, V ., Gammerman, A., and Saunders, C. Machine- learning applications of algorithmic randomness. In Pr o- ceedings of the Sixteenth International Confer ence on Machine Learning , pp. 444–453, 1999. 2 V ovk, V ., Lindsay , D., Nouretdinov , I., and Gammerman, A. Mondrian confidence machine. T echnical Report , 2003. 2 V ovk, V ., Gammerman, A., and Shafer , G. Algorithmic Learning in a Random W orld . Springer Ne w Y ork, 2005. doi: 10.1007/b106715. 1 , 2 , 16 W ang, F ., Cheng, L., Guo, R., Liu, K., and Y u, P . S. Equal opportunity of cov erage in fair regression. Advances in Neural Information Pr ocessing Systems , 36, 2024. 3 Y ang, A., Y ang, B., Zhang, B., Hui, B., Zheng, B., Y u, B., Li, C., Liu, D., Huang, F ., W ei, H., Lin, H., Y ang, J., T u, J., Zhang, J., Y ang, J., Y ang, J., Zhou, J., Lin, J., Dang, K., Lu, K., Bao, K., Y ang, K., Y u, L., Li, M., Xue, M., Zhang, P ., Zhu, Q., Men, R., Lin, R., Li, T ., T ang, T ., Xia, T ., Ren, X., Ren, X., Fan, Y ., Su, Y ., Zhang, Y ., W an, Y ., Liu, Y ., Cui, Z., Zhang, Z., and Qiu, Z. Qwen2.5 T echnical Report. , 2024a. 6 Y ang, J., Jiang, J., Sun, Z., and Chen, J. A large-scale empiri- cal study on improving the fairness of image classification models. In Pr oceedings of the 33rd A CM SIGSOFT In- ternational Symposium on Software T esting and Analysis , pp. 210–222, 2024b. 25 Zemel, R., W u, Y ., Swersky , K., Pitassi, T ., and Dwork, C. Learning fair representations. In Pr oceedings of the 30th International Confer ence on Machine Learning , vol- ume 28, pp. 325–333, 2013. 1 Zerva, C. and Martins, A. F . T . Conformalizing machine translation e valuation. T ransactions of the Association for Computational Linguistics , 12:1460–1478, 2024. doi: 10.1162/tacl a 00711. 3 Zhou, Y . and Sesia, M. Conformal classification with equal- ized cov erage for adaptively selected groups. In Advances in Neural Information Pr ocessing Systems , volume 37, 2024. doi: 10.52202/079017- 3454. 3 Zwart, P . H. Probabilistic conformal coverage guarantees in small-data settings. , 2025. 2 11 Beyond Pr ocedure: Substantive F airness in Conformal Pr ediction A ppendix T able of Contents A Justification that Label-Cluster ed CP Reduces Set Size Disparity 12 B Conformal Pr ediction Algorithms 19 B.1 Clustered Conformal Prediction . . . . . . . . . . . . . . . . . . . . . . . . . . . . . . . . . . . . . . . 19 B.2 Backward Conformal Prediction . . . . . . . . . . . . . . . . . . . . . . . . . . . . . . . . . . . . . . . 19 B.3 Pseudocode Implementations . . . . . . . . . . . . . . . . . . . . . . . . . . . . . . . . . . . . . . . . 19 C T echnical Details of the LLM-in-the-loop Evaluator 22 C.1 Constructing GEE to Predict Downstream Prediction Accuracy . . . . . . . . . . . . . . . . . . . . . . 22 C.2 Measuring Substantive F airness from the LLM-in-the-loop Evaluator . . . . . . . . . . . . . . . . . . . 23 D Additional Experiment Details 25 D.1 Dataset Details . . . . . . . . . . . . . . . . . . . . . . . . . . . . . . . . . . . . . . . . . . . . . . . . 25 D.2 Score Functions Used for Conformal Prediction . . . . . . . . . . . . . . . . . . . . . . . . . . . . . . 26 D.3 Hyperparameters . . . . . . . . . . . . . . . . . . . . . . . . . . . . . . . . . . . . . . . . . . . . . . . 27 D.4 Prompts Used for LLM-in-the-loop Ev aluator . . . . . . . . . . . . . . . . . . . . . . . . . . . . . . . . 28 E Details and Results from the LLM-in-the-loop Ev aluator 31 E.1 Comparing Human-in-the-loop and LLM-in-the-loop Ev aluators . . . . . . . . . . . . . . . . . . . . . . 31 E.2 LLM-in-the-loop Ev aluator Results on Different T asks . . . . . . . . . . . . . . . . . . . . . . . . . . . 32 E.3 Bootstrap Results . . . . . . . . . . . . . . . . . . . . . . . . . . . . . . . . . . . . . . . . . . . . . . 33 F Additional T ables and Plots 35 F .1 CP and LLM-in-the-loop Metrics by Group . . . . . . . . . . . . . . . . . . . . . . . . . . . . . . . . . 35 F .2 Additional Co verage Gap and Set Size Gap Plots . . . . . . . . . . . . . . . . . . . . . . . . . . . . . . 40 A. Justification that Label-Cluster ed CP Reduces Set Size Disparity In this appendix, we provide justification on ho w Label-Clustered CP reduces set size gap between protected gr oups , ev en though it does calibration based on clusters of labels . Let A be the random v ariable of the protected groups, that is, the possible values of A are all protected groups. Consider any two protected groups, say group a and group b , we want to show that the gap between E [ |C ( X ) | | A = a ] and E [ |C ( X ) | | A = b ] can be reduced by implementing Label-Clustered CP , improving f airness between group a and group b in terms of prediction set size, especially compared to Mondrian CP . In what follo ws, C ( X ) denotes the prediction set constructed from Label-Clustered CP , and |C ( X ) | is the cardinality of the prediction set C ( X ) . Proof of Theor em 4.1 : According to the law of total expectation, we ha ve E [ |C ( X ) | | A = a ] = X y ∈Y P ( Y = y | A = a ) E [ |C ( X ) | | Y = y , A = a ] E [ |C ( X ) | | A = b ] = X y ∈Y P ( Y = y | A = b ) E [ |C ( X ) | | Y = y , A = b ] 12 Beyond Pr ocedure: Substantive F airness in Conformal Pr ediction Let ∆ a,b = | E [ |C ( X ) | | A = a ] − E [ |C ( X ) | | A = b ] | be the disparity in expected set size, so we ha ve ∆ a,b = X y ∈Y P ( Y = y | A = a ) E [ |C ( X ) | | Y = y , A = a ] − X y ∈Y P ( Y = y | A = b ) E [ |C ( X ) | | Y = y , A = b ] + X y ∈Y P ( Y = y | A = a ) E [ |C ( X ) | | Y = y , A = b ] − X y ∈Y P ( Y = y | A = a ) E [ |C ( X ) | | Y = y , A = b ] = X y ∈Y [ P ( Y = y | A = a ) − P ( Y = y | A = b )] E [ |C ( X ) | | Y = y , A = b ] | {z } (I) (A1) + X y ∈Y P ( Y = y | A = a ) { E [ |C ( X ) | | Y = y , A = a ] − E [ |C ( X ) | | Y = y , A = b ] } | {z } (II) (A2) W e analyze term (I) in Equation ( A1 ) and term (II) in Equation ( A2 ) indi vidually to in vestigate ho w Label-Clustered CP controls the gap of expected set size between group a and group b . Recall the clustering function h : Y → { 1 , . . . , K } that maps each class y ∈ Y to one of the K clusters based on score distrib utions of the labels. Throughout the arguments in this appendix, we treat h as fixed by conditioning on the portion of data (clustering data set) used to learn it. Let Y k := { y ∈ Y : h ( y ) = k } be the set of labels in the k -th cluster for each k = 1 , . . . , K . Then, ( I ) = X y ∈Y [ P ( Y = y | A = a ) − P ( Y = y | A = b )] E [ |C ( X ) | | Y = y , A = b ] = K X k =1 X y ∈Y k [ P ( Y = y | A = a ) − P ( Y = y | A = b )] E [ |C ( X ) | | Y = y , A = b ] = K X k =1 X y ∈Y k [ P ( Y = y , h ( Y ) = h ( y ) | A = a ) − P ( Y = y , h ( Y ) = h ( y ) | A = b )] · E [ |C ( X ) | | Y = y , A = b ] ( because Y = y ⇒ h ( Y ) = h ( y )) = K X k =1 X y ∈Y k [ P ( Y = y , h ( Y ) = k | A = a ) − P ( Y = y, h ( Y ) = k | A = b )] · E [ |C ( X ) | | Y = y , A = b ] = K X k =1 P ( h ( Y ) = k | A = a ) X y ∈Y k P ( Y = y | h ( Y ) = k , A = a ) E [ |C ( X ) | | Y = y , A = b ] − K X k =1 P ( h ( Y ) = k | A = b ) X y ∈Y k P ( Y = y | h ( Y ) = k , A = b ) E [ |C ( X ) | | Y = y , A = b ] Now , define ( I ) 1 := K X k =1 P ( h ( Y ) = k | A = a ) X y ∈Y k P ( Y = y | h ( Y ) = k , A = a ) E [ |C ( X ) | | Y = y , A = b ] − K X k =1 P ( h ( Y ) = k | A = a ) X y ∈Y k P ( Y = y | h ( Y ) = k , A = b ) E [ |C ( X ) | | Y = y , A = b ] and ( I ) 2 := K X k =1 P ( h ( Y ) = k | A = a ) X y ∈Y k P ( Y = y | h ( Y ) = k , A = b ) E [ |C ( X ) | | Y = y , A = b ] − K X k =1 P ( h ( Y ) = k | A = b ) X y ∈Y k P ( Y = y | h ( Y ) = k , A = b ) E [ |C ( X ) | | Y = y , A = b ] 13 Beyond Pr ocedure: Substantive F airness in Conformal Pr ediction Then, we hav e ( I ) = ( I ) 1 + ( I ) 2 . W e analyze ( I ) 1 and ( I ) 2 separately as follows. 1. Bound | ( I ) 1 | : W e can rewrite ( I ) 1 as ( I ) 1 = K X k =1 P ( h ( Y ) = k | A = a ) X y ∈Y k P ( Y = y | h ( Y ) = k , A = a ) − P ( Y = y | h ( Y ) = k , A = b ) E [ |C ( X ) | | Y = y , A = b ] (A3) First, fix a cluster k . Since P y ∈Y k P ( Y = y | h ( Y ) = k , A = a ) − P ( Y = y | h ( Y ) = k , A = b ) = 0 , for any constant c , we hav e X y ∈Y k P ( Y = y | h ( Y ) = k , A = a ) − P ( Y = y | h ( Y ) = k , A = b ) E [ |C ( X ) | | Y = y , A = b ] = X y ∈Y k P ( Y = y | h ( Y ) = k , A = a ) − P ( Y = y | h ( Y ) = k , A = b ) ( E [ |C ( X ) | | Y = y , A = b ] − c ) Applying this logic, if we define c k := 1 2 (max y ∈Y k E [ | C ( X ) | | Y = y, A = b ] + min y ∈Y k E [ | C ( X ) | | Y = y, A = b ]) , then we hav e X y ∈Y k P ( Y = y | h ( Y ) = k , A = a ) − P ( Y = y | h ( Y ) = k , A = b ) E [ |C ( X ) | | Y = y , A = b ] = X y ∈Y k P ( Y = y | h ( Y ) = k , A = a ) − P ( Y = y | h ( Y ) = k , A = b ) ( E [ |C ( X ) | | Y = y , A = b ] − c k ) ≤ ∥ p k,a − p k,b ∥ 1 · max y ∈Y k | E [ |C ( X ) | | Y = y , A = b ] − c k | by H ¨ older’ s inequality = ∥ p k,a − p k,b ∥ 1 · 1 2 max y ∈Y k E [ | C ( X ) | | Y = y, A = b ] − min y ∈Y k E [ | C ( X ) | | Y = y, A = b ] ≤ 1 2 ( ∥ p k,a ∥ 1 + ∥ p k,b ∥ 1 ) max y ∈Y k E [ | C ( X ) | | Y = y, A = b ] − min y ∈Y k E [ | C ( X ) | | Y = y, A = b ] by triangle inequality = 1 2 · 2 max y ∈Y k E [ | C ( X ) | | Y = y, A = b ] − min y ∈Y k E [ | C ( X ) | | Y = y, A = b ] = max y ∈Y k E [ | C ( X ) | | Y = y, A = b ] − min y ∈Y k E [ | C ( X ) | | Y = y, A = b ] , (A4) where p k,a is the probability vector with each component being P ( Y = y | h ( Y ) = k , A = a ) for y ∈ Y k ; similarly , p k,b is the probability vector with each component being P ( Y = y | h ( Y ) = k , A = b ) for y ∈ Y k , so p k,a and p k,b are vectors of probabilities that depend on data distribution. For simplicity , for ev ery k ∈ { 1 , . . . , K } , define ϵ k,b := max y ∈Y k E [ | C ( X ) | | Y = y, A = b ] − min y ∈Y k E [ | C ( X ) | | Y = y, A = b ] . 14 Beyond Pr ocedure: Substantive F airness in Conformal Pr ediction That is, ϵ k,b is the spread of expected set size o ver the labels in cluster k , conditioning on group b . Then, we have | ( I ) 1 | ≤ K X k =1 P ( h ( Y ) = k | A = a ) X y ∈Y k P ( Y = y | h ( Y ) = k , A = a ) − P ( Y = y | h ( Y ) = k , A = b ) E [ |C ( X ) | | Y = y , A = b ] ≤ K X k =1 P ( h ( Y ) = k | A = a ) max y ∈Y k E [ | C ( X ) | | Y = y, A = b ] − min y ∈Y k E [ | C ( X ) | | Y = y, A = b ] by E q uation ( A4 ) = K X k =1 ϵ k,b P ( h ( Y ) = k | A = a ) ≤ max k =1 ,...,K ϵ k,b · K X k =1 P ( h ( Y ) = k | A = a ) = max k =1 ,...,K ϵ k,b The abov e deriv ation shows that | ( I ) 1 | is upper bounded by the maximum intra-cluster expected set size dif ference across labels. When K = 1 , the Label-Clustered CP reduces to a special case, Marginal CP . In this case, all labels fall into one cluster , and the upper bound for | ( I ) 1 | becomes ϵ 1 ,b . Because Marginal CP does not learn the cluster assignments according to score distributions of labels, instead forcing all labels into a single cluster , the ϵ 1 ,b term can be large due to label heterogeneity . In contrast, when K = |Y | , each label forms a cluster, and ϵ k,b = 0 for all k = 1 , . . . , K , yielding ( I ) 1 = 0 . Label-Clustered CP clusters labels using similarity of score distribution, which can be viewed as a proxy for label difficulty . Therefore, with a proper choice of K and the associated cluster assignment, the labels in each cluster have similar score distributions and dif ficulty lev els, yielding small ϵ k,b for each k , which giv es a tight upper bound for | ( I ) 1 | . Therefore, Label-Clustered CP can effecti vely control | ( I ) 1 | by limiting label heterogeneity within each cluster . 2. Bound | ( I ) 2 | : After combining the common terms, we get ( I ) 2 = K X k =1 P ( h ( Y ) = k | A = a ) − P ( h ( Y ) = k | A = b ) X y ∈Y k P ( Y = y | h ( Y ) = k , A = b ) E [ |C ( X ) | | Y = y , A = b ] (A5) W e can simplify the P y ∈Y k P ( Y = y | h ( Y ) = k , A = b ) E [ |C ( X ) | | Y = y , A = b ] in Equation ( A5 ) as follo ws. X y ∈Y k P ( Y = y | h ( Y ) = k, A = b ) E [ |C ( X ) | | Y = y , A = b ] = X y ∈Y k P ( Y = y | h ( Y ) = k, A = b ) E [ |C ( X ) | | Y = y , h ( Y ) = k, A = b ] ( because Y = y ⇒ h ( Y ) = h ( y ) = k for y ∈ Y k ) = X y ∈Y P ( Y = y | h ( Y ) = k, A = b ) E [ |C ( X ) | | Y = y , h ( Y ) = k, A = b ] ( because P ( Y = y | h ( Y ) = k, A = b ) = 0 for an y y not in Y k ) = E [ |C ( X ) | | h ( Y ) = k, A = b ] (by the la w of total expectation) Then, plug in Equation ( A5 ), we hav e ( I ) 2 = K X k =1 P ( h ( Y ) = k | A = a ) − P ( h ( Y ) = k | A = b ) E [ |C ( X ) | | h ( Y ) = k , A = b ] = K X k =1 P ( h ( Y ) = k | A = a ) − P ( h ( Y ) = k | A = b ) E [ |C ( X ) | | h ( Y ) = k , A = b ] − c for any constant c 15 Beyond Pr ocedure: Substantive F airness in Conformal Pr ediction The last equality holds because K X k =1 c P ( h ( Y ) = k | A = a ) − P ( h ( Y ) = k | A = b ) = c K X k =1 P ( h ( Y ) = k | A = a ) − K X k =1 P ( h ( Y ) = k | A = b ) = c · (1 − 1) = 0 Define p a := [ P ( h ( Y ) = 1 | A = a ) , . . . , P ( h ( Y ) = K | A = a )] T p b := [ P ( h ( Y ) = 1 | A = b ) , . . . , P ( h ( Y ) = K | A = b )] T Then, we can bound | ( I ) 2 | as follo ws: | ( I ) 2 | = K X k =1 P ( h ( Y ) = k | A = a ) − P ( h ( Y ) = k | A = b ) E [ |C ( X ) | | h ( Y ) = k , A = b ] − c ≤ ∥ p a − p b ∥ 1 max k =1 ,...,K E [ |C ( X ) | | h ( Y ) = k , A = b ] − c by H ¨ older’ s inequality = 1 2 ∥ p a − p b ∥ 1 max k =1 ,...,K E [ |C ( X ) | | h ( Y ) = k , A = b ] − min k =1 ,...,K E [ |C ( X ) | | h ( Y ) = k , A = b ] , (A6) where the last equality holds when we choose c = 1 2 max k =1 ,...,K E [ |C ( X ) | | h ( Y ) = k , A = b ] + min k =1 ,...,K E [ |C ( X ) | | h ( Y ) = k , A = b ] . From Equation ( A6 ), we observe that the magnitude of | ( I ) 2 | depends on the product of: (1) the difference of cluster- membership distribution between the protected groups a and b , and (2) the spread of E [ |C ( X ) | | h ( Y ) = k , A = b ] ov er the clusters k = 1 , . . . , K . The factor (1), which sho ws up as ∥ p a − p b ∥ 1 in Equation ( A6 ), is induced by the correlation between Y and A (e.g., for the BiosBias data, there is correlation between occupation (label) and gender (protected group)). Since factor (1) is data-driv en, and there is intrinsic correlation between Y and A in real-world data, we cannot control it directly by applying the Label-Clustered CP . Moreo ver , according to the triangle inequality , we always have ∥ p a − p b ∥ 1 ≤ 2 . On the other hand, the factor (2), max k =1 ,...,K E [ |C ( X ) | | h ( Y ) = k , A = b ] − min k =1 ,...,K E [ |C ( X ) | | h ( Y ) = k , A = b ] in Equation ( A6 ), is method-dri ven, and we can control it by choosing a proper number of clusters K . W e provide two intuitiv e examples to illustrate how choice of K can affect factor (2): the first one is when K = 1 in which case the Label-Clustered CP reduces to Marginal CP . In this case, we have factor (2) = 0, so the bound Equation ( A6 ) becomes 0; the second example is another extreme case when K = |Y | , that is, the number of clusters is exactly the number of possible labels, with each label forming its o wn cluster . In this case, for underrepresented labels with limited calibration data, we hav e large prediction sets for these labels, which increases set size gap among labels, resulting in a large difference in factor (2). In general, we do not want a lar ge K . As indicated above, a lar ge K tends to increase the spread of set size across clusters. On the other hand, although the choice of K = 1 makes the upper bound in Equation ( A6 ) vanish to 0, it boils down to Marginal CP , which, as discussed in bounding | ( I ) 1 | , leads to large intra-cluster expected set size gap across labels. Moreov er , as discussed in pre vious literature, Marginal CP can have significant disparity in terms of co verage across protected groups or labels ( V ovk et al. , 2005 ; V ovk , 2012 ; Foygel Barber et al. , 2021 ). In practice, we need to choose a proper K when implementing the Label-Clustered CP to balance intra-cluster label homogeneity (for controlling | ( I ) 1 | ) and cross-cluster stability (for controlling | ( I ) 2 | ). W ith a suitable value of K and its associated cluster assignments, we can bring both | ( I ) 1 | and | ( I ) 2 | to reasonably small v alues, achieving a tight bound for | ( I ) | . 3. How Label-Clustered CP helps to contr ol | ( I I ) | : Finally , we show ho w Label-Clustered CP can reduce | ( I I ) | in Equation ( A2 ) compared to group-conditional CP . The term (II) is a weighted sum ov er y ∈ Y of the intra-label set size gap between group a and group b . The differences in e xpected set size across protected groups after conditioning on the true label depend on how conformal thresholds are calibrated. The Mondrian CP estimates separate thresholds for each protected group, which can inflate | ( I I ) | for two reasons: (i) different thresholds impose dif ferent strictness lev els across groups e ven within the same label, and (ii) in the case of imbalanced 16 Beyond Pr ocedure: Substantive F airness in Conformal Pr ediction calibration data across groups (e.g., group a has much more calibration data than group b which has limited calibration data), splitting calibration dataset according to groups significantly reduces calibration set size of underrepresented groups, increasing quantile estimation v ariance and amplifying differences in the resulting set sizes among groups. In contrast, Label-Clustered CP mitigates the aforementioned inflation by using shared cluster thresholds (with each cluster threshold being the same across protected groups) estimated from pooled calibration data. This pooling stabilizes the calibration step and remov es policy dif ferences across groups induced by calibration, so the intra-label set size gap between groups is less amplified by threshold noise, typically resulting in a smaller | ( I I ) | than group-conditional CP . Belo w , we provide a mathematical proof to justify why Label-Clustered CP av oids inflating | ( I I ) | compared to Mondrian CP . In what follo ws, a prediction set from the Label-Clustered CP is still denoted as C ( X ) . For a learned clustering function h : Y → { 1 , . . . , K } , let ˆ q k be the conformal quantile for each cluster k , k = 1 , . . . , K . On the other hand, denote a prediction set constructed from Mondrian CP as C group ( X ) ; let ˆ q group a and ˆ q group b be the conformal quantiles used in Mondrian CP for protected groups a and b , respecti vely . Recall that the rule for constructing C ( x ) is C ( x ) = { y ∈ Y : s ( x, y ) ≤ ˆ q h ( y ) } and the rule for constructing C group ( x ) is C group ( x ) = { y ∈ Y : s ( x, y ) ≤ ˆ q group g ( x ) } , where g : X → A is the group assignment function. Now , for a fixed y ∈ Y , a protected group g ∈ A , and a threshold (quantile) q , define r y ,g ( q ) := E [ |C q ( X ) | | Y = y, A = g ] , (A7) where C q ( · ) denotes the conformal prediction set obtained when the relev ant rule uses threshold q while holding ev erything else fixed. Furthermore, assume a mild regularity condition that changing the quantile threshold slightly cannot change the expected set size arbitrarily much. Mathematically , this assumption imposes a Lipschitz continuity on the function r y ,g ( · ) , that is, there exists 0 ≤ L y ,g < ∞ such that for all q , q ′ , | r y ,g ( q ) − r y ,g ( q ′ ) | ≤ L y ,g | q − q ′ | . (A8) Under Mondrian CP , consider any reference threshold q ∗ , | ( I I ) group | ≤ X y ∈Y P ( Y = y | A = a ) | E [ |C group ( X ) | | Y = y, A = a ] − E [ |C group ( X ) | | Y = y, A = b ] | = X y ∈Y P ( Y = y | A = a ) r y ,a ( ˆ q group a ) − r y ,b ( ˆ q group b ) by definition in Equation ( A7 ) = X y ∈Y P ( Y = y | A = a ) ( r y ,a ( q ∗ ) − r y ,b ( q ∗ )) + ( r y ,a ( ˆ q group a ) − r y ,a ( q ∗ )) + ( r y ,b ( q ∗ ) − r y ,b ( ˆ q group b )) ≤ X y ∈Y P ( Y = y | A = a ) | r y ,a ( q ∗ ) − r y ,b ( q ∗ ) | + | r y ,a ( ˆ q group a ) − r y ,a ( q ∗ ) | + | r y ,b ( q ∗ ) − r y ,b ( ˆ q group b ) | ≤ X y ∈Y P ( Y = y | A = a ) | r y ,a ( q ∗ ) − r y ,b ( q ∗ ) | + L y ,a | ˆ q group a − q ∗ | + L y ,b | ˆ q group b − q ∗ | by Equation ( A8 ) = X y ∈Y P ( Y = y | A = a ) | r y ,a ( q ∗ ) − r y ,b ( q ∗ ) | | {z } ( I I ) 1 + X y ∈Y P ( Y = y | A = a ) L y ,a | ˆ q group a − q ∗ | + L y ,b | ˆ q group b − q ∗ | | {z } ( I I ) group 2 (A9) From the abo ve deriv ation, term ( I I ) 1 is data-dri ven, which comes from the difference in score distributions across protected groups conditional on Y = y . On the other hand, the term ( I I ) group 2 is induced by calibration of group-conditional CP which uses dif ferent group-specific thresholds ˆ q group a and ˆ q group b . Moreover , term ( I I ) group 2 can be further inflated in the case that the calibration set is imbalanced across groups. For e xample, if group b is underrepresented in the calibration set, then the 17 Beyond Pr ocedure: Substantive F airness in Conformal Pr ediction quantile estimator ˆ q group b will hav e high bias and variance. Such noisy quantile estimation can lead to erratic behavior of set predictor , including large sets ( Ding et al. , 2023 ). Under Label-Clustered CP , following the same logic of deri ving Equation ( A9 ), we hav e | ( I I ) cluster | ≤ X y ∈Y P ( Y = y | A = a ) | r y ,a ( ˆ q h ( y ) ) − r y ,b ( ˆ q h ( y ) ) | ≤ X y ∈Y P ( Y = y | A = a ) | r y ,a ( q ∗ ) − r y ,b ( q ∗ ) | + | r y ,a ( ˆ q h ( y ) ) − r y ,a ( q ∗ ) | + | r y ,b ( ˆ q h ( y ) ) − r y ,b ( q ∗ ) | ≤ X y ∈Y P ( Y = y | A = a ) | r y ,a ( q ∗ ) − r y ,b ( q ∗ ) | + L y ,a | ˆ q h ( y ) − q ∗ | + L y ,b | ˆ q h ( y ) − q ∗ | = X y ∈Y P ( Y = y | A = a ) | r y ,a ( q ∗ ) − r y ,b ( q ∗ ) | if we set each reference q ∗ = ˆ q h ( y ) (A10) Therefore, for Label-Clustered CP , the term ( I I ) group 2 induced by calibration disappears because the Label-Clustered CP uses the same threshold ˆ q h ( y ) regardless of group. In contrast, in Equation ( A9 ), ( I I ) group 2 cannot be eliminated due to different ˆ q group a and ˆ q group b . This comparison shows that compared with group-conditional CP , which can inflate | ( I I ) | through split-calibration and group-specific quantile estimation, Label-Clustered CP enforces shared thresholds across groups within each label-cluster, thereby eliminating the inflation induced by calibration and lea ving only the intrinsic intra-label cross-group disparity ev aluated at a common threshold. 18 Beyond Pr ocedure: Substantive F airness in Conformal Pr ediction B. Conf ormal Prediction Algorithms B.1. Clustered Conf ormal Prediction Clustered conformal prediction ( Ding et al. , 2023 ) splits the calibration set into a clustering portion D 1 (size ⌊ γ n cal ⌋ ) and a calibration portion D 2 . A clustering function h : Y → [ K ] ∪ { null } is learned on D 1 (typically by embedding labels via their empirical score quantiles and applying k -means). Independent quantiles ˆ q k are computed on D 2 restricted to each cluster k (with null using the full marginal D 2 ). The prediction set is C ( x test ) = { y ∈ Y : s ( x test , y ) ≤ ˆ q h ( y ) } . Clustering strategies can be designed to promote f airness by grouping labels according to protected attrib utes (to support underrepresented groups), empirically identified unfair subpopulations, human-defined rules, or data-dri ven quantile-based approaches. B.2. Backward Conformal Pr ediction Backward conformal prediction ( Gauthier et al. , 2025 ) constrains prediction-set size via a rule T : ( X × Y ) n × X → { 1 , . . . , |Y |} , mapping calibration data and a test input to a maximum allowable size l = T ( D cal , x test ) . It relies on e-values —nonnegati ve random v ariables E with E [ E ] ≤ 1 . For a positiv e score function s > 0 , the test e-value for label y is E test ( y ) = s ( x test , y ) 1 n +1 P n i =1 S i + s ( x test , y ) , where S i = s ( x i , y i ) . The data-dependent level ˜ α is chosen as the smallest value such that the number of labels with E test ( y ) < 1 / ˜ α does not exceed l : ˜ α = inf n α ∈ (0 , 1] : { y : E test ( y ) < 1 /α } ≤ l o . The prediction set is C ( x test ) = { y ∈ Y : E test ( y ) < 1 / ˜ α } . This satisfies |C ( x test ) | ≤ l and marginal cov erage P { y ∈ C ( x ) } ≥ 1 − E [ ˜ α ] . In practice, E [ ˜ α ] is estimated via leav e-one-out estimator ˆ α LOO = 1 n P n j =1 ˜ α j , where each ˜ α j is computed by treating the j -th calibration point as a test observation. B.3. Pseudocode Implementations Algorithm 1 Marginal (Split) Conformal Prediction Require: Calibration dataset D cal = { ( x i , y i ) } n cal i =1 , score function s , miscov erage lev el α Ensure: Prediction set C ˆ q α ( x ) 1: Compute calibration scores S i ← s ( x i , y i ) for all i ∈ [ n cal ] 2: Compute τ α ← ⌈ ( n cal + 1)(1 − α ) ⌉ /n cal 3: Compute threshold ˆ q α ← Quantile τ α ( S 1 , . . . , S n cal ) 4: Define prediction set C ˆ q α ( x ) = { y ∈ Y : s ( x, y ) ≤ ˆ q α } 19 Beyond Pr ocedure: Substantive F airness in Conformal Pr ediction Algorithm 2 Mondrian (Group-Conditional) Conformal Prediction Require: Calibration dataset D cal , grouping function g : X → A , score function s , le vel α Ensure: Group-conditional prediction set C ( x ) 1: for each group a ∈ A do 2: I a ← { i : g ( x i ) = a } 3: Compute scores S i ← s ( x i , y i ) for i ∈ I a 4: Compute ˆ q ( a ) α ← Quantile ⌈ ( |I a | +1)(1 − α ) ⌉ / |I a | ( { S i } i ∈I a ) 5: end for 6: Define prediction set C ( x ) = { y ∈ Y : s ( x, y ) ≤ ˆ q ( g ( x )) α } Algorithm 3 Label-Clustered Conformal Prediction Require: Calibration data D cal = { ( X i , Y i ) } n cal i =1 , score function s , miscov erage lev el α , split ratio γ Ensure: Prediction set C label − cluster ( x ) 1: Select index set I 1 ⊂ [ n cal ] with | I 1 | = ⌊ γ n cal ⌋ 2: Define clustering set D 1 = { ( X i , Y i ) : i ∈ I 1 } and calibration set D 2 = D cal \ D 1 3: Learn label clustering function h : Y → [ K ] ∪ { n ull } using D 1 4: for each cluster k ∈ [ K ] ∪ { null } do 5: Define index set I k ← { i ∈ D 2 : h ( Y i ) = k } 6: Compute scores S i ← s ( X i , Y i ) for i ∈ I k 7: Compute cluster quantile ˆ q k ← Quantile ⌈ ( |I k | +1)(1 − α ) ⌉ / |I k | ( { S i } i ∈I k ) 8: end for 9: Construct prediction set C label − cluster ( x ) = { y ∈ Y : s ( x, y ) ≤ ˆ q h ( y ) } 20 Beyond Pr ocedure: Substantive F airness in Conformal Pr ediction Algorithm 4 Group-Clustered Conformal Prediction Require: Calibration data D cal = { ( X i , Y i ) } n cal i =1 , score function s , miscov erage lev el α , split ratio γ Ensure: Prediction set C group − cluster ( x ) 1: Select index set I 1 ⊂ [ n cal ] with | I 1 | = ⌊ γ n cal ⌋ 2: Define clustering set D 1 = { ( X i , Y i ) : i ∈ I 1 } and calibration set D 2 = D cal \ D 1 3: Learn group clustering function ˜ h : A → [ K ] ∪ { null } using D 1 4: for each cluster k ∈ [ K ] ∪ { null } do 5: Define index set I k ← { i ∈ D 2 : ˜ h ( g ( X i )) = k } , where g : X → A is the group assignment function. 6: Compute scores S i ← s ( X i , Y i ) for i ∈ I k 7: Compute cluster quantile ˆ q k ← Quantile ⌈ ( |I k | +1)(1 − α ) ⌉ / |I k | ( { S i } i ∈I k ) 8: end for 9: Construct prediction set C group − cluster ( x ) = { y ∈ Y : s ( x, y ) ≤ ˆ q ˜ h ( g ( x )) } Algorithm 5 Backward Conformal Prediction Require: Calibration data { ( X i , Y i ) } n i =1 , score function s , size constraint rule T Ensure: Prediction set C ˜ α n ( x test ) 1: Compute calibration scores S i ← s ( X i , Y i ) for i = 1 , . . . , n 2: for each label y ∈ Y do 3: Compute test e-value E test ( y ) ← s ( x test , y ) 1 n +1 P n i =1 S i + s ( x test , y ) 4: end for 5: Define data-dependent lev el ˜ α ← inf n α ∈ (0 , 1) : # { y ∈ Y : E test ( y ) < 1 /α } ≤ T ( X i , Y i ) n i =1 , x test o 6: Construct prediction set C ˜ α n ( x test ) = { y ∈ Y : E test ( y ) < 1 / ˜ α } 21 Beyond Pr ocedure: Substantive F airness in Conformal Pr ediction C. T echnical Details of the LLM-in-the-loop Evaluator In this appendix, we provide details of constructing the logistic GEE model in Equation ( 15 ) and computing the substantive fairness metric maxR OR introduced in Section 4.2 . C.1. Constructing GEE to Predict Do wnstream Pr ediction Accuracy T o assess the effects of dif ferent prediction sets on human prediction accuracy and their disparity among protected groups, Cresswell et al. ( 2025 ) conducted randomized controlled trials with human decision makers, using generalized estimating equations (GEEs) to model accuracy against treatment (CP method), protected group, and task difficulty (approximated by marginal CP set size), then computing Odds Ratios (ORs) and Ratio of Odds Ratios (ROR) for treatment effects and disparities. In our ev aluator for assessing substantiv e fairness, we consider using LLMs as downstream task predictors. For each task, an LLM is provided with the input x , a prediction set, and its cov erage guarantee, outputting a label from all possible classes; in the control case, no set is provided. For each x j ∈ D test and prediction set C t ( x j ) from treatment t (Marginal, Mondrian, Label-Clustered, Group-Clustered, Backward; t = 1 , . . . , T including Control), the LLM makes M independent predictions (to accommodate randomness of LLM responses for the same input from setting a non-zero temperature) based on x j , C t ( x j ) and its coverage guarantee. The prompts used for describing the task and asking for LLM’ s prediction are provided in Appendix D . Let ˆ y m j t be the m -th prediction and R j t = 1 M P M m =1 1 { ˆ y m j t = y i } be the empirical prediction accuracy . For a treatment t , the disparity of improv ement in prediction accuracy (relati ve to Control) across protected groups can be estimated as ˆ ∆ t = max a,b ∈A 1 n a n a X j =1 R j t − 1 n a n a X j =1 R j, Control − 1 n b n b X j =1 R j t − 1 n b n b X j =1 R j, Control , (A11) where n a , n b are sizes of groups a and b , respectively . Howe ver , this estimation can be misleading due to (i) neglecting confounding factors, such as systematic variations in task difficulty and the LLM’ s reliance on provided sets, and (ii) intra-task correlation of predictions across treatments (predictions made for the same task are based on the same x and similar provided sets across treatments). W e thus use logistic GEE regression, adjusting for cov ariates and clustering by task to account for the intra-task correlation. In our LLM-in-the-loop setting, we observe that LLMs (especially the more capable ones) frequently constrain their answer to lie inside the provided prediction set. W e therefore define an “adoption” indicator, adoption = 1 { the LLM’ s predicted label is contained in the provided set } . Adoption captures the extent to which the prediction set is actually used as a decision aid, and it is strongly predictiv e of downstream correctness (see details in Appendix E.1 ). Consequently , we treat “adoption” as an outcome-relev ant cov ariate so that estimated treatment effects compare methods at comparable lev els of reliance on the prediction set, rather than conflating treatment effects with shifts in how often the LLM follows the set. As a result, the following cov ariates are included in the logistic GEE model: (i) treatment t , the method used to construct the prediction set; (ii) group j , the protected group to which x j belongs; (iii) diff j , the difficulty of task x j approximated by the cardinality of the Mar ginal CP set; (i v) adoption j,t := 1 M P M m =1 1 { ˆ y m j t ∈ C t ( x j ) } , the proportion of predictions that fall within the provided set C t ( x j ) under treatment t (with C Control ( x j ) = ∅ yielding adoption j, Control = 0 for each instance x j ). Then, we fit a logistic GEE across all tasks to model the probability of correct prediction as a function of treatment, protected group, task dif ficulty , and adoption, using task-le vel clustering to account for intra-task correlation across t reatments. As giv en in Section 4.2 , the GEE is expressed as logit ( E [ R j t ]) ∼ treatment t × group j + dif f j + adoption j,t , for j = 1 , . . . , N test and t = 1 , . . . , T . The logit ( x ) = log x 1 − x , and the treatment t × group j means the interaction between treatment t and group j . When fitting the above GEE in Python , we set cov struct = Exchangeable() , which assumes that all pairs of rows associated with the same task ha ve the same correlation in their residuals after the mean is modeled. This is plausible because we hav e T outcomes ( R j 1 , . . . , R j T ) without natural ordering for x j , and all these T prediction outcomes share the same latent task difficulty and information, making a common intra-task correlation a reasonable condition. Even if there is heteroskedasticity within clusters, adding .fit(cov type=‘robust’) guarantees the consistenc y of standard error estimation when N test is large enough, protecting us against misspecifying the intra-task correlation. 22 Beyond Pr ocedure: Substantive F airness in Conformal Pr ediction C.2. Measuring Substantive F airness from the LLM-in-the-loop Evaluator In what follows, we illustrate procedures on obtaining the maxR OR (Equation ( 17 )) for dif ferent treatments as a measurement of substantiv e fairness from our LLM-in-the-loop ev aluator . The maxR OR is obtained from the fitted GEE Equation ( 15 ), which provides model-based probabilities of correct prediction for each treatment and group. First, define the notation of the estimated coefficients from fitting ( 15 ): let • ˆ β 0 be the estimated intercept • ˆ β treatment t be the estimated coefficient for treatment t • ˆ β group a be the estimated coefficient for group a • ˆ β t : a be the estimated coefficient for the interaction of treatment t and group a , • ˆ β diff be the estimated coefficient for dif ficulty • ˆ β adopt be the estimated coefficient for adoption In model ( 15 ) , both treatment and group are cate gorical cov ariates, with control being the baseline category of treatment. Consider a non-control treatment t and a group a , we define the model-based marginal probability of a correct response for treatment t in group a as p t,a := 1 N t,a X j ∈I t,a logit − 1 ˆ β 0 + ˆ β treatment t + ˆ β group a + ˆ β t : a + ˆ β diff diff j + ˆ β adopt adoption j,t , (A12) where I t,a is the set of predictions in group a that are applied treatment t , and N t,a is the cardinality of the set I t,a . Thus, the p t,a defined in ( A12 ) is the model-based average probability that the LLM’ s prediction is correct, obtained by ev aluating the fitted GEE at treatment t and group a while plugging in each task’ s dif ficulty and adoption rate under treatment t , and then av eraging these predicted probabilities ov er all tasks in group a . Similarly , for the baseline treatment “control” and group a , we define p control ,a := 1 N Control ,a X j ∈I Control ,a logit − 1 ˆ β 0 + ˆ β treatment Control + ˆ β group a + ˆ β Control : a + ˆ β diff diff j + ˆ β adopt adoption j, Control = 1 N Control ,a X j ∈I Control ,a logit − 1 ˆ β 0 + ˆ β group a + ˆ β diff diff j , (A13) which is the model-based probability of a correct response under control in group a . Then, for non-control treatment t and e very protected group a , the OR of t versus control is gi ven by OR t,a := p t,a / (1 − p t,a ) p control ,a / (1 − p control ,a ) For each protected group, the ORs assess ho w much more likely an LLM under treatment t is to gi ve the correct response than if it were in the control. If OR t,a > 1 , then for group a the odds that the LLM produces a correct response under treatment t are higher than them under the control, and if OR t,a < 1 they are lo wer . The disparity of treatment ef f ect on prediction accurac y is quantified by the R OR. For treatment t , the R OR between group a and group b is computed as R OR t,a,b := OR t,a OR t,b − 1 If R OR t,a,b ≈ 0 , treatment t provides the same treatment ef fect o ver the Control for group a as it does for group b , indicating fairness of treatment effect from t on prediction accuracy between the two groups. As mentioned in Section 4.2 , to compare the parity of conformal methods’ impact on prediction accuracy , we compute and compare the maxROR maxR OR t := max a,b ∈A R OR t,a,b 23 Beyond Pr ocedure: Substantive F airness in Conformal Pr ediction for each non-control treatment t . For any two treatments t 1 and t 2 , if maxR OR t 1 > maxROR t 2 , then treatment t 1 induces a greater disparity in prediction accuracy across protected groups than treatment t 2 . In this case, compared to t 1 , treatment t 2 is preferred if the goal is to achiev e fairness in downstream prediction accurac y under the assistance of prediction sets. 24 Beyond Pr ocedure: Substantive F airness in Conformal Pr ediction D. Additional Experiment Details D.1. Dataset Details W e consider four prediction tasks with open-access fairness datasets where algorithmic assistance may benefit human decision making. Across all tasks, we construct prediction sets using conformal prediction methods applied to the outputs of task-specific base models. Image Classification. Image classification is widely used in high-stakes applications, including medical screening and surveillance, where biases may lead to serious societal consequences. Prior fairness research in visual domains has in vestigated facial recognition systems ( Buolamwini & Gebru , 2018 ), medical image analysis ( Drukk er et al. , 2023 ), and methods for improving fairness in image classification models ( Y ang et al. , 2024b ). T o model a similar scenario, we use the F A CET dataset ( Gustafson et al. , 2023 ), which consists of images of people labeled by occupation and grouped by age. W e retain the 20 most common occupation classes: [ Bac kpacker , Boatman, Computer User , Craftsman, F armer , Guar d, Guitarist, Gymnast, Hairdr esser , Horse Rider , Laborer , Officer , Motor cyclist, P ainter , Repairman, Salesperson, Singer , Skateboarder , Speaker , T ennis Player ], and split the data into calibration ( D cal ), calibration-validation ( D calval ), and test ( D test ) sets, stratified by class. Age annotations are pro vided in four predefined groups: Y ounger , Middle , Older , and Unknown ; see T able 3 for group distributions in D calval , D cal and D test . W e employ CLIP V iT -L/14 ( Radford et al. , 2021 ) as a zero-shot image classifier to generate class scores, to which conformal prediction is applied. F ACET is distrib uted under Meta’ s F A CET usage agreement (custom license) and is intended for ev aluation only; using F A CET annotations for training is prohibited. T ext Classification. T ext classification is commonly used to or ganize lar ge volumes of te xt input, for example in hiring or recruitment, where demographic biases may arise. As a surrogate task, we use the BiosBias dataset ( De-Arteaga et al. , 2019 ), which contains personal biographies labeled by occupation and grouped by binary gender . W e select the 10 most frequent occupations [ Pr ofessor , Physician, Photographer , Journalist, Psyc hologist, T eacher , Dentist, Sur geon, P ainter , and Model ] and partition the dataset into D train , D val , D cal , D calval , and D test , ensuring class balance across splits. See T able 4 for binary group distributions in D calval , D cal and D test . A pre-trained BER T model ( Devlin et al. , 2019 ) is used to generate text representations, on which we train a linear classifier . Conformal prediction is applied using the classifier’ s output scores. The code and data-generation pipeline for BiosBias is released under the MIT License. A udio Emotion Recognition. Emotion recognition arises naturally in human communication, though emotional expression can vary across speak ers from different demographic groups. W e use the RA VDESS dataset ( Livingstone & Russo , 2018 ), which contains audio recordings of professional actors expressing eight emotions [ Happy , Angry , Calm, F earful, Neutral, Disgust, Sad and Surprised ] using identical short phrases, with speakers grouped by binary gender . The dataset is split into D cal , D calval , and D test , stratified by emotion class and gender (see T able 5 ). W e adopt a fine-tuned wav2v ec 2.0 model ( Baevski et al. , 2020 ; Grosman , 2021 ; F adel , 2023 ) for emotion classification. RA VDESS is released under the Creati ve Commons Attribution-NonCommercial-ShareAlik e 4.0 International license (CC BY -NC-SA 4.0). T abular Data Pr ediction. T abular prediction tasks arise in many real-world decision-making settings, including banking, insurance underwriting, credit risk assessment, and public polic y , where structured demographic and socioeconomic features are used to inform consequential decisions. W e consider a tabular prediction setting using the A CSIncome dataset from the Folktables benchmark ( Ding et al. , 2021 ), which is deriv ed from the 2023 U.S. Census data. Race is treated as the sensitive attribute for group-based ev aluation. W e re-grouped the race attrib ute to five categories [ White alone, Black or African American alone, Asian alone, T wo or More Races, All Other Races (Aggr egated) ]. The task is to predict the income lev el of an individual among 10 predefined income brackets [ 104 - 9000, 9000 - 20000, 20000 - 30000, 30000 - 38800, 38800 - 48450, 48450 - 60000, 60000 - 75000, 75000 - 96900, 96900 - 140000, 140000 - 1672000 ], using features such as education, employment, and household characteristics. W e partition the dataset into calibration ( D cal ), calibration-v alidation ( D calval ), and test ( D test ) splits, with stratification by income bracket. Refer to T able 6 for group distributions in D calval , D cal and D test . For classification, we employ an XGBoost model ( Chen & Guestrin , 2016 ), and apply conformal prediction to the model’ s output scores. A CSIncome is derived from the U.S. Census Bureau’ s American Community Survey (ACS) Public Use Microdata Sample (PUMS); use of the underlying A CS PUMS data is governed by the Census Bureau’ s terms of service. 25 Beyond Pr ocedure: Substantive F airness in Conformal Pr ediction T able 3. F ACET Group Counts. G R O U P D C A LV A L D C A L D T E ST Y O U N G E R 2 5 4 7 1 1 2 7 6 M I D D L E 7 7 2 2 1 4 4 7 2 9 O L D E R 1 0 3 2 9 9 9 1 U N K N O W N 2 7 1 8 4 6 3 0 4 T OTA L 1 4 0 0 4 0 0 0 1 4 0 0 T able 4. BiosBias Group Counts. G R O U P D C A LV A L D C A L D T E ST F E M A L E 2 4 2 4 4 8 8 7 9 6 9 M A L E 2 5 7 6 5 1 1 3 1 0 3 1 T OTA L 5 0 0 0 1 0 0 0 0 2 0 0 0 T able 5. RA VDESS Group Counts. G R O U P D C A LV A L D C A L D T E ST F E M A L E 1 2 0 4 2 0 18 0 M A L E 1 2 0 4 2 0 1 8 0 T OTA L 2 4 0 8 4 0 36 0 T able 6. A CSIncome Group Counts. G R O U P D C A LV A L D C A L D T E ST W H I T E 6 6 5 5 1 3 4 8 7 6 6 3 7 B L A C K O R A F R I C A N A M E R I C A N 8 4 2 1 5 6 0 8 1 9 A S I A N 6 6 2 1 3 6 2 6 6 3 T W O O R M O R E R AC E S 1 1 3 4 2 1 6 4 1 1 1 7 A L L O T H E R R AC E S 7 0 7 1 4 2 7 7 6 4 T OTA L 1 0 0 0 0 2 0 0 0 0 1 0 0 0 0 D.2. Scor e Functions Used f or Conformal Pr ediction The Marginal, Mondrian, Label-Clustered and Group-Clustered CP considered in this paper are implemented using one of two nonconformity score functions: RAPS ( Angelopoulos et al. , 2021 ) or SAPS ( Huang et al. , 2024 ). A nonconformity score s : X × Y → R assigns a scalar value s ( x, y ) to each candidate label y for an input x , where smaller values indicate that y is more compatible with x under the base model. Different CP procedures in our experiments dif fer only in how these scores are calibrated (e.g., global vs. group-wise vs. cluster -wise calibration), but they all use the same underlying score definitions below . Notation. Let Y = { 1 , . . . , L } be the label set. For an input x , let f ( x ) ∈ R L denote the model logits and define temperature-scaled softmax probabilities p y ( x ) = exp( f y ( x ) /T ) P y ′ ∈Y exp( f y ′ ( x ) /T ) , T > 0 . Let π x (1) , . . . , π x ( L ) be labels sorted so that p π x (1) ( x ) ≥ p π x (2) ( x ) ≥ · · · ≥ p π x ( L ) ( x ) , and define the rank o x ( y ) := min { k : π x ( k ) = y } . W e also use an independent randomization variable u ∼ Unif [0 , 1] for tie-breaking. RAPS. RAPS (Re gularized Adapti ve Prediction Sets ( Angelopoulos et al. , 2021 )) combines a randomized cumulati ve-mass term with an explicit penalty on lo wer-ranked labels. Define the cumulativ e probability mass strictly above y by ρ x ( y ) := o x ( y ) − 1 X k =1 p π x ( k ) ( x ) . Giv en hyperparameters λ ≥ 0 and k reg ∈ { 1 , . . . , L } , the RAPS nonconformity score is s RAPS ( x, y ) := ρ x ( y ) + u p y ( x ) + λ o x ( y ) − k reg + , ( a ) + := max { a, 0 } . SAPS. SAPS (Sorted Adaptiv e Prediction Sets ( Huang et al. , 2024 )) is a rank-based score that retains the ordering information while reducing dependence on small tail probabilities. Let p max ( x ) := max y ′ p y ′ ( x ) = p π x (1) ( x ) . W ith hyperparameter λ ≥ 0 , define s SAPS ( x, y ) := ( u p y ( x ) , if o x ( y ) = 1 , p max ( x ) + λ o x ( y ) − 2 + u , if o x ( y ) ≥ 2 . 26 Beyond Pr ocedure: Substantive F airness in Conformal Pr ediction D.3. Hyper parameters T uning hyperparameters in RAPS and SAPS. T o construct CP sets, we split the data into three disjoint parts: a tuning set D calval , a calibration set D cal , and a test set D test . Hyperparameters in the score functions are selected using D calval . After tuning, conformal thresholds are computed on D cal with the chosen hyperparameters. Prediction sets used in the LLM-in-the-loop ev aluator for the downstream task are then obtained on D test . W e tune hyperparameters by using Bayesian optimization via the Optuna library ( Akiba et al. , 2019 ), coupled with the TPESampler for ef ficient search o ver 50 iterations to minimize a verage set size. For each set of candidate hyperparameters, we (i) compute the conformal threshold(s) ˆ q from D cal , (ii) form prediction sets according to the rules of CP methods on D calval , and (iii) score the hyperparameters candidate by the a verage set size on D calval . W e select the optimal hyperparameters as the minimizer of average set size. For Mondrian, Label-Clustered and Group-Clustered CP , the same set of hyperparameters is used across all groups/clusters during tuning, while the final conformal thresholds are calibrated separately within each group/cluster . T able 7 presents the final hyperparameters after the tuning procedure. T able 7. Hyperparameter Settings for Each Dataset After T uning D AT A S E T S C O R E F U N C T I O N M A R G I NA L M O N D R I A N L A B E L - C L U S T E R E D G RO U P - C L U S T E R E D T λ k reg T λ k reg T λ k reg T λ k reg FAC E T R A P S 0 . 5 3 0 . 0 7 4 0 . 3 0 0 . 1 6 4 0 . 5 1 1 . 3 8 4 0 . 3 0 0 . 1 6 4 B I O S B I A S S A P S 0 . 5 6 0 . 2 0 – 0 . 4 0 0 . 2 0 – 0 . 7 4 0 . 2 8 – 0 . 4 7 0 . 1 9 – R A V D E S S R A P S 0 . 1 6 1 . 6 1 3 0 . 1 5 0 . 6 9 3 0 . 1 7 0 . 3 5 3 0 . 1 6 0 . 5 1 3 AC S I N C O M E R A P S 0 . 0 9 0 . 0 5 4 0. 1 0 0 . 0 5 4 0 . 0 9 0 . 0 5 4 0 . 0 9 0 . 0 5 4 Hyperparameters in Clustered CP . As described in Appendix B , we use a proportion parameter γ to determine the size of the clustering subset, ⌊ γ n cal ⌋ , which is used to learn the cluster assignments. In our experiments, we set γ = 0 . 3 , which provides suf ficient data to estimate stable cluster structure while leaving enough observ ations in the remaining calibration set to estimate conformal thresholds. Follo wing Ding et al. ( 2023 ), we use { 0 . 5 , 0 . 6 , 0 . 7 , 0 . 8 , 0 . 9 } ∪ { 1 − α } -quantiles of a score distribution of class/group as the embedding v ector for clustering. T o ensure these quantile features are well-defined, we set n α = (1 /α ) − 1 (e.g., n α = 9 when α = 0 . 1 ), the minimum sample size for which the empirical (1 − α ) -quantile is finite. Any class/group with at most n α observat ions in the clustering subset is assigned to a null cluster; the remaining classes/groups are embedded via the above quantiles and clustered using k -means. Hyperparameters and implementation of Backward CP . In our implementation of Backward CP , we do not use RAPS or SAPS score functions, instead, we use the cross-entropy loss as the score to compute the e-v alue. Let f ( x ) ∈ R |Y | denote model logits and p ( y | x ) = softmax ( f ( x )) y . W e use the cross-entropy loss s NLL ( x, y ) = − log ( p ( y | x ) + ϵ ) , with ϵ > 0 for numeric stability so the score is well-defined e ven when p ( y | x ) = 0 . In our experiment, we set ϵ = 1 e − 4 . Giv en calibration data { ( X i , Y i ) } n i =1 , define S i = s NLL ( X i , Y i ) . For a test input x test and candidate label y , compute the e-value E test ( y ) = ( n + 1) s NLL ( x test , y ) P n i =1 S i + s NLL ( x test , y ) . For an y α ∈ (0 , 1) , the prediction set is C α n ( x test ) = { y ∈ Y : E test ( y ) < 1 /α } , using a strict inequality to break ties. Backward CP selects a data-dependent lev el ˜ α ( x test ) to satisfy a maximum set size constraint T . In our implementation, the target size is T = ⌈ av erage set size from Marginal CP ⌉ + of fset . W e choose ˜ α as the smallest α ∈ [ ϵ ′ , 1 − ϵ ′ ] (set ϵ ′ = 1 e − 4 ) such that |C α n | ≤ T . The ˜ α is computed by binary search up to a tolerance parameter (which we set to 1 e − 7 ). If the resulting set is empty , we increase T by one and repeat to ensure a 27 Beyond Pr ocedure: Substantive F airness in Conformal Pr ediction nonempty prediction set. Moreover , the offset starts from 0, and we increase it iteratively until the empirical cov erage meets the target 1 − α up to a fixed maximum number of iterations, which we set to be 10. D.4. Pr ompts Used f or LLM-in-the-loop Evaluator For LLM-based do wnstream prediction tasks, we use different LLMs depending on the modality and dataset: Qwen2.5- VL-7B-Instruct ( h t t p s : / / h u gg i n g f a c e . c o / Q w e n/ Q w e n 2 . 5- V L- 7 B- I n s t r u c t ) for F ACET (vision-language), GPT -4o-mini ( h t t p s : / / p l a t f o rm .o pe na i. co m/ do cs /m o d e l s / g p t- 4 o- m i n i ) and Llama-3.2-3B ( h t t p s : / / h u g gi n g f a c e . c o / m et a- l l a m a/ L l a m a - 3 . 2 - 3 B ) for BiosBias (te xt), GPT -4o-audio-pre view ( h t t ps : / / p l a t f o r m . o p e n a i . c o m / d o c s / m o d e l s / g p t- 4 o- a u d i o - p r e v i ew ) for RA VDESS (audio), and Qwen2.5-7B ( h t t p s : / / h ug g i n g f a c e . c o / Q we n / Q w e n 2 . 5- 7 B ) for ACSIncome (tabular and te xt-only prompting). These choice reflect modality compatibility and were held fixed across CP methods within each dataset to ensure fair comparisons. The prompt templates used in our experiments are as follo ws: 1. F A CET You are given an image of a person and a list of possible classes: [{all options}]. Select exactly one class name from this list. Respond with only the class name. Do not provide explanations or additional text. image attached The following shorter list contains classes that are more likely to be correct: [{options}] Based on the image, which class is the person most likely to belong to? Control: You are given an image of a person and a list of possible classes: [{all options}]. Select exactly one class name from this list. Respond with only the class name. Do not provide explanations or additional text. image attached Based on the image, which class is the person most likely to belong to? 2. BiosBias You are an HR expert. Given a short biography, select the correct occupation from the provided list: [{all options}]. Respond with only the occupation name from this list. Do not explain your reasoning. Biography: {prompt} The following shorter list contains occupations that are more likely to be correct: [{options}] Based on the biography above, which occupation is the best match? Control: You are an HR expert. Given a short biography, select the correct occupation from the provided list: [{all options}]. Respond with only the occupation name from this list. Do not explain your reasoning. Biography: {prompt} Based on the biography above, which occupation is the best match? 3. RA VDESS 28 Beyond Pr ocedure: Substantive F airness in Conformal Pr ediction You are an expert in emotion classification from audio. Instructions: - Focus on HOW they speak, not WHAT they say - Listen for vocal tone, pitch patterns, and energy - Classify which emotion does the audio convey Choose one emotion from this list: [{all options}] Answer with ONE word from the list only. Prediction set from a classifier with {coverage info} confidence to contain the true answer: [{options}] Listen carefully to the speaker's voice. Analyze: 1. Vocal tone 2. Pitch patterns (high/low, rising/falling) 3. Speaking energy 4. Emotional expression in delivery Based on these cues in the audio, which emotion best matches the speaker's vocal expression? Control: You are an expert in emotion classification from audio. Instructions: - Focus on HOW they speak, not WHAT they say - Listen for vocal tone, pitch patterns, and energy - Classify which emotion does the audio convey Choose one emotion from this list: [{all options}] Answer with ONE word from the list only. Listen carefully to the speaker's voice. Analyze: 1. Vocal tone 2. Pitch patterns (high/low, rising/falling) 3. Speaking energy 4. Emotional expression in delivery Based on these cues in the audio, which emotion best matches the speaker's vocal expression? Choose from: [{all options}] 4. A CSIncome You are a labor economics expert. Given a structured demographic and employment profile from a census survey, select the correct income bracket from the provided list: [{all options}]. Respond with only the income bracket label. Do not explain your reasoning. Profile: The following is a structured demographic and employment profile derived from a census survey. Age: {AGEP} Class of worker: {COW} Educational attainment: {SCHL} Marital status: {MAR} Occupation code: {OCCP} Place of birth: {POBP} Employment status of parent: {ESP} Relationship to household reference person: {RELSHIPP} Usual hours worked per week (past 12 months): {WKHP} Sex: {SEX} Race: {RAC1P} The following income brackets are more likely to be correct: [{options}] Based on the profile above, which income bracket is the best match? Control: 29 Beyond Pr ocedure: Substantive F airness in Conformal Pr ediction You are a labor economics expert. Given a structured demographic and employment profile from a census survey, select the correct income bracket from the provided list: [{all options}]. Respond with only the income bracket label. Do not explain your reasoning. Profile: The following is a structured demographic and employment profile derived from a census survey. Age: {AGEP} Class of worker: {COW} Educational attainment: {SCHL} Marital status: {MAR} Occupation code: {OCCP} Place of birth: {POBP} Employment status of parent: {ESP} Relationship to household reference person: {RELSHIPP} Usual hours worked per week (past 12 months): {WKHP} Sex: {SEX} Race: {RAC1P} Based on the profile above, which income bracket is the best match? 30 Beyond Pr ocedure: Substantive F airness in Conformal Pr ediction E. Details and Results from the LLM-in-the-loop Ev aluator E.1. Comparing Human-in-the-loop and LLM-in-the-loop Evaluators W e present a detailed comparison between our LLM-in-the-loop ev aluator and the prior human-in-the-loop e valuator ( Cresswell et al. , 2025 ) to show the validity of using the LLM-in-the-loop ev aluator as a scalable proxy for assessing substantiv e fairness of CP methods. Moreover , we use our experimental results to illustrate ho w we calibrate the LLM-in- the-loop ev aluator so that it captures the key behaviors of substantiv e fairness discovered in the prior study with human subjects. Adoption-rate-difference in human vs. LLM. The following T able 8 , T able 9 , and T able 10 present the adoption rate (proportion of predicted labels contained in the provided prediction set) of the prior human subjects and the LLMs used in our experiments. Here, we consider the intersection of the CP methods (Marginal and Mondrian) and datasets (F A CET , BiosBias, RA VDESS) between the ones used by Cresswell et al. ( 2025 ) and in our experiments. As observ ed from the tables, ov erall, LLMs ha ve higher adoption rates compared to human subjects, indicating that LLMs tend to closely follow the prompt and rely on the provided prediction set when making decisions. Inearly experiments, we found that this tendency of high reliance on provided sets is more prominent when using more capable LLMs. Calibrate the LLM-in-the-loop evaluator . As LLMs are more dependent on the provided prediction set when outputting a response, accuracy dif fers systematically across adoption status, and inv alid responses (answers that are outside of the label space) often occur when the LLM does not pick a label from the provided set (see T able 11 ). Gi ven that adoption is strongly predictive of downstream correctness from LLM, we treat adoption as an outcome-rele vant cov ariate so that estimated treatment effects compare methods at comparable le vels of reliance on the prediction set. Here, we include an example of maxR OR computed from the GEE without the adoption covariate to illustrate that omitting adoption can yield misleading conclusions on substantiv e fairness, because treatments and groups may be compared at different (and une ven) lev els of reliance on the provided set. As what described in Section 4.2 , for each test x j in BiosBias and treatment t , we ask LLM to predict y j based on x j , C t ( x j ) , and the stated cov erage guarantee M times (in the control case, no prediction set is pro vided). Then, we compute the R j t , which is the proportion of correct responses for x j under treatment t out of the M predictions, and fit to the GEE proposed by Cresswell et al. ( 2025 ): logit ( E [ R j t ]) ∼ treatment t × group j + dif f j (A14) The OR and maxR OR are computed based on the fitted Equation ( A14 ) according to the same logic described in Appendix C.2 . The results are shown in T able 12 . As we can see, in this case, maxR OR Marginal > maxROR Mondrian , which does not align with the behavior discov ered by Cresswell et al. ( 2025 ). This is because the LLM’ s adoption rate for the Male group under the Marginal treatment is extremely high (98.20%; see T able 9 ). As a result, predictions for the Male group benefit disproportionately from the Marginal treatment, inflating OR Marginal, Male and hence maxR OR Marginal . This counterexample moti vates including “adoption” as a cov ariate in the GEE. Alignment with human-in-the-loop experiments. T o make our evaluator reflect the substantiv e-fairness pattern dis- cov ered by Cresswell et al. ( 2025 ) while respecting the different experimental design, we treat each task instance as the clustering unit in the GEE Equation ( 15 ) with adoption as a cov ariate. From the results shown in Appendix E.2 (also summarized in T able 2 ), we see that the LLM-in-the-loop ev aluator outputs maxR OR Marginal < maxROR Mondrian in our experiments on F A CET , BiosBias, and RA VDESS. Moreov er , the maxR OR sho ws a pattern that it is small when the set size disparity between sensitiv e groups is small (e.g., in the case of Marginal, Label-Clustered, or Backward), and the maxR OR is large for Mondrian and Group-Clustered CP , which hav e large set size disparity due to equalizing coverage across groups. This trend of maxR OR reflects the do wnstream prediction behavior disco vered by Cresswell et al. ( 2025 ), v alidating that the LLM-in-the-loop ev aluator captures key properties of substantiv e fairness re vealed in the prior human-in-the-loop study , and supporting the use of the LLM-in-the-loop ev aluator as a proxy for assessing substantiv e fairness across CP methods. 31 Beyond Pr ocedure: Substantive F airness in Conformal Pr ediction T able 8. Adoption rate of human vs. LLM (Qwen2.5-VL-7B-Instruct) for F A CET T R E A T M E N T G R O U P H U M A N A D O P T I O N % L L M A D O P T I O N % M A R G I NA L M I D D L E 9 2 . 8 2 96 . 5 2 O L D E R 9 1 . 6 6 90 . 6 6 U N K N O W N 9 6 . 7 6 9 9 . 0 1 Y O U N G E R 9 4 . 7 9 9 8 . 2 3 M O N D R I A N M I D D L E 9 3 . 2 2 9 6 . 4 2 O L D E R 9 2 . 9 1 9 2 . 1 7 U N K N O W N 9 6 . 7 6 9 8 . 6 8 Y O U N G E R 9 6 . 6 6 9 8 . 0 5 T able 9. Adoption rate of human vs. LLM (GPT -4o-mini) for BiosBias T R E A T M E N T G R O U P H U M A N A D O P T I O N % L L M A D O P T I O N % M A R G I NA L F E M A L E 9 2 . 3 1 95 . 2 2 M A L E 9 3 . 8 7 9 8 . 2 0 M O N D R I A N F E M A L E 9 2 . 3 0 92 . 0 7 M A L E 9 4 . 4 8 9 7 . 3 6 T able 10. Adoption rate of human vs. LLM (GPT -4o-audio-preview) for RA VDESS T R E A T M E N T G R O U P H U M A N A D O P T I O N % L L M A D O P T I O N % M A R G I NA L F E M A L E 9 0 . 6 7 91 . 8 9 M A L E 8 7 . 9 7 9 2 . 4 4 M O N D R I A N F E M A L E 9 1 . 9 5 90 . 0 0 M A L E 9 2 . 2 0 9 4 . 1 1 T able 11. Empirical probabilities of correct response and in valid response conditioning on adoption status for F ACET , BiosBias, and RA VDESS datasets. As we can see, the P ( correct | adoption = 1) is higher than P ( correct | adoption = 0) , especially for the challenging F A CET and RA VDESS tasks. FAC E T B I O S B I A S R A V D E S S P ( C O R R E C T | A D O P T I O N = 1) 7 8 . 4 0 % 8 0 . 6 4 % 4 6 . 5 8 % P ( C O R R E C T | A D O P T I O N = 0) 3 7 . 9 9 % 7 6 . 7 4 % 0 . 0 0 % P ( I N V A L I D | A D O P T I O N = 0) 2 5 . 1 4 % 9 . 3 0 % 4 1 . 7 5 % T able 12. The OR and maxROR computed from fitting a GEE without the “adoption” co variate for BiosBias. As shown on the table, OR Marginal , Male has a relatively large value from the relati vely high adoption rate, resulting in lar ger maxR OR Marginal than maxR OR Mondrian . G R O U P O R M A RG I N A L O R M O ND R I A N M A X RO R M A RG I N A L (%) M A X R O R M O ND R I A N (%) F E M A L E 1 . 0 2 6 1 . 2 1 9 2 7 . 4 9 . 9 M A L E 1 . 3 0 8 1 . 1 1 0 E.2. LLM-in-the-loop Evaluator Results on Differ ent T asks In T able 13 through T able 17 we show more detailed statistics from LLM-in-the-loop experiments of Section 6.2 across datasets and CP methods. In particular , we provide one ablation on BiosBias where our standard LLM GPT -4o-mini was replaced with Llama-3.2-3B ( Grattafiori et al. , 2024 ), demonstrating that qualitativ ely similar results can be obtained from distinct LLMs on the same task. 32 Beyond Pr ocedure: Substantive F airness in Conformal Pr ediction T able 13. Accuracy and f airness result on BiosBias experiment with GPT -4o-mini as the LLM-in-the-loop. T R E A T M E N T C V G ( G A P ) % S I Z E ( G A P ) A C C U R AC Y ( G A P ) % M A X RO R % C O N T R O L 7 8 . 9 6 ( 2 . 8 6 ) M A R G I NA L 8 9 . 5 ( 2 . 7 5 ) 1 . 6 8 ( . 0 5 0 ) 8 0 . 7 1 ( 3 . 7 5 ) 6 . 9 M O N D R I A N 9 0 . 0 ( . 2 2 0 ) 1 . 8 0 ( . 4 7 4 ) 8 0 . 9 6 ( 3 . 9 0 ) 8. 1 L A B E L - C L U S T E R E D 9 0 . 2 ( 2 . 8 0 ) 1 . 8 1 ( . 0 3 3 ) 7 9 . 7 2 ( 2 . 5 5 ) 1 . 6 G R O U P - C L U S T E R E D 9 0 . 2 ( . 1 9 3 ) 1 . 7 5 ( . 4 1 9 ) 8 1 . 0 5 ( 4 . 5 3 ) 1 2 . 5 B A C K WA R D 9 1 . 5 ( 1 . 8 7 ) 2 . 5 0 ( . 0 2 5 ) 7 9 . 4 1 ( 2 . 8 7 ) 0 . 3 T able 14. Accuracy and f airness result on BiosBias experiment with Llama-3.2-3B as the LLM-in-the-loop. T R E A T M E N T C V G ( G A P ) % S I Z E ( G A P ) A C C U R AC Y ( G A P ) % M A X RO R % C O N T R O L 6 7 . 5 4 ( 4 . 9 7 ) M A R G I NA L 8 9 . 7 ( 2 . 7 6 ) 1 . 6 9 ( . 0 2 7 ) 7 6 . 0 3 ( 3 . 2 8 ) 5 0 . 0 M O N D R I A N 8 9 . 1 ( 0 . 0 0 ) 1 . 7 0 ( . 4 3 5 ) 7 5 . 9 8 ( 5 . 0 3 ) 6 6 . 3 L A B E L - C L U S T E R E D 9 0 . 1 ( . 0 1 9 ) 1 . 7 8 ( . 0 6 7 ) 7 4 . 8 3 ( 1 . 5 5 ) 3 6 . 0 G R O U P - C L U S T E R E D 9 0 . 3 ( . 0 1 0 ) 1 . 7 4 ( . 3 4 3 ) 7 5 . 7 4 ( 4 . 3 0 ) 5 9 . 3 B A C K WA R D 9 1 . 5 ( . 0 1 8 ) 2 . 4 9 ( . 0 1 6 ) 7 1 . 1 9 ( 1 . 3 8 ) 3 6 . 2 T able 15. Accuracy and f airness result on RA VDESS experiment with GPT -4o-audio-pr eview as the LLM-in-the-loop. T R E A T M E N T C V G ( G A P ) % S I Z E ( G A P ) A C C U R AC Y ( G A P ) % M A X RO R % C O N T R O L 2 1 . 1 1 ( 0 . 6 7 ) M A R G I NA L 8 8 . 3 3 ( 5 . 5 6 ) 1 . 8 9 ( . 0 3 9 ) 4 4 . 2 8 ( 1 . 0 0 ) 1 0 . 5 M O N D R I A N 8 7 . 5 0 ( . 5 5 6 ) 1 . 8 6 ( . 5 7 8 ) 4 4 . 5 6 ( 1 2 . 0 ) 7 9 . 2 L A B E L - C L U S T E R E D 8 7 . 7 8 ( 2 . 2 2 ) 1 . 9 2 ( . 0 1 1 ) 4 6 . 2 2 ( 1 . 3 3 ) 1 2 . 1 G R O U P - C L U S T E R E D 8 7 . 5 0 ( . 5 5 6 ) 1 . 9 0 ( . 5 9 4 ) 4 2 . 9 4 ( 1 5 . 4 4 ) 1 1 0 . 3 B A C K WA R D 9 1 . 9 4 ( 8 . 3 3 ) 2 . 4 8 ( . 0 1 1 ) 3 9 . 2 2 ( 2 . 2 2 ) 1 7 . 0 T able 16. Accuracy and f airness result on F A CET experiment with Qwen2.5-VL-7B-Instruct as the LLM-in-the-loop. T R E A T M E N T C V G ( G A P ) % S I Z E ( G A P ) A C C U R AC Y ( G A P ) % M A X RO R % C O N T R O L 7 4 . 0 4 ( 1 8 . 0 0 ) M A R G I NA L 8 9 . 9 ( 1 0 . 7 ) 2 . 6 2 ( . 7 3 8 ) 7 6 . 9 1 ( 1 6 . 2 7 ) 9 . 0 M O N D R I A N 8 9 . 9 ( 3 . 0 2 ) 2 . 6 9 ( 2 . 6 8 ) 7 7 . 0 6 ( 2 1 . 7 1 ) 3 7 . 7 L A B E L - C L U S T E R E D 8 9 . 1 ( 7 . 4 6 ) 2 . 9 2 ( . 3 5 6 ) 7 8 . 8 1 ( 1 4 . 4 7 ) 1 3 . 5 G R O U P - C L U S T E R E D 8 9 . 1 ( 8 . 1 4 ) 2 . 5 0 ( 1 . 2 8 ) 7 7 . 2 2 ( 1 8 . 0 5 ) 1 4 . 5 B A C K WA R D 9 0 . 3 ( 8 . 8 5 ) 3 . 5 0 ( . 0 5 3 ) 7 5 . 5 4 ( 1 8 . 3 9 ) 8 . 5 T able 17. Accuracy and f airness result on A CSIncome experiment with Qwen2.5-7B as the LLM-in-the-loop. T R E A T M E N T C V G ( G A P ) % S I Z E ( G A P ) A C C U R AC Y ( G A P ) % M A X RO R % C O N T R O L 1 4 . 7 0 ( 2 . 2 2 ) M A R G I NA L 8 9 . 8 ( 3 . 1 8 ) 5 . 3 5 ( . 2 5 6 ) 2 0 . 4 1 ( 3 . 1 5 ) 1 9 . 4 M O N D R I A N 8 9 . 5 ( 3 . 8 7 ) 7 . 1 6 ( 1 . 0 8 ) 1 4 . 9 1 ( 1 . 5 9 ) 1 7 . 5 L A B E L - C L U S T E R E D 8 9 . 9 ( 3 . 6 7 ) 5 . 3 3 ( . 2 7 0 ) 1 8 . 6 8 ( 2 . 8 8 ) 7 . 2 G R O U P - C L U S T E R E D 8 9 . 8 ( 2 . 8 8 ) 5 . 3 7 ( . 4 1 0 ) 1 9 . 0 2 ( 5 . 0 5 ) 2 3 . 1 B A C K WA R D 9 2 . 3 ( 3 . 0 3 ) 6 . 5 0 ( . 0 1 0 ) 1 5 . 0 2 ( 4 . 3 7 ) 1 9 . 7 E.3. Bootstrap Results T o provide uncertainty estimates on the maxR OR metric, we performed bootstrap sampling o ver the LLM’ s task predictions, with results shown in T able 18 through T able 21 . 33 Beyond Pr ocedure: Substantive F airness in Conformal Pr ediction T able 18. Mean accuracy (gap) and mean ± one standard error for maxROR o ver 1,000 resamples for BiosBias experiment on T able 13 T R E A T M E N T A C C U R A C Y ( G A P ) % M A X RO R % C O N T R O L 7 9 . 0 1 ( 2 . 8 4 ) M A R G I NA L 8 0 . 7 9 ( 3 . 6 9 ) 9 . 0 ± . 2 2 M O N D R I A N 8 1 . 0 6 ( 3 . 8 7 ) 9 . 7 ± . 2 2 L A B E L - C L U S T E R E D 7 9 . 7 8 ( 2 . 5 4 ) 6 . 1 ± . 1 6 G R O U P - C L U S T E R E D 8 1 . 1 5 ( 4 . 4 9 ) 1 3 . 1 ± . 2 6 B A C K WA R D 7 9 . 4 9 ( 2 . 8 2 ) 6 . 5 ± . 1 6 T able 19. Mean accuracy (gap) and mean ± one standard error for maxROR o ver 1,000 resamples for RA VDESS experiment on T able 15 T R E A T M E N T A C C U R A C Y ( G A P ) % M A X RO R % C O N T R O L 2 1 . 0 7 ( . 8 4 0 ) M A R G I NA L 4 4 . 2 6 ( . 8 2 0 ) 2 4 . 6 ± 1 . 1 M O N D R I A N 4 4 . 5 6 ( 1 1 . 7 9 ) 7 0 . 0 ± 1 . 2 L A B E L - C L U S T E R E D 4 6 . 0 9 ( 1 . 2 9 ) 2 3 . 4 ± . 7 8 G R O U P - C L U S T E R E D 4 2 . 8 9 ( 1 5 . 2 5 ) 9 2 . 5 ± 1 . 5 B A C K WA R D 3 9 . 2 8 ( 2 . 1 7 ) 1 8 . 4 ± . 4 9 T able 20. Mean accuracy (gap) and mean ± one standard error for maxROR o ver 1,000 resamples for F ACET e xperiment on T able 16 T R E A T M E N T A C C U R A C Y ( G A P ) % M A X RO R % C O N T R O L 7 3 . 6 4 ( 1 8 . 1 7 ) M A R G I NA L 7 6 . 6 9 ( 1 6 . 3 3 ) 2 3 . 4 ± . 3 8 M O N D R I A N 7 6 . 2 6 ( 2 1 . 7 6 ) 4 2 . 3 ± . 6 0 L A B E L - C L U S T E R E D 7 8 . 8 6 ( 1 4 . 6 4 ) 2 8 . 5 ± . 4 4 G R O U P - C L U S T E R E D 7 7 . 0 4 ( 1 8 . 0 7 ) 3 0 . 8 ± . 4 7 B A C K WA R D 7 5 . 0 7 ( 1 8 . 4 3 ) 2 1 . 6 ± . 3 5 T able 21. Mean accuracy (gap) and mean ± one standard error for maxROR over 1,000 resamples for A CSIncome experiment on T able 17 T R E A T M E N T A C C U R A C Y ( G A P ) % M A X RO R % C O N T R O L 1 4 . 5 5 ( 2 . 2 7 ) M A R G I NA L 2 0 . 2 9 ( 3 . 2 2 ) 3 2 . 6 ± . 4 5 M O N D R I A N 1 4 . 6 7 ( 1 . 5 5 ) 3 0 . 9 ± . 4 5 L A B E L - C L U S T E R E D 1 8 . 3 8 ( 2 . 9 0 ) 2 3 . 4 ± . 3 4 G R O U P - C L U S T E R E D 1 8 . 1 9 ( 5 . 0 6 ) 3 2 . 2 ± . 4 3 B A C K WA R D 1 5 . 1 0 ( 4 . 3 5 ) 3 3 . 2 ± . 4 5 34 Beyond Pr ocedure: Substantive F airness in Conformal Pr ediction F . Additional T ables and Plots F .1. CP and LLM-in-the-loop Metrics by Group For further insights, in this section we provide additional tables and plots that break do wn our experimental data sho wing statistics conditional on group variables. T able 22. Continuation of T able 13 . Results on BiosBias experiment for each group. T R E A T M E N T G R O U P C VG % S I Z E S I N G L E T O N % A C C U R AC Y % C O N T R O L F E M A L E 8 0 . 4 3 M A L E 7 7 . 5 8 M A R G I NA L F E M A L E 9 0 . 9 2 1 . 6 5 6 2 . 3 3 8 2 . 6 4 M A L E 8 8 . 1 7 1 . 7 0 6 0 . 1 4 7 8 . 8 9 M O N D R I A N F E M A L E 8 9 . 8 9 1 . 5 6 6 5 . 3 3 8 2 . 9 7 M A L E 9 0 . 1 1 2 . 0 3 2 9 . 0 0 7 9 . 0 7 L A B E L - C L U S T E R E D ( K = 3 ) F E M A L E 9 1 . 6 4 1 . 7 9 4 4 . 5 8 8 1 . 0 3 M A L E 8 8 . 8 5 1 . 8 2 4 3 . 1 6 7 8 . 4 9 G R O U P - C L U S T E R E D ( K = 2 ) F E M A L E 9 0 . 3 0 1 . 5 3 6 9 . 6 6 8 3 . 3 8 M A L E 9 0 . 1 1 1 . 9 5 4 0 . 9 3 7 8 . 8 6 B A C K WA R D F E M A L E 9 2 . 4 7 2 . 4 9 0 . 0 0 8 0 . 8 9 M A L E 9 0 . 5 9 2 . 5 1 0 . 0 0 7 8 . 0 2 Marginal Mondrian Label-Clustered Group-Clustered Backward Treatment 0 20 40 60 80 100 Coverage (%) 2.75 2.80 1.87 Coverage by group and treatment for BiosBias Group F emale Male (a) Cov erage by group and treatment Marginal Mondrian Label-Clustered Group-Clustered Backward Treatment 0.0 0.5 1.0 1.5 2.0 2.5 A verage set size A verage set size by group and treatment for BiosBias Group F emale Male (b) A verage set size by group and treatment Marginal Mondrian Label-Clustered Group-Clustered Backward Treatment 0 20 40 60 80 100 Singleton frequency (%) 2.20 36.32 1.42 28.73 Singleton frequency by group and treatment for BiosBias Group F emale Male (c) Singleton rate by group and treatment Control Marginal Mondrian Label-Clustered Group-Clustered Backward Treatment 0 20 40 60 80 100 Accuracy (%) 2.86 3.75 3.90 2.55 4.53 2.87 Accuracy by group and treatment for BiosBias Group F emale Male (d) Accuracy rate by group and treatment F igure 8. Experiment results of BiosBias with K = 3 in label-clustered CP and K = 2 in group-clustered CP . LLM-in-the-loop: GPT -4o-mini. 35 Beyond Pr ocedure: Substantive F airness in Conformal Pr ediction T able 23. Continuation of T able 15 . Results on RA VDESS experiment for each group. T R E A T M E N T G R O U P C VG % S I Z E S I N G L E T O N % A C C U R AC Y % C O N T R O L F E M A L E 2 0 . 7 8 M A L E 2 1 . 4 4 M A R G I NA L F E M A L E 9 1 . 1 1 1 . 9 1 3 7 . 7 8 4 4 . 7 8 M A L E 8 5 . 5 6 1 . 8 7 4 0 . 5 6 4 3 . 7 8 M O N D R I A N F E M A L E 8 7 . 7 8 1 . 5 7 5 7 . 7 8 5 0 . 5 6 M A L E 8 7 . 2 2 2 . 1 5 2 2 . 2 2 3 8 . 5 6 L A B E L - C L U S T E R E D ( K = 2 ) F E M A L E 8 8 . 8 9 1 . 9 2 3 0 . 5 6 4 6 . 8 9 M A L E 8 6 . 6 7 1 . 9 3 3 2 . 2 2 4 5 . 5 6 G R O U P - C L U S T E R E D ( K = 2 ) F E M A L E 8 7 . 2 2 1 . 6 1 5 6 . 1 1 5 0 . 6 7 M A L E 8 7 . 7 8 2 . 2 0 2 0 . 0 0 3 5 . 2 2 B A C K WA R D F E M A L E 9 6 . 1 1 2 . 4 7 0 . 0 0 4 0 . 3 3 M A L E 8 7 . 7 8 2 . 4 8 0 . 0 0 3 8 . 1 1 Marginal Mondrian Label-Clustered Group-Clustered Backward Treatment 0 20 40 60 80 100 Coverage (%) 5.56 0.56 2.22 0.56 8.33 Coverage by group and treatment for RA VDES S Group F emale Male (a) Cov erage by group and treatment Marginal Mondrian Label-Clustered Group-Clustered Backward Treatment 0.0 0.5 1.0 1.5 2.0 2.5 A verage set size 0.58 0.59 A verage set size by group and treatment for RA VDES S Group F emale Male (b) A verage set size by group and treatment Marginal Mondrian Label-Clustered Group-Clustered Backward Treatment 0 20 40 60 80 100 Singleton frequency (%) 2.78 35.56 1.67 36.11 Singleton frequency by group and treatment for RA VDES S Group F emale Male (c) Singleton rate by group and treatment Control Marginal Mondrian Label-Clustered Group-Clustered Backward Treatment 0 20 40 60 80 100 Accuracy (%) 0.67 1.00 12.00 1.33 15.44 2.22 Accuracy by group and treatment for RA VDES S Group F emale Male (d) Accuracy rate by group and treatment F igure 9. Experiment results of RA VDESS with K = 2 in both label-clustered and group-clustered CP . LLM-in-the-loop: GPT -4o-audio- previe w . 36 Beyond Pr ocedure: Substantive F airness in Conformal Pr ediction T able 24. Continuation of T able 16 . Result on F ACET experiment for each group. T R E A T M E N T G R O U P C V G % S I Z E S I N G L E T O N % A C C U R A C Y % C O N T R O L M I D D L E 7 1 . 4 0 O L D E R 6 5 . 2 5 U N K N O W N 7 4 . 6 3 Y O U N G E R 8 3 . 2 4 M A R G I NA L M I D D L E 8 8 . 6 1 2 . 7 2 2 9 . 2 2 7 4 . 4 9 O L D E R 8 4 . 6 2 2 . 9 1 1 8 . 6 8 6 9 . 5 1 U N K N O W N 8 9 . 4 7 2 . 7 2 2 8 . 9 5 7 6 . 8 9 Y O U N G E R 9 5 . 2 9 2 . 1 7 5 0 . 3 6 8 5 . 7 8 M O N D R I A N M I D D L E 8 9 . 1 6 2 . 9 3 2 4 . 1 4 7 4 . 2 1 O L D E R 8 9 . 0 1 4 . 3 1 0 . 0 0 6 5 . 3 8 U N K N O W N 8 9 . 8 0 2 . 6 0 3 0 . 2 6 7 8 . 2 9 Y O U N G E R 9 2 . 0 3 1 . 6 2 6 7 . 3 9 8 7 . 0 9 L A B E L - C L U S T E R E D ( K = 2 ) M I D D L E 8 7 . 1 1 2 . 9 1 1 1 . 1 1 7 6 . 3 7 O L D E R 9 0 . 1 1 3 . 1 2 5 . 4 9 7 2 . 9 4 U N K N O W N 8 8 . 4 9 3 . 0 0 8 . 8 8 7 8 . 6 2 Y O U N G E R 9 4 . 5 7 2 . 7 6 9. 7 8 8 7 . 4 1 G R O U P - C L U S T E R E D ( K = 2 ) M I D D L E 8 9 . 0 3 2 . 8 7 2 5 . 1 0 7 4 . 0 2 O L D E R 8 4 . 6 2 3 . 0 4 1 5 . 3 8 6 8 . 4 1 U N K N O W N 8 7 . 5 0 2 . 1 1 4 4 . 4 1 7 9 . 1 5 Y O U N G E R 9 2 . 7 5 1 . 7 6 6 3 . 0 4 8 6 . 4 6 B A C K WA R D M I D D L E 8 8 . 7 5 3 . 5 1 0 . 0 0 7 2 . 8 1 O L D E R 8 5 . 7 1 3 . 5 3 0 . 0 0 6 6 . 0 7 U N K N O W N 9 1 . 4 5 3 . 4 9 0 . 0 0 7 6 . 8 1 Y O U N G E R 9 4 . 5 7 3 . 4 7 0. 0 0 8 4 . 4 7 37 Beyond Pr ocedure: Substantive F airness in Conformal Pr ediction Marginal Mondrian Label-Clustered Group-Clustered Backward Treatment 0 20 40 60 80 100 Coverage (%) 10.67 3.02 7.46 8.14 8.85 Coverage by group and treatment for F ACET Group Middle Older Unknown Y ounger (a) Cov erage by group and treatment Marginal Mondrian Label-Clustered Group-Clustered Backward Treatment 0 1 2 3 4 A verage set size 0.74 2.68 1.28 A verage set size by group and treatment for F ACET Group Middle Older Unknown Y ounger (b) A verage set size by group and treatment Marginal Mondrian Label-Clustered Group-Clustered Backward Treatment 0 20 40 60 80 100 Singleton frequency (%) 31.68 67.39 5.62 47.66 Singleton frequency by group and treatment for F ACET Group Middle Older Unknown Y ounger (c) Singleton rate by group and treatment Control Marginal Mondrian Label-Clustered Group-Clustered Backward Treatment 0 20 40 60 80 100 Accuracy (%) 18.00 16.27 21.71 14.47 18.05 18.39 Accuracy by group and treatment for F ACET Group Middle Older Unknown Y ounger (d) Accuracy rate by group and treatment F igure 10. Experiment results of F ACET with K = 2 in both label-clustered and group-clustered CP . LLM-in-the-loop: Qwen2.5-VL-7B- Instruct. 38 Beyond Pr ocedure: Substantive F airness in Conformal Pr ediction T able 25. Continuation of T able 17 . Result on A CSIncome experiment for each group. T R E A T M E N T G R O U P C V G % S I Z E S I N G L E TO N % A C C U R A C Y % C O N T R O L A L L O T H E R R AC E S 1 5 . 1 2 A S I A N 1 2 . 9 0 B L A C K O R A F R I C A N A M E R I C A N 1 5 . 0 8 T W O O R M O R E R AC E S 1 5 . 0 2 W H I T E 1 4 . 7 2 M A R G I NA L A L L O T H E R R AC E S 8 7 . 8 3 5 . 4 4 . 6 5 4 1 9 . 0 8 A S I A N 8 7 . 3 3 5 . 1 9 2 . 7 1 1 8 . 7 4 B L A C K O R A F R I C A N A M E R I C A N 8 8 . 7 7 5 . 3 4 2 . 4 4 2 1 . 8 9 T W O O R M O R E R AC E S 8 9 . 3 5 5 . 3 3 2 . 7 8 2 1 . 4 4 W H I T E 9 0 . 5 1 5 . 3 7 1 . 8 7 2 0 . 3 7 M O N D R I A N A L L O T H E R R AC E S 9 0 . 5 8 7 . 9 8 0 . 0 0 1 5 . 5 8 A S I A N 8 7 . 1 8 6 . 9 0 0 . 0 0 1 3 . 9 0 B L A C K O R A F R I C A N A M E R I C A N 9 0 . 1 1 7 . 6 7 0 . 0 0 1 4 . 5 0 T W O O R M O R E R AC E S 9 1 . 0 5 7 . 6 4 0 . 0 0 1 4 . 1 9 W H I T E 8 9 . 3 3 6 . 9 5 . 0 1 5 1 5 . 1 0 L A B E L - C L U S T E R E D ( K = 2 ) A L L O T H E R R AC E S 8 7 . 7 0 5 . 4 3 0 . 0 0 1 8 . 3 6 A S I A N 8 7 . 0 3 5 . 1 6 0 . 0 0 1 6 . 4 8 B L A C K O R A F R I C A N A M E R I C A N 8 8 . 5 2 5 . 3 2 0 . 0 0 1 9 . 3 5 T W O O R M O R E R AC E S 8 8 . 9 9 5 . 3 5 0 . 0 0 1 8 . 9 6 W H I T E 9 0 . 7 0 5 . 3 4 0 . 0 0 1 8 . 8 0 G R O U P - C L U S T E R E D ( K = 2 ) A L L O T H E R R AC E S 8 7 . 5 7 5 . 3 8 . 2 6 2 1 8 . 5 5 A S I A N 8 9 . 2 9 5 . 7 4 0 . 0 0 1 4 . 4 0 B L A C K O R A F R I C A N A M E R I C A N 8 8 . 4 0 5 . 3 5 . 3 6 6 1 9 . 2 9 T W O O R M O R E R AC E S 8 8 . 8 1 5 . 3 5 . 5 3 7 1 9 . 3 2 W H I T E 9 0 . 4 5 5 . 3 3 . 3 6 2 1 9 . 4 6 B A C K WA R D A L L O T H E R R AC E S 9 0 . 9 7 6 . 4 9 0 . 0 0 1 6 . 5 9 A S I A N 8 9 . 8 9 6 . 4 9 0 . 0 0 1 2 . 2 5 B L A C K O R A F R I C A N A M E R I C A N 9 0 . 8 4 6 . 4 9 0 . 0 0 1 5 . 2 3 T W O O R M O R E R AC E S 9 2 . 9 3 6 . 5 0 0 . 0 0 1 6 . 6 3 W H I T E 9 2 . 7 5 6 . 5 0 0 . 0 0 1 4 . 8 2 39 Beyond Pr ocedure: Substantive F airness in Conformal Pr ediction Marginal Mondrian Label-Clustered Group-Clustered Backward Treatment 0 20 40 60 80 100 Coverage (%) 3.18 3.87 3.67 2.88 3.03 Coverage by group and treatment for ACSIncome Group All Other R aces (Aggregated) Asian alone Black or A frican American alone T wo or More R aces White alone (a) Cov erage by group and treatment Marginal Mondrian Label-Clustered Group-Clustered Backward Treatment 0 2 4 6 8 A verage set size 1.08 A verage set size by group and treatment for ACSIncome Group All Other R aces (Aggregated) Asian alone Black or A frican American alone T wo or More R aces White alone (b) A verage set size by group and treatment Marginal Mondrian Label-Clustered Group-Clustered Backward Treatment 0 20 40 60 80 100 Singleton frequency (%) 2.12 0.54 Singleton frequency by group and treatment for ACSIncome Group All Other R aces (Aggregated) Asian alone Black or A frican American alone T wo or More R aces White alone (c) Singleton rate by group and treatment Control Marginal Mondrian Label-Clustered Group-Clustered Backward Treatment 0 20 40 60 80 100 Accuracy (%) 2.22 3.15 1.59 2.87 5.05 4.37 Accuracy by group and treatment for ACSIncome Group All Other R aces (Aggregated) Asian alone Black or A frican American alone T wo or More R aces White alone (d) Accuracy rate by group and treatment F igure 11. Experiment results of ACSIncome with K = 2 in both label-clustered and group-clustered CP . LLM-in-the-loop: Qwen2.5-7B. F .2. Additional Coverage Gap and Set Size Gap Plots In Section 6.3 we examined the coverage gap and set size gap across CP methods and two datasets. Figure 12 shows all four datasets together . Mar ginal Mondrian Label-Cluster ed Gr oup-Cluster ed Backwar d 0 2 4 6 8 10 Coverage Gap (%) 0 1 2 3 Set Size Gap (a) F A CET Mar ginal Mondrian Label-Cluster ed Gr oup-Cluster ed Backwar d 0 1 2 3 Coverage Gap (%) 0.0 0.2 0.4 0.6 0.8 1.0 Set Size Gap (b) BiosBias Mar ginal Mondrian Label-Cluster ed Gr oup-Cluster ed Backwar d 0 2 4 6 8 Coverage Gap (%) 0.0 0.2 0.4 0.6 0.8 1.0 Set Size Gap (c) RA VDESS Mar ginal Mondrian Label-Cluster ed Gr oup-Cluster ed Backwar d 0 1 2 3 4 Coverage Gap (%) 0.0 0.5 1.0 1.5 Set Size Gap (d) A CSIncome F igure 12. Coverage gap (blue dots, left axis) and set size gap (red squares, right axis) across CP methods on F ACET , BiosBias, RA VDESS, and A CSIncome. 40
Original Paper
Loading high-quality paper...
Comments & Academic Discussion
Loading comments...
Leave a Comment