Diagnosing Heteroskedasticity and Resolving Multicollinearity Paradoxes in Physicochemical Property Prediction
Lipophilicity (logP) prediction remains central to drug discovery, yet linear regression models for this task frequently violate statistical assumptions in ways that invalidate their reported performance metrics. We analyzed 426,850 bioactive molecul…
Authors: Malikussaid, Septian Caesar Floresko, Ade Romadhony
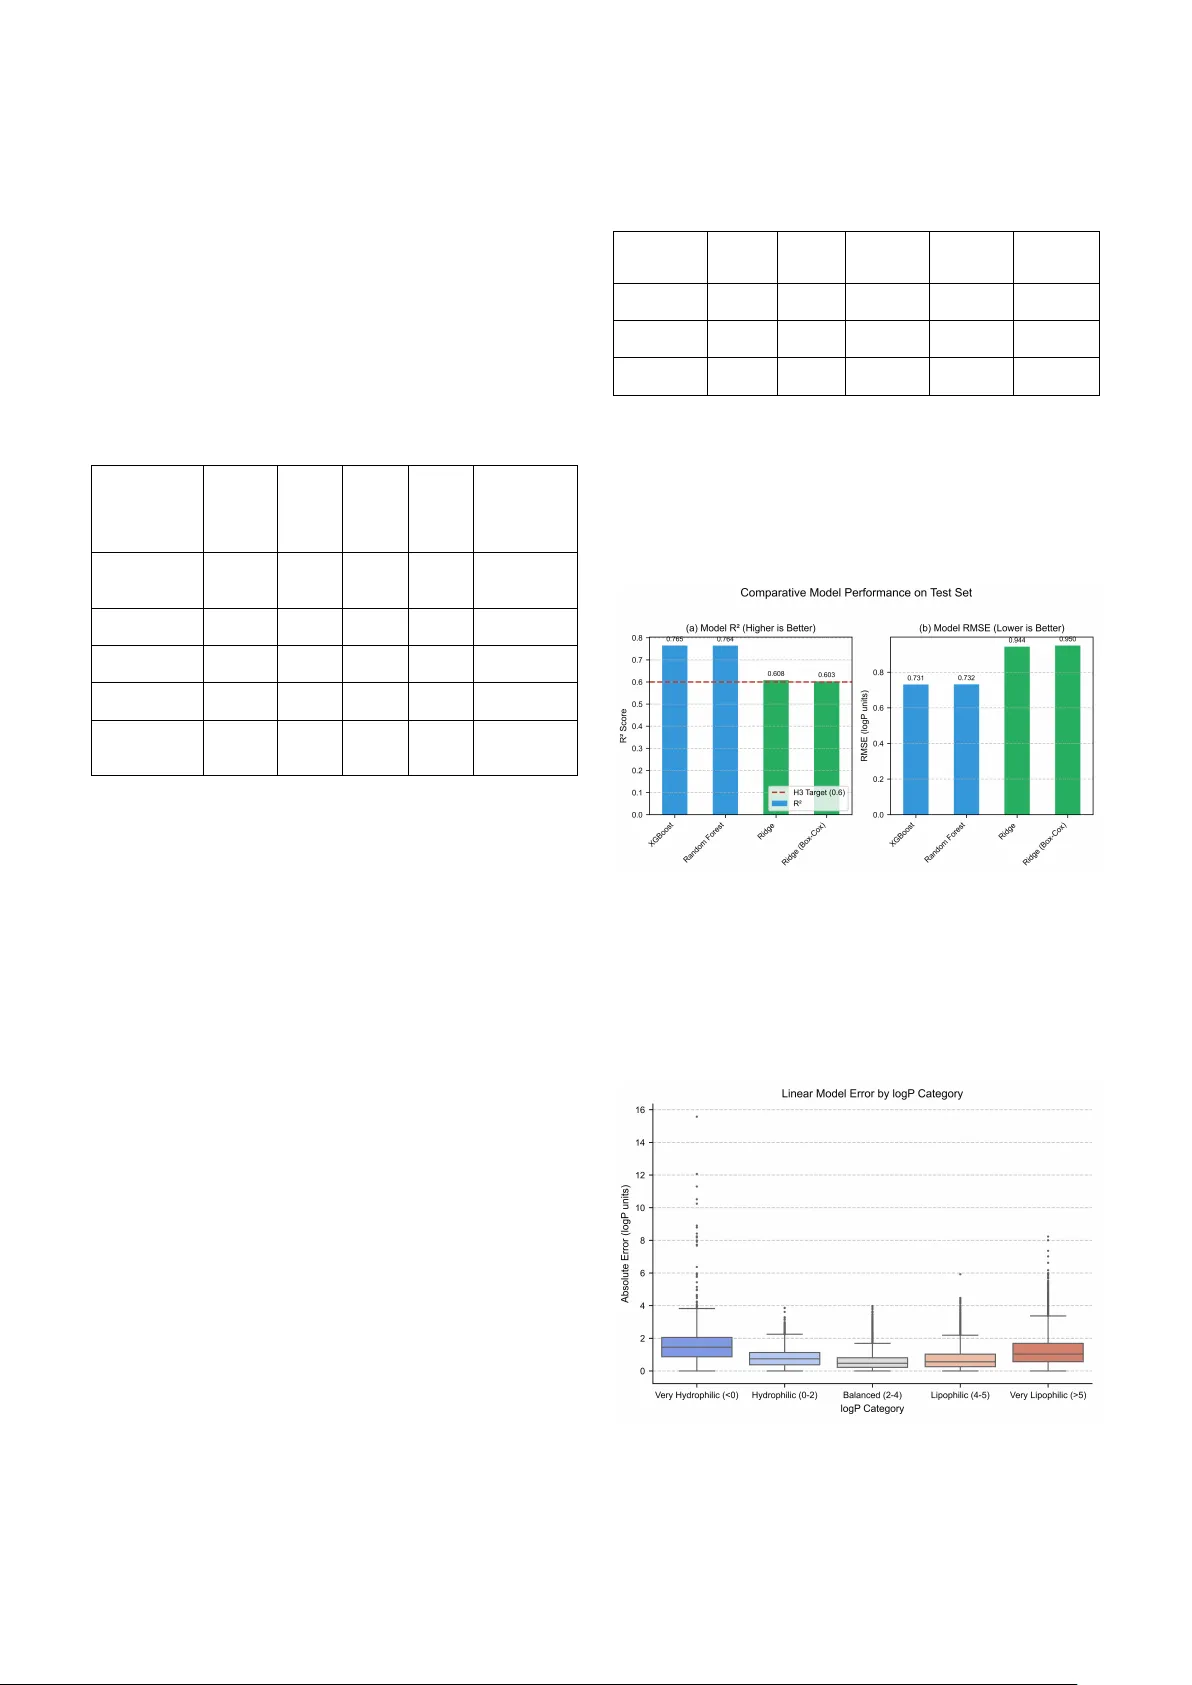
Diagnosing Heteroskedasticity and Resolving Multicollinearity Paradoxes in Physicochemical Property Prediction Malikussaid School of Computing, Telkom University Bandung, Indonesia malikussaid@student.telkomuniversity.ac.id Isman Kurniawan School of Computing, Telkom University Bandung, Indonesia ismankrn@telkomuniversity.ac.id Septian Caesar Floresko School of Computing, Telkom University Bandung, Indonesia septiancaesar@student.telkomuniversity.ac.id Warih Mahar ani School of Computing, Telkom University Bandung, Indonesia wmaharani@telkomuniversity.ac.id Ade Romadhony School of Computing, Telkom University Bandung, Indonesia aderomadhony@telkomuniversity.ac.id Hilal Hudan Nuha School of Computing, Telkom University Bandung, Indonesia hilalnuha@telko muniversity.ac. id Abstract —Li pophilicity (logP) prediction remains central to drug discovery, yet linear regression models for this task frequently violate statistical assumptions in ways that invalidate their reported performance metrics. We analyzed 426,850 bioactive molecules from a rigorously curated intersection of PubChem, C hEMBL, an d eMolecul es datab ases, reveal ing severe heteroskedasticity in linear models predicting computed logP values (XLOGP3): residual variance in creases 4.2-f old in lipophilic regions (logP greater than 5) compared to balanced regions (logP 2 to 4). Class ical remediation strategies — Weighted Least Squares and Box-Cox transformation —f ailed to resolve this violation (Breusch -P agan p -val ue less than 0.0001 for all variants). Tree -b ased ensemble methods (Random Forest R-s quared of 0.764, XGBoost R -s quared of 0.765) proved inherently robust to heteroskedasticity while delivering superior predictive p erforman ce. SHAP an alysis r esolved a cr itical multicollinearity paradox: despite a weak bivariate correlation of 0.146, molecular weight emer ged as the single most important predictor (mean absolute SHAP value of 0.573), with its effect suppressed i n simple correl ations by confoun ding with topological polar surface area (TPSA). These findings demonstrate that standard linear models face fundamental challenge s for computed lipop hilicity pr ediction and provi de a principled f ramework for in terpreting en semble mod els in QSAR applicat ions. Keywords—h eteroskedas ticity, mu lticollin earity, S HAP, lipophilicity pr ediction, Q SAR, en semble me thods I. I NTRODUCTION Lipophil icity, quant ified as t he logarithm of the oct anol - water partition coefficient ( logP), gover ns multiple absorption, distribut ion, meta bolism, excre tion, and t oxicity (ADMET) pa ramet ers in drug discovery [1]. Its inc lusion in Lipinski’s “Rule of Fi ve” [2] esta blished it as a fundamenta l filter for ora l bioavailab ility, and c ontemporar y AI - drive n drug design c ontinue s to opti mize thi s property ac tively [3 ]. Computation al prediction of lipoph ilicity from molecu lar structure remains an active research area, with application s ranging from virtual scre ening to lead opt imization, though challenge s persist in achie ving both acc uracy and s tatisti cal interpretabili ty. The proliferation of large public chemical databases — PubChem [4] , [5]. [6], ChEMBL [7] , [8], [9], [10], and commercial repositories like eM olecules [11] — has enabled the construction of massive training datasets. Yet scale alone does not gua rantee m odel vali dity. Rec ent perspect ives from domain experts emphasize that “po or data quality is a major concer n with the rise of machine learning” methods, as aggregati on can propa gate errors into com putati onal model s [12]. Furthermore, while moder n machine learning achieves impressive predictive perf ormance, statistical assumption s underpinni ng model interpre tati on are freque ntly overlo oked. T his study addresses three critical gaps in curr ent QSAR methodolog y for lipop hilicity predi ction usin g computed l ogP values. Firs t, we demonstrate tha t linear regressio n models — despite numerically acceptab le values — violate the homoskeda sticity as sumption in a s ystematic , chemically meaningful p attern that invalidates their statistical in ferences. Second, we document the failure of representative class ical remediation strategies (Weighted Least Squares, target transforma tion) to re solve thi s violation. T hird, we em ploy SHAP (SHapl ey Additi ve exPlanat ions) [13] t o resolve a n apparent m ulticolli nearity parado x where m olecular wei ght (MolWt) show s negligible b ivariate cor relation with computed l ogP ( = 0. 146 ) yet emerges as the single most important pre dictor in multiv ariate models. Our analysi s utilize d a rigorously c urated dat aset of 426,850 bioac tive mole cules obtai ned from the i ntersecti on of three autho ritative databases , with com puted lipoph ilicity values from PubChem’s XLOGP3 al gorithm se rving as t he prediction target. We demo n strate that tree - based en semble methods (R andom Fores t [14], XGB oost [15]) a re inhere ntly robust to heteroske dasticit y and achieve superior performanc e ( = 0. 765 , RMSE = 0.731 l ogP units ) compared to regularized linear mo dels ( = 0. 608 , but statistically unreliable). The SHAP analysis reveals that the weak MolWt correlati on is a suppre ssion arti fact cause d by MolWt’s confoundin g with topol ogical pol ar surface area (TPSA ), and that control ling for t his confound unmasks MolWt as the domin ant pre dictor. T hese findi ngs provi de actiona ble guidance fo r both mo del sele ction and fea ture i nterpretat ion in computat ional physi cochemica l property p redict ion. II. M ATERIALS AND M ETHODS A. D ataset Construction and Quality Co ntrol We integrated three complementary chemical databases to construct a high - con fidence molecular da taset . PubChem Compound [ 4] , [5], [6] provided pr e - comput ed physicoche mical prope rties for o ver 176 mi llion struc tures, ChEMBL [7] , [8]. [9]. [10] contributed bioac tivity - validated molecules with pharmaceutical relevan ce, and eMolecules [11] confirm ed syntheti c accessibi lity. The i ntersection of these source s yielde d molecules that are sim ultaneousl y documented, bioactive, and commercially avail able. Data integratio n required collisio n - free molecular identificatio n. While In ChIKey (a 27 - character hash of th e full InChI strin g) is commonl y used f or databas e searching , known collisio ns exist fo r distinct stereo isomers . We therefore employed ful l IUPAC InC hI strings [16] t o guarant ee absolut e uniqueness d uring dedupl ication, despite t heir computa tional overhead. A custom byt e - offset i ndexing sys tem was developed t o enable effi cient extra ction from m ulti - terabyte SDF arc hives, re ducing pro cessing ti me from a projec ted 100+ days t o 3.2 hours t hrough algorith mic complexi ty reduction fro m ( × ) to ( + ) . The final da taset comprised 426, 850 mole cules wit h complete data (zero missing v alues). The target variable, logP_target , was ext racted fr om PubChem ’s XLOGP 3 field [17], a widely - use d computa tional logP predict ion metho d that has been empirically validated ag ainst experimental measurements in the original publicatio n. We selected XLOGP3 as our prediction target because it p rovides consistent , pre - comp uted valu es for the ent irety of P ubChem’s compound c ollection, enabling la rge - scale analysis. While experime ntal logP mea surements would be ideal, suc h data are sparse (available for <1 % of molecules in our integration) and exhibit su bstantial inter - la boratory v ariability that wou ld introduce measurement error as a confoundi ng factor. Our results therefore ch aracterize the relations hip between molecula r structure and c omputed XL OGP3 values r ather than direct ex perimental pred iction, a critic al distinctio n for interpret ing the fi ndings. Eight two - dimensional mol ecular desc riptors were computed us ing RDKit [18]: molec ular weight ( MolWt), topologic al polar sur face area (TPSA) [1 9], hydro gen bond donor count (NumHDon ors), hydroge n bond ac ceptor co unt (NumHAcce ptors), rot atable bon d count (Nu mRotatableBon ds), aromatic ring count (NumAromatic Rings), fracti on of sp³ - hybridized carbons (FractionC SP3), and he avy atom count (He avyAtomCou nt). Dataset characterization rev ealed exceptional alignment with drug - like chemical space: 91% of molecules satisfied all four Lipinski criteri a [2] simulta neously (Mol Wt ≤ 500 Da, logP ≤ 5, NumHDon ors ≤ 5, NumHAccept ors ≤ 10). The median com puted logP wa s 2.9 0 with interquartile ran ge (IQR) of 1 .80, indic ating conc entrati on around bal anced lipophilicity su itable for o ral drugs. B. Modeling Strategy and Diagn ostic Frame work Data were partition ed 80/20 (train ing/test) with stratificatio n to preserv e logP distribu tion. Features wer e standardiz ed (mea n = 0, sta ndard devia tion = 1) t o ensure scale - invariant reg ularization pe nalties. We evaluated multiple regression approaches: 1. Regularize d Linear M odels : Ridge regressi on [20], Lasso [21], and ElasticNet [2 2] were implemented vi a s cikit - learn with 5 - fold cross - va lidati on for hyperparame ter optim ization. These method s address multicol linearity t hrough L2 pena lty (Ridge ), L1 penalty with f eature selectio n (L asso), or combined L1/L2 penalties (ElasticNet). 2. Heteroskedasticity Remediati on : We evaluated two representative classical appro aches for addressing heteroskedasticity. Weig hted Least Squares (WLS) was impleme nted by weight ing obser vations inve rsel y p roportional to estima ted residual v ariance. Box - Cox transforma tion [23] wa s applie d to the targe t variable to attempt variance stabil ization. These method s were selected as canonical remediatio n strategies: WLS directly addresses varian ce non - consta ncy throu gh reweighting , while Bo x - Cox represe nts the m ost widely - used power transf ormation app roach for variance stab ilization. Add itional transfor mations (logarithm ic, square roo t) were evaluated p reliminarily and showed c omparabl e or inferi or perform ance to Box - Cox, consisten t with Box - Cox’ s optimality properties for variance no rmalization. 3. Tree - Based Ense mbles : Random Fores t [14] and XGBoost [15] were selected for their native robustn ess to heteroske dastici ty and abili ty to capture non - linear relationships. Hyperp arameters were tuned via randomized search cross - valid ation. Rigorous res idual diagn ostics we re performe d on all models. Heteroskedas ticity was assessed via the Breusch - Pagan test [24], wh ich evaluates whether residual variance correlates with fitted valu es. The nu ll hypothesis a ssumes homoskeda sticity (cons tant var iance); rejection ( < 0. 05 ) indicates heterosk edasticity. Variance quantificatio n across logP ranges employed stratifi ed residual a nalysis. C. Feature Import ance Anal ysis vi a SHAP SHAP (SHapl ey Additi ve exPla nations) [13] was applie d to the Rand om Forest model t o decompose predict ions into feature cont ributions . SHAP val ues provide model - agnostic, game - theoretically g rounded featur e attribution s with three critical pro perties: local accuracy (fait hfully repr esenting individual predicti ons), missi ngness (zero attribut ion for absent features), and con sistency (equal marginal contributi ons rece ive equal a ttributions). For each molecule and f eature, SHAP computes the marginal c ontributi on average d over al l possible fe ature subsets. The resulti ng values are directly i nterpreta ble in logP units and c omparable across fe atures, e nabling ri gorous importance ranking. We computed SH AP values f or the complete test set (85,370 mol ecules ) to ensure robust gl obal interpretation s. III. R ESULTS A. H eteroskedasticity Discovery in Linear Models Fig. 1. Residual vs. Predicted Plot for Ridge Regre ssion Figure 1 pr esents t he residual diagnosti c plot for t he Ridge regression baseline model ( = 0. 608 , RMSE = 0. 944). This metric initially app eared acceptable and exceed ed our threshold cri terion ( > 0.6 ). However, vis ual inspec tion reveals a pronounced funnel pattern: r esiduals are tightly clustered near zero for predicted logP values in the 2 – 4 range but exhibit dramatically increased spread for molecules with predicted l ogP bel ow 0 or abo ve 5. Quantitative h eteroskedas ticity assessment v ia the Breusch - Pagan tes t yielded a tes t statistic of 19, 566.7 ( < 0. 0001 ), dec isively re jecting the null hypothe sis of const ant variance. Stratified v ariance analysis (Table I) revealed that residual va riance i n the lipop hilic regi on (logP > 5) was 4.2 times large r than in the balanced r egion (l ogP 2 – 4), with correspondi ng inc rea ses in RMS E from 0. 57 to 1. 30 logP units. TABLE I. H ETEROSKEDASTICITY Q UANTIFICATION A CROSS LOG P R EGIONS logP Categ ory N (mole - cules) Mean Abs. Error Std. Dev. of Resi - duals Vari - ance Variance Ratio Very Hydrophilic (<0) 1,869 1.567 0.962 0.925 1.61× Hydrophilic (0 – 2) 18,864 0.820 0.529 0.280 0.49× Balanced (2 – 4) 45,523 0.574 0.461 0.212 1.00× (reference) Lipophilic (4 – 5) 13,737 0.706 0.614 0.377 1.78× Very Lipophilic (>5) 5,377 1.299 1.043 1.088 4.13× This heteroskedasticity p attern has severe con sequences for inference. Standard errors o f coefficient estimates are biased (unde restim ated), renderin g hypothesi s tests and confidence intervals invalid [25]. While the model ’s = 0. 608 appears numerically acceptable, th is statistic cannot be trusted for s tatistical infer ence under violate d assumption s. B. Failure of Cla ssical Remediation S trategies Two represe ntative approaches f or addressi n g h eteroskedasticity were sy stematically evaluated. 1) Weighte d Least Squares (WLS) We implemented WLS by modelin g residual variance as a function of fitte d values, the n reweighti ng observa tions inversely to their est imated variance. This ap proach theoretically should stabilize variance an d improve efficiency [25]. Table II presents the r esults: WLS not only failed to eliminate heterosk edasticity (Breusch - Pag an < 0. 0001 ) but produced a hi gher test s tatistic (35,024.2 vs. 19, 566.7) and degraded pr edicti ve performa nce ( decreased from 0.608 to 0.562). 2) Box- Cox Trans formati on Power trans formati on of the target variable via the Box - Cox method [23] showe d margina l bene fits. The o ptimal transformation parameter ( = 0. 42 ) improved no rmalit y (Shapiro - Wilk p - value increased fr om 8.8 × 1 0 − to 4.3 × 10 − ), but heteroskedasticity p ersisted (Breusch - Pagan < 0. 0001 ). Test set was 0.603 — ess entiall y unchange d from the untrans formed base line. These fail ures suggest that het eroskeda sticity i n computed logP predic tion is not e asily cor rectable through st andard variance - stabilization appr oaches. This pattern may r eflect an inherent pr operty of t he predict ion problem, where increas ed structural d iversity of mo lecules at extre me lipophilicit y values nat urally prod uces great er behavior al variabi lity in partitioning calculations [1 7]. TABLE II. C OMPARI SON OF H ETEROSKEDASTICITY R EME DIATION A TTEMPTS Model Variant RMSE Breusch - Pagan Statistic Breusch - Pagan p - value Status Ridge (Baseline) 0.6082 0.944 19,566.7 <0.0001 Hetero- skedastic Weighted LS Ridge 0.5616 0.998 35,024.2 <0.0001 Worse Ridge (Box - Cox) 0.6029 0.950 18,234.5 <0.0001 Hetero- skedastic C. Tree - Based M odels: R obustn ess With out Ass umptions Recognizing the fundamental lim itations o f linear approaches under hetero skedasticity, we evaluated tree - based ensemble m ethods, whi ch make no distri butional as sumptions and are in herentl y robust to variance non - cons tancy [14] , [15]. Figure 2 presents a co mprehensive c omparison of m odel performance. Fig. 2. Model Comparison - R² and R MSE Bar Chart s Random Forest achieved = 0. 764 (R MSE = 0.73 2), while XGBoost mar ginally outper formed at = 0. 765 (RMSE = 0.7 31). Bot h models exc eeded the Ridge basel ine by 25.8% in explained variance. Critic ally, residu al plots fo r tree - based mode ls showed random sca tter wit h no funnel pattern, c onfirming res olution of t he heteros kedastic ity problem. Fig. 3. Error Distribution by logP Category Boxplot Error distr ibution ana lysis (Fi gure 3) re vealed t hat model precision v aries systematicall y with molecular lipophilicit y. The Random Forest model achiev es lowest error for balanced molecules (lo gP 2 – 4: MAE = 0.540 ), with incr eased but manageable error at ext remes (l ogP > 5: MA E = 0.836; logP < 0: MAE = 1.043). This regi onal va riation refl ects the genuine che mical complexit y captured i n XLOGP3 calculations rather than statist ical artifact, an d the tree - bas ed partitioning naturally acco mmodates it. D. The Molecular Weight Parad ox: SHAP Resolut ion Initial exploratory ana lysis revea led a puzzl ing contradict ion. Pear son correla tion betwee n MolWt and computed logP was weak ( = +0. 146 , < 0. 001 ), suggesting minimal predictive value. Th is contradi cted chemical intuition: larger molecules typ ically possess greater hydrophobic surface a rea and sho uld exhibi t higher lipophili city. Furthe rmore, the Ridge model assigne d MolWt a large positive coefficient (+0.9 85), while TPSA received the largest magnit ude coefficient (−1.288), despite TPSA showing onl y moderate bivari ate correl ation ( = − 0. 360 ). SHAP analys is (Figure 4) resolve d this para dox. Mean absolute SH AP values for the Random Fo rest model ranked features by true importance: Fig. 4. SHAP Summary P lot for Random Fo rest Table III presents the q uantitative SHAP impor tance ranking al ongside biva riate cor relati ons. TABLE III. F EATURE I MPORTANCE R ANKINGS - SHAP VS . B IVARIATE C ORRE LATION Rank Feature Mean SHAP Pearson r Sign Match 1 MolWt 0.573 +0.146 ✓ 2 TPSA 0.551 − 0.360 ✓ 3 NumAromaticRings 0.407 +0.428 ✓ 4 FractionCSP3 0.240 − 0.295 ✓ 5 NumHAcceptors 0.128 − 0.263 ✓ 6 NumRotatableBonds 0.135 − 0.050 ✗ 7 HeavyAtomCount 0.063 +0.139 ✓ 8 NumHDonors 0.063 − 0.275 ✓ The discrepa ncy for MolWt (rank 1 in SH AP vs. rank 6 i n bivariate correlation) ex emplifies a classic suppression effect [25]. MolWt cor relates strongly with TPSA ( = 0. 712 ) and Heavy AtomCount ( = 0. 975 ), creating severe multicol linearity (Variance I nflation Factor for MolWt = 281.7). In sim ple bivariate an alysis, MolWt’s positive e ffect on comput ed logP is part ially canc eled by its correlation with TPSA (which has a negative effect on logP). The multi variate R andom Fores t model dis entangle s these confounde d effects: SHAP quant ifies Mol Wt’s unique contributio n after statistica lly contro lling for all other features, revealing its true dominance. C onversely, N umRotat ableBonds ex hibits sign reversa l: bivariate cor relation is weak ly negative ( = − 0. 050 ), while its SHAP impor tance indicates a p ositive contr ibution. This reflects mult ivariate comp lexity where flexibility, af ter controlli ng for mol ecular s ize and pol arity, c ontribute s positivel y to compute d lipophil icity throu gh conform ational entropy effe cts captured in XL OGP3’s algori thm. E. Stratified Modeling for Optimal Precision Given the h eterogeneo us error di stributi on across lipophilicity r anges, we evaluated a stratified mo deling approach: separate specialized mo dels for Lipinski - compliant (“drug - li ke,” 91% of dat a) and Lipi nski - violating (“extreme,” 9% of data) molecules. Th e dr ug - like model achieved = 0. 543 with RMSE = 0.838, while the extreme model achieved = 0. 767 with R MSE = 1.184. While the drug - like model shows lower than the globa l XGBoost, this is artifactual: the drug - like subset has narrower logP varianc e ( = 1. 24 ) than the full datas et ( = 1. 51 ), making scale - dependent and misleading. The practically relevant metric is RMSE: the stratified drug - like model achieves 11% lower pre diction error (0.838 vs. 0.944) specifically for the 91 % of molecules in pharmaceutical space. The extreme model’s hig h (0.767) demonstrates effectiv e capture of c omplex vari ance in out lier mol ecules that a global model servi ng both po pulations c annot mat ch. IV. D ISCUSSION A. H eteroskedasticity as a Property of Compu ted Lipophilicity Prediction The systematic increase in r esidual variance with extreme predicted computed logP valu es reflects characteristics inherent t o both the XLOGP 3 algorithm and the unde rlying chemical phenomena it models. Mo lecules at the extremes of the lipophilicit y spectrum — highly polar zwi tterions (logP < 0) or exte nsively hy drophob ic compoun ds (logP > 5 ) — possess un usual st ructural features (e xtensive h ydrogen bonding net works, la rge aromat ic system s, or atypic al functional groups) that introduce complexi ty into parti tion c oefficient calcu lations [17]. The XLOGP3 m ethod it self employs atom - t ype contributi ons and c orrection factors c alibrated o n molecul es closer to t he drug - like center of chemical space. Predictions for extreme molecules necess arily rely on ex trapolation beyond the algorithm’s training di stribut ion, which ma y contribute to increased varian ce. Experimental logP measuremen ts likewise exhibit h igher reproducibility limits at extremes, suggesti ng that both computat ional predi ctions an d physical measuremen ts face inherent challenges in these re gions. The failure of both WL S and tar get transf ormation suggests th at heteroskedas ticity is not merely an artifact of model misspecification bu t rather a fundamental characteristic of the stru cture - to - computed - lipophilicity m apping. Tree - based ensembles naturall y accommodat e this thr ough recursive pa rtiti oning, where terminal nodes can ha ve independent error varianc es without requi ring global homoskeda sticity as sumptions. B. Multicollinearity and the Impor tance of Conditional Inference The MolWt parad ox demonstrates a cr itical limitation of bivariat e correlation a nalysis i n high - dimensional chemical space. Ei ght molec ular descri ptors capt ure overla pping aspects of molecular structu re: size (MolWt, HeavyAtomCount ), polarity (TP SA, NumHDon ors, NumHAcceptors), a nd geometry (Nu mAromaticR ings, FractionC SP3, NumRota tableBonds ). These features are not orthogonal but form a com plex correl ation networ k where pairwise relationsh ips can mask true multivariate effects. MolWt’s weak bivariate correlatio n ( = 0. 1 46 ) results from its pos itive association with mult iple opposin g influences . Larger m olecules t end to have both incre ased hydrophobic surface (p ositive e ffect on com puted logP) and increased p olar funct ionalit y (negative effect vi a higher TPSA). The net biva riate correlation reflects thes e partially canceli ng effects . Only throu gh condit ional infe rence — SHAP’s margin al contribution calculation — do we recover MolWt’s true pr edictive power in the multivariate co ntext. This finding has practi cal impli cations for mole cular design targe ting comput ed lipophi licity optim ization. Medicinal chemists should priorit ize molecul ar weight increase (mean SHAP impact: +0. 573 logP units per standardiz ed unit cha nge), TPSA re duction (i mpact: −0.551), and aromaticity enhancemen t (impact: +0.407), in that order. Relying on bi variate correlati ons would ha ve dramatic ally underestimated MolWt’s importan ce, potentially misdirecting optimization st rategies. Recent research confirms th at SHAP - derive d importanc e rankings are more reliable than simple correlations fo r correlated features, thoug h limitations exist when features are nearly perfectly collinear ( > 0. 95 ) [26]. Our MolWt – HeavyAtomC ount correl ation of 0.975 approa ches this threshold , yet SHAP successfu lly differentiate s their contributi ons (0.573 vs. 0.234 ), validat ing the me thod’s ut ility even under severe multicollinear ity. C. Contextualization with State - of - the - Art Benchmarks Our Random Forest = 0. 764 represents competitiv e performance in the context of recent l arge - scale benchmarks for computat ional prope rty predict ion. A 2025 stud y comparing 2 5 pretrai ned molec ular embeddi ng models f ound that “nea rly all neural mode ls show negligi ble or no improvement over bas eline EC FP molecula r fingerprint s” with tradi tional ens emble met hods [27], va lidati ng the continued r elevance of descript or - ba sed a pproaches . Graph Neural Netw ork (GNN) m odels for l ipophili city have re ported RMSE values of 0.45 – 0.66 [28], [29], outperfo rming our 0.7 3 RMSE but re quiring e nd - to - end graph archi tectures and substantially lo nger training times. Criticall y, another 2 025 study on T ransform er models f or ADMET predi ction fo und that performa nce plat eaued beyo nd 400,000 – 8 00,000 mole cule pretra ining data sets, and that “baseli ne Random Fore st using p hysicochem ical desc riptors remained t he stronge st overa ll model” [30]. Our d ataset size (426,850 mol ecules ) and performa nce align precisel y with this finding, sug gesting we have reac hed the pract ical performa nce ceiling for 2D d escriptor - based predic tion of c omputed physicoche mical prope rties. The persistent heterosked asticity across all model types — including neural a rchitect ures not re ported here — supports our interpretation that variance non - constancy is an in trinsic characteristic of the com puted logP prediction task rather than a correctable modeling defici ency. Future wo rk incorporat ing 3D conformat ional desc riptors [31] or quantum m echanical features [ 32] may r educe re gional vari ance for experime ntal property pre dicti on, but this r emains a n open res earch question. D. Limita tions and Future Directions Several impo rtant limitatio ns frame the in terpretatio n of our finding s. Most critically, our prediction targ et is PubChem’s XLOGP 3 — a computational estimate of logP rather than experimentally measur ed partition coefficients. XLOGP3 was developed and validat ed using experi mental data, achi eving report ed correlat ion of = 0. 93 with measured va lues in i ts origina l publi cation [1 7], but it remains a model - derived sur rogate. T he heteros kedasti city patte rns we observe characterize the structur e - to - XLOGP3 relations hip and may not directly translate to experimen tal property prediction . Experiment al logP me asurem ents exhibi t their ow n sources of var iability, including pH - de pendent i onizat ion states, inter - laboratory protoc ol differenc es, tempe rature effects, and solvent impur ities. The “tr ue” lipophilicity of a molecule is itself context - dependent ra ther tha n a single fixed value. Our use of XL OGP3 provi des consi stency a nd reproduci bility advant ages cruc ial for large - scale analysis, but introduce s the limitation that o ur models predict how XLOGP3 would estimate a molecule’s lipo philicity r ather than what a shake - flask experiment would measure. The stratified error pattern s we document — higher variance for extreme mo lecules — could reflect eith er (1) genuine p hysical complexity i n parti tion beha vior at ext remes, or (2) extrapol ation errors in XLOGP 3’s atom - contribution algorithm whe n applied o utside its training distrib ution. Distinguis hing betwee n these int erpretations requires validation again st curated exp erimental datasets with confirmed q uality c ontrol, whic h we defer t o future wor k as a high priority. Additional ly, our eva luation of heteroske dastici ty remediation s trategies, while s ystematic, foc used on two canonical approaches: W eighted Least Squares (direct variance re weighting) a nd Box - Cox transformation (optimal power transfo rmation for variance st a bilization) . More sophistic ated methods exist, inc luding Gen eralize d Additive Models, ro bust regress ion wit h adaptive weighting schemes , and alternative transfo rmation families. How ever, the complete failure of both WLS and B ox - Cox — which represent the most widely - taught remed iation strategies in applied statistics — provides strong e vidence t hat heteros kedasti city is not trivia lly correct able in thi s domain. T he burden of proof shifts to t hose advocat ing line ar models to demonst rate tha t alternative re mediati on methods can ac hieve both homoskeda sticity (B reusch - Pagan > 0. 05 ) and com petitive predictive performan ce. Future work s hould pu rsue expe rimental validati on using high - quali ty measure d logP datas ets such as t he SAMPL challenge series or ChEMBL’s curated experimental measurement s. Such val idati on would address whether heteroskedasticity per sists when predicting exp erimental values, whether tree - based models maintain their perfo rmance advantage, a nd whethe r the MolWt importance ranking generaliz es beyond XLOGP3 pre dicti ons. These stu dies would clarify the extent to which our findin gs reflect artif acts of comput ational pre diction v ersus fundam ental pr operties of experimenta l lipophilicity det ermination . V. C ONCLUSION T his study demo nstrates three c ritical findin gs for computational physicochem ical prope rty predi ction in dru g discovery c ontexts. First, linear re gression mo dels for predicting computed lipoph ilicity (XLOGP3) s ystematically violate hom oskedast icity ass umptions, with re sidual vari ance increasing 4.2 - fold in lipo philic regions (logP > 5) relative to balanced dr ug - like molecules (log P 2 – 4). Thi s heterosked asticity invalida tes the sta tistical rel iability of confidence interval s and hypot hesis t ests, despi te numeric ally acceptable values. Second, representative classica l remediation s trategies — Weighted Least Squar es and Box - Cox transfor mation — failed to reso lve this violatio n, suggesting it r eflects inheren t properties o f the prediction problem rather than correctab le model misspecif ication . Third, tree - based ensem ble met hods (Random Forest = 0. 764 , XGBoost = 0. 765 ) natur ally accommodate heteroskedas ticit y through rec ursive par titioni ng and deli ver both superi or predict ive performa nce and s tatisti cally rob ust inferences. SHAP analys is resol ved a mul ticolline arity pa radox whe re molecular weigh t showed neglig ible bivariate correlation w ith computed l ogP ( = 0. 146 ) yet emerged as the si ngle most important p redict or (mean |SHAP | = 0.57 3). This a pparent contradictio n reflects a sup pression effe ct: MolWt’s correlation with TPSA ( = 0. 712 ) masks its true predictive power in sim ple correl ations, which is re vealed onl y through conditional inference in multivar iate models. The corrected importance ranking (Mol Wt > TPSA > NumAromat icRings) provides ac tionable gui dance for o ptimizati on strategi es targeting co mputed lipophilici ty. For practit ioners worki ng with comput ational physicoche mical prope rties, our findings s uggest t ree - based ensemble m ethods of fer subst antial advantages ove r ordina ry least squa res and st andard re gularized l inear mode ls whe n heteroskedasticity is pr esent. We recommend a dopting Random Fores t or XGBo ost as pr imary mo deling appr oaches for comput ed property predict ion, using S HAP analysi s to interpret feature impo rtance in multivariate m odels rather than relying on bivariate correlatio ns which can severely misrep resen t true effects under multicollinearity , and considerin g strati fied model ing strat egies whe n precisi on requirements vary across ch emical subspaces. The critical limitati on of our study is the us e of comput ed XLOGP3 values rather than experimental measur ements as the prediction target; futur e validation again st high - quality exp erimental datasets remains essential to confirm whether these p atterns generaliz e to physic al propert y deter mination. T hese fin dings provide a framework f or rigor ous stati stical an alysis of QSAR models whi le highlig hting t he need for e xperiment al validation in tran slating compu tational insights to laboratory practice. A CKNOWLEDGMEN T The authors grat efully ackno wledge the Nationa l Center for Biote chnology I nformation (NCBI) f or provi ding free access to the PubChem database infr astructure, the European Molecular B iology La boratory’s E uropean Bi oinformati cs Institute (EM BL - EBI) for m aint aining the ChE MBL resourc e, and eMolecules for database av ailability. R EFERENCES [1] J. A. Arnott and S. L. Plan ey, “The influence of lipo philicity in drug discovery and des ign,” Expert Opi n. Drug Discov., vol. 7, no. 10, pp. 863 – 875, 2012, do i: 10.1517/174604 41.2012.714363. [2] C. A. Lipinski, F. Lombardo, B. W. Dominy, and P. J. Fe eney, “Experimental and compu tational approaches to esti mate solubility and permeability in drug dis covery and development settings,” Adv. Drug Deliv. Rev. , vol. 23, nos. 1 – 3, pp. 3 – 25, 1997, doi: 10. 1 016/S0169 - 409X(96)00423 - 1. [3] Y.- T. Liu et al., “ Applications of artificial in telligence in biotech d rug discovery and pr oduct devel opment,” Me dComm (2020), vol. 6, no. 8, art. no. e70317, 2025, doi: 10.1002/ mco2.70317. [4] S. Kim et al., “PubChem in 2021 : new data content and improved web interfaces,” Nucleic Acids Res. , vol. 49, no. D1, pp . D1388 – D1395, 2021, doi: 10.109 3/nar/gkaa 971. [5] S. Kim et al., “PubCh em 2023 update,” Nucleic A cids Res., vol. 51, no. D1, pp. D1373 – D1380, 2023, doi: 10. 1093/nar/gkac 956. [6] S. Kim et al., “PubCh em 2025 update,” Nucleic A cids Res., vol. 53, no. D1, pp. D1516 – D1525, 2025, doi: 10. 1093/nar/gkae 1059. [7] A. P. Bento et al. , “The ChEMBL bioactivity database: an up date,” Nucleic Ac ids Res., vol. 42, no. D1, pp. D108 3 – D1090, 2014, doi: 10.1093/nar/ gkt1031. [8] A. Gaulton et al., “ChEMBL: a lar ge - scale bioactivity database for drug discovery, ” Nucleic Acids Res. , vol. 40, no. D1, pp. D1100 – D1107, 2012, doi: 10. 1093/nar/gkr 777. [9] A. Gaulton et al., “The ChEMBL da tabase in 2017,” Nu cleic Acids Res., vol. 45, no. D1, pp. D 945 – D954, 2017, doi : 10.1093/ nar/ gkw1074. [10] B. Zdrazil et al., “ The ChEMBL database in 20 23: a drug discovery platform spanning multiple bioactivity data types and time periods,” Nucleic Ac ids Res., vol. 52, no. D1, pp. D118 0 – D1192, 2024, doi: 10.1093/nar/ gkad1004. [11] eMolecules, “eMolecu les.” [Online]. Availab le: https://www.emolecules.com . [Acces sed: Oct. 28, 2025]. [12] A. J. Willi ams and A. M. Richard, “Three p illars for ensuring public access and integrity of chemical datab ases powering cheminformatics,” J. C heminform., vol. 17, art. no. 40, 2025, doi : 10.1186/s13321 - 025 - 00983 - 9. [13] S. M. Lundberg and S. - I. Lee, “A unified approach to interpreting model predictions,” in Adv. Neural I nf. Process. Syst., vol. 30 , 2017, pp. 4765 – 4774. [14] L. Breiman, “Random f orests,” Mach. Learn. , vol. 45, no. 1, pp. 5 – 32, 2001, doi: 10.102 3/A:10109334 04324. [15] T. Chen and C. Guestrin, “XGBoost: A scalab le tree boosting s ystem,” in Proc. 22nd ACM SIGKD D Int. Conf. Knowl. Dis cov. Data Min. (KDD), San Francisco , CA, USA, 2016, pp . 785 – 794, doi: 10.1145/29396 72.2939785. [16] S. R. Heller, A. McNaught, I. Pletne v, S. Stein, and D. Tchek hovskoi, “InChI, the IUPAC internation al chemical identifier,” J. Cheminfo rm., vol. 7, art. no. 23, 2015, doi: 10.118 6/s13321 - 015 - 0 068 - 4. [17] T. Cheng et al., “Com putation of oc tanol - water partition coefficients by guiding an ad ditive mode l with knowledge, ” J. Chem. Inf . Model., vol. 47, no. 6, pp. 2140 – 2148, 2007, doi: 10.1021/ci70 0257y. [18] RDKit, “RDKit: O pen - source cheminformatics.” [Onlin e]. Available: https://www.rdkit.org . [Access ed: Oct. 28, 2025]. [19] P. Ertl, B . Rohde, and P. Selzer, “Fast calculation of molecular po lar surface area as a sum of fragmen t - based contributions and its application to the predictio n of drug transport p roperties,” J. Med . Chem., vol. 43, no. 20, pp. 3714 – 371 7, 2000, doi: 10. 1 021/jm00094 2e. [20] A. E. Hoerl and R. W. Kennard, “Ridge regression: Bias ed estimation for nonorthogona l problem s,” Technomet rics, vol. 12, no. 1, pp. 55 – 67, 1970, doi: 10. 1080/0040170 6.1970.1048863 4. [21] R. Tibshirani, “Re gression shrinkage and selectio n via the lasso,” J. R. Stat. Soc. S er. B (Methodol.), vol. 58, no. 1, pp. 267 – 288, 1996, doi: 10.1111/j.251 7 - 6161.1996. tb02080.x. [22] H. Zou and T . Hastie, “Regularizati on and variable selection v ia the elastic net,” J. R. Stat. Soc. Ser. B (Stat. Methodo l.), vol. 67, no. 2, pp. 301 – 320, 2005, do i: 10.1111/j.1467 - 9868.2005.0 0503.x. [23] G. E. P. Box and D. R. Co x, “An analy sis of transformations,” J. R . Stat. Soc. S er. B (Methodol.), vol. 26, no. 2, pp. 211 – 252, 1964, doi: 10.1111/j.251 7 - 6161.1964. tb00553.x. [24] T. S. Breusch an d A. R. Pagan, “A simple test for heteroscedasticity and random coef ficient var iation,” Econom etrica, vol . 47, no. 5, pp. 1287 – 1294, 1979, doi : 10.2307/1911 963. [25] D. A. Belsley, E. Kuh, and R. E. Wels ch, Regression Diagnostics: Identifying Influential Data and So urces of Collinearity. New York, NY, USA: Wiley, 1980. [26] M. Leiner an d P. Filzmoser, “Scrutin izing XAI using linear groun d - truth data with s uppressor vari ables,” Mach. Lear n., vol. 111, pp. 1903 – 1923, 2022, doi : 10.1007/s109 94 - 022 - 06167 - y. [27] M. Praski, J . Adamczyk, and W. Czech, “Benchmark ing pretrained molecular embedding models fo r molecular representation learning,” arXiv:2508.061 99, Aug. 2025. [ Online]. A vailable: abs/ 2508.06199 . [28] J. Wieder et al., “Improved lipophilicity and aq ueous solubility prediction with composite grap h neural networks,” Mo lecules, vol. 26, no. 20, art. no. 6185, 2021, doi: 10.3 390/molec ules26206185. [29] E. B. Lens elink and P. F. W. Stouten, “Multitask ma chine learning models for predicting lipophilicity (logP) in the SAMP L7 challenge,” J. Comput. - Aide d Mol. Des., vol. 35, pp. 901 – 909, 2021, doi: 10.1007/s10822 - 021 - 00405 - 6. [30] A. Sultan, M. Raus ch - Dupont, S. Khan, O. Kalinina, A. Volk amer, and D. Klakow, “Transformers for molec ular property prediction: Do main adaptation efficiently improves performance,” arXiv:2503.0 3360, Mar. 2025. [Online]. Available: https://arxiv.org/abs/ 2503.03360 . [31] X. Zeng et al., “A new simple and efficient molecu lar descriptor for the fast and accurate prediction o f log P,” J. Mater. Inf., vol. 5, art. no . 4, 2025, doi: 10.205 17/jmi. 2024.61. [32] A. Hinos troza Caldas, A. Kokorin , A. Tkatchenko, and L. Medrano Sandonas, “Assessing th e performance of quantu m -mechanical descriptors in physicochemical and biological property prediction,” ChemRxiv, 2025, doi : 10.26434/che mrxiv - 2025 - hj 4dc.
Original Paper
Loading high-quality paper...
Comments & Academic Discussion
Loading comments...
Leave a Comment