Concorde: Fast and Accurate CPU Performance Modeling with Compositional Analytical-ML Fusion
Cycle-level simulators such as gem5 are widely used in microarchitecture design, but they are prohibitively slow for large-scale design space explorations. We present Concorde, a new methodology for learning fast and accurate performance models of mi…
Authors: Arash Nasr-Esfahany, Mohammad Alizadeh, Victor Lee
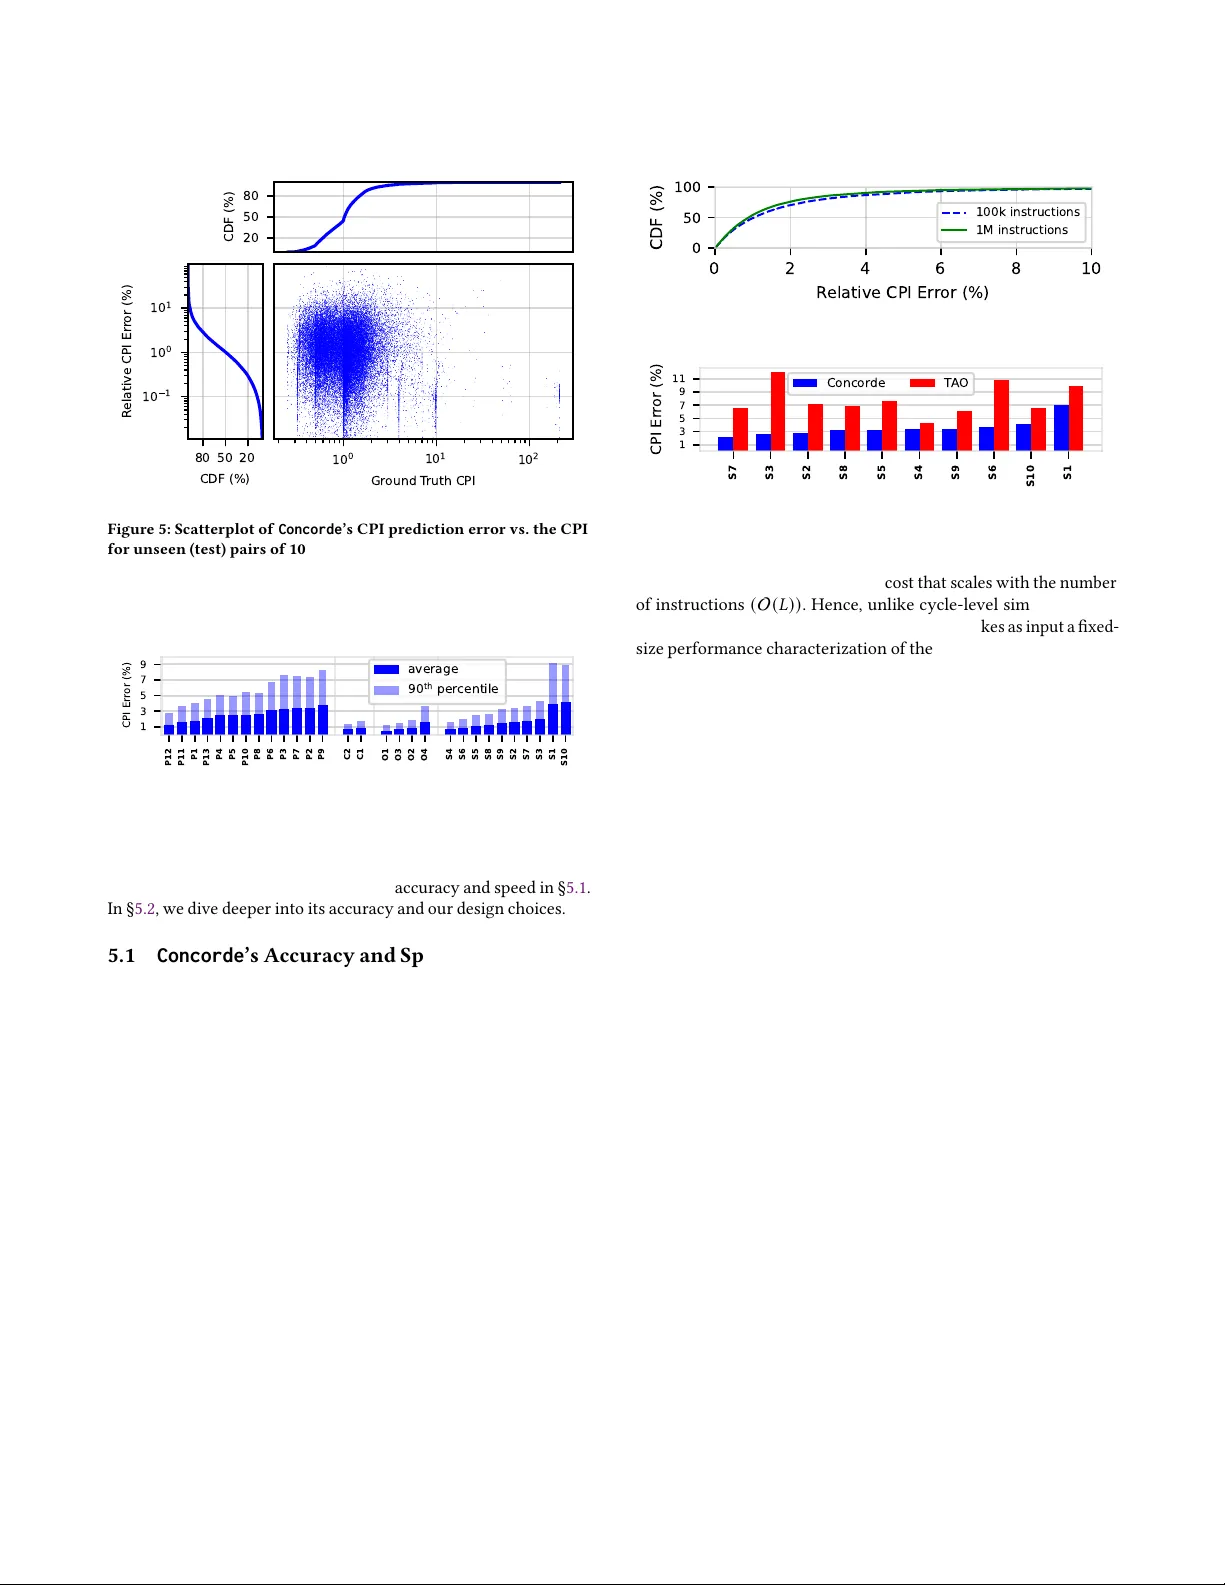
Concorde: Fast and Accurate CP U Performance Modeling with Comp ositional Analytical-ML Fusion Arash Nasr-Esfahany ∗ , Mohammad Alizadeh ∗ , Victor Lee , Hanna Alam , Brett W . Coon David Culler , Vidushi Dadu , Martin Dixon , Henry M. Levy , Santosh Pandey ∗ Parthasarathy Ranganathan , Amir Y azdanbakhsh Google , MI T , University of W ashington , Rutgers University , Google DeepMind { arashne , alizadeh }@mit.edu , santosh.pandey @rutgers.edu , { vwlee , hannaalam , bwc , dculler , vidushid , mgdixon , hanklevy , parthas , ayazdan }@google.com Abstract Cycle-level simulators such as gem5 are widely used in microarchi- tecture design, but they are prohibitively slow for large-scale design space explorations. W e present Concorde , a new methodology for learning fast and accurate performance models of microarchitectures. Unlike existing simulators and learning approaches that emulate each instruction, Concorde predicts the behavior of a program based on compact performance distributions that capture the impact of dif- ferent microarchitectural comp onents. It derives these performance distributions using simple analytical models that estimate bounds on performance induced by each microarchitectural comp onent, pro- viding a simple yet rich representation of a program’s performance characteristics across a large space of microarchitectural parameters. Experiments show that Concorde is more than ve orders of mag- nitude faster than a reference cycle-level simulator , with about 2% average Cycles-Per-Instruction (CPI) prediction error across a range of SPEC, open-source, and proprietary benchmarks. This enables rapid design-space exploration and performance sensitivity analyses that ar e curr ently infeasible , e .g., in about an hour , w e conducted a rst-of-its-kind ne-grained performance attribution to dierent microarchitectural components across a diverse set of programs, requiring nearly 150 million CPI evaluations. 1 Intr oduction Microarchitecture simulators are a key to ol in the computer archi- tect’s arsenal [ 4 , 6 , 11 , 14 , 19 , 28 , 72 , 75 , 82 ]. From SimpleScalar [ 11 ] to gem5 [ 14 , 59 ], simulators have enabled architects to explore new de- signs and optimize existing ones without the prohibitive costs of fab- rication. CP U simulation, in particular , has become increasingly im- portant as hyperscale companies like Go ogle (Axion) [ 85 ], Amazon (Graviton) [ 7 ], Microsoft (Cobalt) [ 62 ] increasingly invest in devel- oping custom CP U architectures tailored to their specic workloads. The landscape of CP U performance modeling is characterize d by a critical tension between model accuracy and sp eed. This trade-o manifests in the various levels of abstraction employed by dierent performance models [ 14 , 32 , 87 ]. At one end of the sp ectrum lie analytical models [ 2 , 87 ], which pro vide simplied mathematical representations of microarchitectural components and their inter- actions. Although they are fast, analytical models often lack the detailed mo deling necessar y to capture the dynamics of modern pro- cessors accurately . At the other end of the spe ctrum reside cycle-level simulators like gem5 [ 14 ], which can provide high-delity results by meticulously modeling every cycle of execution. Howev er , this level ∗ W ork done at Google. of detail comes at a steep computational cost, becoming prohibitively slow for large-scale design space exploration [ 32 , 47 , 55 ], programs with billions of instructions, or detailed sensitivity studies. Recognizing the limitations of conventional methods, there has been growing interest in using machine learning (ML) to expe dite CP U simulation [ 54 , 55 , 61 , 71 ]. Rather than explicitly model ev- ery cycle and microarchitectural interaction, these methods learn an approximate model of the architecture ’s performance from a large corpus of data. A typical approach is to pose the problem as learning a function mapping a sequence of instructions to the tar- get performance metrics. For example, recent work [ 50 , 54 , 55 , 71 ] train sequence models (e.g., LSTMs [ 35 ] and Transformers [ 88 ]) on ground-truth data from a cycle-level simulator to pr edict metrics such as the program’s Cycles Per Instruction (CPI). These methods show promise in providing fast performance esti- mates with reasonable accuracy . However , relying on black-b ox ML models operating on instruction sequences has several limitations. First, the computational cost of these methods scales pr oportionally with the length of the instruction sequence, i.e. O ( 𝐿 ) where 𝐿 is the instruction sequence length. The O ( 𝐿 ) complexity limits the potential speedup of these methods, e.g., to less than 10 × faster than cycle-level simulation with a single GPU [ 55 , 71 ]. This speedup is mainly due to replacing the irregular computations of cycle-level sim- ulation with accelerator-friendly neural network calculations [ 71 ]. By contrast, analytical models can be several orders of magnitude faster than cycle-level simulation (and current ML approaches) be- cause they fundamentally operate at a higher level of abstraction, i.e., mathematical expressions relating key statistics (e.g., instruction mix, cache behavior , branch misprediction rate, etc.) to performance. Second, existing ML approaches must learn all the dynamics im- pacting performance from raw instruction-le vel training data. In many cases, this learning task is unnecessarily complex since it does not exploit the CP U performance modeling problem structure. For example, T A O’s Transformer model [ 71 ] must learn the perfor- mance impact of register dependencies from per-instruction register information, even though there exist higher-level abstractions (e .g., instruction dep endency graphs [ 61 ]) that concisely represent depen- dency behavior (§ 3.2 ). By ignoring the problem structure, blackbox methods require a signicant amount of training data to learn. For ex- ample, T A O trains on a dataset of 180 million instructions across four benchmarks and two microarchitectures [ 71 ], with further training required for each new microarchitecture. T o address these challenges, we propose a novel approach to per- formance modeling—compositional analytical-ML fusion—where we de compose the task into multiple lightweight models that work 1 A. Nasr-Esfahany et al. together to progressively achieve high delity with low computa- tional complexity . W e demonstrate this approach in Concorde , a CP U performance mo del that uses simple analytical mo dels capturing the rst-order eects of individual microarchitectural components, cou- pled with an ML model that captures complex higher-order eects (e.g., interactions of multiple microarchitectural components). Concorde achieves constant-time O ( 1 ) inference complexity , in- dependent of the length of the instruction stream, while maintaining high accuracy across diverse workloads and micr oarchitectures. Un- like existing ML methods that op erate on instruction se quences, Concorde predicts performance based on a compact set of perfor- mance distributions . It trains a lightweight ML model — a shallow multi-layer p erceptron (MLP) — to map these performance distribu- tions to the target p erformance metric. W e focus on modeling CPI in this paper as it directly reects program p erformance, though in prin- ciple our techniques could be extended to other metrics. Concorde ’s ML model generalizes across a large space of designs, spe cied via a set of parameters associated with dierent microarchitectural com- ponents (§ 3 ). Given the performance distributions for a program region (e.g., 1M instructions), predicting its CPI on any target mi- croarchitecture is extremely fast; it requires only a single neural network evaluation, taking less than a millisecond. Concorde derives a pr ogram region’s performance distributions through a tw o-step process: trace analysis and analytical modeling. Trace analysis uses simple in-order cache and branch predictor sim- ulators to extract information such as instruction dependencies, ap- proximate execution latencies, and branch misprediction rate. Next, analytical models estimate the b ottleneck throughput impose d by each CP U component (e.g., fetch buer , load queue, etc.) in isolation, assuming other CP U comp onents have innite capacity . For each CP U component, Concorde uses the distribution of its throughput bound over windows of a few hundred instructions as its perfor- mance feature. For each memory conguration, Concorde executes the per-component analytical models independently to pr ecompute the set of performance distributions for all parameter values. The analytical models are lightweight, completing in 10s of milliseconds for a million instructions. Precomputing the performance distribu- tions is a one-time cost, enabling nearly instantaneous performance predictions across the entir e parameter space. Concorde ’s unique division of labor between analytical and ML modeling simplies both the analytical and ML models. Since the an- alytical models are not directly used to predict performance, they are relatively easy to construct. Their main goal is to pr ovide a rst-cut estimate of the p erformance bounds associated with each microar- chitectural component (akin to r ooine analysis [ 18 ]), without the burden of quantifying the combined eect of multiple interacting components. The ML model, on the other hand, starts with features that correlate strongly with a program’s p erformance, rather than raw instruction sequences. Its task is to capture the higher-order eects ignored by the analytical models, such as the impact of multi- ple interacting bottlenecks. The net result is a method that is as fast as analytical models while achieving high accuracy . Concorde enables large-scale analyses that are deemed imprac- tical with conventional methods. A s one use case, we consider the problem of ne-grained performance attribution to dierent mi- croarchitectural components: What is the relative contribution of dierent microarchitectural components to the predicte d performance of a target architecture? W e present a no vel technique for answering this question using only a performance model relating microarchitec- tural parameters to performance. Our technique applies the concept of Shapley value [ 78 ] from cooperative game theor y to provide a fair and rigorous attribution of performance to individual components. The method improves up on standard parameter ablation studies and may be of interest in other use cases beyond Concorde . W e present a concrete realization of Concorde , designed to ap- proximate the behavior of a proprietary gem-5 based cycle-level trace-driven CP U simulator . W e train Concorde on a dataset of 1 mil- lion random program regions and architectures, to predict the impact of 20 parameters spanning frontend, backend, and memor y (total- ing 2 . 2 × 10 23 parameter combinations). The program regions are sampled from a diverse set of SPEC2017 [ 40 ], open-source, and pr o- prietary benchmarks. The key ndings of our evaluation are: • Concorde ’s average CPI prediction error is within 2% of the ground- truth cycle-level simulator for unseen (random) program regions and architectures, with only 2.5% of samples exceeding a 10% pr e- diction error . Ignoring the one-time cost of analytical modeling, Concorde is ve orders of magnitude faster for predicting the performance of 1M-instruction regions. For long 1B instruction programs, Concorde accurately estimates performance (average error ∼ 3.2%) based on randomly-sampled program regions, seven- orders of magnitude faster than cycle-level simulation. • In predicting CPI for a realistic core model (base d on ARM N1 [ 73 ]), Concorde is more accurate than T AO [ 71 ], the state-of-the-art sequence-based ML performance model, traine d sp ecically for the same core conguration. It achieves an av erage prediction error of 3 . 5% , compared to 7 . 8% for T AO . • For a 1M-instruction r egion, precomputing all the performance distributions takes the CP U time e quivalent of 7 to 107 cycle-level simulations, depending on the granularity of parameter sweeps. These performance features enable rapid performance predictions for 1 . 8 × 10 18 to 2 . 2 × 10 23 parameter combinations. • Concorde enables a rst of its kind, large-scale, ne-grained per- formance attribution to components of a core based on ARM N1, across a diverse set of programs using our Shaple y value tech- nique. This large-scale analyses requires more than 143 M CPI evaluations, but takes only about one hour with Concorde . 2 Motivation and Insights Consider a cycle-level simulator like gem5 as implementing a func- tion that maps an input pr ogram and microarchitecture congura- tion to a performance metric such as CPI. Formally , 𝑦 = 𝑓 ( ® x , ® p ) , where ® x ≜ ( 𝑥 1 ,. . .,𝑥 𝐿 ) denotes the input program comprising 𝐿 instructions, ® p ≜ ( 𝑝 1 ,. . .,𝑝 𝑑 ) the parameters specifying the microarchitecture, and 𝑦 the CPI achieved by program ® x on microarchitecture ® p . Our goal is to learn a fast and accurate approximation of the function 𝑓 from training examples derived fr om cycle-level simulations. Supervise d learning provides the de facto framework for learning a function from input-output examples. However , a critical design decision involves how to best r epresent the learning problem, in- cluding the selection of representative features and an appropriate model architecture. Several recent eorts [ 54 , 55 , 71 ] represent the function 𝑓 using sequence-based models, such as LSTMs [ 35 ] and 2 Concorde: Fast and Accurate CP U Performance Mo deling with Compositional Analytical-ML Fusion Instruction ID 1 2 3 IPC A (Timeseries) Instruction ID B (Timeseries) ROB L oad queue Maximum icache fills Decode width Gr ound truth IPC 1 2 3 IPC 0 100 CDF (%) A (Distributions) 1 2 3 IPC B (Distributions) Figure 1: Per-resource analytical modeling produces a rich perfor- mance characterization of a program. Transformers [ 88 ], operating on raw or minimally processed in- struction sequences. As discussed in § 1 , these blackbox sequence models inherently limit scalability and increase the complexity of the learning task. Our key insight is a nov el decomposition of the function 𝑓 , comprising of two key stages. First, an analytical stage uses simple per-component models to extract compact performance features capturing the overall performance characteristics of the program. Second, a lightweight ML mo del predicts the target CPI metric eciently based on these performance features. Deriving compact performance features. The foundation of our analytical stage is to characterize the bottleneck throughput im- posed by each CP U resour ce 1 individually , under the simplifying assumption that all other CP U components op erate with unlimited capacity . For instance, to analyze the impact of the reorder buer (ROB) size, we evaluate the pr ogram’s throughput in a hypothetical system constrained only by the ROB size and instruction dependen- cies (i.e., a perfe ct frontend with no backend resource bottlene cks other than the limited ROB size). Focusing on one r esource at a time enables relatively straightfor ward analyses (see § 3.2 for examples). Formally , given a program ® x , we compute the bottleneck throughput 𝑧 𝑖 = 𝐴 𝑖 ( ® x ,𝑝 𝑖 ) for each CP U component, where 𝐴 𝑖 ( · , ·) is the analyt- ical model for the 𝑖 th component, parameterized by 𝑝 𝑖 . T o capture program phase changes, we calculate this throughput over small win- dows of consecutive instructions (e.g., a few hundred instructions). Figure 1 shows an illustrativ e example of these throughput calcu- lations for four microarchitectural parameters (ROB size, Load queue size, maximum I-cache lls, and de code width) on two programs. The top plots display the timeseries of the throughput b ounds derived by our analytical model for each parameter (details in § 3.2.1 ) across 400-instruction windows, and the ground truth Instructions per Cycle (IPC) for the same windows. For both pr ograms, the through- put bound timeseries explain the IPC trends well. For example, for program A, initially the IPC (green line) aligns with the maximum I-cache lls bound (cyan segments); subsequently , the IPC is around the smaller of the ROB, decode width, and maximum I-cache lls 1 For simplicity, this section focuses on CPU parameters. Concorde handles a few parameters such as cache sizes dierently (§ 3 ). Program ( 𝐱 ) Architecture Specific. ( 𝐩 ) CPI ML Model 𝘨 ( 𝐳 , 𝐩 ) Performance Features Analytical Models 𝘈 1 ( 𝐱 , p 1 ) d 𝑧 ′ 𝘈 d ( 𝐱 , 𝚙 d ) 1 𝑧 ′ Figure 2: Concorde ’s comp ositional analytical-ML structure bounds in most instruction windows. Similarly , for program B, the bounds for ROB and Load queue overlap with the IPC. The maximum I-cache lls and decode width throughput bounds are much higher for program B (not shown in the gure). Although the minimum of the per resource throughput b ounds provides an estimate of IPC, it is not accurate. As shown in Figur e 1 , despite their overall correlation, the IPC frequently deviates from the exact minimum bound. This is not surprising. The analytical models make simplifying approximations, including ignoring interactions between multiple resource bottlenecks. In reality , r esource bottle- necks can overlap, resulting in a net IPC lower than any individual bound. Nonetheless, the per-resource analysis provides informative features for predicting performance, capturing key rst-order eects while leaving it to the ML model to capture higher-order ee cts. The last step of deriving compact p erformance features (inde- pendent of program length 𝐿 ) is converting throughput timeseries into distributions , as depicted in the bottom plots in Figure 1 . W e encode these distributions using a xed set of percentiles from their Cumulative Distribution Functions (CDF). Converting timeseries to CDFs is inherently lossy (e.g., joint behaviors acr oss timeseries are not retained). However , as Figure 1 shows, the CDFs are still informative for predicting IPC. In particular , the IPC (vertical dashed line) aligns well with the lower p ercentiles of the smaller throughput bounds (e .g., Maximum I-cache lls and ROB for program A) — an im- plication of the IPC’s proximity to the minimum throughput bound in most instruction windows. As our e xperimental results will show , a simple ML model can learn to accurately map these CDFs to IPC. Concorde ’s compositional analytical-ML structure. Figure 2 illustrates the two-stage structure of Concorde . T o predict the per- formance of pr ogram ® x on a giv en microarchitecture ® p , Concorde rst uses p er-component analytical mo dels to derive performance features ® z ≜ ( 𝑧 ′ 1 , . .. , 𝑧 ′ 𝑑 ) , where 𝑧 ′ 𝑖 represents the distribution of the throughput b ound for parameter 𝑝 𝑖 . These features, along with the list of parameters, are then passe d to a lightweight ML model ˆ 𝑦 = 𝑔 ( ® z , ® p ) to pr edict the CPI. An important consequence of modeling each component (param- eter) separately in the analytical stage is the ability to pr ecompute the performance features for a program ( ® x ) across the entire mi- croarchitectural design space. In particular , our approach eliminates the need to evaluate the Cartesian product of all parameters, which would require exponential time and space. Instead, Concorde sweeps the range of each CP U parameter (once or per memory congura- tion depending on the parameter), precomputing the feature set { 𝐴 𝑖 ( ® x ,𝑝 𝑖 ) |∀ 𝑝 𝑖 , ∀ 𝑖 } . T o predict the performance of ® x on a specic mi- croarchitecture ® p , Concorde retrieves the p ertinent precomputed fea- tures corresponding to 𝑝 1 ,. . .,𝑝 𝑑 and evaluates the ML model 𝑔 (® z , ® p ) . 3 A. Nasr-Esfahany et al. Of fline ① T race Analysis DynamoRIO T race Concorde T race ② Analytical Models Performance Distributions ③ Selection ③ ML Model CPI Architecture Specification Figure 3: Design overview 3 Concorde Design W e present a concrete realization of Concorde designed to approx- imate a proprietar y gem5-base d cycle-level trace-driven simulator . Inevitably , some aspects of Concorde (esp., analytical models) de- pend on the spe cics of the reference architecture. W e detail the design for our in-house cycle-level simulator while emphasizing concepts that we b elieve apply broadly to CP U modeling. Our cycle-level simulator processes program traces captured by DynamoRIO [ 17 ] and features a generic parameterized Out-of-Order (OoO) core model similar to gem5’s O3 CP U model [ 57 ]. The archi- tecture consists of fetch, deco de, and rename stages in the frontend; issue, execute, and commit stages in the backend; and uses Ruby [ 58 ] for modeling the memor y system. 2 W e focus on modeling the im- pact of 20 key design parameters on CPI, as summarized in T able 1 , though our approach can be extended to other design parameters. Figure 3 outlines Concorde ’s key design elements: 1 Trace anal- ysis which augments the input DynamoRIO [ 17 ] trace with informa- tion needed for Concorde (§ 3.1 ); 2 Per-resource analytical mo d- els which transform the processed trace into performance distribu- tions (§ 3.2 ); and 3 Lightweight ML model which predicts the CPI based on performance distributions (§ 3.3 ). The rst two stages per- form a one-time, oine computation for a given DynamoRIO trace. At simulation time , Concorde supplies the pr ecomputed perfor- mance distributions and target microarchitecture’s design parame- ters to the ML model, enabling nearly instantane ous CPI predictions. 3.1 T race Analysis The raw input trace to Concorde is captured using DynamoRIO’s drmemtrace client [ 16 ], which provides detailed instruction and data access information for the target program. This trace is then processed into a Concorde Trace , which includes per-instruction information needed for our analytical models. W e categorize this information into microarchitecture indep endent and microarchitec- ture dep endent features, as detailed below . Microarchitecture independent. This categor y includes data de- rived directly from the DynamoRIO trace: (i) Instruction dependencies , including b oth register and memory dependencies, (ii) Program coun- ters (PC) for all instructions, (iii) Data cache lines for Load instructions, 2 W e use a xed LLC size of 4MB, and a cache replacement policy similar to gem5’s TreePLURP , a pseudo-Least Recently Used (PLRU) replacement policy . Our cache allocation policy is the same as gem5’s standar d allocation policy , always allocating lines on reads and writebacks. A cache line is not allo cated on sequential access (for L2 and LLC) or a unique read for LLC. W e use writeback for all L1i, L1d, L2, and LLC. W e use memor y BW of 37GB/s with latency of 90ns, and do not mo del memor y channels. T able 1: Large space of design parameters Parameter V alue Range ARM N1 value ROB size 1 , 2 , 3 ,.. ., 1024 128 Commit width 1 , 2 , 3 ,.. ., 12 8 Load queue size 1 , 2 , 3 ,.. ., 256 12 Store queue size 1 , 2 , 3 ,.. ., 256 18 ALU issue width 1 , 2 , 3 ,.. ., 8 3 Floating-point issue width 1 , 2 , 3 ,.. ., 8 2 Load-store issue width 1 , 2 , 3 ,.. ., 8 2 Number of load-store pipes 1 , 2 , 3 ,. .., 8 2 Number of load pipes 0 , 1 , 2 ,.. ., 8 0 Fetch width 1 , 2 , 3 ,.. ., 12 4 Decode width 1 , 2 , 3 ,.. ., 12 4 Rename width 1 , 2 , 3 ,.. ., 12 4 Number of fetch buers 1 , 2 , 3 ,.. ., 8 1 Maximum I-cache lls 1 , 2 , 3 ,.. ., 32 8 Branch predictor Simple, T AGE T AGE Percent misprediction for Simple BP 0 , 1 , 2 ,.. ., 100 − L1d cache size (kB) 16 , 32 , 64 , 128 , 256 64 L1i cache size (kB) 16 , 32 , 64 , 128 , 256 64 L2 cache size (kB) 512 , 1024 , 2048 , 4096 1024 L1d stride prefetcher degree 0 (OFF) , 4 (ON) 0 (OFF) (iv) Instruction cache lines for all instructions, (v ) Instruction Synchro- nization Barriers (ISB) , and ( vi) Branch types (Direct unconditional, Direct conditional, and Indirect branches) for branch instructions. Microarchitecture dependent. (i) Execution latency: Our analyt- ical models require an estimate of the execution latency for each instruction. For non-memory instructions, we estimate the latency based on the opco de and corresponding execution unit (e .g., 3 cy- cles for integer ALU operations). Store instructions also incur a xed, known latency , as the architecture uses write-back (with store forwarding). Load instructions, however , have variable latency de- pending on the cache lev el. T o estimate their latency , w e perform a simple in-order cache simulation (per memory conguration) to determine the cache level for each Load. W e then map each cache level to a constant latency (e.g., L1 → 4 cycles, L2 → 10 cycles, LLC → 30 cycles, RAM → 200 cycles). (ii) I-cache latency: T o mo del the fetch stage, our analytical models ne ed an estimate of I-cache access times, which we obtain by performing a simple in-order I-cache simulation (per memory conguration). (iii) Branch misprediction rate , which we obtain by simulating the target branch prediction algorithm on the DynamoRIO trace. Our implementation supports two branch predictors: Simple , a branch predictor that mispredicts randomly with a pre-specied misprediction rate, and T AGE [ 8 , 77 ]. Improving memor y modeling. The execution times assigned to Load instructions by the above proce dure can b e highly inaccurate in some cases, leading Concorde ’s analytical mo dels astray . As we will see, Concorde ’s ML model can overcome many errors in the analytical model. However , in extreme cases at the tail, Concorde ’s accuracy is aected by discrepancies between the results of trace analysis and the program’s actual behavior (§ 5.2.1 ). The key challenge with analyzing Load instructions is that their execution times can change depending on the time and order in which they are issued. Of course, a simple in-order cache simulation cannot capture timing-dependent eects. Howev er , we now discuss a rene- ment atop the basic cache simulation that addresses two large sources of errors in estimating Load execution times. Our approach is built on two principles for accounting for the eects of conicting cache lines and instruction order without running detailed timing simulations. Consider two Load instructions accessing the same cache line, with the data not present in cache. In the in-order cache simulation, 4 Concorde: Fast and Accurate CP U Performance Mo deling with Compositional Analytical-ML Fusion Algorithm 1 A trace-driven state machine for memory for all 𝑐 𝑎𝑐ℎ𝑒 _ 𝑙 𝑖 𝑛𝑒 do ⊲ State variable initialization exec_times [ 𝑐 𝑎𝑐 ℎ𝑒 _ 𝑙 𝑖𝑛𝑒 ] ← Execution times of load instructions accessing exec_times [ 𝑐 𝑎𝑐 ℎ𝑒 _ 𝑙 𝑖𝑛𝑒 ] ← 𝑐 𝑎𝑐ℎ𝑒 _ 𝑙 𝑖 𝑛𝑒 from in-order cache simulation access_counters [ 𝑐 𝑎𝑐 ℎ𝑒 _ 𝑙 𝑖𝑛𝑒 ] ← 0 ⊲ Number of accesses last_req_cycles [ 𝑐 𝑎𝑐ℎ 𝑒 _ 𝑙𝑖 𝑛𝑒 ] ← 0 ⊲ Cycle of last request last_resp_cycles [ 𝑐 𝑎𝑐ℎ𝑒 _ 𝑙 𝑖𝑛𝑒 ] ← 0 ⊲ Cycle of last response end for function RespCycle ( 𝑟 𝑒𝑞 _ 𝑐 𝑦𝑐 𝑙 𝑒 ,𝑖𝑛𝑠 𝑡 𝑟 ) 𝑐 𝑎𝑐ℎ𝑒 _ 𝑙 𝑖 𝑛𝑒 ← 𝑖 𝑛𝑠 𝑡 𝑟 .𝑐 𝑎𝑐ℎ𝑒 _ 𝑙 𝑖𝑛𝑒 ⊲ 𝑟 𝑒𝑞 _ 𝑐 𝑦𝑐 𝑙 𝑒 must be non-decreasing for requests to the same cache line Assert 𝑟 𝑒 𝑞 _ 𝑐 𝑦 𝑐𝑙 𝑒 ≥ last_req_cycle [ 𝑐 𝑎𝑐ℎ𝑒 _ 𝑙 𝑖𝑛𝑒 ] if is_load ( 𝑖𝑛𝑠 𝑡 𝑟 ) then ⊲ Adjustment for load instructions only prev_resp_cycle ← last_resp_cycles [ 𝑐 𝑎𝑐ℎ𝑒 _ 𝑙 𝑖 𝑛𝑒 ] access_number ← access_counters [ 𝑐 𝑎𝑐ℎ𝑒 _ 𝑙 𝑖 𝑛𝑒 ] exec_time ← exec_times [ 𝑐 𝑎𝑐ℎ𝑒 _ 𝑙 𝑖 𝑛𝑒 ] [ access_number ] resp_cycle ← max ( 𝑟 𝑒 𝑞 _ 𝑐 𝑦𝑐𝑙 𝑒 + exec_time , prev_r esp_cycle ) last_resp_cycles [ 𝑐 𝑎𝑐ℎ𝑒 _ 𝑙 𝑖𝑛𝑒 ] ← resp_cycle access_counters [ 𝑐 𝑎𝑐 ℎ𝑒 _ 𝑙 𝑖𝑛𝑒 ] + + else ⊲ Nothing special for non-load instructions resp_cycle ← 𝑟 𝑒𝑞 _ 𝑐 𝑦𝑐𝑙 𝑒 + estimated execution time of 𝑖 𝑛𝑠 𝑡 𝑟 end if return resp_cycle end function the rst Load is labele d as a main memor y access (200 cycles), while the second Load is labeled as an L1 hit (4 cycles). Now suppose these Loads are issued at around the same time in the actual OoO core, e.g., rst Load at cycle 0 and second Load at cycle 1. Naïvely using the cache simulation results, we might conclude that the rst Load com- pletes at cycle 200 and the second Load at cycle 5. But, in reality , b oth Loads will complete after 200 cycles b ecause the second Load must wait for the rst Load to fetch the data fr om main memor y into L1 cache. This e xample motivates our rst principle: the response cycle for consecutive Loads accessing the same cache line is non-decreasing. Next, consider the same scenario, but with the two Loads issued in reverse order in the OoO core (e.g., due to a register dependency). With this reversed order , the second Load (issued rst) b ecomes a main memory access, and the rst Load (issue d se cond) becomes an L1 hit. Thus, our second principle: the access levels of Loads with the same cache line is determined by their issue order , not the instruction order (used in cache simulation). W e incorporate these principles into a trace-driven state machine for memor y (Algorithm 1 ). The function RespCycle returns the response cycle (execution completion cycle) for an instruction issued at cycle 𝑟 𝑒𝑞 _ 𝑐𝑦𝑐 𝑙 𝑒 . For non-Load instruc- tions, it simply uses the execution time estimated by the standard pro- cedure described earlier . For Loads, howev er , it adjusts the execution time to account for their cache line and issue times. W e use this mem- ory model in the analytical models of ROB and Load queue, which are sensitive to Load execution latencies (§ 3.2 ). The memor y model is fast and does not materially increase the cost of analytical modeling. 3.2 Analytical Models As discussed in § 2 , Concorde ’s primar y features are a set of through- put distributions associated with each potential microarchitectural resource bottlene ck. W e describe the derivation of these distribu- tions for various resources in § 3.2.1 . W e then discuss a few auxiliar y features in § 3.2.2 that capture nuances not covered by the primar y features, further impr oving the ML model’s accuracy . The bulk of Concorde ’s design eort has gone into analytical mod- eling. Before delving into details, w e highlight a few lessons fr om our experience. Our guiding principle has b een to capture the perfor- mance trends imposed by a microarchitectural bottleneck, without being overly concerned with precision. As our results will show (§ 5.2 ), the ML model serves as a powerful backstop that can mask signif- cant errors in the analytical mo del. Thus, we have generally avoided undue complexity (admittedly a subjective metric!) to improve the analytical model’s accuracy . Our decision to simply analyze each resource in isolation (§ 2 ) is the clearest example of this philosophy . Isolated per-resource throughput analysis is similar to traditional rooine analysis [ 18 ], but we perform it at an unusually ne gran- ularity to analyze the impact of low-level resources (e.g., an issue queue, fetch buers, etc.) on small windows (e.g., few 100s) of in- structions. The details of such analyses depend on the design, but we hav e found three types of models to be useful: (i) closed-form mathematical expressions, (ii) dynamical system equations, (iii) sim- ple discrete-event simulations of a single component. W e provide examples of these methods below . 3.2.1 Per-Resource Throughput Analysis. W e calculate the through- put of each CP U resource over xe d windows of 𝑘 consecutive in- structions, assuming no other CP U component is b ottlenecked. The parameter 𝑘 should be small enough to observe phase changes in the program’s behavior , but not so small that throughput uctuates wildly due to bursty instruction pr ocessing (e.g., a fe w instructions). W e have found that any value of 𝑘 in the order of the ROB size, typically a few hundred instructions, works well. Given a program region (e .g., 100K-1M instructions), Concorde divides it into consecutive 𝑘 -instruction windows and calculates the throughput b ound for each window , per CP U r esource and pa- rameter value (T able 1 ). Concorde converts all thr oughput b ound timeseries into distributions (CDFs) to arrive at the set of p erfor- mance distributions for the entire microarchitectural design space. Memory parameters (L1i/d, L2, L1d prefetcher degree) do not have separate throughput featur es; they aect the instruction ex- ecution latency and I-cache latency estimates (§ 3.1 ) used in CPU resource analyses. Spe cically , the throughput computations for ROB, and Load/Store queues rely on instruction execution laten- cies. Concorde performs throughput calculations for these resources per L1d/L2/prefetch conguration using the corresponding execu- tion latency values in the Concorde trace. Similarly , the I-cache lls throughput calculations ar e performed per L1i/L2 cache size. ROB. The ROB is the most complex component to model, encapsulat- ing out-of-order execution constrained by instruction dependencies and in-order commit b ehavior . For an instruction 𝑖 , we dene Dep ( 𝑖 ) as its immediate (register and memory) dependencies obtained via trace analysis (§ 3.1 ), 𝑎 𝑖 as its arrival cycle to the ROB, 𝑠 𝑖 as its execu- tion start cycle, 𝑓 𝑖 as its execution nish cycle, and 𝑐 𝑖 as its commit cycle. W e calculate the throughput induced by a ROB of size ROB using the following instruction-level dynamical system: 𝑎 𝑖 = 𝑐 𝑖 − ROB , (1) 𝑠 𝑖 = max 𝑎 𝑖 , max 𝑓 𝑑 | 𝑑 ∈ Dep ( 𝑖 ) , (2) 𝑓 𝑖 = RespCycle 𝑠 𝑖 , instr 𝑖 , (3) 𝑐 𝑖 = max ( 𝑓 𝑖 , 𝑐 𝑖 − 1 ) , (4) 5 A. Nasr-Esfahany et al. for 𝑖 ≥ 1 , where 𝑐 𝑖 = 0 for 𝑖 ≤ 0 by convention. Equation ( 1 ) enforces the size constraint of the ROB. Equation ( 2 ) accounts for the instruc- tion dependency constraints. Equation ( 3 ) uses the function shown in Algorithm 1 (§ 3.1 ) to determine the nish time of each instruc- tion. 3 Equation ( 4 ) mo dels the in-order commit constraint. Finally , the throughput for the 𝑗 th window of 𝑘 instructions is calculated as: thr 𝑗 ROB = 𝑘 𝑐 𝑘 𝑗 − 𝑐 𝑘 ( 𝑗 − 1 ) . (5) Load/Store queue. The Load and Store queues bound the numb er of issued memor y instructions that have yet to be committed (in order). W e briey discuss the Load queue model (Store queue is analogous). It is identical to the ROB model, with two dierences: (i) the calcu- lations are performed exclusively for Load instructions, (ii) there are no dependency constraints: a Load is eligible to start as soon as it obtains a slot in the queue. After computing the commit cycle for each Load, we derive the throughput for each 𝑘 -instruction window similarly to Equation ( 5 ) . In these calculations, non-Load operations are assume d to be free and incur no additional latency . Static bandwidth resources. These resources impose limits on the number of instructions (of a certain type) that can be service d in a single clock cycle. For example, Commit, Fetch, De code, and Rename widths constrain the throughput of all instructions. The through- put bound imposed by these r esources is trivially their respe ctive width. In contrast, issue queues restrict the throughput for a specic group of instructions, e.g., ALU , Floating-point, and Load-Store issue widths in our reference architecture. T o compute the throughput bound imposed by such resources, we compute the processing time of the instructions that are constrained by that resource and assume non-aected instructions incur no additional latency . For instance, the throughput bound induced by the ALU issue width in the 𝑗 -th window of 𝑘 consecutive instructions is given by: thr 𝑗 ALU = 𝑘 𝑛 𝑗 ALU × ALU issue width , (6) where 𝑛 𝑗 ALU is the number of ALU instructions in window 𝑗 . Dynamic constraints. Some resources impose constraints on a dynamic set of instructions determined at runtime based on the mi- croarchitectural state. Analyzing such resources is more challenging. T wo strategies that we have found to be helpful are to use simplied performance bounds or basic discrete-event simulation. W e briey discuss these strategies using two examples. Load/Load-Store Pipes. Finite Load and Load-Store pipes limit the number of memory instructions that can b e issue d per cycle. Store in- structions exclusively use Load-Stor e pipes, while Load instructions can utilize both Load pipes and Load-Store pipes. The allocation of instructions to these pipes depends on dynamic microarchitectural state, e.g., the precise order that memory instructions be come eligi- ble for issue and the exact pip es available at the time of each issue. Rather than model such complex dynamics, we derive simple upper and lower bounds on the throughput. Let 𝑛 𝐿𝑜𝑎𝑑 and 𝑛 𝑆 𝑡 𝑜 𝑟 𝑒 denote the numb er of Load and Store instructions in a 𝑘 -instruction window , 𝐿𝑆 𝑃 the number of Load-Store pipes, and 𝐿𝑃 the number of Load 3 W e execute Equation ( 3 ) in order of instruction start times 𝑠 𝑖 to satisfy Algorithm 1 ’s requirement for non-decreasing request cycles. pipes. The worst-case allocation of pipes is to issue Loads rst using all available pipes, and only then begin issuing Stores using the Load- Store pip es. This allocation leav es the Load pipes idle while Stores are b eing issued. It r esults in the maximum total processing time: 𝑇 𝑚𝑎𝑥 = 𝑛 𝐿𝑜𝑎𝑑 / ( 𝐿𝑆 𝑃 + 𝐿𝑃 ) + 𝑛 𝑆 𝑡 𝑜 𝑟 𝑒 / 𝐿𝑆 𝑃 , and thus a lower-bound on the throughput of the pipes component: 𝑡 ℎ𝑟 𝑙 𝑜 𝑤𝑒𝑟 = 𝑘 / 𝑇 𝑚𝑎𝑥 . The best-case allocation is to grant Stores exclusive access to Load-Store pipes while concurrently using Load pipes to issue Loads. Once all Stores are issued, the Load Store pipes are allocated to the remaining Loads. Analogous to the lower b ound, we can derive an upper bound on the throughput 𝑡 ℎ𝑟 𝑢 𝑝 𝑝 𝑒𝑟 based on this allocation (details omitted for brevity). W e summarize these bounds using the distribution of 𝑡 ℎ𝑟 𝑙 𝑜 𝑤𝑒𝑟 and 𝑡 ℎ𝑟 𝑢 𝑝 𝑝 𝑒𝑟 over all instruction windows. I-cache lls and fetch buers. W e model these resources using sim- ple instruction-level simulations. Here, we fo cus on I-cache lls for brevity . The maximum I-cache lls restricts the number of in-ight I-cache requests at any given time. This is a dynamic constraint, because whether an instruction generates a new I-cache request de- pends on the set of in-ight I-cache requests when it reaches the fetch target queue. Specically , new requests are issued only for cache lines that are not already in-ight. W e estimate the throughput constraint imposed by the maximum I-cache lls using a basic simulation of I-cache requests. This simulation assumes a backlog of instructions waiting to be fetched, restricted only by the availability of I-cache ll slots. Instructions are considered in order , and if they need to send an I-cache request, they send it as soon as an I-cache ll slot be comes available. W e record the I-cache response cycle for each instruction in the simulation, and use it to calculate the throughput for each window of 𝑘 consecutive instructions similarly to Equation ( 5 ). 3.2.2 A uxiliary Features. In addition to the primar y features de- scribed above, we describe a few auxiliary features that capture nuances not covered by per-resource throughput analysis. W e eval- uate the impact of these auxiliary features in § 5.2.2 . Pipeline stalls. Unlike resource constraints, modeling the eects of pipeline stalls caused by branch mispredictions and ISB instruc- tions as an isolated component is not meaningful. The impact of stalls on performance depends on factors beyond the fetch stage, for instance, the inherent instruction-level parallelism (ILP) of the program, how long it takes to drain the pipeline, and how quickly the stall is resolv ed [ 30 ]. Rather than try to model these comple x dynamics analytically , we incorp orate two simple groups of fea- tures to assist the ML model with predicting the impact of pipeline stalls. First, we provide basic information about the extent of stalls: (i) the distribution of the number of ISBs in our windows of 𝑘 con- secutive instructions; (ii) the distribution of the count of the three branch types (§ 3.1 ) per instruction window , (iii) the overall branch misprediction rate obtained fr om trace analysis. A dditionally , we provide the overall throughput calculated by our analytical ROB model (§ 3.2.1 ) for varying ROB sizes, ROB ∈ { 1 , 2 , 4 , 8 , .. . , 1024 } . The intuition behind this feature is that pipeline stalls eectively reduce the average o ccupancy of the ROB, lowering the backend throughput of the CP U pipeline. Therefor e, the ROB model’s estimate of how throughput varies versus ROB size can provide valuable context for how sensitive a program’s performance is to pipeline stalls. 6 Concorde: Fast and Accurate CP U Performance Mo deling with Compositional Analytical-ML Fusion T able 2: W orkload space with 5486 B instructions from 29 programs T ype Name Traces Instructions (M) Proprietary Compression (P1) 4 1845 Search1 (P2) 168 17854 Search4 (P3) 170 23188 Disk (P4) 168 23441 Video (P5) 268 26981 NoSQL Database1 (P6) 168 30283 Search2 (P7) 84 52989 MapReduce1 (P8) 84 56677 Search3 (P9) 1334 69277 Logs (P10) 191 75845 NoSQL Database2 (P11) 84 91274 MapReduce2 (P12) 84 104750 Query Engine&Database (P13) 790 1195128 Cloud Benchmark Memcached (C1) 8 2791 MySQL (C2) 84 9283 Open Benchmark Dhrystone (O1) 1 174 CoreMark (O2) 1 335 MMU (O3) 132 18475 CPUtest (O4) 138 95215 SPEC2017 505.mcf_r (S1) 19 197232 520.omnetpp_r (S2) 20 214749 523.xalancbmk_r (S3) 20 214749 541.leela_r (S4) 20 214749 548.exchange2_r (S5) 20 214749 531.deepsjeng_r (S6) 20 214749 557.xz_r (S7) 38 408022 500.perlbench_r (S8) 41 440235 525.x264_r (S9) 44 472447 502.gcc_r (S10) 94 999282 Latency distributions. W e augment our primary throughput based features from § 3.2 with three instruction-level latency distributions collected from the ROB model. Specically , w e provide the distribu- tion of the time that instructions spend in the issue ( 𝑠 𝑖 − 𝑎 𝑖 ), execution ( 𝑓 𝑖 − 𝑠 𝑖 ), and commit ( 𝑐 𝑖 − 𝑓 𝑖 ) stages of the ROB model (Equations ( 1 ) to ( 4 )) for ROB ∈ { 1 , 2 , 4 , 8 , . . ., 1024 } . 4 These latency distributions pro- vide additional context that can be useful for understanding certain nuances of the performance dynamics. For example, the execution la- tency distribution indicates whether a program is load-heavy , which can be useful for predicting memory congestion. 3.3 ML Model The nal component of Concorde ’s design is a lightweight ML model that predicts the CPI of a program on a sp ecied architecture. The model is a shallow multi-layer perceptron (MLP) ( details in § 4 ) that takes as input a concatenation of (i) the performance distributions corresponding to the target microarchitecture (§ 3.2.1 ), (ii) the auxil- iary features (§ 3.2.2 ), and (iii) a 20-dimensional vector of parameters ( ® p ) representing the target microarchitecture (T able 1 ). W e train the ML model on a dataset constructe d by randomly sampling diverse program regions and microarchitectures. W e simulate each sample program region and sample micr oarchitecture using the cycle-level simulator to collect the ground-truth target CPI. T o train the ML model, we use a loss function that measures the r elative magnitude of CPI prediction error , as follows: 𝐿𝑜𝑠 𝑠 ( ˆ 𝑦, 𝑦 ) = | ˆ 𝑦 − 𝑦 | 𝑦 , (7) where ˆ 𝑦 denotes the predicted CPI and 𝑦 denotes the CPI label. 4 Concorde ’s Implementation Details Trace analyzer and analytical models. W e implement the trace analyzer and analytical models in C++. Trace analysis performs in-order cache simulation (per memory conguration) and branch 4 The execution latency does not depend on ROB size; therefor e, we only include one copy of the execution latency distribution feature . P13 P12 P10 P11 P9 P8 P7 P6 P3 P4 P5 P2 P1 C2 C1 O4 O3 O2 O1 S10 S7 S8 S9 S2 S3 S4 S1 S6 S5 0 10 20 30 40 50 60 70 80 90 T rain/T est Overlap (% instructions) Figure 4: A verage test/train overlap across benchmarks prediction simulation (for T AGE). T o pr ecompute the performance features for a program, we run the trace analyzer for each mem- ory conguration to derive the Concorde trace, and then run the analytical models for all parameter values of each CP U resource independently . Our current implementation uses a single thread, but all analytical mo del invocations could run in parallel. T o calculate performance distributions, Concorde uses a window size of 𝑘 = 400 . Dataset. Unless specied other wise, Concorde uses a dataset with 789 , 024 data points for training, with an additional 48 , 472 unseen (test) data points reserved for evaluation. Every data point is con- structed by independently sampling a microarchitecture, and a 100 k- instruction region. T o sample a microarchitecture, we independently pick a random value fr om T able 1 for every parameter . Concorde ’s large microarchitecture space ( ∼ 2 × 10 23 ) ensures that test microar- chitectures are almost surely unseen during training, pr eventing memorization. T o sample a program region, we sample a program from Table 2 , sample a trace of the chosen program randomly with probability proportional to trace length, and sample a region ran- domly from this trace. Figure 4 shows the average overlap of test pro- gram regions with their closest training region (the training region with maximum instruction overlap) for every program. The overlap is 16 . 86% on average, and less than 10% for the majority of programs. T able 3: ML mo del’s 3873-dimensional input. (§ 3.2.1 ) Per-resource throughput analysis (§ 3.2.2 ) Pipeline stalls (§ 3.2.2 ) Latency distributions (T able 1 ) T arget microarchitecture 11 × 101 = 1111 4 × 101 + 1 + 11 × 1 = 416 ( 1 + 2 × 11 ) × 101 = 2323 19 + 2 × 2 = 23 Lightweight ML model. Concorde ’s ML comp onent uses a fully connected MLP with a 3873-dimensional input layer and two hidden layers with sizes 256 and 128 that outputs a scalar CPI prediction. For encoding every input distribution to the ML model, Concorde uses a 101 -dimensional encoding which includes 50 xed equally-spaced percentiles of the original distribution, 50 xed equally-spaced per- centiles of the size-weighted distribution, 5 and the average value. T able 3 shows the breakdown of the input dimensions to the fea- tures detaile d in § 3 . Note that in the rst column, we do not include throughput distributions for static bandwidth resources that remain constant throughout the entire program such as Commit width. In the last column, we use one-hot vectors for the branch predictor type and the state of pr efetching. W e use the AdamW [ 56 ] optimizer with weight decay of 0 . 3 , learning rate of 0 . 001 that halves after { 10 , 14 , 18 , 22 } k steps, and batch size of 50 k to train for 1521 epochs. 5 The size weighted distribution is a transformation of the original distribution of a non-negative random variable in which we weight every sample by its value. This transform highlights the tail of the original distribution. 7 A. Nasr-Esfahany et al. 1 0 0 1 0 1 1 0 2 Gr ound T ruth CPI 20 50 80 CDF (%) 20 50 80 CDF (%) 1 0 1 1 0 0 1 0 1 R elative CPI Er r or (%) Figure 5: Scatterplot of Concorde ’s CPI prediction error vs. the CPI for unse en (test) pairs of 100k-instruction regions and microarchi- tectural parameters. The plots on the sides show the distributions of CPI and prediction error . The average error is 2%, with only 2.5% of samples having larger than 10% error . P12 P11 P1 P13 P4 P5 P10 P8 P6 P3 P7 P2 P9 C2 C1 O1 O3 O2 O4 S4 S6 S5 S8 S9 S2 S7 S3 S1 S10 1 3 5 7 9 CPI Er r or (%) average 9 0 t h p e r c e n t i l e Figure 6: Error breakdown across b enchmarks 5 Evaluation W e evaluate Concorde ’s CPI prediction accuracy and speed in § 5.1 . In § 5.2 , we dive deep er into its accuracy and our design choices. 5.1 Concorde ’s Accuracy and Sp eed Accuracy on random microarchitectures. T o highlight the gen- eralization capability of Concorde across microarchitectures, we rst evaluate its accuracy on the unseen test split of the dataset (§ 4 ), where microarchitectures are randomly sampled. Figure 5 illus- trates Concorde ’s relative CPI prediction error (Equation ( 7 )) vs. the ground-truth CPI from our gem5-based cycle-level simulator . The top and left plots besides the axes show the distributions of the CPI and Concorde ’s prediction error across all samples. Concorde achieves an average relative error of only 2 . 03% . Moreover , its error has a small tail; only 2 . 51% of test samples have errors larger than 10% . Recall from § 4 that such accuracy cannot b e achieved by memorization since the microarchitectures in our test dataset are not se en in the training samples. Figure 6 shows the error breakdown across programs. While some programs are more challenging than others, the av erage error and P 90 is capp ed at 4 . 2% and 8 . 9% , respectively . Furthermore, the errors do not correlate well with the per program train/test overlaps in Figure 4 . For instance, Concorde ’s average error is less than 1% for S4 and S6 , and only slightly over 1% for P12 , all of which have train/test overlaps less than 3 . 5% . This highlights Concorde ’s eec- tiveness in generalizing (in distribution) across program regions. 0 2 4 6 8 10 R elative CPI Er r or (%) 0 50 100 CDF (%) 100k instructions 1M instructions Figure 7: Concorde is more accurate on longer program regions. S7 S3 S2 S8 S5 S4 S9 S6 S10 S1 1 3 5 7 9 11 CPI Er r or (%) Concor de T A O Figure 8: Concorde is more accurate than T AO on all programs. Longer program regions. Re call that one of the main design goals of Concorde is to avoid a run time cost that scales with the number of instructions ( O ( 𝐿 ) ) . Hence, unlike cycle-level simulators that operate on sequence of instructions, Concorde takes as input a xed- size performance characterization of the program independent of the program length. T o evaluate Concorde on longer program re- gions, we create a new dataset similar to the original one (§ 4 ) with longer program regions of 1 M instructions and re-train Concorde on it. Figure 7 shows the distribution of Concorde ’s relative CPI prediction error over the unseen test split of this dataset (solid green line). The average error is 1 . 75% and only 1 . 82% of cases have larger than 10% error , which is slightly better than Concorde ’s accuracy on the original 100k-instruction r egion dataset (dashed blue line). W e hypothesize that this is be cause the av erage CPI has less variability over longer regions due to the phase b ehaviors getting averaged out (which we conrmed by comparing the CPI variance in the two cases). This reduce d variance makes the learning task easier for longer regions, b oosting Concorde ’s accuracy . Accuracy on ARM N1. T o assess Concorde ’s accuracy on a realis- tic microarchitecture , we evaluate its CPI predictions for ARM N1 (T able 1 ), using the 100 k-instruction regions in the test split of our dataset (§ 4 ). It has an average error of 3 . 25% with 4 . 39% of program regions having errors larger than 10% , which is a slight degrada- tion in the accuracy compar ed to random micr oarchitectures. W e believe that this is because randomly sampled microarchitectures are more likely to have a single dominant bottleneck while ARM N1 is designed to be balanced. Comparison with T A O [ 71 ]. W e compare Concorde with T AO , the previous SOT A in sequence-based approximate performance modeling. Unlike Concorde , T AO do es not generalize without addi- tional retraining b eyond a single microarchitecture. Hence, we train it for ARM N1 on a dataset of 100 M randomly sampled instructions from SPEC2017 pr ograms (T able 2 ). Figure 8 compares T AO’s CPI prediction accuracy on 100 𝑘 -instruction regions from SPEC2017 programs with Concorde ’s; Concorde is more accurate for every single program. This is despite the fact that Concorde is trained on random microarchitectures whereas T AO is spe cialized to ARM N1. Accuracy on long programs. Using Concorde ’s CPI predictions for nite program regions as the building block, we can estimate the 8 Concorde: Fast and Accurate CP U Performance Mo deling with Compositional Analytical-ML Fusion P12 P9 P2 P11 O4 P7 S5 O2 S7 S6 1 3 5 7 9 11 CPI er r or (%) 10 samples 30 samples 100 samples 300 samples Figure 9: Accuracy for long programs vs. number of samples 1 0 3 1 0 1 1 0 1 1 0 3 1 0 5 R unning time (s) 20 50 80 CDF (%) Concor de Concor de (100 samples) cycle-level (1B instrs) cycle-level (1M instrs) Figure 10: Concorde is ve/seven orders of magnitude faster than a cycle-level simulator on 1 M/ 1 B-instruction program regions. CPI for arbitrarily long programs by randomly sampling program re- gions and averaging their pr edicted CPIs. As an example, we use the 1M-instruction region mo del to predict the CPI for programs with 1B instructions. Figure 9 shows Concorde ’s accuracy in predicting CPI for ARM N1, across ten such 1B-instruction programs, with four sampling levels. As shown, with as little as 100 samples, Concorde ’s error gets below 5% for every program, with an average error of 3.5%. Using 300 samples, the average error decreases to 3.16%. Concorde ’s Spee d. Figure 10 shows the running time distribution of Concorde and our gem5-based cycle-level simulator . W e measure the running time of Concorde and the cycle-level simulator on a single CP U core. For these experiments, we simulate from the rst instruc- tion of each trace , to av oid extra warmup overheads for the cycle- level simulator . The average running time of Concorde (solid blue) is 168 𝜇 sec . Compared to our cycle-level simulator , Concorde achieves an average speedup of more than 2 × 10 5 for 1 M-instruction regions. Furthermore, Concorde ’s running time does not change with the length of the instruction region (e .g., 100 k → 1 M) since the size of its input distributions are xe d. In contrast, the cycle-level simulator’s running time scales with the program region length, e.g., 487 × by increasing the length from 1 M (green) to 1 B (red) instructions. Recall that to estimate the CPI of 1 B-instruction programs in Figure 9 , we used Concorde ’s predictions on randomly sampled 1 M-instruction regions. The dashed dotted line in Figure 10 shows the running time distribution for processing 100 samples, measured on the same CP U. Even with 100 sequential samples, Concorde ’s average running time ( 1 . 7 𝑚 sec ) is about 10 7 times faster than the cycle-level simulator for programs with 1 B instructions. Additionally , the running time of the cycle-level simulator exhibits a high variance due to its dependence on the numb er of cycle-level events, which varies with programs and microarchitectures. In contrast, Concorde ’s running time has mini- mal variance since its computation is deterministic irrespective of the program or the microarchitecture. Note that the reported spe edups do not include the benets of batching Concorde ’s calculations on ac- celerators such as GP Us, which would further amplify its advantage. 0.9 1.1 1.5 2 Ex ecution T ime R atio 10 30 50 70 90 CDF (%) 5 10 15 20 R elative CPI Er r or (%) r a t i o [ 0 . 9 , 1 . 1 ) r a t i o [ 1 . 1 , 1 . 5 ) r a t i o [ 1 . 5 , ) Figure 11: Although the ML component of Concorde corrects for a large portion of errors in estimates of instruction execution times from trace analysis, this error plays a signicant role in the tail of Concorde ’s error distribution. 5.2 Deep Dive 5.2.1 What constitutes Concorde ’s error tail? Recall fr om § 5.1 that Concorde has a small error tail, wher e tail is dened as cases with larger than 10% error . Her e, we detail our attempts to understand some of the factors responsible for the tail. Discrepancy in raw execution times. Recall that Concorde ’s ana- lytical models use approximate instruction e xecution times derived in trace analysis (§ 3.1 ). As we discussed in § 3.1 , these estimate d executions times can dier from the actual values observed during timing simulations. Figure 11 ( left) shows the distribution of the ratio of the actual instruction execution times in timing simulations to their estimates from trace analysis, across 100 k-instruction regions in our test dataset (§ 4 ). More than 10% of program regions have a ratio larger than 1 . 5 . These discrepancies can o ccur for a variety of reasons, including memory congestion, partial store forwarding, etc. that we do not account for in trace analysis. With high errors in their raw inputs, our analytical models will b e inaccurate. W e bucketize program regions based on the above ratio into three buckets, and plot Concorde ’s prediction error distribution for samples in each bucket (Figure 11 , right). The result shows that Concorde ’s prediction error increases for the buckets with larger execution time discrepancy . But its accuracy remains quite high, even with signicant discrepancies, e.g., achieving an av erage error of 4 . 53% in cases with ratio larger than 1 . 5 . This shows that the ML component of Concorde can correct for signicant errors in the ana- lytical models. Nonetheless, errors in e xecution time estimates fr om trace analysis account for a large portion of the tail of Concorde ’s er- ror distribution. Among test program regions that have errors larger than 10% , 41 . 5% have execution time ratios larger than 1 . 5 (whereas only about 10% of all program regions have a ratio larger than 1.5). Branch prediction. Recall from § 3.2 that unlike other CP U compo- nents, Concorde does not analytically model branch mispredictions. Instead, it relies on a set of auxiliary features that are helpful for learning the eect of pipeline stalls. W e will show in § 5.2.2 that these features inde ed boost Concorde ’s overall accuracy . Here, we study whether branch mispredictions ar e another sour ce of Concorde ’s error tail. T able 4 categorizes Concorde ’s accuracy based on the num- ber of branch mispredictions in 100k-instruction regions of the test dataset (§ 4 ). Intriguingly , Concorde ’s accuracy improv es as the num- ber of mispredictions incr eases, with an average error of 1.82% in regions with over 5,000 branch mispredictions. W e hypothesize that this is because pr ograms with large number of stalls hav e low paral- lelism and simpler dynamics, making them easier to predict. This re- sult conrms that Concorde ’s branch-related features are sucient. 9 A. Nasr-Esfahany et al. T able 4: Concorde successfully learns the eect of branch prediction. Number of branch mispredictions [ 0 , 1000 ) [ 1000 , 5000 ) [ 5000 , ∞ ) Concorde ’s average error ( % ) 2 . 16 2 . 12 1 . 82 % ( Concorde ’s error > 10 % ) 3 . 11 2 . 43 1 . 95 0 2 4 6 8 10 R elative CPI Er r or (%) 0 50 100 CDF (%) Concor de base+branch base min bound (analytical) Figure 12: Ablation of Concorde ’s design components 5.2.2 Ablation study . Recall from § 3.2.2 that Concorde uses a few auxiliary features to augment the primary per-component through- put distributions. W e train several variants of Concorde to under- stand the impact of these features. For reference, we b egin with a simple minimum over the per-component throughput bounds (no ML). As shown by the pink line in Figure 12 , this has poor accu- racy , achie ving an average error of 65% (and 11% in cases with no branch misprediction). Concorde ’s base ML model, which takes as input the per-component throughput distributions along with the branch misprediction rate, signicantly boosts accuracy (red line), achieving an average error of 3 . 32% with errors exceeding 10% in only 4 . 48% of cases. Further adding the auxiliary features (§ 3.2.2 ) related to pipeline stalls (green) and instruction latency distributions (blue) provides incremental accuracy improvements, reducing av- erage error to 2 . 4% and 2 . 03% and the p ercentage of samples with errors larger than 10% to 3 . 7% and 2 . 51% , respectively . In addition, we ablated the ML model size, and the choice of 𝑘 , the length of instruction windows for throughput calculations (§ 3.2 ). Expanding the model to three hidden layers of sizes 512, 256, and 128 slightly lowers the average error on random microarchitectures from 2.03% to 1.85%, while reducing it to a single hidden layer of size 256 increases the error to 3.91%. V ar ying 𝑘 ∈ { 100 , 200 , 400 } did not have a signicant eect on our results. 5.2.3 Preprocessing cost. Precomputing the performance features for a 1M-instruction region for all the 2 . 2 × 10 23 parameter combina- tions in T able 1 takes 3959 seconds on a single CP U core — equivalent to the time required for 107 cycle-level simulations with similar warmup. This includes 195s for trace analysis (§ 3.1 ) and 3764s for analytical modeling (§ 3.2 ). Trace analysis comprises one T A GE, 40 D-cache, and 20 I-cache simulations. The dominant factors in ana- lytical modeling are 40 × 1024 ROB model invocations (3327s) and 40 × 256 invocations of the Load/Store queue models (211s/211s). The precomputed performance features occupy 24MB in uncompressed NumPy [ 38 ] format. T able 1 sweeps all parameters in increments of 1, but such a ne granularity is typically not necessar y in practice. Quantizing the pa- rameter space can signicantly reduce the precomputation time. For example, considering powers of 2 for ROB, Load and Store queues, i.e, ROB ∈ { 1 , 2 , 4 ,. . ., 1024 } , Load/Store queue ∈ { 1 , 2 , 4 ,. . ., 256 } , reduces 200 300 400 500 600 700 T raining Dataset Size (k) 2.0 2.5 3.0 3.5 4.0 4.5 CPI Er r or (%) Smaller dataset F ull dataset Figure 13: Impact of training dataset size on Concorde ’s accuracy P12 P11 P1 P13 P4 P5 P10 P8 P6 P3 P7 P2 P9 C2 C1 O1 O3 O2 O4 S4 S6 S5 S8 S9 S2 S7 S3 S1 S10 5 10 15 CPI Er r or (%) 26 4203 40 32 128 512 2048 8192 Number of seen new pr ogram samples 5 10 15 20 25 CPI Er r or (%) S1 C2 O4 O3 Figure 14: Errors can be high on unseen programs ( top ). Howe ver , Concorde recovers quickly as it trains on their samples ( boom ). the analytical modeling time to 63s , lowering the total preprocessing time for the resulting 1 . 8 × 10 18 parameter combinations to 257s (7 cycle-level simulations). T echniques like QEMU [ 12 ] could further reduce trace analysis time [ 25 ]. 5.2.4 Training cost. ML training takes 3 hours on a TP U-v3-8 [ 1 ] cloud server with 8 T ensorCores (2.7 hours on an AMD EYPC Milan processor with 64 cor es). T o generate the training dataset (§ 4 ), w e only run trace analysis and analytical modeling for one (randomly selected) microarchitecture for each program region. Using 512 cores, it takes 19.4 hours to create the mor e expensive 1M-instruction region dataset with 837,496 data points. This includes 16.8 hours for cycle-level simulations (to generate the CPI labels), 2.2 hours for trace analysis, and 26 minutes for analytical modeling. Although training is a one-time cost, it can be reduced at a slight degradation in mo del accuracy . Figure 13 shows that reducing the training dataset size to 200k samples gradually increases the relative CPI err or fr om 2.01% to 3.07%. Further r eduction to 100k samples increases the err or to 4.67%. 5.2.5 Out-of-Distribution (OOD ) Generalization. Like any ML model, we expe ct Concorde to be trained on a diverse dataset of programs representative of programs of inter est. Howev er , to stress test pro- gram generalization, for every program, we train Concorde on a dataset that excludes all its traces and evaluate the accuracy of the resulting model on that program. Figure 14 (top) shows the average OOD error for all programs. As expected, the error increases, with some programs being aecte d more than others. 23 programs (blue) have OOD err or below 10%. The 3 programs with the highest error (red) are synthetic microbenchmarks testing specic micr oarchitec- tural capabilities. These programs are unlike any other in the dataset. For instance, O3 (a memor y test), has much higher CPIs compared 10 Concorde: Fast and Accurate CP U Performance Mo deling with Compositional Analytical-ML Fusion to other programs in T able 2 . The 3 remaining programs (orange), with OOD error of about 15%, are real workloads that stand out from the others. For example, as we will se e in § 6 , S1 has the highest sensitivity to cache sizes among all workloads in T able 2 . Compared to generalization across microarchitectures, OOD gen- eralization across programs is not a major concern. Programs and benchmarks used for CP U architecture exploration are relatively sta- ble. For example, SPEC CP U benchmarks are only updated every few years, and w e similarly see infrequent updates to our internal suite of benchmarks. Nevertheless, we quantify the cost of “onboarding” new programs into Concorde for O3 , O4 (2 highest red bars), and S1 , C2 (2 highest orange bars). For each of these programs, we train Concorde on all other programs together with a var ying numb er of samples from the new program. As Figure 14 (bottom) shows, 2k (8k) samples from the new program are enough for Concorde to reach within 5% (2%) of the error oor achieved by the mo del traine d on the full dataset with ∼ 30 𝑘 samples per program (Figure 6 ). O3 and O4 have the steepest drop in error , which is likely due to the regularity of these synthetic benchmarks. 5.2.6 Can Concorde predict metrics other than CPI? Although we focused on CPI in designing our analytical mo dels, Concorde ’s rich performance distributions are useful for predicting other metrics as well. T o illustrate this point, we retrain Concorde ’s ML model (without changing hyp erparameters) to predict the average Rename queue occupancy (%) and average ROB o ccupancy (%), on the same dataset use d for CPI (§ 4 ). On unse en test samples, Concorde achieves an average prediction err or of 2.50% and 2.23%, respectively , vs. the ground-truth metrics fr om our gem5-based simulator . 6 Fine-Grained Performance Attribution Beyond predicting performance, architects often need to understand why a program performs as it does on a certain design. In this section, we present a methodology for ne-grained attribution of perfor- mance to dierent microarchitectural components. Our method can be used in conjunction with any performance model 𝑦 = 𝑓 ( ® x , ® p ) relat- ing microarchitectural parameters to performance. But as we will see, it is computationally impractical for expensive models such as cycle- level simulators. Concorde ’s massive spee dup over conventional methods makes such large-scale, ne-grained analyses possible. Concretely , our goal is to quantify the relative impact of dierent microarchitectural parameters ® p on the p erformance of a program ® x . This requires identifying the dominant performance bottlenecks. Many existing performance analysis techniques (e.g., T op-Down [ 92 ], CPI stacks [ 29 ]) rely on hardware performance counters to identify bottlenecks. W e seek to obtain similar insights using only a perfor- mance model 𝑦 = 𝑓 ( ® x , ® p ) like Concorde that outputs the (predicte d) performance of a program given the microarchitectural parameters. Performance of a single microarchitecture ® p provides no information about which of the parameters 𝑝 𝑖 are imp ortant. Thus, we use param- eter ablations , where we change some parameters and observe their impact on performance. Intuitively , parameters that have a large ef- fect on performance when modied are more important. Parameter ablations are commonly used to understand the impact of design choices [ 23 , 37 , 67 , 91 ]. A typical approach is to start with microarchi- tectural parameters p 𝑏𝑎𝑠 𝑒 representing a baseline design, and modify one parameter ( dimension) at a time to reach a target design with C a c h e L Q L Q C a c h e Shapley 0.0 0.5 1.0 1.5 2.0 CPI 53% 458% 501% 277% 234% Baseline Small caches Small LQ Figure 15: Changing the order of parameter ablations (Cache → Load Queue vs. Load Queue → Cache) leads to dierent conclusions about their relative imp ortance. Shapley values provide a fair , order-independent performance attribution to design parameters. parameters p 𝑡 𝑎𝑟 𝑔 𝑒 𝑡 . After each parameter change, the incremental change in performance is reported as the contribution of that param- eter to the total performance dierence between p 𝑏𝑎𝑠 𝑒 and p 𝑡 𝑎𝑟 𝑔 𝑒 𝑡 . Although this methodology is standard, it can be dicult to draw sound conclusions from parameter ablations when there are multi- ple inter-related factors eecting performance. The issue is that the order of parameter ablations can change the perceived importance of dierent factors. T o illustrate, suppose we are interested in quan- tifying the relative impact of (i) limited cache size and (ii) limited Load queue size on a memory-intensive workload. As a baseline, we consider a “big core” with all parameters set to their largest value in T able 1 , particularly: L1d/L1i cache = 256kB, L2d cache = 4MB, and Load queue = 256. Figure 15 shows the CPI achieved by this baseline (Grey bars) on a sample trace from the Search3 workload. Next, we consider two parameter ablations atop the baseline, where we reduce the cache sizes and the Load queue size to our tar- get values: L1d/L1i cache = 64kB, L2d cache = 1MB, Load queue = 12. In one ablation, w e rst reduce the cache sizes and then the Load queue size; in the other ablation, we reduce the Load queue size rst, then reduce cache size. The two left bars in Figure 15 show the CPI trajectory for both routes, along with the CPI increase associated with reducing cache sizes and Load queue size in each case. The overlaid numbers sho w the p ercentage CPI increase relative to the baseline following each parameter change. The two orders of parameter ablations lead to entirely dierent conclusions. The (Cache → Load queue) order suggests that reducing the Load queue size has about 9 × larger impact than reducing the cache sizes. The (Load queue → Cache) order , on the other hand, says that reducing the Load queue has negligible eect and the perfor- mance degradation is almost entirely caused by reducing the cache sizes. Neither of these interpretations is correct. The reality is that the eects of cache and Load queue size are intertwined. A large Load queue can mitigate the p erformance hit of small caches for this workload (due to increased parallelism). Similarly , a large cache size can perform well despite a small Load queue (since Load instructions complete quickly). It is only when both the Load queue and cache sizes are small that we incur a large performance hit. Shapley value: a fair , order-independent attribution. A natural way to remove the bias cause d by a spe cic order of parameter ab- lations is to consider the average of all possible or ders. Let Π denote the set of all permutations of the parameter indices 𝐷 ≜ { 1 , . . . ,𝑑 } . Each permutation 𝜋 ∈ Π corresponds to one order of ablating the parameters from p 𝑏𝑎𝑠 𝑒 to p 𝑡 𝑎𝑟 𝑔 𝑒 𝑡 , resulting in a dierent value for the incremental ee ct of modifying parameter 𝑖 . 11 A. Nasr-Esfahany et al. Specically , dene p 𝜋 ( 𝑗 ) ≜ ( p 𝑡 𝑎𝑟 𝑔 𝑒 𝑡 𝜋 1: 𝑗 , p 𝑏𝑎𝑠 𝑒 𝜋 𝑗 + 1: 𝑑 ) to be the 𝑗 𝑡 ℎ microar- chitecture encountered in the ablation study based on order 𝜋 , i.e., parameters 𝜋 1 , .. . , 𝜋 𝑗 are set to their target values and the rest re- main at the baseline. Let 𝑘 denote the position of parameter 𝑖 in the order 𝜋 . Then, the incremental eect of parameter 𝑖 in order 𝜋 is: Δ 𝜋 𝑖 ≜ 𝑓 ( x , p 𝜋 ( k ) ) − 𝑓 ( x , p 𝜋 ( k-1 ) ) . T o assign an overall attribution to parameter 𝑖 , w e take the average over all permutations: 𝜑 𝑖 ≜ 1 | Π | 𝜋 ∈ Π Δ 𝜋 𝑖 , (8) where | Π | = 𝑑 ! is the total number of permutations. The quantity dened in Equation ( 8 ) is referred to as the Shapley value [ 78 ] in economics. The concept arises in cooperative game theory , where a group of 𝑀 players work together to generate value 𝑣 ( 𝑀 ) . Shapley’s seminal work showed that the Shaple y value is a “fair” distribution of 𝑣 ( 𝑀 ) among the players, in that it is the only way to divide 𝑣 ( 𝑀 ) that satises certain desirable properties (refer to [ 78 ] for details). In our context, the “players” are the dierent microarchitectural comp onents, and the “value ” to be divided is the performance dierence between the baseline and target microarchi- tectures. 6 The Shapley value is use d in many areas of science and engineering [ 5 , 13 , 33 , 60 , 64 – 66 ], but to our knowledge, we are the rst to apply it to performance attribution in computer architecture. The rightmost bar in Figure 15 shows the Shapley values cor- responding to cache and Load queue sizes in the above example. The Shaple y value correctly captures that small caches and small Load queue sizes are together the culprit for high CPI relative to the baseline, with a slightly larger attribution to small caches. Case study . T o illustrate Shapley value analysis, we use it for ne- grained performance attribution in a target design based on the ARM N1 core [ 73 ] (parameters in T able 1 ) across our entire pool of pro- grams. As baseline, we use the “big core ” conguration mentioned above (perfect branch prediction, other parameters set to their max). Computing Shapley values is computationally expensive. For each program (region), using Eq. ( 8 ) directly requires 𝑑 ! × 𝑑 performance evaluations, where 𝑑 is the number of parameters. W e can calculate an accurate Monte Carlo estimate of Eq. ( 8 ) using a few hundred ran- domly sampled permutations, but even that requires a massive num- ber of p erformance evaluations for large-scale analyses. For example, estimating Shapley values for our corpus of workloads (T able 2 ) using 2000 sample regions per program and 200 permutations of parameter orders requires ∼ 143M CPI evaluations in total. This is impractical with existing cycle-level simulators; we estimate it would take about a month on a 1024-core server! With Concorde , the computation takes ab out an hour on a TP U-v3 [ 1 ] cloud server with 8 T ensorCores. Figure 16 shows the result of our analysis. The gr ey bars show the reference CPI achieved by the “big core” baseline, while the entire bars show the CPI achieved by ARM N1. Within each work- load group, i.e., proprietary , cloud, op en-source, and SPEC2017, the programs are sorted based on the relative CPI increase of ARM N1 compared to the baseline. For instance, in SPEC2017 benchmarks, S1(505.mcf_r) has the largest relative jump in CPI for ARM N1, whereas S7(557.xz_r) has the smallest relative CPI incr ease. The colored bars in Figure 16 show the Shapley value for each microarchitectural comp onent, i.e., how much each component in 6 It is not dicult to see that: Í 𝑖 𝜑 𝑖 = 𝑓 ( x , p 𝑡 𝑎𝑟 𝑔𝑒 𝑡 ) − 𝑓 ( x , p 𝑏𝑎𝑠 𝑒 ) . P5 P12 P11 P13 P1 P10 P4 P9 P3 P6 P7 P2 P8 C1 C2 O1 O2 O4 S7 S9 S6 S5 S4 S8 S3 S2 S10 S1 0.0 0.5 1.0 1.5 2.0 2.5 3.0 CPI Baseline L1i/L1d/L2 caches L1d stride pr efetcher ROB L oad queue Stor e queue L oad pipes L oad-stor e pipes AL U issue width Floating-point issue width L oad-stor e issue width Commit width Branch pr edictor Maximum icache fills F etch buffers F etch width Decode width R ename width Figure 16: CPI attribution for ARM N1 across all workloads Sample inde x 0 1 2 3 CPI Figure 17: CPI attributions for all Search3(P9) sample regions ARM N1 is responsible for the performance degradation relative to the baseline . This provides a bird’s eye vie w of the dominant per- formance b ottlenecks across the entire corpus of workloads. For instance, all the proprietary programs and half of the SPEC2017 programs are mainly backend bound on ARM N1, with prominent bottlenecks b eing the Load queue size and ROB size. A few programs such as S4(541.leela_r) (a chess engine using tree search) are frontend bound, with the TA GE branch predictor the most prominent frontend bottleneck. Cache sizes and L1 prefetching have a large eect on some SPEC2017 b enchmarks (e.g., S10(502.gcc_r) , S1 ) but a less pronounced impact on our proprietary workloads, perhaps in indication of our programs being cache-optimized. For a deeper look, we can further zoom into the b ehavior of a single program. For example, Figure 17 shows the CPI attribution for all 2000 sample regions of P9 , sorted on the x-axis based on their sensitivity to cache size. Although the P9 bar in Figure 16 shows limite d sensitivity to cache sizes on average, the zo omed-in view in Figure 17 shows high sensitivity to cache size in about 10% of the sampled r egions, highlighting the dierent phase behaviors in the program [ 39 ]. 7 Related W ork Conventional CP U simulators. Conventional simulators [ 3 , 4 , 6 , 11 , 15 , 19 , 22 , 28 , 32 , 34 , 42 , 63 , 69 , 72 , 74 , 75 , 84 , 94 , 95 ] aim to balance speed and accuracy , le veraging higher abstraction levels [ 19 , 32 ], or decoupled simulations of core and shared resources [ 28 , 75 ]. While these methods achieve faster simulations, they often compromise exibility or accuracy . Hardware-accelerated simulators [ 22 , 47 ] im- prove spe ed but require extensive development eort for validation. Statistical modeling tools [ 27 , 36 , 46 , 79 – 81 , 90 ] reduce computation by sampling representative segments [ 80 , 90 ] or generating synthetic traces [ 26 , 68 ], but they trade o exibility and detailed insights. Analytical performance models. Analytical models [ 2 , 21 , 41 , 48 , 49 , 86 , 87 ] provide quick performance estimates using parameterized equations and microarchitecture-independent proling. Such meth- ods are ideal for crude design space exploration but often lack the granularity needed to capture intricate 𝜇 -architectural dynamics. 12 Concorde: Fast and Accurate CP U Performance Mo deling with Compositional Analytical-ML Fusion ML- and DL-based performance models. Conventional ML based models [ 24 , 43 – 45 , 51 – 53 , 76 , 89 , 96 ] predict performance over con- strained design spaces but often struggle with ne-graine d program- hardware interactions. In contrast, Concorde demonstrates robust generalization across unseen programs and microarchitectures. Re- cent DL-based models [ 20 , 54 , 61 , 70 , 71 , 83 , 93 ] improve modeling at a higher abstraction levels at the cost of higher compute. Notably , Perf V ec[ 54 ] (signicant training overhead) and T AO[ 71 ] (additional netuning for unseen congurations) emphasize per-instruction embeddings. Our work diverges by compactly capturing program- level p erformance characteristics using analytical models and fusing them with a lightweight ML mo del for capturing dynamic behaviors. 8 Final Remarks The key lesson from Concorde is that decomposing performance models into simple analytical representations of individual microar- chitectural components, fused together by an ML model capturing higher-order complexities, is very eective . It enables a method that is both extremely fast and accurate. Before concluding, we remark on some limitations of our work and dir ections for future research. Concorde does not obviate the nee d for detailed simulation. It en- ables large-scale design-space explorations not possible with current methods (e.g., Shapley value analysis (§ 6 )), but some analyses will inevitably require more detailed models. Moreover , Concorde needs training data to learn the impact of design changes (e.g., dierent parameters), which we currently obtain using a reference cycle-level simulator . In principle, Concorde could be trained on data from any reference platform, including emulators and real hardware. As an ML approach, Concorde ’s accuracy is inherently statistical. Our results show high accuracy for a vast majority of predictions, but there is a small tail of cases with high errors. W e have analyzed some of the causes of these errors (§ 5.2.1 ), and we believe that further improvements to the analytical models (e.g., explicitly modeling in- memory congestion) can further reduce the tail. But we do not expect that tail cases can be eliminated entirely . Alternatively , a large set of techniques exist for quantifying the uncertainty of such ML mo d- els [ 9 , 10 , 31 ]. Future work on providing condence bounds w ould allow designers to detect predictions with high p otential errors and crosscheck them with other tools. Finally , Concorde was just one example of our comp ositional analytical-ML mo deling approach. W e b elieve that the metho dology is broadly applicable and we hop e that future work will extend it to other use cases, such as modeling multi-threaded systems, uncore components, and other architectures (e .g., accelerators). Acknowledgments W e thank Steve Gribble and Moshe Mishali for their comments on earlier drafts of the paper . W e thank Jichuan Chang, Brad Karp, and Amin V ahdat for discussions and their feedback. W e thank Derek Bruening, Kurt Fellows, Scott Gargash, Udai Muhammed, and Lei W ang for their help in running cycle-level simulations. W e also thank the extended team at SystemsResearch@Google and Google DeepMind who enabled and supporte d this r esearch direction. References [1] 2024. TP U v3 . https://cloud.go ogle.com/tpu/docs/v3 [2] Andreas Abel, Shrey Sharma, and Jan Reineke. 2023. Facile: Fast, Accurate, and Interpretable Basic-Block Throughput Prediction. In IISWC . [3] Jung Ho Ahn, Sheng Li, O Seongil, and Norman P Jouppi. 2013. McSimA +: A Manycore Simulator with Application-level+Simulation and Detailed Microarchitecture Modeling. In ISP ASS . [4] A yaz Akram and Lina Sawalha. 2019. A Survey of Computer Architecture Simulation Techniques and T ools. IEEE Access (2019). [5] Johan Albrecht, Delphine François, and Koen Schoors. 2002. A Shapley Decomposition of Carb on Emissions without Residuals. Energy policy (2002). [6] Marco Antonio Zanata Alves, Carlos Villavieja, Matthias Diener , Francis Birck Moreira, and Philippe Olivier Alexandr e Navaux. 2015. SiN UCA: A V alidated Micro- Architecture Simulator . In HPCC . [7] Amazon. 2023. A WS Unveils Next Generation A WS-Designe d Chips . https://press. aboutamazon.com/2023/11/aws- unveils- next- generation- aws- designed- chips [8] SEZNEC Andre. 2006. A Case for (Partially)- TA gged GEometric Histor y Length Predictors. JILP (2006). [9] Anastasios N. Angelopoulos, Rina Foygel Barb er , and Stephen Bates. 2024. Theoretical Foundations of Conformal Pr ediction. arXiv: 2411.11824 [10] Anastasios N Angelopoulos, Stephen Bates, et al . 2023. Conformal Prediction: A Gentle Introduction. Foundations and Trends ® in Machine Learning (2023). [11] T odd A ustin, Eric Larson, and Dan Ernst. 2002. SimpleScalar: An Infrastructure for Computer System Modeling. Computer (2002). [12] Fabrice Bellard. 2005. QEMU, a Fast and Portable Dynamic Translator . In A TEC . [13] Leopoldo Bertossi, Benny Kimelfeld, Ester Livshits, and Mikaël Monet. 2023. The Shapley Value in Database Management. ACM SIGMOD Record (2023). [14] Nathan Binkert, Bradford Be ckmann, Gabriel Black, Steven K. Reinhardt, Ali Saidi, Arkaprava Basu, Joel Hestness, Derek R. Hower , Tushar Krishna, Somayeh Sardashti, Rathijit Sen, Korey Sewell, Muhammad Shoaib , Nilay V aish, Mark D . Hill, and David A. W ood. 2011. The gem5 Simulator . SIGARCH Comput. A rchit. News (2011). [15] Hadi Brais, Rajshekar Kalayappan, and Preeti Ranjan Panda. 2020. A Sur vey of Cache Simulators. Comput. Surveys (2020). [16] Derek Bruening. 2024. DynamoRIO: Tracing and A nalysis Framework . https://dynamorio.org/page_drcachesim.html [17] Derek Lane Bruening. 2004. Ecient, Transparent, and Comprehensive Runtime Code Manipulation . Ph. D. Dissertation. Massachusetts Institute of T echnology . [18] Victoria Caparrós Cabezas and Markus Püschel. 2014. Extending the Rooine Model: Bottleneck Analysis with Microarchitectural Constraints. In IISW C . [19] Trev or E Carlson, Wim Heirman, and Lieven Eeckhout. 2011. Sniper: Exploring the Level of Abstraction for Scalable and A ccurate Parallel Multi-Core Simulation. In SC . [20] Isha Chaudhar y , Alex Renda, Charith Mendis, and Gagandeep Singh. 2024. COMET: Neural Cost Model Explanation Framework. MLSys . [21] Xi E Chen and T or M Aamodt. 2011. Hybrid Analytical Mo deling of Pending Cache Hits, Data Prefetching, and MSHRs. T ACO (2011). [22] Derek Chiou, Dam Sunwoo, Joonsoo Kim, Nikhil A Patil, William Reinhart, Darrel Eric Johnson, Jebediah K eefe, and Hari Angepat. 2007. FPGA- Accelerated Simulation Technologies (F AST): Fast, Full-System, Cycle- Accurate Simulators. In MICRO . [23] Vidushi Dadu, Sihao Liu, and T ony Nowatzki. 2021. Poly Graph: Exposing the V alue of Flexibility for Graph Processing Accelerators. In ISCA . [24] Christophe Dubach, Timothy Jones, and Michael O’Boyle. 2007. Microarchi- tectural Design Space Exploration Using an Ar chitecture-Centric Approach. In MICRO . [25] Tran V an Dung, Ittetsu Taniguchi, and Hiroyuki T omiyama. 2014. Cache Simulation for Instruction Set Simulator QEMU. In D ASC . [26] Lieven Eeckhout, Sebastien Nussbaum, James E Smith, and K oen De Bosschere . 2003. Statistical Simulation: Adding Eciency to the Computer Designer’s T oolb ox. IEEE Micro (2003). [27] Lieven Eeckhout, John Sampson, and Brad Calder . 2005. Exploiting Program Microarchitecture Independent Characteristics and Phase Behavior for Reduced Benchmark Suite Simulation. In IISW C . [28] Muhammad ES Elrabaa, A yman Hroub, Muhamed F Mudawar , Amran Al- Aghbari, Mohammed Al-Asli, and Ahmad Khayyat. 2017. A V ery Fast Trace-Driven Simula- tion P latform for Chip-Multiprocessors Architectural Explorations. TPDS (2017). [29] Stijn Eyerman, Lieven Eeckhout, T ejas K arkhanis, and James E. Smith. 2006. A Performance Counter Architecture for Computing Accurate CPI Components. In ASPLOS . [30] S. Eyerman, J.E. Smith, and L. Eeckhout. 2006. Characterizing the Branch Misprediction Penalty. In ISP ASS . [31] Jakob Gawlikowski, Cedrique Rovile Njieutcheu T assi, Mohsin Ali, Jongseok Lee, Matthias Humt, Jianxiang Feng, Anna Kruspe, Rudolph Triebel, Peter Jung, Ribana Roscher , Muhammad Shahzad, W en Y ang, Richar d Bamler , and Xiao Xiang Zhu. 2023. A Survey of Uncertainty in Deep Neural Networks. Articial Intelligence Review (2023). 13 A. Nasr-Esfahany et al. [32] Davy Genbrugge , Stijn Eyerman, and Lieven Ee ckhout. 2010. Interval Simulation: Raising the Level of Abstraction in Architectural Simulation. In HPCA . [33] Amirata Ghorbani and James Zou. 2019. Data Shaple y: Equitable V aluation of Data for Machine Learning. In ICML . [34] Nathan Gob er , Gino Chacon, Lei W ang, Paul V Gratz, Daniel A Jimenez, Elvira T eran, Seth Pugsley, and Jinchun Kim. 2022. The Championship Simulator: Architectural Simulation for Education and Competition. arXiv: 2210.14324 [35] Alex Graves and Jürgen Schmidhuber . 2005. Framewise Phoneme Classication with Bidirectional LSTM and other Neural Network Architectures. Neural Networks (2005). [36] Qi Guo, Tianshi Chen, Yunji Chen, and Franz Franchetti. 2015. Accelerating Architectural Simulation via Statistical T echniques: A Survey . IEEE TCAD (2015). [37] T ae Jun Ham, Lisa W u, Narayanan Sundaram, Nadathur Satish, and Margaret Martonosi. 2016. Graphicionado: A High-Performance and Energy-Ecient Accelerator for Graph Analytics. In MICRO . [38] Charles R. Harris, K. Jarrod Millman, Stéfan J. van der W alt, Ralf Gommers, Pauli Virtanen, David Cournapeau, Eric Wieser , Julian T aylor , Sebastian Berg, Nathaniel J. Smith, Robert Kern, Matti Picus, Stephan Hoyer , Marten H. van Kerkwijk, Matthew Brett, Allan Haldane , Jaime Fernández del Río, Mark Wiebe, Pearu Peterson, Pierre Gérard-Marchant, Kevin Sheppard, T yler Reddy , W arren W eckesser , Hameer Abbasi, Christoph Gohlke, and Travis E. Oliphant. 2020. Array Programming with NumPy. Nature (2020). [39] Muhammad Hassan, Chang Hyun Park, and David Black-Schaer . 2021. A Reusable Characterization of the Memory System Behavior of SPEC2017 and SPEC2006. ACM T ACO (2021). [40] Ranjan Hebbar SR and Aleksandar Milenković. 2019. SPEC CP U2017: Performance, Event, and Energy Characterization on the Core i7-8700K. In ICPE . [41] Qijing Huang, Po-An Tsai, Joel S. Emer, and Angshuman Parashar . 2024. Mind the Gap: Attainable Data Movement and Operational Intensity Bounds for T ensor Algorithms. In ISCA . [42] Christopher J Hughes, Vijay S Pai, Parthasarathy Ranganathan, and Sarita V Adve. 2002. RSIM: Simulating Shared-Memory Multiprocessors with ILP Processors. IEEE Computer (2002). [43] Engin Ïpek, Sally A McKee, Rich Caruana, Bronis R de Supinski, and Martin Schulz. 2006. Eciently Exploring Architectural Design Spaces via Predictive Modeling. ACM SIGOPS (2006). [44] PJ Joseph, Kapil V aswani, and Matthew J Thazhuthaveetil. 2006. A Predictive Performance Mo del for Superscalar Processors. In MICRO . [45] PJ Joseph, Kapil V aswani, and Matthew J Thazhuthaveetil. 2006. Construction and Use of Linear Regression Models for Processor Performance Analysis. In HPCA . [46] Ajay Joshi, Aashish Phansalkar , Lieven Eeckhout, and Lizy Kurian John. 2006. Measuring Benchmark Similarity using Inherent Program Characteristics. IEEE TC (2006). [47] Sagar Karandikar , Howard Mao, Donggyu Kim, David Biancolin, Alon Amid, Dayeol Lee, Nathan Pemberton, Emmanuel Amaro, Colin Schmidt, Aditya Chopra, et al . 2018. FireSim: FPGA- Accelerated Cycle-Exact Scale-Out System Simulation in the Public Cloud. In ISCA . [48] T ejas S. Karkhanis and James E. Smith. 2004. A First-Order Superscalar Processor Model. In ISCA . [49] T ejas S. Karkhanis and James E. Smith. 2007. Automated Design of Application Specic Superscalar Processors: An Analytical Approach. In ISCA . [50] A viral Kumar , Amir Y azdanbakhsh, Milad Hashemi, Kevin Swersky , and Sergey Levine. 2022. Data-Driven Oine Optimization for Architecting Hardware Accelerators. In ICLR . [51] Benjamin C Lee and David M Brooks. 2006. Accurate and Ecient Regression Modeling for Microarchitectural Performance and Power Prediction. In ASPLOS . [52] Benjamin C Lee and David M Brooks. 2007. Illustrative Design Space Studies with Microarchitectural Regression Models. In HPCA . [53] Jiangtian Li, Xiaosong Ma, Karan Singh, Martin Schulz, Bronis R de Supinski, and Sally A McKee. 2009. Machine Learning Based Online Performance Prediction for Runtime Parallelization and T ask Scheduling. In ISP ASS . [54] Lingda Li, Thomas Flynn, and Adolfy Hoisie. 2023. Learning Independent Program and Architecture Representations for Generalizable Performance Modeling. arXiv: 2310.16792 [55] Lingda Li, Santosh Pandey , Thomas Flynn, Hang Liu, No el Wheeler, and Adolfy Hoisie. 2022. SimNet: Accurate and High-Performance Computer Architecture Simulation using Deep Learning. In ACM SIGMETRICS/IFIP PERFORMANCE . [56] Ilya Loshchilov and Frank Hutter . 2019. Decoupled W eight De cay Regularization. In ICLR . [57] Jason Lowe-Power . 2024. O3CP U . https://www.gem5.org/documentation/ general_docs/cpu_models/O3CP U [58] Jason Lowe-Power . 2024. Ruby Memor y System . https://www.gem5.org/ documentation/general_docs/ruby/ [59] Jason Lowe-Power , Abdul Mutaal Ahmad, A yaz Akram, Mohammad Alian, Rico Amslinger , Matteo Andreozzi, A drià Armejach, Nils Asmussen, Brad Be ckmann, Srikant Bharadwaj, Gab e Black, Gedare Bloom, Bobby R. Bruce, Daniel Rodrigues Carvalho, Jeronimo Castrillon, Lizhong Chen, Nicolas Derumigny , Stephan Diestelhorst, W endy Elsasser, Carlos Escuin, Marjan Fariborz, Amin Farmahini- Farahani, Pouya Fotouhi, Ryan Gambord, Jayneel Gandhi, Dibakar Gop e, Thomas Grass, Anthony Gutierrez, Bagus Hanindhito, Andreas Hansson, Swapnil Haria, Austin Harris, Timothy Hayes, Adrian Herrera, Matthew Horsnell, Syed Ali Raza Jafri, Radhika Jagtap, Hanhwi Jang, Reiley Je yapaul, Timothy M. Jones, Matthias Jung, Subash Kannoth, Hamidreza Khaleghzadeh, Yuetsu Kodama, Tushar Krishna, T ommaso Marinelli, Christian Menard, Andrea Mondelli, Miquel Moreto, Tiago Mück, Omar Naji, Krishnendra Nathella, Hoa Nguyen, Nikos Nikoleris, Lena E. Olson, Marc Orr , Binh Pham, Pablo Prieto, Trivikram Reddy, Alec Roelke, Mahyar Samani, Andreas Sandberg, Javier Setoain, Boris Shingarov , Matthew D. Sinclair , T uan T a, Rahul Thakur , Giacomo T ravaglini, Michael Upton, Nilay V aish, Ilias V ougioukas, William W ang, Zhengrong W ang, Norbert W ehn, Christian W eis, David A. W ood, Hongil Y oon, and Éder F. Zulian. 2020. The gem5 Simulator: V ersion 20.0+. arXiv: 2007.03152 [60] Richard TB Ma, Dah Ming Chiu, John CS Lui, Vishal Misra, and Dan Rub enstein. 2007. Internet Economics: The Use of Shapley V alue for ISP Settlement. In ACM CoNEXT . [61] Charith Mendis, Alex Renda, Saman Amarasinghe, and Michael Carbin. 2019. Ithemal: Accurate, Portable and Fast Basic Block Throughput Estimation using Deep Neural Networks. In ICML . [62] Microsoft. 2024. A nnouncing the preview of new Azur e VMs base d on the A zure Cobalt 100 processor . https://techcommunity.micr osoft.com/blog/azurecompute/ announcing- the- previe w- of- new- azure- vms- based- on- the- azure- cobalt- 100- processor/4146353 [63] Jason E Miller, Harshad Kasture, George Kurian, Charles Gruenwald, Nathan Beckmann, Christopher Celio, Jonathan Eastep, and Anant Agarwal. 2010. Graphite: A Distributed Parallel Simulator for Multicores. In HPCA . [64] Christoph Molnar. 2020. Interpretable machine learning . Lulu. com. [65] Stefano Moretti, Fioravante Patrone, and Stefano Bonassi. 2007. The Class of Microarray Games and the Relevance Index for Genes. T op (2007). [66] Ramasuri Narayanam and Y adati Narahari. 2010. A Shapley V alue-Based Approach to Discov er Inuential Nodes in Social Netw orks. IEEE T -ASE (2010). [67] Quan M. Nguyen and Daniel Sanchez. 2023. Phloem: Automatic Acceleration of Irregular Applications with Fine-Grain Pipeline Parallelism. In HPCA . [68] Sébastien Nussbaum and James E Smith. 2001. Modeling Superscalar Processors via Statistical Simulation. In P ACT . [69] Pablo Montesinos Ortego and Paul Sack. 2004. SESC: SuperESCalar simulator . In ECRTS . [70] Santosh Pandey , Lingda Li, Thomas Flynn, A dolfy Hoisie, and Hang Liu. 2022. Scalable De ep Learning-Based Microarchitecture Simulation on GPUs. In SC . [71] Santosh Pandey , Amir Y azdanbakhsh, and Hang Liu. 2024. TA O: Re- Thinking DL- based Microarchitecture Simulation. In ACM SIGMETRICS/IFIP PERFORMANCE . [72] A vadh Patel, Furat Afram, and Kanad Ghose. 2011. MARSS: A Full System Simulator for Multicore x86 CP Us. In D A C . [73] Andrea Pellegrini, Nigel Stephens, Magnus Bruce, Y asuo Ishii, Joseph Pusdesris, Abhishek Raja, Chris Abernathy, Jinson Koppanalil, Tushar Ringe, Ashok T ummala, et al . 2020. The Arm Neov erse N1 Platform: Building Blocks for the Next-Gen Cloud-to-Edge Infrastructure SoC. IEEE Micro (2020). [74] Alejandro Rico , Alejandro Duran, Felipe Cabar cas, Y oav Etsion, Ale x Ramirez, and Mate o Valer o. 2011. T race-driven Simulation of Multithreaded Applications. In ISPASS . [75] Daniel Sanchez and Christos Kozyrakis. 2013. ZSim: Fast and Accurate Microarchitectural Simulation of Thousand-Core Systems. In ISCA . [76] Kiran Seshadri, Berkin Akin, James Laudon, Ravi Narayanaswami, and Amir Y azdanbakhsh. 2022. An Evaluation of Edge TP U Accelerators for Conv olutional Neural Networks. In IISWC . [77] André Sezne c. 2011. A New Case for the T AGE Branch Pr edictor . In MICRO . [78] Lloyd S Shapley . 1953. A V alue for n-Person Games. Contribution to the Theory of Games (1953). [79] Timothy Sherwood, Erez Perelman, and Brad Calder . 2001. Basic Block Distribution Analysis to Find Periodic Behavior and Simulation Points in Applications. In P ACT . [80] Timothy Sher wood, Erez Perelman, Greg Hamerly, and Brad Calder . 2002. Automatically Characterizing Large Scale Program Behavior . In ASPLOS . [81] Timothy Sher wood, Suleyman Sair , and Brad Calder . 2003. P hase Tracking and Prediction. In ISCA . [82] Kevin Skadron, Margaret Martonosi, David I August, Mark D Hill, David J Lilja, and Vijay S Pai. 2003. Challenges in Computer Architecture Evaluation. IEEE Computer (2003). [83] Ondřej S ` ykora, P hitchaya Mangpo Phothilimthana, Charith Mendis, and Amir Y azdanbakhsh. 2022. GRANITE: A Graph Neural Network Model for Basic Block Throughput Estimation. In IISWC . [84] Rafael Ubal, Julio Sahuquillo, Salvador Petit, and Pedr o Lopez. 2007. Multi2Sim: A Simulation Framework to Evaluate Multicore-Multithreaded Processors. In SBAC-P AD . [85] Amin Vahdat. 2024. Introducing Google Axion Processors, our new Arm-based CP Us . https://cloud.go ogle.com/blog/products/compute/introducing- googles- new- arm- based- cpu 14 Concorde: Fast and Accurate CP U Performance Mo deling with Compositional Analytical-ML Fusion [86] Sam V an den Steen, Sander De Pestel, Moncef Mechri, Stijn Eyerman, Trevor Carlson, David Black-Schaer , Erik Hagersten, and Lieven Eeckhout. 2015. Micro- Architecture Independent Analytical Processor Performance and Pow er Modeling. In ISPASS . [87] Sam Van den Steen, Stijn Eyerman, Sander De Pestel, Moncef Mechri, Trevor E. Carlson, David Black-Schaer , Erik Hagersten, and Lieven Eeckhout. 2016. Analytical Processor Performance and Power Modeling Using Micro- Architecture Independent Characteristics. IEEE TC (2016). [88] Ashish V aswani, Noam Shazeer , Niki Parmar , Jakob Uszkoreit, Llion Jones, Aidan N. Gomez, Łukasz Kaiser , and Illia Polosukhin. 2017. Attention Is All Y ou Need. In NeurIPS . [89] Nan Wu and Yuan Xie. 2022. A Survey of Machine Learning for Computer Architecture and Systems. Comput. Surveys (2022). [90] Roland E W underlich, Thomas F W enisch, Babak Falsa, and James C Hoe. 2003. SMARTS: Accelerating Microarchitecture Simulation via Rigorous Statistical Sampling. In ISCA . [91] Mingyu Yan, Xing Hu, Shuangchen Li, Abanti Basak, Han Li, Xin Ma, Itir Akgun, Y ujing Feng, Peng Gu, Lei Deng, Xiaochun Y e, Zhimin Zhang, Dongrui Fan, and Y uan Xie. 2019. Alleviating Irregularity in Graph Analytics A cceleration: a Hardware/Software Co-Design Approach. In MICRO . [92] Ahmad Y asin. 2014. A T op-Down Method for Performance Analysis and Counters Architecture. In ISP ASS . [93] Amir Y azdanbakhsh, Christof Angermueller , Berkin Akin, Y anqi Zhou, Albin Jones, Milad Hashemi, Kevin Swersky , Satrajit Chatterjee, Ravi Narayanaswami, and James Laudon. 2021. Apollo: Transferable Architecture Exploration. arXiv: 2102.01723 [94] Wu Y e, Narayanan Vijaykrishnan, Mahmut Kandemir , and Mary Jane Ir win. 2000. The Design and Use of SimplePower: A Cycle- Accurate Energy Estimation T ool. In DAC . [95] Matt T Y ourst. 2007. PTLsim: A Cycle Accurate Full System x86-64 Microar chi- tectural Simulator . In ISP ASS . [96] Xinnian Zheng, Lizy K John, and Andreas Gerstlauer. 2016. Accurate P hase-Level Cross-Platform Power and Performance Estimation. In DA C . 15
Original Paper
Loading high-quality paper...
Comments & Academic Discussion
Loading comments...
Leave a Comment