GraFPrint: A GNN-Based Approach for Audio Identification
This paper introduces GraFPrint, an audio identification framework that leverages the structural learning capabilities of Graph Neural Networks (GNNs) to create robust audio fingerprints. Our method constructs a k-nearest neighbor (k-NN) graph from t…
Authors: Aditya Bhattacharjee, Shubhr Singh, Emmanouil Benetos
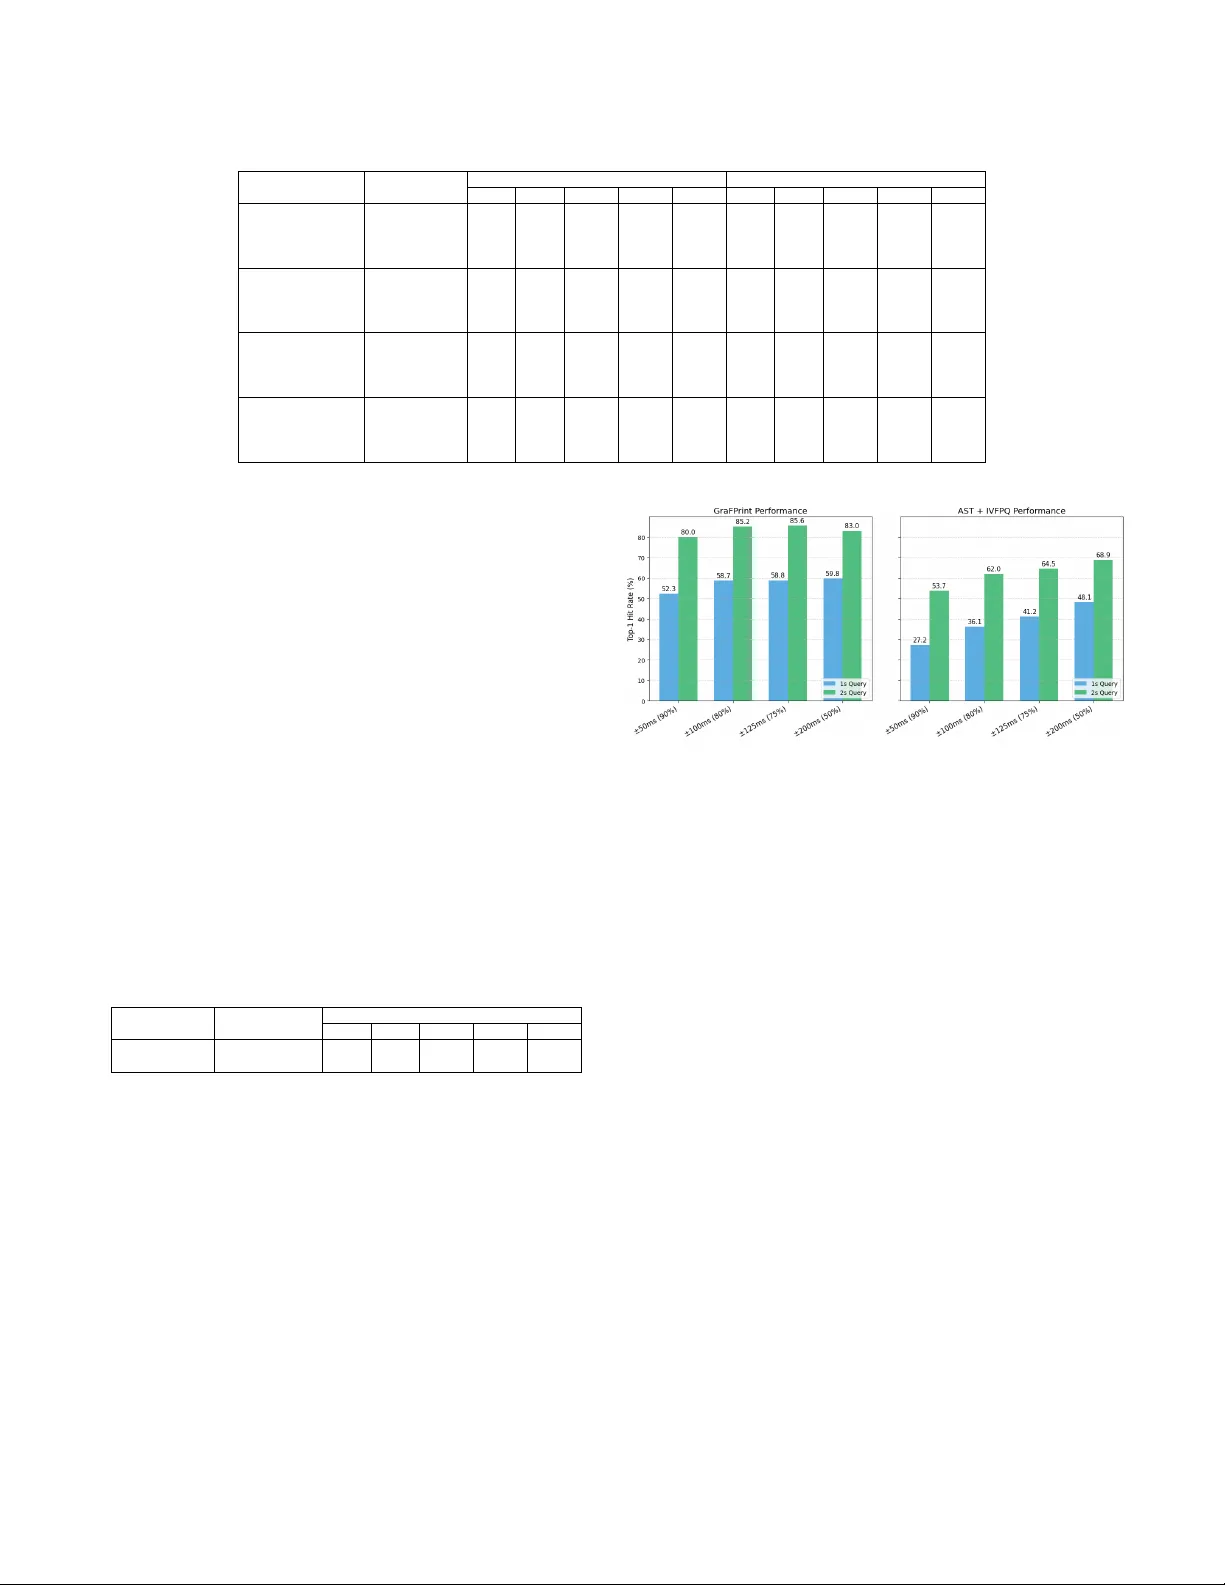
GraFPrint: A GNN-Based Approach for Audio Identification Aditya Bhattacharjee, Shubhr Singh, Emmanouil Benetos School of Electronic Engineering and Computer Science, Queen Mary Univ ersity of London, UK Abstract —This paper introduces GraFPrint, an audio identification framework that leverages the structural learning capabilities of Graph Neural Networks (GNNs) to create robust audio fingerprints. Our method constructs a k-nearest neighbour (k-NN) graph from time-frequency rep- resentations and applies max-relative graph con v olutions to encode local and global information. The network is trained using a self-supervised contrastive approach, which enhances r esilience to ambient distortions by optimizing feature representation. GraFPrint demonstrates superior performance on large-scale datasets at various levels of granularity , proving to be both lightweight and scalable, making it suitable for real- world applications with extensive reference databases. Index T erms —audio identification, graph neural networks, audio fin- gerprinting I . I N T RO D U C T I O N Automatic audio identification is a process that matches a query audio snippet to a reference audio recording stored in a database, with the goal of accurately identifying the recording, ev en in noisy en vironments. This system encodes audio recordings into compact audio fingerprints, designed to be efficient for storage and retrieval while remaining robust against various acoustic distortions. In the context of identification of musical recordings, such a system has various applications such as identifying an unknown song in the presence of other noisy sources or for enforcing copyright in online content. Over the past tw o decades, numerous approaches ha ve been dev el- oped for automatic audio identification. Landmark-based methods [1] [2] [3] focus on generating audio fingerprints by extracting prominent peaks from time-frequency representations, such as spectrograms. T o enhance the robustness of these peak-based fingerprints against transformations, binary hashing techniques are employed, mapping and storing the relative positions of the peaks in the spectrogram. In contrast, neural network-based approaches leverage self-supervised contrastiv e training [4] to learn an embedding space that is resilient to signal distortions. Architectures such as con volutional neural networks (CNNs) [5] [6] are commonly employed encoders, while more recent approaches have explored the use of self-attention and transformer models [7] [8]. Unlike landmark-based methods, neural network architectures can learn latent, noise-in variant patterns directly from data, eliminating the need for feature engineering. The search and retrieval process in these systems typically employs efficient approximate nearest- neighbour search algorithms. Howe ver , overall system performance critically depends on the quality of the learned embeddings. As database sizes increase, particularly with short and noisy audio queries, retriev al accuracy can degrade if the embedding model lacks robustness. The key challenge lies in developing embedding models that maintain high discriminative po wer across v arious audio conditions and database scales. This highlights the need for adv anced * A. Bhattacharjee and S. Singh contributed equally to this work. A. Bhattacharjee and S. Singh are research students at the UKRI Centre for Doctoral Training in Artificial Intelligence and Music, supported jointly by UK Research and Innovation [grant number EP/S022694/1] and Queen Mary Univ ersity of London. Fig. 1. Overvie w of the GraFPrint framework; o verlapping audio segments are input into the contrastiv ely trained neural fingerprinter . The output se gment embedding space facilitates the approximate nearest neighbour search for matching query audio to the corresponding reference audio fingerprint. methods that can learn more robust and compact audio representa- tions, effecti vely balancing accuracy and scalability while lev eraging efficient search algorithms for reliable identification in real-world scenarios with extensi ve reference databases. GNNs hav e recently gained attention for their ability to capture and preserve intricate structural patterns within data, even when the data is not naturally graph-structured. Unlike traditional methods, such as Con volutional Neural Networks (CNNs), which excel at processing grid-like data, GNNs are particularly effecti ve in learning from non- Euclidean spaces by aggregating features across nodes based on their relationships, thus retaining important structural information [9]. In computer vision, GCNs have been adapted and benchmarked for image classification tasks [10]. A similar approach [11] has been applied to audio tagging, where it has outperformed traditional CNN and attention-based architectures. Building on these successes, we propose the GraFPrint (Graph- based Audio Fingerprint) framew ork. Inspired by the landmark-based audio fingerprinting approaches, which represent a spectrogram as a “constellation map” of time-frequency points, GraFPrint models the latent relationships between points using graph neural networks. This approach harnesses the strengths of GNNs to improve the rob ustness and efficiency of audio identification. The main contributions of this work are: • A novel GNN-based approach for accurate and scalable auto- matic audio identification. • Evaluation of our approach with a large reference database, demonstrating the ef ficacy of our lightweight GNN encoder in audio identification tasks. • Benchmarking of our framework for matching queries to ref- erence data at different lev els of granularity , showcasing its adaptability for various use cases. Our code has been made av ailable for reproducibility at https://github.com/chymaera96/GraFP . I I . G R A F P R I N T F R A M E W O R K In this section, we define the design of the framework. Figure 1 shows the schematics of the architecture and the data pipeline. A. F eature Extraction The input features for the neural network encoder are computed by randomly extracting a t -second-long audio segment s from the input data. A log-mel spectrogram is computed from s . Let S represent the original log-mel spectrogram with dimensions with F frequency bins and T time frames. S and its augmented view S ′ (refer to section III-C) are used to form positi ve data pairs for the contrastive learning. In order to preserve the positional information of the time-frequency points, the spectrograms are concatenated with positional encodings for the frequency and time axis. For a batch B of spectrograms, the resultant tensor S ∈ R B × 3 × F × T comprises three channels: a time index and a frequency index channel in addition to the spectrogram amplitudes. B. Encoder Network The feature map S is passed through a neural network block that consists of strided conv olutional layers. This allows the network to combine rele vant local features in the time-frequency points and results in a more compact representation X 0 ∈ R B × C × H × W . Here, H , W , and C represent the height, width, and number of channels, respectiv ely . Let P ( c ) denote a single data example in X 0 . P ( c ) = p ( c ) 11 p ( c ) 12 · · · p ( c ) 1 W p ( c ) 21 p ( c ) 22 · · · p ( c ) 2 W . . . . . . . . . . . . p ( c ) H 1 p ( c ) H 2 · · · p ( c ) H W , c = 1 , 2 , . . . , C (1) Each time-frequency point p f ,t is transformed into a d -dimensional latent embedding using a non-linear projection layer f ( · ) : f : R B × C → R B × d The projection is implemented through a 1 × 1 conv olution layer followed by batch normalisation and non-linear activ ation. W e flatten this feature map to obtain a set of projected points P ′ ∈ R d × N which can be considered as an unordered set of N = H · W nodes in an undirected graph G . T o establish the graph structure, a k-nearest neighbour (k-NN) algorithm is applied. For each node in the set P ′ , the algorithm identifies its k closest neighbours based on Euclidean distance in the feature space. The graph structure, thus formed, is an abstraction for learning in variance to transformations (refer to section III-C) that may be relev ant to the audio identification task. The node embeddings of the graph are subsequently refined through graph con volution layers designed to facilitate information exchange between neighbouring nodes via a message-passing oper- ation. Specifically , the update for a node x i utilises a max-relativ e graph con volution [12] as follows: g ( · ) = x ′′ = concat ( x i , max( x j − x i ) | j ∈ N ( x i )) (2) h ( · ) = x ′ = x ′′ W update , (3) where N ( x i ) denotes the set of neighbors for node x i , and x ′ and x ′′ represent the node embeddings updated through various operations. W e refer to the combination of these operations as GraphCon v . T o enhance feature diversity of the feature space and mitigate the risk of ov ersmoothing [13], a linear layer is applied to each node before and after the GraphCon v operation, accompanied by a non-linear activ ation function. The updated graph con volution operation for a node can thus be represented as: y i = σ ( GraphCon v ( W in x i )) W out + x i , (4) where y i denotes the updated node embedding, σ represents a non- linear activ ation function, and W in and W out are the weights of fully connected layers applied respectively before and after the Gr aphCon v operation. This framework enables the dynamic construction of the graph, which adapts to the features and relationships within the data as they ev olve through the network. This adaptability enhances the graph’ s ability to capture complex patterns and dependencies among the node embeddings, enabling it to learn a latent space which is robust to environmental distortions. Subsequently , a feed-forward network (FFN) is applied on the re- fined node embeddings. Originally introduced within the Transformer architecture, an FFN typically consists of two fully connected linear layers separated by a non-linear activ ation function, such as ReLU. Each GraphCon v and FFN block is follo wed by a strided 2-D con- volution layer to downsample the feature space. The do wnsampling layer reduces the number of nodes that are input to the subsequent layers, thus decreasing the o verall computational burden of the k-NN graph computation. A graph embedding is obtained by average-pooling the individual node embeddings in the graph. The resulting latent embedding is projected into a 128-dimensional representation z using a fully- connected projection layer . C. Contrastive T raining The encoder network is trained using a simple contrastiv e setup similar to the one used in [5]. Gi ven a log-mel spectrogram S with F frequency bins and T time frames, a data augmentation function A ( · ) uses a series of transformations to produce an augmented view S ′ = A ( S ) ∈ R F × T (refer to section III-C). The training objectiv e aligns representations of different views of the same sample (forming positiv e pairs), bringing them closer in the embedding space while pushing apart representations of different samples (forming negativ e pairs). This is achie ved using the normalized temperature-scaled cross-entropy (NT -Xent) loss function [4]. Giv en a batch of N samples, each with an augmented view , resulting in 2 N views, the loss for a positive pair ( z i , z j ) is: ℓ ( i, j ) = − log exp( sim ( z i , z j ) /τ ) P 2 N k =1 ⊮ [ k = i ] exp( sim ( z i , z k ) /τ ) (5) where sim ( · ) is cosine similarity , τ is a temperature parameter , and ⊮ [ k = i ] is an indicator function. The total loss for the batch is the av erage overall positiv e pairs: L = 1 2 N N X k =1 [ ℓ (2 k − 1 , 2 k ) + ℓ (2 k , 2 k − 1)] (6) D. Search and Retrieval The audio identification framework is e valuated for the robustness of the retrie val process against noisy transformations applied to small query audio se gments. Given the query set and the reference database (see section III-B), we divide the audio wa veforms into t -second- long overlapping segments and compute the audio fingerprints for each segment using the embedding model. Let { q i } m i =1 be the set of audio fingerprints deriv ed from the m overlapping query segments. For each q i , we perform an approximate nearest-neighbour (ANN) search in our reference database to identify the fingerprints that match the query . The product-quantised in verted file index search (IVF-PQ), implemented using F AISS [14], is employed as the ANN algorithm. Let I ∈ Z + m × n represent the set of indices retriev ed by the ANN search, where n denotes the number of probes used in the search. T o accurately align the query and reference sequences, we apply an offset compensation to the retrie ved indices I to adjust for predicting the starting segment index. Specifically , I ∗ [ i, j ] = I [ i, j ] − i (7) W e extract the set of unique indices C from I ∗ and determine the matched reference inde x ˆ i by finding the candidate sequence that maximises the sequence-level similarity score, computed using the inner product of the query fingerprints and the corresponding offset- adjusted reference fingerprints. This is giv en by ˆ i = arg max k ∈C 1 m m X j =1 ⟨ q j , r j + k ⟩ ! , (8) where r j + k represents the reference fingerprint at the aligned index. I I I . E X P E R I M E N TAL S E T U P A. Experiment Details The proposed model is trained using two data-parallelised NVIDIA A100 GPUs for 400 epochs. The contrastive learning utilises the Adam optimizer and the learning rate during training is adjusted using a cosine decay scheduler . T able I provides the hyperparameters used for training and ev aluation. T ABLE I E X P ER I M E N TAL C O N FI G U R A T I O N S F O R T H E P RO P O S E D F R A M E WO R K Parameter V alue Size of training dataset 8000 Sampling rate 16,000 Hz log-power Mel-spectrogram size F × T 64 × 32 Fingerprint { window length, hop } { 1s, 0.1s } Fingerprint dimension 128 T emperature parameter τ 0.05 Batch size B 256 Number of epochs 400 IVF-PQ configuration Number of centroids 256 Codebase size 2 64 B. Dataset W e use the F r ee Music Arc hive (FMA) [15] dataset for our experiments. • T raining set : The fma-small subset containing 8K 30- second-long examples is used for training the models. • Reference database : W e conduct our experiments by comput- ing the reference fingerprints using the fma-medium subset containing 25K 30-second long examples. Further , we scale up the search experiments with the fma-large subset containing 106K segments. • Query database : W e extract two sets of 2000 query segments from each of the reference databases. The queries are 1 to 5- second long audio segments which are transformed using a test subset of the background noise and room impulse responses discussed in the next subsection. W e have made the query sets av ailable for reproducibility . C. Data Augmentation The following data augmentation methods are used in the con- trastiv e training: • Time offset: to learn inv ariance to small time shifts that may occur in a query . The primary experiments are conducted with an of fset of ± 50 ms. Further, we in vestigate the effect of coarser audio identification use cases with larger time offsets (refer to Section IV). • Background noise mixing: simulates the presence of en viron- mental noise in a real-life use case of audio identification by additiv e mixing of noise waveforms and the reference audio at different signal-to-noise ratios. W e use nearly 6 hours of noise recordings from the MUSAN dataset [16], which consists of ambient settings such as r estaurant , home and street . • Conv olutional rev erb: ambient reverberation is simulated by con volving room impulse response (RIR) filters on the in- put waveform. W e use the Aachen Room Impulse Response Database [17] for training and ev aluation. D. Baseline Method As an effectiv e benchmark, we implement a baseline inspired by the transformer-based neural encoder proposed in [8], which has shown promise for audio fingerprinting. In the absence of available implementations of this approach, our implementation adapts the audio spectrogram transformer (AST) [18] architecture, incorporating the temporal patch embedding layer from [8]. W e train this baseline using a simple contrasti ve learning setup, closely follo wing the input features and hyperparameters described in their work. E. Evaluation Metrics The proposed framework is ev aluated based on the top-1 hit rate on the query and reference databases. The top-1 hit rate for the audio identification task is the percentage of times the framew ork correctly retriev es the exact match from a reference database when gi ven a set of noisy audio queries. This is giv en by T op-1 Hit Rate = Number of Correct Matches T otal Number of Queries × 100% (9) A correct match is observed when the retrieved reference item matches the query within a time error margin. This margin determines the granularity of the audio identification process. T able II and III compares the performance of v arious framew orks within the allo wed margin of ± 50 ms. Further, we analyse the effect of changing the granularity on the retriev al rates. I V . R E S U L T S A N D D I S C US S I O N W e test the robustness of our audio identification framework in comparison to reported metrics of other state-of-the-art frameworks. T o compare the top-1 hit on our query set, we compute the au- dio fingerprints the reference database from fma-medium . Noisy queries are produced using the augmentation strategies discussed in section III-C. W e benchmark performance under various signal-to- noise (SNR). T o study the effect of impulse response con volution on the performance, we compare the metrics in the presence and absence of con volutional reverb . T able II shows that the GraFPrint model consistently outperforms CNN and transformer -based setups. Retriev al rates are lower for smaller queries, as longer queries ben- efit from overlapping segments, making identification more reliable by mitigating single erroneous matches. W e also observe that the presence of conv olutional rev erb leads to increased mismatches in all the benchmarked methods. For 1-second queries, our model shows T ABLE II T OP - 1 H I T R A T E ( % ) C O M PAR I S O N I N T H E S E G M E N T - L E V E L S E A RC H I N D I FF E R E N T N O I S Y E N V I RO N M E N T S F O R V A R I E D Q U ERY L E N G T H S . T H E R E F ER E N C E DAT A BA S E U S E D F O R T H E S E E X P E R I M EN T S I S D E R I V E D F RO M F M A - M E D I U M . Method Query Length Noise Noise + Reverb 0dB 5dB 10dB 15dB 20dB 0dB 5dB 10dB 15dB 20dB NAFP [5] 1s 50.7 69.7 73.7 76.0 76.9 20.8 43.9 55.5 58.5 58.9 2s 71.0 83.4 85.5 87.6 87.5 37.8 65.6 73.5 75.2 76.7 3s 77.7 84.8 88.9 89.2 89.1 50.1 72.6 80.0 79.5 80.1 5s 82.6 89.2 90.2 90.5 91.2 60.2 79.1 83.4 82.8 83.1 TE + LSH [8] 1s 66.6 82.6 87.6 90.0 90.6 44.8 62.6 73.8 79.4 82.0 2s 80.4 88.2 91.6 93.2 94.8 63.4 78.2 84.6 86.0 85.4 3s 83.2 88.4 92.6 94.4 95.2 71.6 82.6 85.6 86.2 87.4 5s 85.6 90.0 92.8 94.2 95.8 80.0 87.0 87.1 87.6 87.2 TE + HT [8] 1s 64.9 81.7 87.9 90.1 90.9 41.9 62.0 74.6 79.2 81.2 2s 80.2 89.4 93.1 94.1 94.9 61.4 80.8 85.0 87.5 88.3 3s 84.7 90.8 95.5 96.3 97.1 70.7 84.1 88.6 89.0 90.1 5s 88.0 93.4 95.3 96.2 97.4 80.6 88.6 90.8 91.3 91.5 GraFPrint (Ours) 1s 63.9 83.6 93.5 97.0 98.8 52.3 68.1 79.2 85.3 89.4 2s 85.7 95.1 98.6 99.4 99.8 80.0 88.6 94.7 94.6 96.4 3s 93.3 98.3 99.3 99.6 99.9 88.7 92.9 96.4 96.4 96.6 5s 97.7 99.7 99.5 99.8 99.9 93.3 95.9 97.3 97.6 97.7 an 11.6pp performance drop when rev erb is introduced, compared to 21.8pp for the best baseline. Con volutional reverb is correlated to the original audio, leading to a more challenging augmentation scenario. T o scale up our search experiments, we use a reference database deriv ed from fma-large , which increases the possibility of mis- matches during retriev al. T able III compares the retriev al rates of GraFPrint with the AST baseline for queries with background mixing at dif ferent SNRs and in the presence of con volutional re verb . Under similar training and testing conditions, our framework outperforms the baseline by a minimum of 20.5pp across all conditions. Despite being trained with limited data, the GraFPrint model generalizes effecti vely to a large reference database, demonstrating its robustness and efficiency . The scalability of GraFPrint is further e videnced by its efficient use of computational resources. The encoder network has approximately 18M learnable parameters, compared to 45M in the AST baseline. Unlike the transformer encoder in [8], which requires large training batches, our setup sho wed only marginal performance gains with larger batches. T ABLE III T OP - 1 H I T R A T E P E R F OR M A N C E ( % ) C O M PA RI S O N F O R T H E S E G ME N T - LE V E L S E A R CH ON A S C A L E D R E F E R EN C E D A TA BA S E D E R IV E D F RO M F M A - L A R G E . Query Length Method Noise + Reverb 0dB 5dB 10dB 15dB 20dB 1s AST + IVFPQ 22.2 26.7 29.3 37.0 40.8 GraFPrint 42.7 61.8 71.6 81.3 83.8 While finer alignment of the query and reference fingerprints can improv e accuracy , it may reduce retriev al efficiency and robustness. T o assess the impact of granularity on retriev al performance, we relax the time error margin during ev aluation from ± 50 ms to ±{ 100, 125, 250 } ms, and train models with corresponding time offsets in the augmentation process. This relaxation also enables the use of coarser fingerprints with less overlap. Figure 2 sho ws the top-1 hit rates v ary across models trained with dif ferent time offsets consistent with four lev els of granularity . F or 2-second queries, the fine-grained approach leads to more ov erlapping fingerprints to offset possible mismatches. Howe ver , this is balanced out by the effect of a larger reference database. In contrast, 1-second queries, with only a single fingerprint, show lower retriev al rates due to a higher likelihood of mismatches. As the overlap decreases, so does the gap in retriev al rates between 1-second and 2-second queries ( 27 . 7 pp → 13 . 2 pp for GraFPrint ). In addition to the effect of retriev al performance, a larger reference Fig. 2. Comparison of top-1 hit rates at different levels of granularity . The horizontal axis shows the time offset used during training and the corresponding fingerprinting ov erlap percentage. database has larger storage requirements. For instance, changing the ov erlap from 0.5s to 0.9s increases the reference database size by 5 times. V . C O N C L U S I O N S In this work, we proposed a GNN-based embedding framew ork for audio identification that transforms time-frequency points into graph nodes, connected by their nearest neighbours in the feature space. This graph structure captures complex audio patterns, with node embeddings refined through graph con volutions and a feed- forward network to enhance robustness and discriminativ e power . The frame work is trained using a self-supervised contrasti ve approach designed to learn in variance to the presence of ambient noise and rev erberation. W e observ e that the model ef fectively handles ambient noise and re verberation, achieving competitive performance on large- scale databases and supporting both coarse and fine-grained align- ment. A limitation of our graph-based approach is the slowdo wn in training due to the computational complexity of dynamically constructing and updating the k-NN graph, which worsens with larger datasets and more nodes. Exploring more efficient graph construction could mitigate this issue and enhance training efficiency . As our approach focuses on the neural architecture for learning the optimal and robust embedding space for identification of audio segments, we use simple quantization techniques for embedding storage and retriev al. This presents a potential for using the graph structure for data-driv en hashing methods. R E F E R E N C E S [1] A. W ang, “The shazam music recognition service, ” Communications of the A CM , vol. 49, no. 8, pp. 44–48, 2006. [2] J. Six and M. Leman, “Panako: a scalable acoustic fingerprinting system handling time-scale and pitch modification, ” in 15th International Society for Music Information Retrie val Confer ence (ISMIR-2014) , 2014. [3] R. Sonnleitner and G. Widmer , “Quad-based audio fingerprinting robust to time and frequency scaling. ” in DAFx , 2014, pp. 173–180. [4] T . Chen, S. K ornblith, M. Norouzi, and G. Hinton, “ A simple frame- work for contrastive learning of visual representations, ” in International confer ence on machine learning . PMLR, 2020, pp. 1597–1607. [5] S. Chang, D. Lee, J. P ark, H. Lim, K. Lee, K. K o, and Y . Han, “Neural audio fingerprint for high-specific audio retriev al based on contrastive learning, ” in ICASSP 2021-2021 IEEE International Conference on Acoustics, Speech and Signal Pr ocessing (ICASSP) . IEEE, 2021, pp. 3025–3029. [6] X. W u and H. W ang, “ Asymmetric contrastive learning for audio fingerprinting, ” IEEE Signal Pr ocessing Letters , vol. 29, pp. 1873–1877, 2022. [7] A. Singh, K. Demuynck, and V . Arora, “ Attention-based audio embed- dings for query-by-example, ” arXiv preprint , 2022. [8] ——, “Simultaneously learning robust audio embeddings and balanced hash codes for query-by-example, ” in ICASSP 2023-2023 IEEE Interna- tional Confer ence on Acoustics, Speec h and Signal Pr ocessing (ICASSP) . IEEE, 2023. [9] G. Li, M. Muller, A. Thabet, and B. Ghanem, “Deepgcns: Can gcns go as deep as cnns?” in Pr oceedings of the IEEE/CVF international confer ence on computer vision , 2019, pp. 9267–9276. [10] K. Han, Y . W ang, J. Guo, Y . T ang, and E. W u, “V ision gnn: An image is worth graph of nodes, ” Advances in neural information pr ocessing systems , vol. 35, pp. 8291–8303, 2022. [11] S. Singh, C. J. Steinmetz, E. Benetos, H. Phan, and D. Sto well, “ Atgnn: Audio tagging graph neural network, ” IEEE Signal Pr ocessing Letters , 2024. [12] G. Li, M. M ¨ uller , A. Thabet, and B. Ghanem, “Can gcns go as deep as cnns, ” arXiv pr eprint arXiv:1904.03751 , pp. 1–17, 2019. [13] Q. Li, Z. Han, and X.-M. W u, “Deeper insights into graph conv olutional networks for semi-supervised learning, ” in Proceedings of the AAAI confer ence on artificial intelligence , v ol. 32, 2018. [14] J. Johnson, M. Douze, and H. J ´ egou, “Billion-scale similarity search with gpus, ” IEEE T ransactions on Big Data , vol. 7, no. 3, pp. 535–547, 2019. [15] M. Defferrard, K. Benzi, P . V andergheynst, and X. Bresson, “FMA: A dataset for music analysis, ” in 18th International Society for Music Information Retrieval Conference (ISMIR) , 2017. [Online]. A vailable: https://arxiv .org/abs/1612.01840 [16] D. Snyder, G. Chen, and D. Povey , “Musan: A music, speech, and noise corpus, ” arXiv pr eprint arXiv:1510.08484 , 2015. [17] M. Jeub, M. Schafer, and P . V ary , “ A binaural room impulse response database for the evaluation of dere verberation algorithms, ” in 2009 16th International Conference on Digital Signal Processing . IEEE, 2009, pp. 1–5. [18] Y . Gong, Y .-A. Chung, and J. Glass, “ Ast: Audio spectrogram trans- former , ” arXiv preprint , 2021.
Original Paper
Loading high-quality paper...
Comments & Academic Discussion
Loading comments...
Leave a Comment