An Evaluation of a Structured Spreadsheet Development Methodology
This paper presents the results of an empirical evaluation of the quality of a structured methodology for the development of spreadsheet models, proposed in numerous previous papers by Rajalingham K, Knight B and Chadwick D et al. This paper also des…
Authors: Kamalasen Rajalingham, David Chadwick, Brian Knight
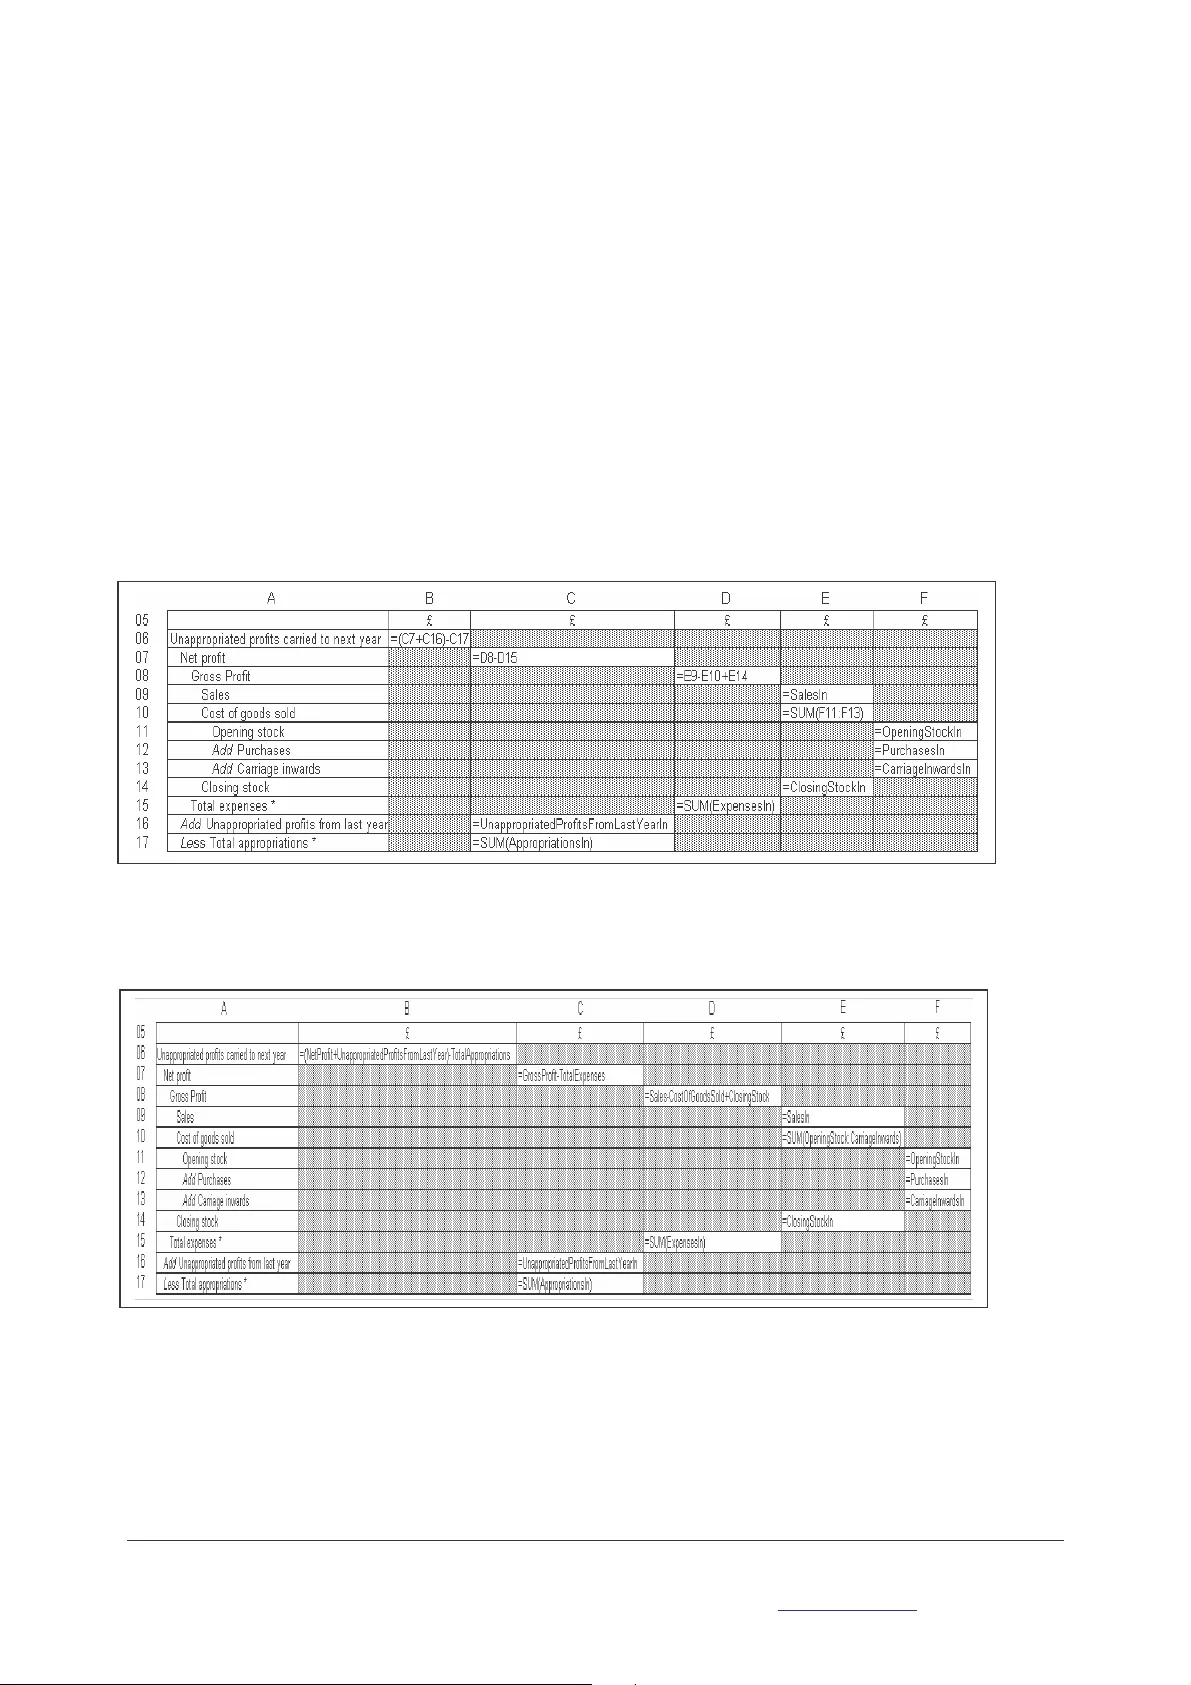
Extracted from Controlling the Subversi ve Spreadsheet – Risks, Audit and Develop ment Methods Proceedings of EuSpRIG 2001 Conference ISBN: 1 86 166 179 7 Copyright © 2001 European Spreadsheet Ri sks Interest Group www.eusp rig.org An Evaluation of a Structured Spreadsheet Development Methodology Kamalasen Rajalingham, David Chadwick, Brian Knight Information Integrity Research Centre School of Computing & Mathematical Sciences University of Greenwich 30 Park Row, Greenwich London SE10 9LS, United Kingdom K.Rajalingham@gre.ac.uk ABSTRACT This paper presents the results of a n empirical evaluation of the qualit y of a structured methodology for the development of spreadsheet models, proposed in numerous previous p apers by Rajalingham K, Knight B and Chadwick D et al. This paper also describes an i mproved version of their methodolo gy, supported by appropriate examples. The principal objective of a structured and disciplined methodology for the construction of spreadsheet models is to reduce the occurrence of user-generated errors in the models. The ev aluation of the effectiveness of the methodology has been carried out b ased on a number of real-life experi ments. The results of these expe riments demonstrate the methodology's potenti al for improved integrity contr ol and enhanced comprehensibilit y of spreadsheet models. 1 INTRODUCTION This methodology represents a significant development or advance in the research into integrity control of spreadsheet models and the development of a methodology for spreadsheet model develop ment. An outline of the methodology is presented by Knight B et al [Knight et al, 2000] and Chadwick D et al [Chadwick et al, 19 99]. In this p aper, an enhan ced version o f the methodology is p resented. The methodology is essentially based on structu red analysis of d ata, the o utcome of which i s represented as Jack son-like s tructures . It is sh own that this analysis allows a straightforward modularisation, and that individual modules may be represented with indentation in the block-structured form of str uctured pr ograms. The benefits of structured format are discussed, in terms of compreh ensibility, ease of maintenance, and reduction in errors [Knight et al, 20 00]. In order to assess and establish the quality of th e methodology, four different experiments hav e been carried out. The results o f these experiments have been analysed and they are present ed in this paper. 2 A STRUCTURED ME THODOLOGY FOR SPREADS HEET MODELL ING 2.1 Introduction Based on software engineering pr inciples, mainly bo rrowed from Jackson [Jackson-1975], it has been found that spreadsheet models ca n be represented in a form identical to the data structure diag ram developed by Jackson. Jackson [Jackson-1975] has shown ho w these S tructure Diagrams can be mapped onto program code. In th is pap er, the proposed methodology demon strates how these techniqu es can in fact be transferred to the production of spread sheets, and thi s can give a more comprehensible format for spreadsheets, based on ind ented format. This is don e by using a structured algo rithm. 2.2 The Structured Algor ithm Underpinning th e Methodology The algorithm consists of seven principal stages: • Specification and Design of O utputs • Conceptual Design of th e Workings Section • Logical Design of the Workings Section Extracted from Controlling the Subversi ve Spreadsheet – Risks, Audit and Develop ment Methods Proceedings of EuSpRIG 2001 Conference ISBN: 1 86 166 179 7 Copyright © 2001 European Spreadsheet Ri sks Interest Group www.eusp rig.org • Construction of the Wo rkings Section Structure • Construction of the In put Section Structure • Implementation of Function s and Relationships • Completion of the Outpu t Section In this section, th e methodology is app lied in the construction of a spreadsheet mod el comprising a sin gle module (as d efined by the methodology ). This is a simple model which does n ot require resolution of graph structures, which potentially result in the creation of separate modules, an d recursive relationship s. It is based on a Trading and Profit and Loss Account [Ward-1996]. The origin al model is shown in Figure 1 . Figure 1 : The Conven tional Layout Stage 1: Specification a nd Design of Outputs This activity is carried out from the point of view o f the m odel interpreter(s ) . The model interp reters are the end-users who interpret or use the output of the spreadsheet model for a parti cular purpo se or to make business d ecisions. The method ology insists on the presentation of ou tputs on separate worksheets. The output(s) specified wou ld consist of he adings, labels and referen ces to the wor kings and input s ections. These sections would be constructed on separate worksh eets later. Extracted from Controlling the Subversi ve Spreadsheet – Risks, Audit and Develop ment Methods Proceedings of EuSpRIG 2001 Conference ISBN: 1 86 166 179 7 Copyright © 2001 European Spreadsheet Ri sks Interest Group www.eusp rig.org Based on the example of a T rading and Profit and Loss Mod el , the model developer wou ld first exa mine the desired output( s). A typical output structure is sh own in Figure 2 . Figure 2: Output Structure If this la yout was presented to a group of model develo pers, who are each asked to independently produce the spreadsheet m odel, they would come u p with different l ayouts and stru ctures based on experience and personal likes (and dislikes). Adop ting the proposed metho dology, a group of model developers assigned to independently build th e spreadsheet model, should produce a set of stru cturally identical models. Stage 2: Conceptual Desi gn of the Workings Section The p urpose of con structing the wo rkings or calcu lations se ction is to syste matically and methodically perform the in terim and final calculations based on and required by the model output(s). In d eveloping the conceptual model, t he first step is to identify the hig hest-level functions o r model elements. These take the form of formulae with no dep endents. They are therefore not referenced by any other ele ments within the spreadsheet model. Such functions can be referred to as root elements of the model. The workings section of the spreadsheet model is represented in the form of Jackson structures [Jackson- 1975]. The root elements would b e placed at the top of the hierarchy, hangi ng from a box co ntaining the title of the spreadsh eet model. Th e immediate precedents of the root element would th en assume their positions just belo w, adjacent to each other. In the same manner, e ach element would be positioned just below the model element of which it is a direct pre cedent. In many spreadsheet models, a root element would represent multiple instances, where each instance corresponds to a different time period, g roup, category, etc. This is shown as an iteration (appropriately labelled) with the ro ot element appearing below it. When a top-down approach is adopted without allowing duplication of elements, the initial model could take the for m of a graph str ucture as opposed to the desired tree structure. The purpo se o f t his is t o distinctly show instances of multiple d ependants of a particular e lement of the model. This potentially results in a structure as shown in Figure 3 . Extracted from Controlling the Subversi ve Spreadsheet – Risks, Audit and Develop ment Methods Proceedings of EuSpRIG 2001 Conference ISBN: 1 86 166 179 7 Copyright © 2001 European Spreadsheet Ri sks Interest Group www.eusp rig.org Figure 3: The Conceptual Design in Graph-form Based on the desired outputs for the Tr ading a nd P rofit and Loss Account exa mple shown in Figure 2 , the only root element that can be i dentified is Unap propriated profits carried to next year , as it is not referenced by any other model element. Figure 4 presents the conceptual design of the workings section. Figure 4: Conceptu al Design of the Workings Section This model distinctly shows the preceden ts of the various function s. The leaves expenses and appropriations are rep resented as iteration s in Figure 4 . This is because ea ch o f them refers to a group of related inpu ts, defined as a range. The elements of a range are alway s operated on or manipulated as a set rather than ind ividually. This stru cture should b e transformed or resolved into a p ure tree structure (if it is not already so) in t he next stage. Extracted from Controlling the Subversi ve Spreadsheet – Risks, Audit and Develop ment Methods Proceedings of EuSpRIG 2001 Conference ISBN: 1 86 166 179 7 Copyright © 2001 European Spreadsheet Ri sks Interest Group www.eusp rig.org Stage 3: Logical Design of the Workings Section We have looked at a concep tual design which took the fo rm of a tree. Not all spreadsheet mo dels are of this simple f orm, but have structure charts in the form of a more general graph. Figure 3 shows a n example of such a chart. The chart is different to th at in Figure 4 in that there is a loop in the relationships connecting A , B, C and D , so that we do no t any longer have a tree for m. In th is chart, data block D contributes to block B and to block C. We can o f course turn th e graph into a tree. In order to accomplish this, two important ru les have to b e observed. Rule 1: The initial graph structure is resolved into a tree-structure b y duplicating elements with m ore than one dependant. The precedents of these elements are not included in the model at this stage. This is illustrated in Figure 5. Based on Figure 5 , D and G are duplicated in order to resolve the graph into a tree structure. Th e precedents of D are not in cluded in the model. Figure 5: The Logical Design Based on Rule 1 Figure 6: The Logical Design Based on Rule 2 Rule 2: If a duplicate element has on e or more precedents, it forms a separate module represented as a tree. The module consists of the duplica te element along with its p recedents. This process is sim ilar to First Normal Form (1NF) of norm alisation in relational datab ase design. This is shown in Figure 6 . Extracted from Controlling the Subversi ve Spreadsheet – Risks, Audit and Develop ment Methods Proceedings of EuSpRIG 2001 Conference ISBN: 1 86 166 179 7 Copyright © 2001 European Spreadsheet Ri sks Interest Group www.eusp rig.org Referring to our Trading and Profit and Loss Account example, the model does not contain any graph sub-structures. Therefore, this stage is not applicable and can be omitted/ski pped. In other words, the conceptual design of the workings section also represent s its logical design. Stage 4: Construction of the Workings Section Structure To maintain t he structure modell ed in the logical design in the spreadsheet v iew, the i ndentation princip le is used, both on the row labels and on the corresponding values themselves. I n fact, we ca n also insist that the values are indented by assigning a spreadsheet column to each lev el of indentatio n. Th ese c an be referred to a s virtual co lumns . The logical design of the model (represented as Jacks on tree-like structures) is systematically mapped on to the physical spreadsheet based on rigorous rules pre scribed by the methodology. The following are the typ es of elements that can be fo und in the Jackson structu res: • Iteration (not associated wi th a single data value) • Selection (representing mutu ally exclusive options) • Function (takes the for m of a formula) • Leaf (reference to an in put or input range) • Constant (reference to an inp ut and denoted using a C) • Labels (each label is associated with a function, con stant, leaf or iteration) • Module (a branch or sub -structure referenced more t han once within th e model) • Reference to a different iteration of the same module (ind icated using indices ) All iteration labels are p laced in the same colu mn but are suitably indented t o reflect their levels. All function and input labels are also placed in the same colu mn, adjacent to the colu mn containing iteration labels. They too are indented according to the levels at wh ich they occur in the Jackson structures. The functions correspo nding to the labels are built in a set o f (virtual) columns adjacent to th e column containing the function and input labels. Th e functions are lo cated in different virtual columns , according to their p osition in the data structures. The term 'virtual columns' is used as th e multiple phy sical columns are viewed as a single log ical column. As such, each ro w can only contain exactly one function. Extracted from Controlling the Subversi ve Spreadsheet – Risks, Audit and Develop ment Methods Proceedings of EuSpRIG 2001 Conference ISBN: 1 86 166 179 7 Copyright © 2001 European Spreadsheet Ri sks Interest Group www.eusp rig.org The positioning of functions in th e v arious virtual columns is al so consistent with the indentation of their corresponding lab els. When these function s appear in different 'virtual colu mns', the comprehensibility of the model is improved signi ficantly. The precedents of each function become easily identifiable. Figure 7: Organisation of Functions in Virtual Colum ns Based on Fig ure 7 , A is a function of B and C , while C is a fu nction of D and G . The precedents of function D are E an d F , whereas the precedents of function G are H 1 , H 2 and H 3 . Referring to the Trading and Profit and Loss Accou nt example, the logical design of the work ings section of th e spreadsheet model is now mapped o nto the physical spreadsheet. This is sh own in Figure 8 . Figure 8: Workings Sectio n Structure An asterisk (*) is placed next to a functio n label (in column A) to denote that the fun ction operates on an input range (defined in the input section). The d efinition of a range in th is context is described in the next stage. Stage 5: Construction of the Input Section There are r easons why cells for d ata input should be grouped together i n an input section , separate from the structured modules described abo ve. One reason is to do with the utmo st importance of obtaining accurate data entry. A second reason is that input cells are often r eferred to b y more than one calculat ed cell. Apart from these reasons, it is also a precaution against any accidental ov erwriting of formulae. Thi s Extracted from Controlling the Subversi ve Spreadsheet – Risks, Audit and Develop ment Methods Proceedings of EuSpRIG 2001 Conference ISBN: 1 86 166 179 7 Copyright © 2001 European Spreadsheet Ri sks Interest Group www.eusp rig.org strategy is similar to the method introduced by DiAntonio [DiAntonio, 1986]. DiAntonio's method advocates th e isolatio n of facts by splitting the sp readsheet into two parts, one for the fac ts and one for the solution . The design of this part of the user inter face should be as free from constraints as po ssible; so as not t o hinder the main objective: ease of use an d absence of data errors. We are therefo re, quite at liberty to put all data input cells into unst ructured modules, since there are neve r any dependencies between them. Any dependency relationship in spreadsheet i nvolves a calculated cell, an d either other calculated cells or da ta input cells. However, th ey do not exist between data i nput cells and other data inpu t cells. Based on the leaves identified in th e Jackson structures, the input section can be created. A problem that can be anticipated at this stage is the difficu lty in addin g or deleting data from t he input section while having the changes reflected in the workings section. In view of this problem, the methodology requires that a group of related inp uts be defined as a range and only the range is referred to in the workings section. A reference t o a group of related inputs or an input set (range) is shown in the Jackson structur e by a leaf represented as an it erated component. The input section for the Trading and Profit and Loss Model can now be creat ed in order t o p rovide the workings section with th e values required. This is d one o n a separate worksheet. The worksheet should be labelled input . Based on the logical design for th e spreadsheet model, shown in Figure 4 , the end- leaves can be implemented i n an input section. Th is is shown in Figure 9 . The inpu t data co rresponding to the input groups expenses (C11 to C18 ) and appropriations (C20 t o C22) are defined as ranges , and assigned the rang e names expenses and ap propriations respectively. Figure 9: Input Sectio n Stage 6: Implementatio n of Functions and Relati onships The structured spreadsheet modules represent the calculation or workings section. The structured spreadsheet modules also facilitate auditing and comprehens ion of the composition/meaning of calculations (expressed as formulae). The various formulae can now be physically implemented o r Extracted from Controlling the Subversi ve Spreadsheet – Risks, Audit and Develop ment Methods Proceedings of EuSpRIG 2001 Conference ISBN: 1 86 166 179 7 Copyright © 2001 European Spreadsheet Ri sks Interest Group www.eusp rig.org programmed. This stage involves constructing th e variou s formulae and fun ctions required in th e workings section . The workin gs section structure has already been produced and will be use d as a basis for the creation of the app ropriate functions. References to inp uts are first entered into the relevant cells i n the workings section . This includes functions on input ranges, su ch as total expenses and to tal appropriations . A bottom-up approach is taken in the implementation of formulae an d functions in the wo rkings section. Figures 10 (a) and 10 (b) sho w the final state of th e work ings section of the Trading and Profit a nd Loss model. In Figure 10 (a) , the structu re o f the underlying functions are shown as entered by the model developer. Figure 10 (b) , on th e other hand, shows the surface values of the functions b ased on the current state of inputs. Figure 10 (a): Workings S ection Figure 10 (b): Workings Sectio n Based on Figures 10 (a) and 10 (b) it can be noticed that b oth t he semantics and th e data are clarified in this layou t. For example, we can see straight away on the seman tic level that Unap propriated profits carried to next year is derived from three figures: Net Profi t , Unappropriated profits from last year and Total appropriations . On the data level we see that 24,219 is made up from 20,733 , 15,286 and 11,800 . Likewise, we see immediately (fro m the asterisk * ) that T otal expenses references an inp ut range from the input section. Notice also that columns in the spreadsh eet show figures on the same semanti c level, enabling valid comparisons between fig ures to be made. For example, column C shows n et profit , unapprop riated profits from last year and total a ppropriations . These fi gures giv e a valid impression of the state of the Trading and Pro fit and Loss A ccount at th is level of detail. If we w ere to inclu de a figure from a different Extracted from Controlling the Subversi ve Spreadsheet – Risks, Audit and Develop ment Methods Proceedings of EuSpRIG 2001 Conference ISBN: 1 86 166 179 7 Copyright © 2001 European Spreadsheet Ri sks Interest Group www.eusp rig.org level, e.g. purchases (from column F), it would confuse the pictu re, since it has already been i ncluded in net profit. Referring to Figures 10 (a) and 10 (b) , it is beyond any doubt that the use of indentation and virtual columns make it far more straig ht-forward to make sense of and comprehend the composition of functions. However, the fact th at references to data and other formulae within a particular formula take the form of cell addresses rath er than meaningful labels is not entirely desirable. In order to enhance th e comprehensibili ty of fo rmulae, cell add resses should be replaced with meaningful labels so that fo rmulae are expressed in natural language fo rm. Based on the Trading and Pro fit and Loss Account example, meaningful names would first b e assign ed to every piece of input data. The except ion to th is rul e applies to a d ata value which is part o f a related set o f data that is always treated and operated on as a set, in wh ich case it will be d efined as a range along with the o ther related in puts. If every p iece of input data in the input section i s given a un ique name, the work ings section wo uld now appear as shown in Figure 10 (c) . Figure 10 (c): Working s Section This technique shou ld be applied to all elements of the workin gs section. Every function/formula should be assigned a name so that meaningfu l names instead of cell addresses can be used for references with in formulae in the workings an d output sections. Th is is shown in Figures 10 (d) and 11 (c) . Figure 10 (d): Workings Sectio n Stage 7: Completion of the Output Section This stage brings t he spreadsheet model develo pment process to a co nclusion. References to corresponding functions in the workings section can at this stage be entered into the relevant cells of the output section. The fin al state of the output section is shown in Figures 11 (a), 11 (b) and 11 (c) . Extracted from Controlling the Subversi ve Spreadsheet – Risks, Audit and Develop ment Methods Proceedings of EuSpRIG 2001 Conference ISBN: 1 86 166 179 7 Copyright © 2001 European Spreadsheet Ri sks Interest Group www.eusp rig.org Figure 11 (a): Ou tput Section Figure 11 (b): Ou tput Section Figure 14 (c): Ou tput Section Extracted from Controlling the Subversi ve Spreadsheet – Risks, Audit and Develop ment Methods Proceedings of EuSpRIG 2001 Conference ISBN: 1 86 166 179 7 Copyright © 2001 European Spreadsheet Ri sks Interest Group www.eusp rig.org 3. EVALUATION OF THE STR UCTURED METHODO LOGY 3.1 Introduction In order to evaluate the effectiv eness of the pro posed methodo logy, a series of well-organised experiments were undertaken. An ana lysis of the results of these experiments would revealed the methodology's p otential for integrity control of spreadsheet model s. A major prob lem encountered was to persuade cert ain gro ups of spreadsheet users, especially those in ind ustry (as opposed to academia) to take part in the trials. Therefor e, t he selection of user g roups involved consideration of various factors such as circu mstances, exp erience and vario us constraints. Two different strategies ar e formulated to evaluate the quality of the proposed methodology for spreadsheet model development. User Groups or Participa nts Ideally, the methodology should be tested on spreadsheet users, of varying levels of spreadsheet li teracy, in both business and academia. Past experiments on spreadsheet errors have involved different typ es of users, from experienced sp readsheet developers fro m industry to novice spreads heet students. It has b een impossible for the authors to obtain consent to conduct trials with users in business organisation s due to various reasons e.g. the time commitment, the problem of confi dentiality of client data, the difficulty of obtaining a co hort of u sers all working wi th the same model at the sa me time, as well as the d ifficulty of obtaining a sufficiently large cohort to produce statistically significant results. Referring to past experiment s u ndertaken, it is found that most of th e p articipants of such tests were students at an institution associated with the author(s). I n most cas es where the subjects we re ind ustry or commercial users, the experiment was eith er conducted by the particular organisation or the information derived from the nor mal operations of the organisation, published by the company itself. Three different groups of stud ents at a University were selected a s participants for the experi ments. T hey were as follows: • Undergraduates • Post-graduate students • Students on a short co urse designed primarily fo r professionals in industry . Types of Errors Ideally, the tests should demonstrate the capacity of the propo sed structured methodology to address all types of spreadsheet errors. The taxonomy or classification of spreadsheet errors [Rajalingham et al, 2000] is used as a basis for organising tests for as many different types of errors as p ossible. Spreadsheet Models The spreadsh eet model s selected and used fo r exper imental purpo ses should be common business a nd financial models. The mo dels sho uld address the different features of the proposed methodology. Moreover, th e models should h ave the capacity to be used to test fo r as many different types of errors as possible. The spreadsheet models sel ected for the experiments are as fo llows: • A Trading and Profit an d Loss Account for a particular y ear [Wood-96] • A Trading and Profit an d Loss Account for several years [Wood -96] • A Post-tax Income Distrib ution Model [Slater-90 ] • Another common business model. Extracted from Controlling the Subversi ve Spreadsheet – Risks, Audit and Develop ment Methods Proceedings of EuSpRIG 2001 Conference ISBN: 1 86 166 179 7 Copyright © 2001 European Spreadsheet Ri sks Interest Group www.eusp rig.org 3.2 The Evaluation Stra tegies Error Prevention The first strategy for testing the qu ality of the proposed methodology is based on error prevention. I t involves comparing the occurrence of errors in spreadsheet models develop ed based on the proposed methodology to the occurrence o f errors in models b uilt usin g conventional unstructured methods. Th e aim of this strategy is to establish whether or not there is a material difference in error rates betwee n spreadsheet models produced using the two different approaches. The hypothesis is that users co mmit significantly fewer e rrors by adopting the proposed structu red methodology. The first exp eriment is based on this strategy while the su bsequent three experiments are based on a different strategy (error detection). Error Detection The second strategy for evalu ating the effectiveness of th e proposed methodology is based o n error detection. It involves comparing the probability of detecting errors in spreadsheet models dev eloped based on the propo sed methodology to the probab ility of detecting errors in mo dels constructed based o n conventional unstru ctured methods. Err ors are deliberately seeded into the spreadsheet models. The ai m of this strategy is to establish whether or not there is a significant difference in the pro babilities of error detection between spreads heet models p roduced u sing the two different approaches. The hyp othesis is that u sers are able to identify sig nificantly more errors seeded into a model develo ped u sing the proposed structured methodo logy. This is a reflection of its comprehensi bility. This is particularly important fo r audit, review and update purposes. Apart from the first experiment, the subsequent four experiments are based on this strategy. 3.3 The Experiments and th eir Results Experiment 1 This experiment was carried out in two different stages, each involving two groups of students at a University. The purpose of the experiment was to co mpare two different approaches to the development of a sing le-module spr eadsheet mod el. The first approach was based on conv entional unstructured methods for spreadsheet model dev elopment while the second appro ach was based on the proposed structured methodology. This experiment was based o n the first testing strateg y, described earlier. The spreadsheet model used was b ased on a Trading and Profit and Loss A ccount for a particular y ear [Wood-96]. Stage 1 The first stage of th e ex periment involved th e development of a spreadsh eet model without an y guidance or support. Subjects were g iven the desired ou tput of th e model as shown in Figure 3 . In order to creat e the spreadsheet model b ased on the requ ired output, they were provided with all th e formulae needed. They had to employ suitable methods b ased on person al experience or discretion, and carry ou t the exercise ind ependently. A total of 4 2 post-g raduate students and 26 short course stude nts (most of whom were professionals in industry) took part in th is experiment. The first test was carried ou t on a group of 22 post-graduate students . The stu dents were pursuing a taught masters p rogrammme. Most o f them had graduated in oth er disciplines and had limited prior knowledge of information sy stems. Each participant had to build the sa me spreadsheet model on two different occasio ns. The purpose of h aving the participants re-build the same model was so that it can be used as a control in th e experiment. The second test was performed on a group of 12 short course students . M ost of the students wer e employed on a full -time basis in ind ustry. Each participant had to build the spreadsheet model without having had a lesson on the proposed methodo logy. Extracted from Controlling the Subversi ve Spreadsheet – Risks, Audit and Develop ment Methods Proceedings of EuSpRIG 2001 Conference ISBN: 1 86 166 179 7 Copyright © 2001 European Spreadsheet Ri sks Interest Group www.eusp rig.org Stage 2 The second stage of the experiment invo lved the development of the same spreadsheet model based on a Trading and Profit and Loss Account . However, bef ore they carried out th e exercise, th e students wer e given a lesson on employing the proposed methodology for structuring and b uilding a single-module spreadsheet model. The first test was carried out on a group of 20 post-graduate stud ents . The students were also pursu ing a taught masters programmme. Each participant had to first build the spreadsheet model using a method they were familiar with. This was not based on any structu red methodo logies. The purpose of this exercise was to make sure that the errors committed by this g roup of stu dents were in fact consistent with those produced by the previo us group. The group was subsequent ly given a lesson on using the pro posed methodology to construct a single-module spreadsheet model. They were then asked to re-co nstruct the spreadsheet model based on the proposed methodology . The second test was conducted o n a grou p of 14 short cou rse students . This was a differen t group of students but were pursuing the same short co urse. M oreover, they had a similar backgro und, in that they were also mainly professionals in i ndustry. The participants were a sked to create the spreadsh eet model, having had a lesson on building spreadsheet models usin g the proposed methodolo gy. Results The errors include bo th quantitative and qualitativ e errors [Rajalingham et al, 200 0] Experiment 2 This experiment was based on the second evaluation strategy (error detection) and carried out in two stages. A tota l of 1 04 undergraduates took part in this experiment. The students were in two different groups. Both g roups h ad to detect a total o f 1 2 errors that had been seeded into a spreadsheet model. They were given the same amount of time to complete the exercis e. The model was based on a Trading and Profit and Loss Account for several years. However, there was a fundamental difference between the layout or structure of th e model used by the first grou p and the model used by th e second group. Stage 1 The first group consisted of 55 students and were presented a spreadsheet model in a co nventional layout. Their task was to id entify th e twelve errors that had been seeded into th e model. They were not aware of how many errors there were in the model. Stage 2 The second gro up, on the o ther hand, was made up of 49 students . This group was working on the same model bu t it was structure d based o n the propo sed metho dology. Th e sa me erro rs h ad b een seeded into this model as well, an d group members had t o independently detect them. gain they were un aware of the number of errors. They were given a brief and general lesson on h ow to interpret a spreadsheet model based on the proposed methodology without any references to the particular model used. Extracted from Controlling the Subversi ve Spreadsheet – Risks, Audit and Develop ment Methods Proceedings of EuSpRIG 2001 Conference ISBN: 1 86 166 179 7 Copyright © 2001 European Spreadsheet Ri sks Interest Group www.eusp rig.org Results Experiment 3 This experiment was based on the second evaluation strategy (error detection) and carried out in two stages. A total of 41 post-graduate stu dents and 23 short course students p articipated in this experiment. Two id entical tests were perfor med in each stage. E ach test involved a different subset o f students. T herefore 4 groups of sub jects had to detect a total o f 10 errors that had been seeded in to a spreadsheet model. The model us ed in the first stage had a diffe rent structure/layou t to the model used in the second stage. All participants were giv en the same amount of time t o compl ete the exercise. The model used in this experiment was based on a Post-tax Income Distribution Model [Slater-90]. The original model was modified slightly to decrease its size. Stage 1 In the first stage of the experi ment, the spreadsheet model was presented based on the original (conventional) layout. They had to identify a total of 1 0 errors th at had b een seeded in to the model. The first test involved a grou p of 19 post-gradua te students while the secon d test was conducted on a group of 11 short course students . Stage 2 In the second stage of th e experiment, the spreadsh eet model was r e-designed and re-structured accordin g to the proposed metho dology. The same 10 errors were then deliberately seeded in to th e model. The participants o f the experiment at this stage were given a brief and general lesson on how to interpret a spreadsheet model based on the proposed methodology without an y references to the particular model used. The first test was performed on a group of 22 post-graduate students while the secon d test i nvolved a group of 12 short course s tudents . Results Experiment 4 This experiment wa s very similar to the previous experiment. Th e only diff erence was that a differ ent spreadsheet model was used. However, this was also a common business model. The model was simplified and its size reduced to make it less time-consuming to work on. The experiment was carried Extracted from Controlling the Subversi ve Spreadsheet – Risks, Audit and Develop ment Methods Proceedings of EuSpRIG 2001 Conference ISBN: 1 86 166 179 7 Copyright © 2001 European Spreadsheet Ri sks Interest Group www.eusp rig.org out in two stages and invol ved a total of 44 po st-graduate students and 23 short cou rse students . Two identical tests were performed in each stage. Each tes t involv ed a different subse t of students. The task of the 4 groups of participants was to d etect a total of 10 errors th at h ad been seeded into the spreadshee t model. All participants wer e given the same amount of t ime to complete the exercise. Stage 1 In the first stage of the experi ment, the spreadsheet model was presented based on the original (conventional) layout. The first test involved a group o f 24 post-grad uate stud ents while the second test was conducted on a group of 12 short course students . Stage 2 In the second stage of th e experiment, the spreadsh eet model was r e-designed and re-structured accordin g to th e propo sed methodology . They same 10 errors were th en seeded into the model. As done in the previous experiment, the students taking part in the experiment at this stage were given a brief and general lesson on how to interpret a spreadsheet model based on the proposed metho dology without any references to th e particular model used. The first test was perfo rmed on a grou p of 20 post-graduate students while the second test involved a group of 11 short course students . Results 4. CONCLUSION The suitability of a metho dology based on Jackso n-like structures for sp readsheet modelling has been investigated. It appears that there are several possible advant ages to the adoption of a structured method based on a Jackson data-oriented approach. These advantages may be summaris ed as follows [Knight et al, 2000]: • a clear modularisation pr inciple • a top-level overview of module structure • a structured indented fo rmat to the layout of module • the possibility of auto matic structuring of existing spreadsheets The proposed methodology imposes a strict di scipline in th e process of spreadsheet develop ment using software engi neering principl es. This reduces the occu rrence of errors as spreadsh eet models are designed and con structed i n a structured and organised manner. The methodology distinctly describes a technique fo r modelling the spreadsheet pro blem and subsequently mapping the design o nto the phy sical spreadsheet according to prescribed rules and a structured algo rithm. Th e spreadsheet model is organ ised in a form which facilitates u nderstanding and interpretation of the model in an unambiguous way . It is also app ropriately decomposed into modules. This reduces the occurrence of most types of errors and increases the probability o f detecting errors which are already present in the spreadsheet models. In o rder to assess and establish the quality of the methodology, five differen t experi ments h ave been carried out. The results of these experiments have been analysed and they are p resented in th is paper. Th e results of the series of fou r experiments conducted provide sub stantial evidence of the methodology's Extracted from Controlling the Subversi ve Spreadsheet – Risks, Audit and Develop ment Methods Proceedings of EuSpRIG 2001 Conference ISBN: 1 86 166 179 7 Copyright © 2001 European Spreadsheet Ri sks Interest Group www.eusp rig.org potential for controlling th e integrity and improving th e comprehensibility of spreadsh eet models. A more detailed v ersion of the complete set of exp eriments and analysis of their results wil l be publish ed in due course. 5. REFERENCES Chadwick D, Rajalingham K, Knight B and Edwards D (1999). A Methodology for Spreadsheet Development Based on Data Structure , CMS Press (June 1999), No 99/IM/50. Chadwick D, Knight B and Rajalingham K (2000). Quality Control in Spreadsheets: A Visual Approach Using Color Codings to Reduce Errors in Formulae , Proceedings of the Eighth International Conference on Software Quality Management SQM'99 (April 2000), Greenwich, London: British Computer Society. Chadwick D, Knight B & Rajalingham K (Forthcoming). Quality Control in Spreadsheets: A Visual Approach Using Color Codings to Reduce Errors in Formulae , Software Quality Journal: Kluwer Academic Publishers. DiAntonio A E (1986). Spreadsheet Applications , Prentice-Hall. Ingevaldsson L (1986). JSP - A Practical Method of Program Design , Leif Ingevaldsson and Studentlitteratur. Ingevaldsson L (1990). Software Engineering Fundamentals – the Jackson Approach , Leif Ingevaldsson and Studentlitte ratur. Jackson M A (1975). Principles of Program Design , Academic Press. Knight B, Chadwick D and Rajalingham K (2000). A Structured Me thodology for Spreadsheet Mode lling , Proceedings of the EuSpRIG 2000 Symposium on Spreadsheet Risks, Audit and Development Methods (17-18 July 2000), Greenwich, London: University of Greenwich, pp43-50. Operis TRG Limited (1999), Systematic Finan cial Modelling: Case Study for Met hodology and Techniques , Operis TRG Limited, London. Parnas D L (1972). On the Criteria t o be Used i n Decomposing Systems into Modules , CACM (April 1972), Vol 14, No 1, pp221-227. Rajalingham K and Chadwick D (1998). Integrity Control of Spreadsheets: Organisation & Tools , Proceedings of the IFIP TC11 WG11.5 Second Working Conference on Integrity and Internal Control in Inform ation Systems (19-20 November 1998), Virginia, USA: Kluwer Academic Publishers, pp147-168. Rajalingham K, Chadwick D, Knight B and Edwards D (1999). An Approach to Improving the Quality of Spreadsheet Models , Proceedings of the Seventh International Conference on Soft ware Quali ty Management SQM'99 (March 1999), Southampton, United Kingdom: British Computer Society, pp117-131. Rajalingham K, Chadwick D, Knight B and Edwa rds D (1999). An Integrated Spr eadsheet Engineering Methodology (ISEM) , Proceedings of the IFIP TC11 WG11.5 Third Working Conferen ce on Integrity and Interna l Control in Information Systems (18- 19 November 1999), Amsterdam, The Netherlands: Kluwer Academic Publishers, pp41-58. Rajalingham K, Chadwick D, Knight B and Edwards D (2000). Quality Control in Spreadsheets: A Software Engineering-Based Approach to Spreadsheet Development , Proceedings of the Thirty- Third Hawaii Int ernational Conference on System Sciences (4-7 January 2000), Maui, Hawaii: IEEE Computer Society) Rajalingham K, Chadwick D and Knight B (2000). Classification of Spreadsheet Errors , Proceedings of the EuSpRIG 2000 Symposium on Spreadsheet Risks, Audit and Development Methods (17-18 July 2000), Greenwich, Lond on: University of Greenwich, pp23-34. Rajalingham K, Chadwick D and Knight B (2000). Classification of Spreadsheet Errors , British Computer Society (BCS) Computer Audit Specialist Group (CASG) Journal (Autumn 2000), Vol 10, No 4, pp5-10. Stevens W, Myers G and Constantine L (1974). Structured Design , IBM Systems Journal, Vol 13, No 2, pp115-139. Weaver P L, Lambrou N and Walkley M (1998). Practical SSADM Version 4+ A Complete Tutorial Guide (Second Edition) , Financial Times Pitman Publishing. Wood F (1996). Business Accounting 1 (Seventh Edition) , Pitman Publishing.
Original Paper
Loading high-quality paper...
Comments & Academic Discussion
Loading comments...
Leave a Comment