A risk-security tradeoff in graphical coordination games
A system relying on the collective behavior of decision-makers can be vulnerable to a variety of adversarial attacks. How well can a system operator protect performance in the face of these risks? We frame this question in the context of graphical co…
Authors: Keith Paarporn, Mahnoosh Alizadeh, Jason R. Marden
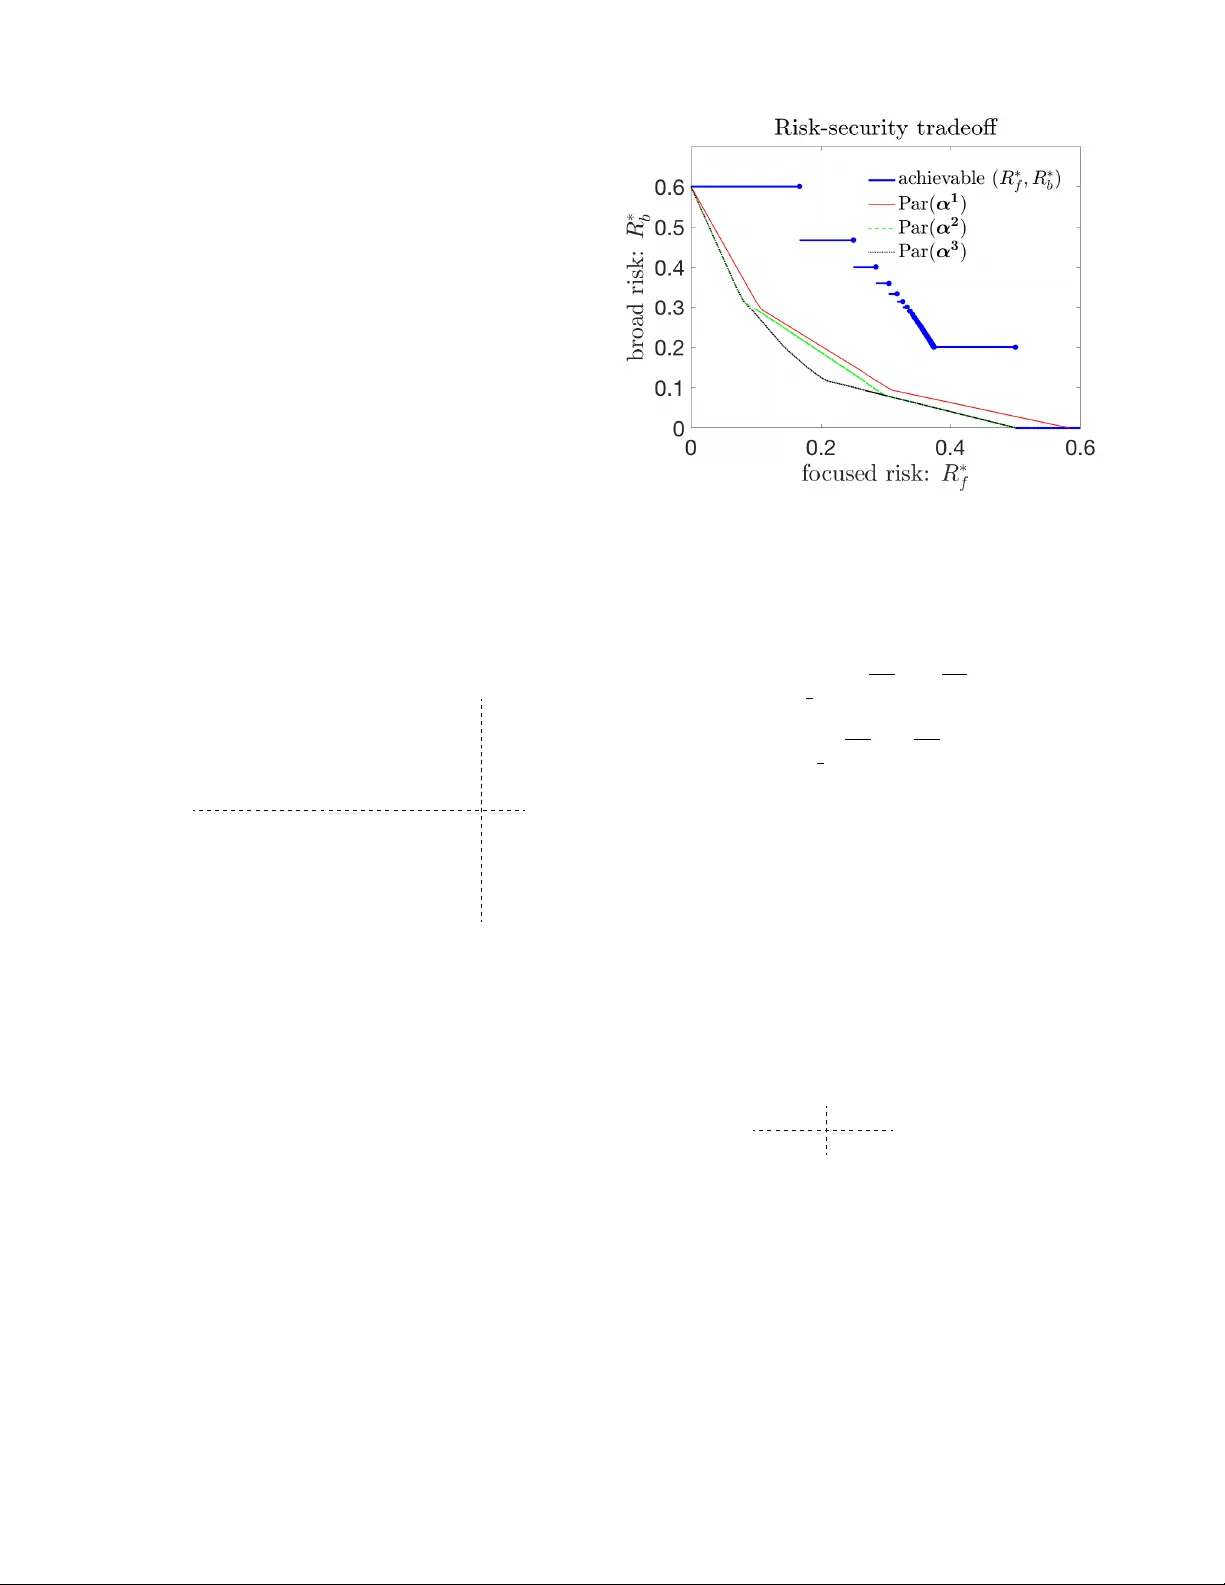
A risk-security tradeoff in graphical coordination games K eith Paarporn, Mahnoosh Alizadeh, and Jason R. Marden Abstract —A system relying on the collecti ve beha vior of decision-makers can be vulnerable to a variety of adversarial attacks. How well can a system operator protect performance in the face of these risks? W e frame this question in the context of graphical coordination games, where the agents in a network choose among two conv entions and derive benefits from coordinating neighbors, and system performance is measured in terms of the agents’ welfare. In this paper , we assess an operator’ s ability to mitigate two types of adversarial attacks - 1) broad attacks, wher e the adversary incentivizes all agents in the network and 2) focused attacks, where the adversary can f orce a selected subset of the agents to commit to a prescribed con vention. As a mitigation strategy , the system operator can implement a class of distributed algorithms that gover n the agents’ decision-making process. Our main contribution characterizes the operator’s fundamental trade-off between security against worst-case broad attacks and vulnerability from f ocused attacks. W e show that this tradeoff significantly improv es when the operator selects a decision-making process at random. Our work highlights the design challenges a system operator faces in maintaining resilience of networked distributed systems. I . I N T RO D U C T I O N Networked distrib uted systems typically operate without centralized planning or control, and instead rely on local in- teractions and communication between the comprising agents. These systems arise in a variety of engineering applications such as teams of mobile robots and sensor networks [1]– [3]. They are also prev alent in social dynamics [4], [5] and biological populations [6]. The transition from a centralized to a distrib uted architecture may leav e a system vulnerable to a variety of adversarial attacks. An adversary may be able to manipulate the decision- making processes of the agents. Such dynamical perturbations can potentially lead to unwanted outcomes. For example in so- cial networks, individual opinions can be shaped from external information sources, resulting in a polarized society [7], [8]. When feasible, a system operator takes measures to mitigate adversarial influences. The literature on cyber -physical system security studies many aspects of this interplay . For instance, optimal controllers are designed to mitigate denial-of-service, estimation, and deception attacks [9]–[13]. This paper inv estigates security measures that a system operator can take against adversarial influences when the K. Paarporn ( kpaarporn@ucsb.edu ), M. Al- izadeh ( alizadeh@ucsb.edu ), and J. R. Marden ( jrmarden@ece.ucsb.edu ) are with the Department of Electrical and Computer Engineering at the University of California, Santa Barbara, CA. A preliminary version of this paper has been submitted for conference publication (CDC 2019) and can be found at https://ece.ucsb.edu/ ˜ jrmarden/files/MardenC9.pdf . The analysis of randomized operator strategies extends the previous results. Complete proofs are also provided here. This work is supported by UCOP Grant LFR-18-548175, ONR grant #N00014-17-1-2060, and NSF grant #ECCS-1638214. underlying system is a graphical coordination game [5], [14], where agents in a network decide between two choices, x or y . One may think of these choices as two competing products, e.g. iPhone vs Android, tw o conflicting social norms, or two opposing political parties. Each agent derives a positive benefit from interactions with coordinating neighbors, and zero benefits from mis-coordinating ones. The system’ s efficiency is defined by the ratio of total benefits of all agents to the maximal attainable benefits over all configurations of choices. The goal of the system operator is to design a local decision- making rule for each agent in the system so that the emer gent collectiv e behavior optimizes system efficienc y . One algorithm that achieves this goal is known as log-linear learning [15]– [17]. More formally , the agents follow a “perturbed” best reply dynamics where the agents’ local objecti ves are precisely equal to their local welfare. W e seek to address the question of whether this particular algorithm is robust to adversarial influ- ences. That is, does this algorithm preserve system efficienc y when the agents’ decision-making processes are manipulated by an adversary? If not, can the operator alter the agents’ local objectiv es to mitigate such attacks? W e consider two adversarial attack models - br oad and focused attacks. In broad attacks, the adversary incentivizes ev ery agent in the network (hence broad) with a con vention, influencing their decision-making process. This could depict distributing political ads with the intention of polarizing voters. In focused attacks, the adversary tar gets a specific set of agents in the network, forcing them to commit to x or y . These targeted, or fixed agents consequently do not update their choices ov er time but still influence the decisions of others. For instance, they could portray loyal consumers of a brand or product, or staunch supporters of a political party . Fixed agents and their effects on system performance have been extensi vely studied in the context of opinion dynamics and optimization algorithms [13], [18], [19]. The first contribution of this paper is a characterization of worst-case risk metrics from both adversarial attacks as a function of the operator’ s algorithm design parameter (Section III). W e define risk in this paper as the system’ s distance to optimal efficienc y . By worst-case here we mean the maximum risk among all connected network topologies subject to any admissible adversarial attack. Hence, our analysis identifies the network topologies on which worst-case risks are attained (Section V). W e extend this analysis to randomized operator strategies (Sections IV, VI). The second contribution of this paper answers the question “if the operator succeeds in protecting the system from one type of attack, how vulnerable does it leav e the system to the other?” W e identify a fundamental tradeoff between security against broad attacks and risks from focused attacks. W e then show randomized operator strategies significantly improv es the set of attainable risk levels and their associated tradeoffs (Section IV). By characterizing this interplay , we contribute to previous work that studied the impact of adversarial influence in graphical coordination games [20]–[22]. These works analyze worst-case damages that can be inflicted by varying degrees of adversarial sophistication and intelligence in the absence of a system operator . Howe ver , these results were derived only in specific graph structures, namely ring graphs, whereas our analysis considers adversarial influence in any graph topology . I I . P R E L I M I N A R I E S A. Graphical coordination games A graphical coordination game is played between a set of agents N = { 1 , . . . , N } over a connected undirected network G = ( N , E ) with node set N and edge set E ⊂ N × N . Agent i ’ s set of neighbors is written as N i = { j : ( i, j ) ∈ E } . Each agent i selects a choice a i from its action set A i = { x, y } . The choices of all the agents constitutes an action profile a = ( a 1 , . . . , a N ) , and we denote the set of all action profiles as A = Π N i =1 A i . The local interaction between two agents ( i, j ) ∈ E is based on a 2 × 2 matrix game, described by the payoff matrix V : { x, y } 2 → R , Player j x y Player i x 1 + α sys , 1 + α sys 0 , 0 y 0 , 0 1 , 1 (1) where α sys > 0 is the system payoff gain . It indicates that x is an inherently superior product o ver y when users coordinate. Here, agents would rather coordinate than not, but prefer to coordinate on x . Agent i ’ s benefit is the sum of payoffs deriv ed from playing the game (1) with each of its network neighbors: W i ( a i , a − i ) := X j ∈N i V ( a i , a j ) . (2) A measure of system welfare defined over A is W ( a ) := N X i =1 W i ( a i , a − i ) , (3) which is simply the sum of all agent benefits. The system efficiency for action profile a ∈ A is defined as W ( a ) max a 0 ∈A W ( a 0 ) . (4) For A = { x, y } N , the all- x profile ~ x maximizes welfare. This does not necessarily hold for arbitrary action spaces. B. Log-linear learning algorithm Log-linear learning is a distributed stochastic algorithm gov erning how players’ decisions ev olve over time [14]–[16]. It may be applied to any instance of a game with each player having a well-defined local utility function U i : A → R over a set of action profiles A with an underlying interaction graph G . That is, agent i ’ s local utility is a function of its action a i and actions of its neighbors in G . Agents update their decisions a ( t ) ∈ A over discrete time steps t = 0 , 1 , . . . . Assume a (0) is arbitrarily determined. For step t ≥ 1 , one agent i is selected uniformly at random from the population. It updates its action to a i ( t ) = z ∈ A i with probability exp ( β U i ( z , a − i ( t − 1)) P z 0 ∈A i exp ( β U i ( z 0 , a − i ( t − 1)) , (5) where β > 0 is the rationality parameter . All other agents repeat their pre vious actions: a − i ( t ) = a − i ( t − 1) . For large values of β , i selects a best-response to the pre vious actions of others with high probability , and for values of β near zero, i randomizes among its actions A i uniformly at random. This induces an irreducible Markov chain over the action space A , with a unique stationary distribution π β ∈ ∆( A ) . The stochastically stable states (SSS) a ∈ A are the action profiles contained in the support of the stationary distribution in the high rationality limit: they satisfy π ( a ) = lim β →∞ π β ( a ) > 0 . Such a limiting distribution exists and is unique [15], [23], [24]. W e write the set of stochastically stable states as LLL ( A , { U i } i ∈N ; G ) . (6) For graphical coordination games, the log-linear learning algorithm specified by the action set A = { x, y } N and utilities { W i } i ∈N selects the welfare-maximizing profile ~ x as the stochastically stable state irrespective of the graph topology G . This can be sho wn using standard potential game arguments [16] (we provide these details in Section V). That is, ~ x = LLL ( A , { W i } i ∈N ; G ) for all G ∈ G N , where G N is the set of all connected undirected graphs on N nodes. Howe ver , if an adversary is able to manipulate the agents’ local decision-making rules, this statement may no longer hold true. A system operator may be able to alter the agents’ local utility functions with the goal of mitigating the loss of system efficienc y in the presence of adversarial influences. In particular , we consider the class of local utility functions { U α i } i ∈N parameterized by α > 0 . Specifically , U α i takes the same form as the benefit function (2) where α sys is replaced with a perceived gain α that is under the operator’ s control. W e next introduce models of adversarial attacks in graphical coordination games. W e then ev aluate the performance of this class of distributed algorithms in the face of adversarial attacks. I I I . M O D E L S O F A D V E R S A R I A L I N FL U E N C E In this section, we outline two models of adversarial attacks in graphical coordination games - br oad and focused attacks. The system operator specifies the local utility functions { U α i } that govern the log-linear learning algorithm by selecting the perceiv ed payoff gain α > 0 . Our goal is to assess the performance of this range of algorithms on two corresponding worst-case risk metrics, which we define and characterize. W e then identify fundamental tradeoff relations between these two risk metrics. a 1 = x a 2 = y a 3 = y a 1 = x a 2 = x a 3 = x x y y x y y α 1 2 0 op erator gain R b ( α, S ; G ) 0 1 − 1 2(1+ α sys ) (a) y y y x y x y x α α sys 1 0 op erator gain R f ( α, F ; G ) 1 − 1+ α sys 2 0 (b) Fig. 1: (Left) An example three-node line network under a broad adversarial attack. The imposter nodes are depicted as the labelled smaller circles and agents in the network are the bigger circles. The color of each circle indicates the node’ s action - green for x , blue for y . In this example, maximum welfare is max a ∈A W ( a ) = 4(1 + α sys ) , achieved when all three agents play x . The adversary’ s target set S attaches an x -imposter to node 1 and y -imposters to nodes 2 and 3 . For operator gains α ≤ 1 2 , a = ( a 1 , a 2 , a 3 ) = ( x, y, y ) is the welfare-minimizing SSS, i.e. it satisfies a = arg min a ∈ LLL ( A ,α,S ; G ) W ( a ) . This giv es a risk of R b ( α, S ; G ) = 1 − 1 2(1+ α sys ) . For α > 1 2 , the welfare-minimizing SSS is ( x, x, x ) . This giv es optimal efficiency , i.e. a risk of 0 . (Right) An example of a four node star network under a focused attack where a subset F of three nodes are targeted to be fixed (squares). Only the center node is unfixed. In this example, the maximum welfare is max a ∈A F W ( a ) = 4 , achieved when the center plays y . This is because the alternati ve action (when center plays x ) giv es the suboptimal welfare 2(1 + α sys ) < 4 due to α sys < 1 . For operator gains α < 1 , the center node plays y in the SSS. This yields optimal efficiency , i.e. the risk is R f ( α, F ; G ) = 0 . For α ≥ 1 , the center node plays x , giving a risk of R f ( α, F ; G ) = 1 − 1+ α sys 2 . The methods to calculate stochastically stable states under both types of attacks follo w standard potential game ar guments and are detailed in Section V. A. Br oad attacks and worst-case risk metric W e consider a scenario where the system is subject to broad adversarial attacks. For each agent in the network, the adversary attaches a single imposter node that acts as a neighbor that always plays x or y . These nodes are not members of the network but affect the decision making of agents that are. Let S x ⊆ N ( S y ) be the set of agents targeted with an imposter x ( y ) node. W e call the tar get set S = ( S x , S y ) . Any target set satisfies S x ∩ S y = ∅ and S x ∪ S y = N . W e call T ( G ) the set of all possible target sets S on the graph G . Giv en α > 0 , the agents’ per ceived utilities are ˜ U α i ( a i , a − i ) := ( U α i ( a i , a − i ) + 1 ( a i = y ) i ∈ S y U α i ( a i , a − i ) + (1 + α ) 1 ( a i = x ) i ∈ S x . (7) In the notation of (6), the set of stochastically stable states is written LLL ( A , { ˜ U α i } i ∈N ; G ) . Howe ver for more specificity , we will refer to it in this context as LLL ( A , α, S ; G ) . The induced network efficiency is defined as J b ( α, S ; G ) := min a ∈ LLL ( A ,α,S ; G ) W ( a ) max a 0 ∈A W ( a 0 ) = min a ∈ LLL ( A ,α,S ; G ) W ( a ) (1 + α sys ) |E | , (8) which is the ratio of the welfare induced by the welfare- minimizing SSS to the optimal welfare. The second equality abov e is due to the fact that optimal welfare is attained at ~ x (all play x ). W e re-iterate that the imposter nodes serve only to modify the stochastically stable states, and do not contribute to the system welfare W ( a ) (3). The risk from broad attacks faced by the system operator in choosing gain α is defined as R b ( α, S ; G ) := 1 − J b ( α, S ; G ) . (9) Risk measures the distance from optimal efficiency under operating gain α . Fig. 1a illustrates an example of a three- node network subject to a broad adversarial attack. The extent to which systems are susceptible to broad attacks is captured by the following definition of worst-case risk. Definition 1. The worst-case risk to br oad attacks is given by R ∗ b ( α ) := max N ≥ 3 max G ∈G N max S ∈T ( G ) R b ( α, S ; G ) , (10) The quantity R ∗ b ( α ) is the cost metric that the system operator wishes to reduce given uncertainty of the network structure and target set. Theorem 1. Let α > 0 . The worst-case br oad risk is R ∗ b ( α ) = 1 − k k +1 1 1+ α sys if α ∈ I k , for k = 1 , 2 , . . . 1 − 1 1+ α sys if α ∈ 1 , 3 2 0 if α > 3 2 (11) wher e I k := k − 1 k , k k + 1 . (12) It is a piecewise constant function on half-open intervals that is monotonically decreasing in α . An illustration is giv en in Figure 2a, along with the graphs and target sets that achieve the worst-case risks. For sufficiently high gains α > 3 / 2 , the system is safeguarded from any broad adv ersarial attack, x y y y x y y y x y y y 1 − 1 2(1+ α sys ) 1 − 2 3(1+ α sys ) 1 − 3 4(1+ α sys ) α R ∗ b ( α ) . . . ( ] ( ] ( ] 0 1 2 2 3 3 4 I 1 I 2 I 3 op erator gain (a) y y y x x y y x y y y x 1 − 1 1+ α sys 1 − 3 2(1+ α sys ) 1 − 1+ α sys 2 1 − 1+ α sys 3 α R ∗ f ( α ) 1 2 1 2 0 α sy s op erator gain (b) Fig. 2: (a) The worst-case risk from broad attacks R ∗ b ( α ) (11) is a piecewise constant function defined over countably infinite half-open intervals. The graphs and their corresponding target set which attain each level of worst-case broad risk are illustrated for α < 1 . Here, the x, y labels indicate the type of imposter influence on the agents (circles) in the network, and the color of the circles depict the action played in the welfare-minimizing SSS (green= x , blue= y ). If α ∈ I k , k = 1 , 2 , . . . (recall (12)), the worst-case risk is achie ved on a star graph of k + 2 nodes where all nodes but one are targeted with a y imposter . The one leaf node has an x imposter attached, giving a single miscoordinating link in the network. (b) The worst-case risk from focused attacks R ∗ f ( α ) (16). The graphs and their corresponding fixed sets which attain the worst-case focused risks are illustrated for α = 1 2 , 1 , and 2 . The nodes’ color represents the worst-case SSS at α (blue = y , green = x ). The targeted fixed agents are represented as squares and the unfixed agents as circles. Here 1 2 < α sys < 1 . The proofs establishing all worst-case graphs are detailed in Section V. i.e. the worst-case risk is zero. By inflating the v alue of the x -con vention, the adversary is unable to induce any mis- coordinating links or agents to play y . The technical results needed for the proof are given in Section V. B. F ocused attacks and worst-case risk metric An adversary is able to choose a strict subset of agents and force them to commit to prescribed choices. This causes them to act as fixed agents , or agents that do not update their choices ov er time. One could consider this as allowing the adversary an unlimited number of imposter nodes (instead of one) at its dispatch to attach to each agent in the subset, thereby solidifying their choices. This focused influence on a single agent is stronger than the influence a broad attack has on a single agent in the sense that the latter type does not require the agent to commit to a choice - it merely incenti vizes the agent tow ards one particular choice. Let F x ⊂ N ( F y ) be the set of fixed x ( y ) agents. W e call the fixed set F = ( F x , F y ) , which satisfies F x ∩ F y = ∅ and F x ∪ F y ⊂ N . W e call F ( G ) the set of all feasible fixed sets on a graph G ∈ G N . A fixed set F ∈ F ( G ) restricts the action space to A ( F ) , where A i ( F ) = { x } ( { y } ) ∀ i ∈ F x ( F y ) and A i ( F ) = { x, y } ∀ i / ∈ F . W e assume the adversary selects at least one fixed agent. The strict subset assumption av oids pathological cases (e.g. alternating x and y fixed nodes for an entire line network yields an efficienc y of zero). The set of stochastically stable states gi ven a fixed set F is written as LLL ( A ( F ) , { U α i } i ∈N ; G ) . Howe ver for bre vity , we will refer to it as LLL ( A ( F ) , α ; G ) . The induced ef ficiency is J f ( α, F ; G ) := min a ∈ LLL ( A ( F ) ,α ; G ) W ( a ) max a ∈A ( F ) W ( a ) , (13) which is the ratio of the welfare induced by the worst-case stable state to the optimal welfare giv en the fixed set F . The risk faced by the system operator in choosing α is defined as R f ( α, F ; G ) := 1 − J f ( α, F ; G ) . (14) Again, risk measures the distance from optimal efficiency when choosing α . The fixed nodes here differ from the imposter nodes in that they contribute to the true measured welfare (3) in addition to modifying the SSS by restricting the action set and influencing the decisions of their non-fixed neighbors. Figure 1b provides an illustrative example of a network with three fixed agents and one unfixed agent. The extent to which the system is susceptible to focused attacks is defined by the following worst-case risk metric. Definition 2. The worst-case risk from focused attacks is given by R ∗ f ( α ) := max N ≥ 3 max G ∈G N max F ∈F ( G ) R f ( α, F ; G ) . (15) The quantity R ∗ f ( α ) is the cost metric that a system operator wishes to reduce given uncertainty on the graph structure and composition of fixed agents in the network. Theorem 2. The worst-case risk fr om focused attacks is R ∗ f ( α ) = 1 − 1+ α 1+ α sys , if α < α sys 0 , if α = α sys 1 − 1+ α sys 1+ α , if α > α sys . (16) The technical results needed for the proof are gi ven in Section V. An illustration of this quantity as well as the graphs that induce worst-case risk are portrayed in Figure 2b. W e observe the choice α = α sys recov ers optimal efficienc y for any G ∈ G N and F ∈ F ( G ) . In other words, by operating at the system gain α sys , the system operator safeguards efficiency from any focused attack. Furthermore, R ∗ f ( α ) monotonically increases for α > α sys , approaching 1 in the limit α → ∞ . Intuitiv ely , the risk in this regime comes from inflating the benefit of the x conv ention, which can be harmful to system efficienc y when there are predominantly fixed y nodes in the network. For α < α sys , R ∗ f ( α ) monotonically decreases. The risk here stems from de-valuing the x con vention, which hurts efficiency when coordinating with fixed x nodes is more valuable than coordinating with fixed y nodes. C. Fundamental tradeof fs between risk and security W e describe the operator’ s tradeoffs between the two worst- case risk metrics. That is, given a lev el of security γ ∈ [0 , 1] is ensured on one worst-case risk, what is the minimum achiev able risk le vel of the other? These relations are direct consequences of Theorems 1 and 2. Remark 1. Before pr esenting the tradeoff r elations, we first observe that since R ∗ f ( α ) is decr easing on α < α sys and R ∗ b ( α ) is decreasing in α , the operator should not select any gain α < α sys , as it worsens both risk levels. Hence for the r est of this paper , we only consider gains greater than α sys . Corollary 1. F ix γ f ∈ [0 , 1) . Suppose R ∗ f ( α ) ≤ γ f for some α . Then R ∗ b ( α ) ≥ R ∗ b 1 + α sys 1 − γ f − 1 . (17) Pr oof. From (16), R ∗ f ( α ) ≤ γ f implies α ≤ 1+ α sys 1 − γ f − 1 . Since R ∗ b ( α ) is a decreasing function in α , we obtain the result. In words, as the security from worst-case focused attacks improv es ( γ f lowered), the risk from worst-case broad attacks increases. A tradeoff relation also holds in the opposite direc- tion. Corollary 2. F ix γ b ∈ [0 , 1] . Suppose R ∗ b ( α ) ≤ γ b for some α . Suppose α sys ∈ I k sys for some k sys ∈ { 1 , 2 , . . . } . Then R ∗ f ( α ) ≥ 0 if γ b ∈ h 1 − k sys k sys +1 1 1+ α sys , 1 i > R ∗ f k k +1 if γ b ∈ h 1 − k k +1 1 1+ α sys , 1 − k − 1 k 1 1+ α sys for k = k sys , k sys + 1 , . . . ≥ R ∗ f (1) if γ b = 1 − 1 1+ α sys > R ∗ f 3 2 if γ b ∈ h 0 , 1 − 1 1+ α sys (18) If α sys ∈ [1 , 3 / 2] , R ∗ f ( α ) ≥ 0 if γ b ∈ h 1 − 1 1+ α sys , 1 i > R ∗ f 3 2 if γ b ∈ h 0 , 1 − 1 1+ α sys (19) If α sys > 3 2 , then R ∗ f ( α ) ≥ 0 for any γ b . Pr oof. All bounds are computed by finding inf α R ∗ f ( α ) s.t. R ∗ b ( α ) ≤ γ b . The relations ≥ and > follo w from the fact that R ∗ f ( α ) is increasing in α > α sys , and depending on whether R ∗ f can attain the resulting value. Here, as the security from worst-case broad attacks im- prov es ( γ b lowered), the risk from worst-case focused attacks increases. Each of the broad risk levels can be attained for a range of focused risks. An illustration of the attainable worst- case risk lev els is giv en in Fig. 3 (blue). I V . R A N D O M I Z E D O P E R A T O R S T R A T E G I E S In this section, we consider the scenario where the operator randomizes ov er multiple gains. W e present a definition and a characterization of worst-case expected risks. W e then identify the risk-security tradeoffs av ailable in the randomized gain setting. W e observe they significantly improve upon the deter - ministic gain setting (Fig. 3). W e then identify ways to further improv e these tradeoffs through different randomizations. A. W orst-case expected risks Suppose the operator selects a gain from the M distinct values α = { α k } M k =1 satisfying α 1 < α 2 < · · · < α M with the probability distribution p = [ p 1 , . . . , p M ] > ∈ ∆ M . Here we denote ∆ M = { p ∈ R M + : P M j =1 p j = 1 } as the set of all M -dimensional probability vectors. In other words, the operator employs the payof f gain α j with probability p j . W e consider the following natural definitions of expected risks. Giv en a graph G ∈ G N and target set S ∈ T ( G ) , let E α , p [ R b | S, G ] := P M j =1 p j R b ( α j , S ; G ) be the expected adversarial risk of the operator’ s strategy α , p . The worst-case expected risk from broad attacks is defined as E ∗ α , p [ R b ] := max N ≥ 3 max G ∈G N max S ∈T ( G ) E α , p [ R b | S, G ] . (20) Similarly , given a fixed set F ∈ F ( G ) , let E α , p [ R f | F , G ] := P M j =1 p i R f ( α j , F ; G ) be the expected risk from focused at- tacks. The worst-case expected risk from focused attacks is defined as E ∗ α , p [ R f ] := max N ≥ 3 max G ∈G N max F ∈F ( G ) E α , p [ R f | F , G ] . (21) Theorem 3. Suppose the operator randomizes with gains α = { α k } M k =1 accor ding to p ∈ ∆ M . Then the worst-case expected br oad risk is E ∗ α , p [ R b ] = max k =1 ,...,M k X j =1 p j R ∗ b ( α k ) . (22) The worst-case expected focused risk is E ∗ α , p [ R f ] = max k =1 ,...,M M X j = k p j R ∗ f ( α k ) . (23) The proofs are giv en in Section VI. The characterization of worst-case expected risk is a discounted weighting of a deterministic worst-case risk lev el. This suggests that the risk lev els achiev able by randomization can improve upon the risks induced from a deterministic gain. B. Risk tradeof fs under randomized operator strate gies Giv en a level of security γ ∈ [0 , 1] is ensured on one ex- pected worst-case metric, what is the the minimum achie vable risk level on the other? W e find this can be calculated through a linear program. W e formalize these tradeoffs in the follo wing two statements, which are analogous to Corollaries 1 and 2. Corollary 3. F ix γ f ∈ [ R ∗ f ( α 1 ) , 1] and a set of gains α = { α j } M j =1 . Suppose E ∗ α , p [ R f ] ≤ γ f for some p ∈ ∆ M . Then E ∗ α , p [ R b ] ≥ v b ( γ f , α ) , (24) wher e v b ( γ , α ) is the value of the following linear pr ogram. v b ( γ f , α ) = min p 0 ,v v s.t. M X i =1 p 0 i = 1 , p i ≥ 0 ∀ i = 1 , . . . , M v ∈ [0 , 1] A LP p 0 v 0 M γ f 1 M (25) wher e denotes elementwise ≤ , 0 M and 1 M ar e column M - vectors of zer os and ones r espectively , and A LP is the 2 M × ( M + 1) matrix A LP = R ∗ b ( α 1 ) 0 · · · 0 − 1 R ∗ b ( α 2 ) R ∗ b ( α 2 ) · · · . . . . . . . . . . . . 0 R ∗ b ( α M ) · · · · · · R ∗ b ( α M ) − 1 R ∗ f ( α 1 ) · · · · · · R ∗ f ( α 1 ) 0 0 R ∗ f ( α 2 ) · · · R ∗ f ( α 2 ) . . . . . . . . . . . . 0 · · · 0 R ∗ f ( α M ) 0 . (26) Mor eover , v b ( γ f , α ) is decr easing in γ f . Pr oof. W e need to show equiv alence between the linear pro- gram (25) and the optimization problem min p 0 ∈ ∆ M E ∗ α , p 0 [ R b ] subject to E ∗ α , p 0 [ R f ] ≤ γ f . (27) Let A b ( α ) ∈ R M × M be the matrix defined by the upper left block of (26) and A f ( α ) by the bottom left block. From Theorem 3, we can express E ∗ α , p 0 [ R b ] as the max- imum element of the M -vector A b ( α ) p 0 , and similarly E ∗ α , p 0 [ R f ] as the maximum element of A f ( α ) p 0 . Hence, E ∗ α , p 0 [ R f ] ≤ γ f is the linear constraint [ A f ( α ) p 0 ] i ≤ γ for all i = 1 , . . . , M . The objectiv e min p 0 ∈ ∆ M E ∗ α , p 0 [ R b ] itself can be cast as a linear objectiv e with linear constraints, i.e. min p 0 ∈ ∆ M ,v ∈ [0 , 1] v s.t. [ A b ( α ) p 0 ] i ≤ v . Combining these two, we obtain (25). The claim v b ( γ , α ) is decreasing in γ follows as a consequence of the linear program (25). W e note that a worst-case expected focused risk E ∗ α , p [ R f ] < R ∗ f ( α 1 ) is not attainable because α 1 is the smallest gain it mixes with. Hence, the linear program (25) is infeasible for γ f < R ∗ f ( α 1 ) . The following tradeoff relation holds in the opposite direction. Fig. 3: Security-risk tradeof fs are depicted by the achie vable worst- case risk lev els from deterministic gains (blue) and randomized gains (red, green, black). The P areto frontiers for three dif ferent randomized strategies α 1 , α 2 ∈ R 5 + , and α 3 ∈ R 300 + , are sho wn in increasing order of improvement. The strategies α 1 and α 2 randomize over the highest three broad risk lev els in addition to the lowest two. The strategy α 3 randomizes over the highest 298 broad risk le vels and the lo west two. W e chose the v alues as follows. For k = 1 , 2 , we set α k 1 = α sys , α k j = (1 − k ) j − 1 j + k j j +1 ∈ I j for j = 2 , 3 , α k 4 = 1 + k , and α k 5 = 3 2 + k . W e have set 1 = 0 . 5 and 2 = . 01 . Hence, Par( α 2 ) improv es upon Par( α 1 ) via Claim 1. For k = 3 , we set α 3 1 = α sys , α 3 j = (1 − 3 ) j − 1 j + 3 j j +1 ∈ I j , j = 2 , 3 , . . . , 298 , α 3 299 = 1 + 3 , and α 3 5 = 3 2 + 3 . Claim 2 ensures Par( α 3 ) improves upon Par( α 2 ). W e chose 3 = . 01 and α sys = 1 / 4 . Corollary 4. Fix γ b ∈ [ R ∗ b ( α M ) , 1] and a set of gains α = { α j } M j =1 . Suppose E ∗ α , p [ R b ] ≤ γ b for some p ∈ ∆ M . Then E ∗ α , p [ R f ] ≥ v f ( γ b , α ) , (28) wher e v f ( γ b , α ) is the value of the following linear pro gram. v f ( γ b , α ) = min p ,v v s.t. M X i =1 p i = 1 , p i ≥ 0 ∀ i = 1 , . . . , M v ∈ [0 , 1] A f ( α ) − 1 M A b ( α ) 0 M p v 0 M γ b 1 M , (29) wher e A f ( α ) and A b ( α ) ar e defined as the bottom and top left bloc ks of (26) , respectively . Furthermor e, v f ( γ b , α ) is decr easing in γ b . W e omit the proof as it is similar to that of Corollary 3. Note a worst-case expected broad risk E ∗ α , p [ R b ] < R ∗ b ( α M ) is not attainable since α M is the highest gain it mixes with - (29) is infeasible for γ b < R ∗ b ( α M ) . Fig. 3 plots the best achiev able risk lev els of three randomized operator strategies (red, green, and black). C. Impr ovement of risk tradeoffs The tradeoff relations describe the best achiev able lev el on one risk metric giv en the other is subject to a security constraint when the gains α are fixed. One way to improve the achiev able risks is to decrease the a v ailable gains. Claim 1. Let α , α 0 ∈ R M . Suppose α j ∈ I k j (r ecall (12) ), j = 1 , . . . , M for some non-decreasing subsequence k j ≥ 1 . Let α 0 satisfy α 0 j ∈ I k j with α 0 j < α j . Then for all γ b ∈ [ R ∗ b ( α M ) , 1] , v f ( γ b , α 0 ) ≤ v f ( γ b , α ) . Similarly , for all γ f ∈ [ R ∗ f ( α 1 ) , 1] , v b ( γ f , α 0 ) ≤ v b ( γ f , α ) . Randomizing over additional gains can also improv e the achiev able risks. Claim 2. Suppose α ∈ R M and α 0 ∈ R M 0 with M < M 0 , and assume α 0 contains the elements of α . Then the assertion of Claim 1 holds. The proofs of the above two Claims follo w directly from the formulation of the LPs (25), (29), and hence we omit them. Fig. 3 depicts the best achiev able risk le vels of three randomized operator strategies of increasing improvement due to Claims 1 and 2 (red, green, and black curves). In particular , these plots constitute the P areto fr ontier of all attainable expected risks among distributions p given a fixed set of gains. That is, for any α , we say a risk level E α , p [ R f ] E α , p [ R b ] ∈ R 2 belongs to the frontier Par( α ) if there does not exist a p 0 6 = p such that E α , p 0 [ R f ] E α , p 0 [ R b ] E α , p [ R f ] E α , p [ R b ] . W ithin Par( α ), the operator can only improv e upon one worst-case risk metric by sacrificing performance on the other . From Corollary 4, the frontier given gains α is the set of points Par ( α ) = v f ( γ b , α ) γ b ∈ R 2 : γ b ∈ [ R ∗ b ( α M ) , R ∗ b ( α 1 )] . (30) The parameter γ b is upper bounded here by R ∗ b ( α 1 ) since any risk level with E α , p [ R b ] > R ∗ b ( α 1 ) is unattainable under α . Hence, the values v f ( γ b , α ) and v f ( R ∗ b ( α 1 ) , α ) are equiv alent for γ b > R ∗ b ( α 1 ) . The frontiers in Fig. 3 are generated by numerically solving the linear program (29) for a finite grid of points γ b ∈ [ R ∗ b ( α M ) , R ∗ b ( α 1 )] . As we hav e seen, the transition from deterministic to ran- domized gains ensures a reduction of risk levels. Randomizing ov er only a few dif ferent gains substantially improves upon the attainable deterministic worst-case risks. Ho wev er, a detailed quantification of such improvements remains a challenge due to the high dimensionality of the model. In particular , we hav e yet identified a “limit” frontier that could be obtained by repeated modifications to the gain vector detailed by Claims 1 and 2. V . P RO O F O F T H E O R E M S 1 A N D 2 : D E T E R M I N I S T I C W O R S T - C A S E R I S K S In this section, we de velop the technical results that charac- terize the worst-case risk metrics R ∗ b ( α ) and R ∗ f ( α ) (Theorems 1 and 2). Before presenting the proofs, we first present some preliminaries on potential games [25], which are essential to calculating stochastically stable states. W e then define relev ant notations for the forthcoming analysis. A. P otential games Graphical coordination games fall under the class of po- tential games - games where individual utilities { U i } i ∈N are aligned with a global objectiv e, or potential function. A game is a potential game if there exists a potential function φ : A → R which satisfies φ ( a i , a − i ) − φ ( a 0 i , a − i ) = U i ( a i , a − i ) − U i ( a 0 i , a − i ) (31) for all i ∈ N , a ∈ A , and a 0 i 6 = a i [25]. In potential games, the set of stochastically stable states (6) are precisely the action profiles that maximize the potential function [15], [16]. Specifically , LLL ( A , { U i } i ∈N ; G ) = arg max a ∈A φ ( a ) . Our analysis relies on characterizing a potential function for the graphical coordination game in the presence of adversarial influences. This allows us to compute stochastically stable states in a straightforward manner . B. Relevant notations for analysis Any action profile a on a graph G = ( N , E ) ∈ G N decomposes N into x and y -partitions. A node that belongs to a y -partition ( x -partition) has a i = y ( x ). The partitions are enumerated {P 1 y , . . . , P k y y } and {P 1 x , . . . , P k x x } , are mutually disjoint, and cov er the graph. Each partition is a connected subgraph of G . It is possible that k x = 0 with k y = 1 (when a = ~ y ), k x = 1 with k y = 0 (when a = ~ x ), or k y , k x ≥ 1 . For any subset of nodes A, B ⊆ N , let us denote e ( A, B ) := { ( i, j ) ∈ E : i ∈ A, j ∈ B } (32) as the set of edges between A and B . W e write A c as the complement of A . W e extensiv ely use the notation W α ( E , a ) := X ( i,j ) ∈ E V α ( a i , a j ) (33) as the welfare due to edge set E ⊆ E in action profile a , where V α is of the form (1) with α sys replaced by α . For compactness, we will denote W ( E , a ) as W α sys ( E , a ) for the local system welfare generated by the edges E . Our analysis will also rely on the following mediant inequality . Fact 1. Suppose n i ≥ 0 and d i > 0 for each i = 1 , . . . , m ∈ N . Then P m i =1 n i P n i =1 d i ≥ min i n i d i . (34) W e r efer to the LHS above as the mediant sum of the n i d i . C. Characterization of R ∗ b : worst-case br oad risk T o prov e Theorem 1, we seek a pair ( S, G ) with G ∈ G N of any size N ≥ 3 and S ∈ T ( G ) , that minimizes ef ficiency J b ( α, S ; G ) (maximizes risk R b ( α, S ; G ) ). Our method to find the minimizer is to sho w any ( S, G ) can be transformed into a star network with a particular target set that has lower efficienc y , when α < 1 . Thus, in this regime the search for the worst-case graph reduces to the class of star networks of arbitrary size. For α ≥ 1 , structural properties allow us to deduce the minimal efficienc y . The graphical coordination game defined by A = { x, y } N , perceiv ed utilities { ˜ U α i } i ∈N (7), target set S , and graph G falls under the class of potential games [25]. A potential function is giv en by 1 2 W α ( a ) + (1 + α ) X i ∈ S x 1 ( a i = x ) + X i ∈ S y 1 ( a i = y ) (35) where W α ( a ) := X i ∈N U α i ( a ) . (36) Hence, the stochastically stable states LLL ( A , α, S ; G ) are maximizers of (35). Suppose ˆ a = arg min a ∈ LLL ( A ,α,S ; G ) W ( a ) is the welfare-minimizing SSS inducing the partitions {P k z } k z k =1 , z = x, y . W e can express its efficienc y from (8) as P k y k =1 | e ( P k y , P k y ) | + (1 + α sys ) P k x k =1 | e ( P k x , P k x ) | (1 + α sys )( P k y k =1 | e ( P k y , N ) | + P k x k =1 | e ( P k x , P k x ) | ) . (37) Note the denominator is simply the number of edges in G multiplied by 1 + α sys . From (35), each y -partition P k y in ˆ a satisfies 1 |P k y | + | e ( P k y , P k y ) | ≥ max a P k y 6 = ~ y P k y W α ( e ( P k y , N ) , ( a P k y , ˆ a −P k y )) + X i ∈P k y 1 ( a i = y ) . (CY) In words, no subset of agents in P k y can deviate from y to improv e the collectiv e perceiv ed welfare of P k y . A similar stability condition holds for each x -partition P k x . (1 + α ) |P k x | + | e ( P k x , P k x ) | ≥ max a P k x 6 = ~ x P k x W α ( e ( P k x , N ) , ( a P k x , ˆ a −P k x )) + (1 + α ) X i ∈P k x 1 ( a i = x ) (CX) The following result characterizes the threshold on α above which any network is safeguarded from any imposter attack. Lemma 1. Let N ≥ 3 . Then α > N N − 1 if and only if min G ∈G N min S ∈T ( G ) J b ( α, S ; G ) = 1 . (38) Pr oof. ( ⇒ ) Let α > N N − 1 . Suppose there is a pair ( S, G ) with J b ( α, G, S ) < 1 . Then there must exist a y -partition P y ⊂ N . From (CY), |P y | + | e ( P y , P y ) | ≥ (1 + α ) | e ( P y , N ) | > 2 | e ( P y , N ) | . (39) Since G is connected, | e ( P y , P y ) | ≥ |P y | − 1 and there is at least one outgoing link from P y , i.e. | e ( P y , P c y ) | ≥ 1 . Consequently , | e ( P y , N ) | ≥ |P y | , from which we obtain | e ( P y , N ) | + | e ( P y , P y ) | > 2 | e ( P y , N ) | . (40) 1 Since we are seeking worst-case pairs ( S, G ) , we may consider any y - partition as only having y imposters placed among its nodes. This is because any x imposters that were placed in a resulting y -partition can be replaced by y -imposters and retain stability . W e reflect this generalization in (CY) and (CX), where influence from only y ( x ) imposters is considered. which is impossible. ( ⇐ ) Assume min G ∈G N min S ∈T ( G ) J b ( α, S ; G ) = 1 . Then no y -partition can exist for any graph. In particular, (CY) is violated for P y = N . N + |E | < (1 + α ) |E | ⇒ α > N |E | . (41) Since |E | ≥ N − 1 , we obtain α > N N − 1 . W e also deduce the follo wing minimal ef ficiencies for any graph when 1 ≤ α ≤ N N − 1 . Lemma 2. Suppose N ≥ 3 . Then α ∈ [1 , N N − 1 ] if and only if min G ∈G N min S ∈T ( G ) J b ( α, S ; G ) = 1 1 + α sys . (42) Pr oof. The ( ⇒ ) direction follows the same argument as Lemma 1. ( ⇐ ) The assumption implies the only y -partition that is stabilizable is N . Then for any P y ⊂ N , (CY) is violated, i.e. |P y | + | e ( P y , P y ) | < (1 + α ) | e ( P y , N ) | . (43) Since G is connected and there is at least one outgoing edge from P y , we obtain 2 |P y | − 1 |E | < 1 + α (44) The above holds for any graph G = ( N , E ) and subset of nodes P y ⊂ N . From the facts that |P y | ≤ N − 1 and |E | ≥ N − 1 , we have α > N − 2 N − 1 for any N ≥ 3 . Consequently , α ≥ 1 and Lemma 1 establishes that α ≤ N N − 1 . The class of star graphs is central to the worst-case analysis in the interval 0 < α < 1 . Definition 3. Let S N be the set of all ( S, G ) wher e G is the star graph with N nodes, S y contains the center node, and S x = N \ S y . An immediate consequence of this definition is the leaf nodes satisfy (CX). The efficiency is then proportional to the fraction of leaf nodes that are stable to y , if any . Furthermore, the stability condition (CY) of P y = S y for members of S N simplifies to 2 | e ( P y , P y ) | + 1 ≥ (1 + α )( N − 1) . (45) In other words, stability of the target set S y as a y -partition hinges on (CY) being satisfied for the selection a P y = ~ x . The following result reduces the search space for efficienc y minimizers to S N when α < 1 . Lemma 3. Suppose 0 < α < 1 and n ≥ 3 . Consider any ( S, G ) with G ∈ G N , S ∈ T ( G ) . Then ther e is a ( S 0 , G 0 ) ∈ S N 0 such that J b ( α, S 0 ; G 0 ) ≤ J b ( α, S ; G ) for some N 0 ≥ N . The idea of the proof is to construct a member of S N 0 by re- casting the y and x -partitions of ( S, G ) as star subgraphs while preserving the same number and type of edges, thus preserving efficienc y . Further ef ficiency reduction can be achiev ed by con verting excess x links into y links in this star configuration. W e provide the proof detailing the constructive procedure in the Appendix. W e now characterize the minimal efficienc y for the star graph of size N , J ∗ N ( α ) := min ( G,S ) ∈ S N J b ( α, S ; G ) for α < 1 . Lemma 4. Suppose α < 1 and fix N ≥ 3 . Then J ∗ N ( α ) = 1 (1 + α sys )( N − 1) (1 + α )( N − 1) − 1 2 . (46) Pr oof. The goal is to find the smallest y -partition of the n star that is still stabilizable under a gain α . This is written J ∗ N ( α ) = min N y 1 1 + α sys N y N − 1 s.t. ( N y ≤ N − 1 (size of y -partition) 2 N y + 1 ≥ (1 + α )( N − 1) (stability) (47) The smallest integer N y that satisfies the constraints is l (1+ α )( N − 1) − 1 2 m for α ∈ (0 , 1) . Pr oof of Theorem 1. For α < 1 , by Lemma 3, the worst-case efficienc y is min N ≥ 3 min ( G,S ) ∈ S N J b ( α, S ; G ) = min N ≥ 3 J ∗ N ( α ) . (48) Using the formula of Lemma 4, we obtain the first entry in (11). Lemma 2 asserts the minimal efficiency is 1 1+ α sys for α ∈ [1 , 3 2 ] because the upper bound N N − 1 is maximized at N = 3 (for N ≥ 3 ). This gi ves the second entry in (11). Lastly , Lemma 1 asserts the minimal efficiency is 1 for α > 3 2 . D. Characterization of R ∗ f : worst-case focused risk Our approach for the proof of Theorem 2 differs from that of R ∗ b . Instead of reducing the search of worst-case graphs, we simply provide an upper bound on R ∗ f ( α, F ; G ) for any G and fixed set F ∈ F ( G ) , and show one can construct a graph with fixed nodes that achieves it. . W e observe 1 2 W α ( a ) : A ( F ) → R serves as a potential function (recall (36)) for the game with restricted action set A ( F ) and utilities { U α i } i ∈N . Hence, the stochastically stable states LLL ( A ( F ) , α ; G ) are maximizers of 1 2 W α ( a ) . Suppose ˆ a = arg min a ∈ LLL ( A ( F ) ,α ; G ) W ( a ) decomposes the graph into the x and y -partitions {P k z } k z k =1 , z = x, y . W e express its efficienc y (13) as P k y k =1 | e ( P k y , P k y ) | + (1 + α sys ) P k x k =1 | e ( P k x , P k x ) | P k y k =1 W α sys ( e ( P k y , N ) , a ∗ ) + P k x k =1 W α sys ( e ( P k x , P k x ) , a ∗ ) (49) where a ∗ = arg max a ∈A ( F ) W ( a ) is the welfare-maximizing action profile. Similar to (CY), each y -partition P k y formed from ˆ a satisfies the stability condition | e ( P k y , P k y ) | ≥ max a P k y 6 = ~ y W α ( e ( P k y , N ) , ( a P k y , ˆ a −P k y )) . (CYE) T o reduce cumbersome notation, it is understood the max is taken ov er actions of unfixed nodes, a P k y \ F . Likewise, each x -partition P k x satisfies (1 + α ) | e ( P k x , P k x ) | ≥ max a P k x 6 = ~ x W α ( e ( P k x , N ) , ( a P k x , ˆ a −P k x )) . (CXE) The follo wing lemma asserts that agents playing y in the SSS under the gain α remain playing y under a lower gain α 0 < α . The result is crucial for establishing a lower bound on efficienc y for any graph G with arbitrary fixed set F ∈ F ( G ) . Lemma 5. Suppose α 0 < α . Denote ˆ a 0 = arg min a ∈ LLL ( A ( F ) ,α 0 ; G ) W ( a ) as the welfare-minimizing SSS under α 0 . Then for any y -partition P y induced fr om α , ˆ a 0 i = y for all i ∈ P y \ F . Pr oof. Condition (CYE) asserts for all a P y 6 = ~ y that W α ( e ( P y , N ) , ( ~ y P y , ˆ a −P y )) ≥ W α ( e ( P y , N ) , ( a P y , ˆ a P y )) . (50) It also holds for all a P y 6 = ~ y and for any a −P y 6 = ˆ a −P y that W α ( e ( P y , N ) , ( ~ y P y , a −P y )) ≥ W α ( e ( P y , N ) , ( a P y , a −P y )) (51) because any y -links garnered in the RHS above by changing ˆ a −P y to a −P y also contribute to the LHS. In particular , the abov e holds for a −P y = ˆ a 0 −P y . Lowering the gain to α 0 preserves the above inequality as well, as it de-values x -links garnered on the RHS. A dual statement holds - agents playing x in the SSS under α remain so under a higher gain α 0 > α . Lemma 6. Suppose α 0 > α . Then for any x -partition P x induced fr om α , ˆ a 0 i = x for all i ∈ P x \ F . W e omit the proof for brevity , as it is analogous to the proof of Lemma 5. W e are no w ready to pro ve Theorem 2. Pr oof of Theorem 2. Consider any graph G ∈ G N with fixed set F . Recall that efficienc y is one for α = α sys . Thus, we first consider α < α sys . Observe that | e ( P k y , P k y ) | ≥ W α ( e ( P y , N ) , ( a ∗ P y , ˆ a −P y )) = W α ( e ( P y , N ) , ( a ∗ P y , a ∗ −P y )) (52) where the inequality is due to (CYE). The equality results from Lemma 6 - the agents ( / ∈ P y ) that neighbor any member of P y remain playing x in a ∗ . W e then obtain | e ( P k y , P k y ) | W ( e ( P k y , N ) , a ∗ ) ≥ 1 + α 1 + α sys . (53) The inequality results since the e xpressions of the numerator and denominator garner the same edges for welfare. It occurs with equality if and only if a ∗ i = x ∀ i ∈ P k y \ F . Applying the mediant inequality (34) to (49), J f ( α, F ; G ) ≥ 1+ α 1+ α sys . The case when α > α sys follows analogous ar guments. From Lemma 5, | e ( P k y , P k y ) | = W α ( e ( P k y , P k y ) , a ∗ ) . For x - partitions, (1 + α sys ) | e ( P k x , P k x ) | W ( e ( P k x , N ) , a ∗ ) ≥ 1 + α sys 1 + α W α ( e ( P k x , N ) , a ∗ ) W ( e ( P k x , N ) , a ∗ ) ≥ 1 + α sys 1 + α (54) where the first inequality is from (CXE) and the second occurs with equality if a ∗ i = y ∀ i ∈ P k x \ F . From (34) and (49), J f ( α, F ; G ) ≥ 1+ α sys 1+ α . W e hav e just sho wn fundamental lower bounds on ef ficiency for any graph with fixed agents. The bounds are tight as they can be achieved for any gain α by arranging N x fixed x and N y fixed y leaf nodes that influence a single unfixed agent in the center of a star graph. If α < α sys , choosing N x N y = 1 1+ α giv es the minimal efficienc y 1+ α 1+ α sys . If α > α sys , choosing N x N y = 1 1+ α giv es the minimal ef ficiency 1+ α sys 1+ α . Note that if α is rational, one could choose finite integers N y , N x that achiev e such ratios. Recall Figure 2b for illustrativ e examples. Howe ver if it is irrational, they must be taken arbitrarily large to better approximate the ratio. V I . P R O O F O F T H E O R E M 3 : W O R S T - C A S E R I S K S U N D E R R A N D O M I Z E D O P E R A T O R D E S I G N S Recall a randomized strategy consists of gains α = { α i } M i =1 with distribution p ∈ ∆ M . The gains are ordered α sys ≤ α 1 < · · · < α M . T o prove Theorem 3, we outline a few technical Lemmas. The ke y insight is the expected efficienc y of any graph G can be expressed in the form P M i =1 p i s i , where the coef ficient s i is a mediant sum ov er local efficiencies of partitions in G when gain α i is used. The following two mathematical facts are the basis of this insight. Fact 2. Let ν i < n i d i ≤ 1 with r i ≥ 0 and n i , d i > 0 for all i = 1 , . . . , M . Then for all p ∈ ∆ M , M X i =1 p i s i ≥ 1 + min i =1 ,...,M i X j =1 p j ( ν i − 1) (55) wher e s i := P i − 1 j =1 d j + P M j = i n j P M j =1 d j , i = 1 , . . . , M . W e provide a proof in the Appendix. The follo wing dual result follows directly . Fact 3. F or all p ∈ ∆ M , M X i =1 p i s 0 i ≥ 1 + min i =1 ,...,M M X j = i p j ( ν i − 1) (56) wher e s 0 i := P i j =1 n j + P M j = i d j P M j =1 d j , i = 1 , . . . , M . Pr oof. The proof follows similarly to F act 2, where the indices of the s i coefficients are rev ersed. W e will show for any ( S , G ) that E α , p [ J b | S, G ] = 1 − E α , p [ R b | S, G ] can be expressed in the form P M i =1 p i s i from the LHS of (55). The lower bounds establish worst-case ex- pected efficiencies - and hence risks. The ν i correspond to the worst-case deterministic efficiencies J ∗ b ( α i ) = 1 − R ∗ b ( α i ) of the M gains and n i d i to local efficiencies of selected partitions in the graph. Fact 2 will be used to establish (22), and Fact 3 for (23) (Theorem 3). W e now identify a structural property required of worst-case graphs. Lemma 7. A worst-case graph, i.e. a member of arg min G ∈G N ,S ∈T ( G ) E α , p [ J b | S, G ] , has no active x -links in α 1 . Pr oof. Any activ e x -links in α 1 remain so for all { α i } M i =2 . The ef ficiency corresponding to each gain can be reduced in the follo wing manner . Delete all such x -links and associated agents. For each mis-coordinating link between an x and y agent that existed, replace with a single link to a newly created isolated agent with an x -imposter attached. This preserves the stochastically stable states of all other nodes while reducing efficienc y in each gain. Intuitiv ely , a graph that has coordinating x nodes in each gain α 1 , . . . , α M can be modified by removing these links, resulting in a lower efficienc y . W e are now ready to prov e (22) (Theorem 3). Pr oof of (22) (Theorem 3). Consider any graph G = ( N , E ) ∈ G N and S ∈ T ( G ) . Let us denote the M (worst-case) stochastically stable states that correspond to each gain α i with ˆ a i . Define for each k = 1 , . . . , M P k = { n ∈ N : ˆ a i n = y ∀ i ≤ k , ˆ a i n = x ∀ i > k } (57) as the set of nodes that play y in the SSS in α 1 , . . . , α k and play x in α k +1 , . . . , α M . Note that P k is possibly composed of multiple y -partitions. Also note it is possible that P k = ∅ for all k > ¯ m for some ¯ m ∈ { 2 , . . . , M − 1 } - that is, ˆ a i = ~ x for all i > ¯ m . W e first consider the case when P k 6 = ∅ for ev ery k = 1 , . . . , M . Let Q k := { n ∈ N : ˆ a k n = y } = S M i = k P i . Denote P x := { n ∈ N : ˆ a 1 n = x } = ( Q 1 ) c as the set of nodes stable to x for all α i . Consider the gain α i with i ≤ k . Then the local efficienc y W ( e ( P k , N ) , ˆ a k ) W ( e ( P k , N ) , ( a ∗ P k , ˆ a k − P k )) of P k is | e ( P k , Q k +1 ) | + | e ( P k , P k ) | (1 + α sys )( | e ( P k , P k ) | + | e ( P k , P x ) | + | e ( P k , ( Q k ) c ) | ) > J ∗ A ( α i ) . (58) The inequality is due to Proposition 1. F or gains α i with i > k , the local efficienc y of P k is (1 + α sys )( | e ( P k , P k ) | + | e ( P k , P x ) | + | e ( P k , ( Q k ) c ) | ) (1 + α sys )( | e ( P k , P k ) | + | e ( P k , P x ) | + | e ( P k , ( Q k ) c ) | ) = 1 . (59) Hence, the o verall system efficienc y under gain α i is the mediant sum of the local efficiencies of the P k . An application of Fact 2 giv es the result. The case when P k = ∅ for k > ¯ m ∈ { 2 , . . . , M − 1 } also follows directly from Fact 2. From the notation of Fact 2, n k d k = 1 for k > ¯ m . The details for the proof of (22) (Theorem 3) follow analogous arguments pertaining to focused attacks. Recall for a graph G ∈ G n and restricted action set A , we denote F = F x ∪ F y ⊂ N as its set of fixed nodes. Additionally , we restrict attention to gains α i ≥ α sys , as these are not strictly dominated in the risk curve. The follo wing structural property holds in a worst-case graph for focused risk. Lemma 8. A worst-case graph, i.e., a member of arg min G ∈G N ,F ∈F ( G ) E α , p [ J f | F , G ] , has no active y -links in α M . Additionally , a ∗ F c = ~ y . Pr oof. A graph that has active y -links in α M remain activ e for all α 1 , . . . , α M − 1 . The efficienc y corresponding to each gain can be reduced by removing all such links and keeping the border nodes as fixed y agents. This preserves the stability properties of all other nodes. The claim a ∗ F c = ~ y follows from Lemma 5. W e are now ready to prov e (23) in Theorem 3. Pr oof of (23) (Theorem 3). Consider any graph G = ( N , E ) ∈ G N and fixed nodes F ∈ F ( G ) . The M stochastically stable states that correspond to each gain α i are denoted ˆ a i . Define for each k = 1 , . . . , M P k = { n ∈ F c : ˆ a i n = x ∀ i ≥ k , ˆ a i n = y ∀ i < k } (60) as the set of unfixed nodes that play x in the SSS for α k , . . . , α M and play y in α 1 , . . . , α k − 1 . Note that it is possible P k = ∅ for all k < ¯ m for some ¯ m ∈ { 2 , . . . , M − 1 } . That is, a k F c = ~ y for k = 1 , . . . , ¯ m − 1 . W e first consider the case when P k 6 = ∅ for ev ery k = 1 , . . . , M . Let Q k = { n ∈ F c : ˆ a k n = y } = S M i = k P i . Con- sider the gain α i with i ≥ k . Then the local efficienc y W ( e ( P k , N ) , ˆ a k ) W ( e ( P k , N ) , ( a ∗ P k , ˆ a k − P k )) of P k is (1 + α sys )( | e ( P k , P k ) | + | e ( P k , ( Q k − 1 ) c ) | + | e ( P k , F x ) | ) | e ( P k , P k ) | + | e ( P k , Q k ) | + | e ( P k , F y ) | > J ∗ f ( α i ) . (61) Here, we use the con vention | e ( P 1 , ( Q 0 ) c ) | = 0 . For gains α i with i < k , the local efficiency of P k is | e ( P k , P k ) | + | e ( P k , Q k ) | + | e ( P k , F y ) | | e ( P k , P k ) | + | e ( P k , Q k ) | + | e ( P k , F y ) | = 1 . (62) Hence the overall system efficiency under α i is the mediant sum of the local efficiencies of the P k . An application of Fact 3 gives the result. The case when P k = ∅ for k > ¯ m ∈ { 2 , . . . , M − 1 } also follows directly from Fact 3. V I I . S U M M A RY In this paper , we framed graphical coordination games as a distributed system subject to two types of adversarial influences. The focus of our study concerned the performance of a class of distrib uted algorithms against the associated worst-case risks. W e identified fundamental tradeof fs between ensuring security against one type of risk and vulnerability to the other , and vice versa. Furthermore, our analysis shows randomized algorithmic designs significantly improves the av ailable tradeoffs. Our work highlights the design challenges a system operator faces in maintaining the efficiency of networked, distributed systems. A P P E N D I X Pr oof of Lemma 3:. This proof outlines a procedure to trans- form any ( S, G ) into a star graph with lower efficienc y if α < 1 . W e split into two cases - either ( S, G ) induces a single y -partition or more than one. First, assume ( S, G ) induces a single y -partition P y . An illustration of the constructi ve process is shown in Figure 4. Construct a star subgraph Γ y that has 1 + | e ( P y , P y ) | nodes, each having a y imposter attached. Call the center node i y . Construct similar star configurations Γ k x for each x -partition P k x . Call their center nodes i k x . Connect Γ y to each Γ k x with a link between i k x and i y . If there are multiple edges between P k x and P y ( | e ( P k x , ( P k x ) c ) | ≥ 2 ), create | e ( P k x , ( P k x ) c ) | − 1 new isolated nodes with a single x imposter attached, and connect each to i y with a single link. At this point, Γ y and Γ k x are stable y and x -partitions, and the isolated nodes are stable playing x . W e hav e obtained a graph of N 0 ≥ N nodes with identical efficienc y to ( S, G ) since the number and type of edges are preserved. W e can further reduce efficiency if there are acti ve x links, i.e. if | e (Γ k x , Γ k x ) | ≥ 1 for at least one Γ k x . If there are none, then the graph belongs to S N 0 and we are done. Otherwise for each leaf node j ∈ P k x , redirect the edge ( j, i k x ) to ( j, i y ) , and replace j ’ s x imposter with a y imposter . Call m x the total number of such conv erted nodes. The resulting graph-target pair ( S 0 , G 0 ) belongs to S N 0 . W e claim the resulting (larger) y -partition Γ 0 y is stable. For this claim to hold, (45) requires that 2 | e ( P y , P y ) | + 2 m x + 1 ≥ (1 + α )( | e ( P y , N ) | + m x ) . (63) From the original P y , it holds that | e ( P y , P y ) | + |P y | ≥ (1 + α ) | e ( P y , N ) | ⇒ 2 | e ( P y , P y ) | + 2 m x + 1 > (1 + α )( | e ( P y , N ) | + m x ) (64) due to |P y | ≤ 1 + | e ( P y , P y ) | and α < 1 . All x -partitions in ( S 0 , G 0 ) , now just a collection of single nodes connected to i y with an x -imposter , are stable. The ef ficiency is less than the original because active x -links increase efficienc y more than activ e y -links do. Hence, J b ( α, S ; G ) > J b ( α, S 0 ; G 0 ) . (65) Now , we consider the remaining case when ( S, G ) induces k y > 1 y -partitions {P k y } k y k =1 and k x ≥ 1 x -partitions {P k x } k x k =1 . Consider k y such star subgraphs { Γ k y } k y k =1 with cen- ter nodes i k y . Recast the x -partitions into similar star subgraphs { Γ k x } k x k =1 with center nodes i k x . W e first connect each Γ k x to some Γ j y with a single link ( i k x , i j y ) in any manner as long as a link between the original P k x and P j y exists. For each excess outgoing edge, we create an isolated node with an x -imposter attached. Each isolated node is attached to a corresponding i k y such that the original number of outgoing edges for each P k y is satisfied. At this point, there are k 0 ≤ k y connected components G k in the construction, and the efficiency of this construction is identical to the original. Lastly , we apply the y y y y y x x x x x x x ( G, S ) y y y y y y y y x x x x x x x x x x J b ( α, S ; G ) y y y y y y y y y y y y y y x x x x J b ( α, S 0 ; G 0 ) < J b ( α, S ; G ) Fig. 4: An illustration of the constructi ve process (proof of Lemma 3) that generates a member ( S 0 , G 0 ) ∈ S m from any graph ( S, G ) with one y -partition, and α < 1 . Here, the labels on each node indicate the type of imposter influence. Green (blue) nodes play x ( y ) in the SSS. (Left) Start with an arbitrary graph-adversary pair ( S, G ) . (Center) The partitions of ( S, G ) are re-cast as star subgraphs with the same number of edges. When there is more than one edge between the y and an x -partition, ne w nodes are created for the excess outgoing edges. This re-casting preserves the original efficiency J b ( α, S ; G ) . (Right) The activ e x -links are conv erted into y -links by redirecting them to the center of the y -partition. This results in a graph ( S 0 , G 0 ) ∈ S m . efficienc y reduction procedure from before for each G k to obtain ( S 0 k , G 0 k ) ∈ S m k . From (37) and (34), we have J b ( α, S ; G ) > P k 0 k =1 | e (Γ k y , Γ k y ) | (1 + α sys ) P k 0 k =1 | e (Γ k y , N ) | ≥ min k =1 ,...,k 0 J b ( α, S 0 k ; G 0 k ) . (66) Pr oof of Lemma 2: T echnical r esult for expected risks. Let us define f ( p ) := P M i =1 p i s i and f i ( p ) := P k j =1 p j ( ν k − 1) + 1 . The set of probability vectors such that k = arg min i =1 ,...,M f i ( p ) can be written as the set V k := { p ∈ ∆ M : f k ( p ) ≤ f ` ( p ) ∀ ` 6 = k } = \ ` 6 = k ( p ∈ ∆ M : P k j =1 p j P ` j =1 p j ≥ 1 − ν ` 1 − ν k ) . (67) Define λ k = P k j =1 d j P k +1 j =1 d j for each k = 1 , . . . , M − 1 . W ith some algebra, we can express each s i as s i = M − i +1 X j =1 n j d j (1 − λ j − 1 ) M − 1 Y k = j λ k + 1 − M − 1 Y j = M − i +1 λ j (68) Using the identities P M k =1 (1 − λ k − 1 ) Q M − 1 j = k λ j = 1 and P ` k =1 (1 − λ k − 1 ) Q M − 1 j = k λ j = Q M − 1 j = ` λ j for ` = 1 , . . . , M − 1 , we obtain (omitting the algebraic steps) f ( p ) = M X i =1 (1 − λ i − 1 ) M − 1 Y j = i λ j n i d i − 1 M − i +1 X j =1 p j + 1 (69) Now , suppose p ∈ V k for k ∈ { 1 , . . . , M } . Using (67) and ν i ≤ n i /d i ≤ 1 , we then hav e f ( p ) ≥ M X i =1 λ i − 1 M − 1 Y j = i λ j f k ( p ) = f k ( p ) . (70) R E F E R E N C E S [1] J. Cortes, S. Martinez, and F . Bullo, “Robust rendezvous for mobile autonomous agents via proximity graphs in arbitrary dimensions, ” IEEE T ransactions on Automatic Control , vol. 51, no. 8, pp. 1289–1298, Aug 2006. [2] M. Mesbahi and M. Egerstedt, Graph theoretic methods in multiagent networks . Princeton University Press, 2010, vol. 33. [3] I. Akyildiz, W . Su, Y . Sankarasubramaniam, and E. Cayirci, “W ireless sensor networks: a survey , ” Computer Networks , vol. 38, no. 4, pp. 393 – 422, 2002. [4] H. P . Y oung, Individual strate gy and social structure: An evolutionary theory of institutions . Princeton University Press, 2001. [5] A. Montanari and A. Saberi, “The spread of innovations in social networks, ” Proceedings of the National Academy of Sciences , vol. 107, no. 47, pp. 20 196–20 201, 2010. [6] S. A. W est, S. P . Diggle, A. Buckling, A. Gardner, and A. S. Griffin, “The social lives of microbes, ” Annual Review of Ecology , Evolution, and Systematics , vol. 38, no. 1, pp. 53–77, 2007. [7] M. Del V icario, A. Bessi, F . Zollo, F . Petroni, A. Scala, G. Caldarelli, H. E. Stanley , and W . Quattrociocchi, “The spreading of misinformation online, ” Pr oceedings of the National Academy of Sciences , vol. 113, no. 3, pp. 554–559, 2016. [8] Y . Mao, S. Bouloki, and E. Akyol, “Spread of information with confir- mation bias in cyber-social networks, ” IEEE Tr ansactions on Network Science and Engineering , 2018. [9] S. Amin, A. A. C ´ ardenas, and S. S. Sastry , “Safe and secure networked control systems under denial-of-service attacks, ” in Hybrid Systems: Computation and Control , R. Majumdar and P . T abuada, Eds. Berlin, Heidelberg: Springer Berlin Heidelberg, 2009, pp. 31–45. [10] S. Amin, X. Litrico, S. S. Sastry , and A. M. Bayen, “Stealthy deception attacks on water scada systems, ” in Pr oceedings of the 13th ACM international conference on Hybrid systems: computation and control . A CM, 2010, pp. 161–170. [11] H. Fawzi, P . T abuada, and S. Diggavi, “Secure state-estimation for dynamical systems under active adversaries, ” in 2011 49th Annual Aller- ton Conference on Communication, Contr ol, and Computing (Allerton) . IEEE, 2011, pp. 337–344. [12] F . Pasqualetti, F . Dorfler, and F . Bullo, “ Attack detection and identi- fication in cyber-ph ysical systems, ” IEEE T ransactions on Automatic Contr ol , v ol. 58, no. 11, pp. 2715–2729, Nov 2013. [13] S. Sundaram and B. Gharesifard, “Distributed optimization under adver- sarial nodes, ” IEEE T ransactions on Automatic Control , 2018. [14] V . Auletta, D. Ferraioli, F . Pasquale, and G. Persiano, “Metastability of logit dynamics for coordination games, ” in Pr oceedings of the twenty- thir d annual ACM-SIAM symposium on Discrete algorithms . Society for Industrial and Applied Mathematics, 2012, pp. 1006–1024. [15] L. E. Blume, “The statistical mechanics of best-response strategy revi- sion, ” Games and Economic Behavior , vol. 11, no. 2, pp. 111 – 145, 1995. [16] J. R. Marden and J. S. Shamma, “Revisiting log-linear learning: Asyn- chrony , completeness and payoff-based implementation, ” Games and Economic Behavior , vol. 75, no. 2, pp. 788–808, 2012. [17] T . T atarenko, “Proving conv ergence of log-linear learning in potential games, ” in 2014 American Control Conference . IEEE, 2014, pp. 972– 977. [18] D. Acemoglu, A. Ozdaglar, and A. ParandehGheibi, “Spread of (mis) information in social networks, ” Games and Economic Behavior , vol. 70, no. 2, pp. 194–227, 2010. [19] J. Ghaderi and R. Srikant, “Opinion dynamics in social networks with stubborn agents: Equilibrium and con vergence rate, ” Automatica , v ol. 50, no. 12, pp. 3209–3215, 2014. [20] H. P . Borowski and J. R. Marden, “Understanding the influence of adversaries in distributed systems, ” in 2015 54th IEEE Conference on Decision and Contr ol (CDC) , Dec 2015, pp. 2301–2306. [21] P . N. Brown, H. Borowski, and J. R. Marden, “Security against imper- sonation attacks in distributed systems, ” IEEE T ransactions on Control of Network Systems , pp. 1–1, 2018. [22] B. Canty , P . N. Brown, M. Alizadeh, and J. R. Marden, “The impact of informed adversarial behavior in graphical coordination games, ” in 2018 IEEE Conference on Decision and Contr ol (CDC) , Dec 2018, pp. 1923–1928. [23] H. P . Y oung, “The ev olution of conv entions, ” Econometrica: Journal of the Econometric Society , pp. 57–84, 1993. [24] D. Foster and H. P . Y oung, “Stochastic evolutionary game dynamics, ” Theor etical population biology , vol. 38, no. 2, pp. 219–232, 1990. [25] D. Monderer and L. S. Shapley , “Potential games, ” Games and economic behavior , vol. 14, no. 1, pp. 124–143, 1996.
Original Paper
Loading high-quality paper...
Comments & Academic Discussion
Loading comments...
Leave a Comment