Homophily modulates double descent generalization in graph convolution networks
Graph neural networks (GNNs) excel in modeling relational data such as biological, social, and transportation networks, but the underpinnings of their success are not well understood. Traditional complexity measures from statistical learning theory f…
Authors: Cheng Shi, Liming Pan, Hong Hu
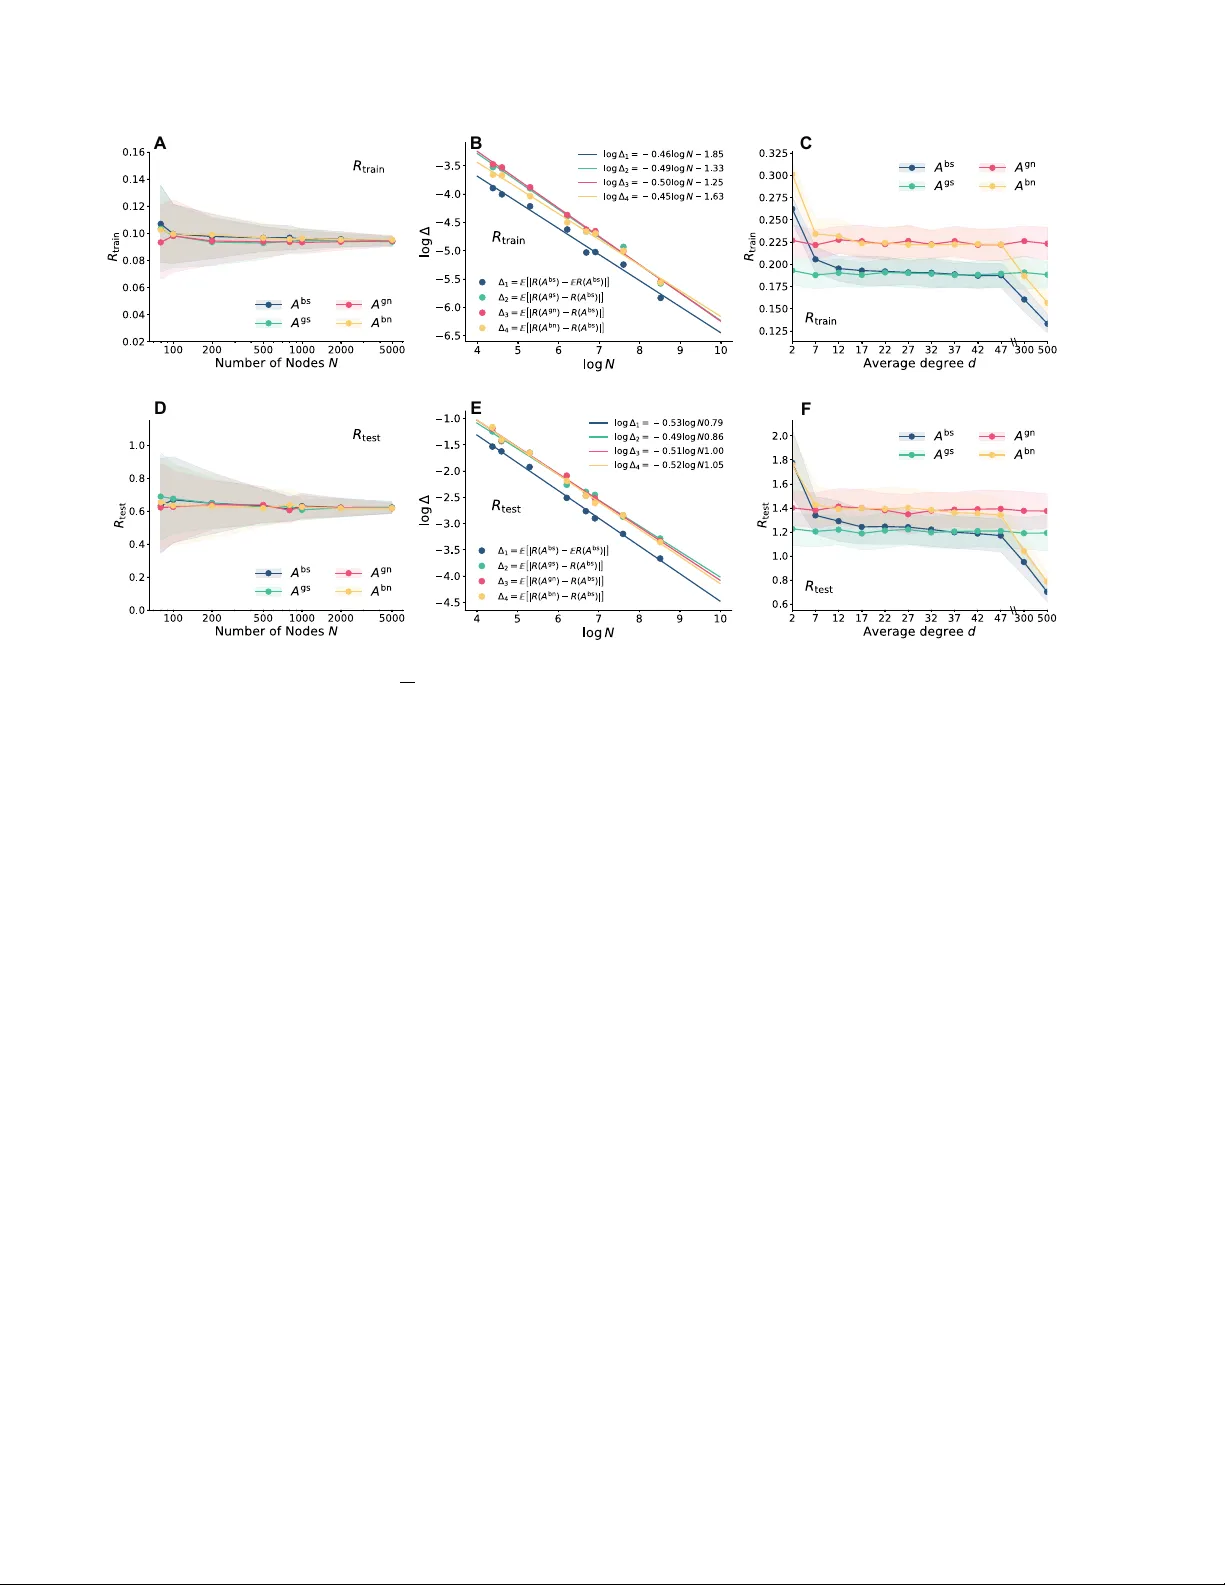
Homophily mo dulates double descent generalization in graph convolution net w o rks Cheng Shi a , Liming P an b,c,1 , Hong Hu d , and Ivan Dokmani ´ c a,e,1 a Depar tement Mathematik und Informatik, Universität Basel; b School of Cyber Science and T echnology , University of Science and T echnology of China; c School of Computer and Electronic Information, Nanjing Normal University; d Whar ton Depar tment of Statistics and Data Science, Univ ersity of P ennsylv ania; e Depar tment of Electrical and Computer Engineering, University of Illinois at Urbana-Champaign This manuscript was compiled on Jan uary 24, 2024 Graph neural networks (GNNs) excel in modeling relational data such as biological, social, and transportation networks, but the underpin- nings of their success are not well under stood. T raditional complexity measures from statistical learning theory fail to account for observed phenomena like the double descent or the impact of relational seman- tics on generalization error . Motivated by experimental observ ations of “transductive” double descent in key netw orks and datasets, we use analytical tools from statistical ph ysics and random matrix theory to precisely characterize generalization in simple graph con volution networks on the contextual stochastic b lock model. Our results illumi- nate the nuances of learning on homophilic versus heter ophilic data and predict double descent whose existence in GNNs has been ques- tioned by recent w ork. W e sho w how risk is shaped by the interpla y between the graph noise, feature noise, and the number of training labels. Our findings apply bey ond stylized models, capturing qualita- tive trends in real-world GNNs and datasets. As a case in point, we use our analytic insights to impr ove performance of state-of-the-art graph con v olution networks on heter ophilic datasets. Graph neural netw ork | transductive learning | double descent | ho- mophily | sto chastic blo ck model Graph neural net works (GNNs) recently ac hiev ed impres- siv e results on problems as diverse as w eather forecasting ( 1 ), predicting forces in gran ular materials ( 2 ), or understanding biological molecules ( 3 – 5 ). They hav e b ecome the de facto ma- c hine learning mo del for datasets with relational information suc h as in teractions in protein graphs or friendships in a social net wo rk ( 6 – 9 ). These remarkable successes triggered a wa ve of research on better, more expressive GNN arc hitectures for div erse tasks, y et there is little theoretical w ork that studies wh y and how these net w orks ac hiev e strong performance. In this pap er we study generalization in graph neural net- w orks for transductiv e (semi-supervised) no de classification: giv en a graph G = ( V , E ) , no de features x : V → R F , and lab els y : V train → {− 1 , 1 } for a “training” subset of nodes V train ⊂ V , we wan t to learn a rule which assigns lab els to no des in V test = V \ V train . This setting exhibits a richer gen- eralization phenomenology than the usual supervised learning: in addition to the quality and dimensionality of features as- so ciated with data, the generalization error is affected by the qualit y of relational information (are there missing or spurious edges?), the prop ortion of observed lab els | V train | / | V | , and the sp ecifics of interaction b etw een the graph and the features. A dditional complexity arises because links in differen t graphs enco de qualitativ ely distinct seman tics. Interactions betw een proteins are heterophilic; friendships in so cial netw orks are homophilic ( 10 ). They result in graphs with different struc- tural statistics, which in turn modulate interactions betw een the graphs and the features ( 11 , 12 ). Whether and how these factors influence learning and generalization is curren tly not understo o d. Outstanding questions include the role of ov erpa- rameterization and the differences in performance on graphs with different levels of homophily or heterophily . Despite m uch w ork sho wing that in ov erparameterized models the traditional bias–v ariance tradeoff is replaced by the so-called double descent, there hav e b een no rep orts nor analyses of double descen t in transductiv e graph learning. Recen t w ork sp eculates that this is due to implicit regularization ( 13 ). T o w ard addressing this gap, we derive a precise characteri- zation of generalization in simple graph conv olution netw orks (GCNs) in semi-supervised ∗ no de classification on random com- m unit y graphs. W e motiv ate this setting by first presen ting a sequence of exp erimental observ ations that p oint to univ ersal b eha viors in a v ariet y of GNNs on a v ariet y of domains. In particular, w e argue that in the transductive setting a natural w ay to “diagnose” double descent is by v arying the num ber of lab els av ailable for training (Section 1 ). W e then design exp erimen ts that sho w that double descen t is in fact ubiquitous in GNNs: there is often a coun terin tuitiv e regime where more training data hurts generalization ( 14 ). Understanding this regime has imp ortant implications for the (often costly) lab el collection and questions of observ ability of complex systems ( 15 ). While earlier work reports similar b eha vior in standard sup ervised learning, our transductive v er- sion demonstrates it directly ( 14 , 16 ). On the other hand, we ∗ More precisely , transductive. Significance Statement Graph neural networks (GNNs) hav e been applied with great success across science and engineer ing but we do not un- derstand wh y they work so well. Motivated by e xperimental e vidence of a rich phase diagram of gener alization behaviors , we analyzed simple GNNs on a comm unity graph model and derived precise e xpressions f or generalization error as a func- tion of noise in the graph, noise in the features, propor tion of labeled data, and the nature of interactions in the graph. Computer experiments show that the analysis also qualitativ ely explains large “production-scale” networks and can thus be used to improv e perf or mance and guide hyperparameter tun- ing. This is significant both for the do wnstream science and for the theor y of deep learning on graphs. Author contributions: C.S., L.P ., H.H. and I.D . designed research, provided mathematical analysis and wrote the paper; C.S. conducted e xperiments; The authors declare no competing interest. 1 T o whom correspondence should be addressed. E-mail: panlm99@gmail.com, ivan.dokmanic@unibas.ch | January 24, 2024 | vol. XXX | no . XX | 1– 23 indeed find that for many com binations of relational datasets and GNNs, double descent is mitigated by implicit or explicit regularization. In terestingly , the risk curv es are affected not only b y the properties of the mo dels and data ( 14 ), but also b y the level of homophily or heterophily in the graphs. Motiv ated by these findings w e then presen t our main theoretical result: a precise analysis of generalization on the con textual stochastic block model (CSBM) with a simple GCN. W e combine tools from statistical physics and random matrix theory and deriv e generalization curv es either in closed form or as solutions to tractable lo w-dimensional optimization problems. T o carry out our theoretical analysis, we form ulate a universalit y conjecture which states that in the limit of large graphs, the risks in GCNs with polynomial filters do not c hange if we replace random binary adjacency matrices with random Gaussian matrices. W e empirically verify the v alidity of this conjecture in a v ariet y of settings; w e think it may serv e as a starting p oint for future analyses of deep GNNs. These theoretical results allow us to effectively explore a range of questions: for example, in Section 3 we show that double descen t also app ears when we fix the (relative) num ber of observed labels, and v ary relativ e model complexit y (Fig. 4 ). This setting is close but not identical to the usual sup ervised double descen t ( 17 ). W e also explain wh y self-loops improv e p erformance of GNNs on homophilic ( 18 ) but not heterophilic ( 11 , 12 ) graphs, as empirically established in a num ber of pap ers, but also that negative self-lo ops b enefit learning on heterophilic graphs ( 19 , 20 ). W e then go back to experiment and show that building negative self-lo op filters into state- of-the-art GCNs can further improv e their p erformance on heterophilic graphs. This can b e seen as a theoretical GCN coun terpart of recent observ ations in the message passing literature ( 19 , 20 ) and an explicit connection with heterophily for architectures suc h as GraphSA GE which can implemen t analogous logic ( 9 ). Existing studies of generalization in graph neural net- w orks rely on complexit y measures like the VC-dimension or Rademacher complexit y but they result in v acuous bounds whic h do not explain the observed new phenomena ( 21 – 23 ). F urther, they only indirectly address the interaction betw een the graph and the features. This interaction, how ev er, is of k ey importance: an Erdős–Ren yi graph is not lik ely to be of m uc h use in learning with a graph neural netw ork. In realit y b oth the graph and the features contain information ab out the lab els; learning should exploit the complementarit y of these t w o views. Instead of applying the “big hammers” of statistical learning theory , w e adopt a statistic al me chanics approach and study p erformance of simple graph con v olution netw orks on the con textual sto chastic blo ck model (CSBM) ( 24 ). W e derive precise expressions for the learning curves which exhibit a rich phenomenology . The tw o w a ys to think ab out generalization, statistical learning theory and statistical mec hanics, hav e b een contrasted already in the late 1980s and the early 1990s. Statistical mec hanics of learning, dev eloped at that time b y Gardner, Opp er, Sejno wski, Sompolinsky , Tishb y , V allet, W atkin, and man y others—an excellen t accoun t is given in the review pap er b y W atkin, Rau, and Biehl ( 25 )—m ust make more assumptions ab out the data and the space of admissible functions, but it giv es results that are more precise and more readily applied to the practice of machine learning. These dichotomies ha v e been revisited recently in the con- text of deep learning and highly-ov erparameterized mo dels by Martin and Mahoney ( 26 ), in reaction to Zhang et al. ’s thought pro voking “Understanding deep learning requires rethinking generalization” ( 27 ) whic h shows, among other things, that mo dern deep neural net w orks easily fit completely random lab els. Martin and Mahoney explain that such seemingly sur- prising new behaviors can be effectiv ely understoo d within the statistical mechanics paradigm b y identifying the right order parameters and related phase diagrams. W e explore these connections further in Section 4 —Discussion. Outline. W e begin b y describing the motiv ational exp erimental findings in Section 1 . W e identify the k ey trends to explain, suc h as the dep endence of double descent generalization on the lev el of noise in features and graphs. In Section 2 we in tro duce our analytical mo del: a simple GCN on the con- textual sto chastic blo ck model. Section 3 then explores the implications of some of the analytical findings about self-loops and heterophily on the design of state-of-the-art GCNs. W e follo w this by a discussion of our results in the con text of related w ork in Section 4 . In Section 5 we explain the analo- gies betw een GCNs and spin glasses whic h allo w us to apply analysis metho ds from statistical physics and random matrix theory . W e follow with a few concluding comments in Section 6 . 1. Motiv ation: empirical results Giv en an N -v ertex graph G = ( V , E ) with an adjacency matrix A ∈ { 0 , 1 } N × N and features X ∈ R N × F , a no de classification GNN is a function ( A , X ) 7→ h ( w ; A , X ) insensitiv e to v ertex ordering: for an y no de p ermutation π , h ( w ; π A π ⊺ , π X ) = π h ( w ; A , X ) . W e are in terested in the behavior of train and test risk, R N ( S ) = 1 | S | X i ∈ S ℓ ( y i , h i ( w ∗ ; A , X )) , [1] with S ∈ { V train , V test } and ℓ ( · , · ) a loss metric such as the mean-squared error (MSE) or the cross-entrop y . The opti- mal net w ork parameters w ∗ are obtained b y minimizing the regularized loss L N ( w ) = 1 | V train | X i ∈ V train ℓ ( y i , h i ( w ; A , X )) + r N ( w ) , [2] where r N ( w ) is a regularizer. Is double descent absent in GNNs? W e start by in v estigating the lack of reports of double desc ent in transductive learning on graphs. Double descent is a scaling of test risk with mo del complexit y whic h is rather differen t from the textbo ok bias– v ariance tradeoff ( 16 , 28 ). Up to the interpolation point, where the mo del has sufficient capacit y to fit the training data without error, things b ehav e as usual, with the test risk first decreasing together with the bias and then increasing with the v ariance due to o v erfitting. But increasing complexit y b ey ond the in terp olation point—in to an ov erparameterized region c haracteristic for modern deep learning—may make the test risk decrease again. 2 | Shi et al. Fig. 1. Double descent generalization f or diff erent GNNs, diff erent losses , with and without explicit regularization, on datasets with v arying levels of noise. We plot both the test error ( red ) and the test accuracy ( black ) against diff erent training label ratios τ on the abscissa on a logarithmic scale . First column : one linear lay er trained by MSE loss; second column : a two-layer GCN with ReLU activ ations and MSE loss; third column : a two-layer GCN with ReLU activation function, dropout and MSE loss; fourth column : a two-la yer GCN with ReLU activations, dropout and cross-entropy loss; Each e xperimental data point is av eraged ov er 10 random tr ain– test splits; the shado w area represents the standard deviation. The r ight ordinate axis shows classification accuracy; we suppress the left-axis ticks due to different numerical ranges. We observe that double descent is ubiquitous across datasets and architectures when varying the ratio of training labels: there often exists a regime where more labels impair generalization. This generalization b ehavior has b een identified already in the 90s by applying analytical to ols from statistical mechanics to problems of machine learning; see for example Figure 10 in the pap er by W atkin, Rau, and Biehl ( 25 ) or Figure 1 in Opp er et al. ( 29 ) which sho w the generalization ability of the so-called pseudoinv erse algorithm to train a bo olean linear classifier (see also the b o ok ( 30 )). It is implicit in work on phase diagrams of generalization akin to those for magnetism or the Sherrington–Kirkpatrick model ( 31 , 32 ). While these works are indeed the first to observe double descen t, its significance for mo dern machine learning has b een recognized by a line of research starting with ( 33 ). Double descen t has been observed in complex deep neural netw orks ( 14 ) and theoretically analyzed for a num b er of machine learn- ing models ( 17 , 25 , 30 , 34 , 35 ). There are, ho w ev er, scarcely an y reports of double descent in graph neural netw orks. Oono and Suzuki ( 13 ) sp eculate that this may b e due to implicit regularization in relation to the so-called ov ersmoothing ( 36 ). Generalization in supervised vs transductive learning. When illustrating double descen t the test error is usually plotted against model complexity . F or this to mak e sense, the amoun t of training data m ust b e fixed, so the complexit y on the abscissa is really r elative c omplexity ; denoting the size of the dataset (node of no des) by N and the num ber of parameters by F w e let this relative complexity be α := F / N . An alternative is to plot the risk against γ = α − 1 : Starting from a small amoun t of data (small γ ), w e first go through a regime in whic h increasing the amoun t of training data leads to worse p erformance. In our con text this can be in terpreted as v arying the size of the graph while k eeping the num ber of features fixed. In transductiv e node classification we alwa ys observ e the en tire graph A and the features asso ciated with all vertices X , but only a subset of M lab els. It is then more natural to v ary τ := M / N than α − 1 , with M b eing the num ber of observ ed lab els. Although the resulting curv es are slightly differen t, they b oth exhibit double descen t; in the terminology of Martin and Mahoney , b oth τ and α − 1 ma y b e called load- lik e parameters ( 26 ); see also ( 37 ). † In particular, they both ha v e the interpolation p eak at τ = α − 1 , or M = F , when the system matrix becomes square and p o orly conditioned. The k ey aspect of double descent is that the generalization error decreases on b oth sides of the interpolation p eak. Using τ instead of α − 1 is con v enien t for sev eral reasons: in real datasets, the num ber of input features is fixed; w e cannot v ary it. F urther, there is no unique w a y to increase the num ber of parameters in a GNN and different GNNs are parameterized differen tly whic h complicates comparisons. V arying depth may lead to confounding effencts suc h as o v ersmoothing which is implicit regularization. V arying τ is a straightforw ard and clean w a y to compare different arc hitectures in analogous settings. W e can, ho w ev er, easily v ary α = γ − 1 in our analytic mo del described in Section 2 ; we show the related results in Fig. 4 . Experimental observation of double descent in GNNs. Armed with this understanding, w e design an experiment as follo ws: w e study the homophilic citation graph Cora ( 38 ) and the heterophilic graphs of Wikip eda pages Chameleon ( 39 ) and univ ersity web pages Texas ( 11 ). W e apply different graph con v olution net w orks with differen t losses, with and without drop out regularization. Results are sho wn in Fig. 1 . Imp ortantly , we plot both the test error (red) and the test accuracy (black) in node classification against a range of training label ratios τ . In the first column, w e use a one-la y er GCN similar to the one w e analyze theoretically in Section 2 , but with added degree normalization, self-loops, and multiple classes; in the second column, we use a t w o-la y er GCN; in the third column we add drop out; in the fourth, w e use the cross-entrop y loss instead of the MSE. This last mo del is used in the pytorch-geometric no de classification tutorial ‡ . First, with a one-lay er net w ork one can clearly observe transductiv e double descen t on Cora in b oth the test risk and accuracy . The situation is mark edly different on the heterophilic Texas , which contains only 183 no des but 1703 features p er no de which yields relative model complexity α = F / N m uch higher than for other datasets. Here the test accuracy decreases near-monotonically , consisten tly with our theoretical analysis in Section 2 (cf. Fig. 5 D ). In this setting strong regularization improv es p erformance. With a tw o-la y er net w ork the double descent still “survives” in the test error on Cora , but the accuracy is almost monoton- † It may be interesting to note that papers by th physicists from the 90s put the amount of data on the abscissa ( 25 , 29 ). ‡ https://pytorch-geometric.readthedocs.io/en/latest/notes/colabs .html Shi et al. | January 24, 2024 | vol. XXX | no . XX | 3 FSGNN 2 layers GCN 1 layer GCN (CE) 1 layer GCN (MSE) A B C D 0% 20% 40% 60% 80% 100% Fig. 2. T est error with different training label ratios for diff erent GCNs on chameleon (heterophilic) datasets. A : FSGNN ( 40 ); B : two- la yer GCN with ReLU activations and cross-entropy loss; C : one layer GCN with cross entropy loss; (D): one layer GCN with MSE loss. We interpolate between the original dataset shown in blue ( 0% noise), and an Erd ˝ os–Rényi random graph shown in red ( 100% noise) by adding noise in increments of 20% . Noise is introduced by first randomly removing a given proportion of edges and then adding the same number of new r andom edges. The node f eatures are kept the same. Each data point is averaged ten times, and the abscissa is on a logarithmic scale. We see that g raph noise accentuates doub le descent, which is consistent with our theoretical results (see Fig. 3 B ). Similarly , better GNNs attenuate the effect where additional labels hurt generalization. ically increasing except on Texas . These results corroborate the intuition that drop out and non-linearity alleviate GNN o v erfitting on no de classification, esp ecially for large training lab el ratios. W e then explore the role of noise in the graph and in the features b y man ually adding noise to Cora . W e randomly remo v e 30% of the links and add the same num b er of random links, and randomize 30% of the entries in X ; results are sho wn in the fourth row of Fig. 1 . The double descent in test error app ears even with substantial regularization. Comparing the first and the fourth ro w affi rms that double descen t is more prominen t with noisy data; this is again consisten t with our analysis (see Section 3 ). In the last ro w w e apply the netw orks to the synthetic CSBM. Observing the same qualitative b e- ha vior also in this case lends credence to the choice of CSBM for our precise analysis in Section 2 . In Fig. 2 w e further focus on the strongly heterophilic Chameleon whic h does not clearly sho w double descen t in Fig. 1 . W e randomly p erturb different percentages of edges and in addition to GCNs also use the considerably more p ow- erful FSGNN ( 40 ), whic h achiev es current state-of-the-art results on Chameleon . Again, we see that double descent (a non-monotonic risk curv e) emerges at higher noise (w eak er het- erophily). It is noteworth y that more expressive arc hitectures do seem to mitigate double descent; conv ersely , a one-lay er GCN exhibits double descent ev en without additional noise. W e analytically characterize this phenomenon in Section 2 and illustrate it in Fig. 3 . Beyond GCNs, we show that double descen t o ccurs in more sophisticated GNNs like graph atten- tion netw orks ( 41 ), GraphSA GE ( 9 ) and Cheb yshev graph net w orks ( 7 ); see the SI App endix E for details. In summary , transductiv e double descent o ccurs in a v ariety of graph neural net w orks applied to real-world data, with noise and implicit or explicit regularization b eing the key determi- nan ts of the shap e of generalization curv es. Understanding the b eha vior of generalization error as a function of the num ber of training labels is of great practical v alue giv en the diffi- cult y of obtaining lab els in many domains. F or some datasets lik e Texas , using to o many labels seems detrimental for some arc hitectures. 2. A precise analysis of node classification on CSBM with a simple graph con v olution netw ork Motiv ated b y the abov e discussions, w e turn to a theoreti- cal study of the performance of GCNs on random comm u- nit y graphs where we can understand the influence of all the in volv ed parameters. W e hav e seen in Section 1 that the generalization behavior in this setting qualitativ ely matc hes generalization on real data. Graph conv olution netw orks are comp osed of graph con- v olution filters and nonlinear activ ations. Remo ving the acti- v ations results in a so-called simple GCN ( 42 ) or a sp ectral GNN ( 43 , 44 ). F or a graph G = ( V , E ) with adjacency matrix A and features that live on the nodes X , h ( w ; A , X ) = P ( A ) X w where P ( A ) = K X k =0 c k A k , [3] where w ∈ R F are trainable parameters and K is the filter supp ort size in terms of hops on the graph. W e treat the neigh b orho od weigh ts c k at differen t hops as h yperparameters. W e let A 0 def = I N so that the mo del Eq. ( 3 ) reduces to ordinary linear regression when K = 0 . In standard feed-forward netw orks, removing the activ ations results in a linear end-to-end mapping. Surprisingly , GCNs without activ ations (such as SGC ( 42 )) or with activ ations only in the output (such as FSGNN ( 40 ) and GPRGNN ( 12 )) ac hiev e state-of-the-art p erformance in many settings. § W e will derive test risk expressions for the abov e graph con volution netw ork in t w o shallow cases: P ( A ) = A and P ( A ) = A + c I . W e will also state a univ ersalit y conjecture for general p olynomial filters. Starting with this conjecture, w e can in principle extend the results to all p olynomial filters using routine but tedious computation. W e pro vide an example for the training error of a tw o-hop net w ork in SI App endix C . As w e will sho w, this analytic behavior closely resem bles the motiv ational empirical findings from Section 1 . T raining and generalization. W e are interested in the large graph limit N → ∞ where the training lab el ratio | V train | / N → τ . W e fit the model parameters w b y ridge regression w ∗ := arg min w L A , X ( w ) , where L A , X ( w ) = 1 | V train | X i ∈ V train ( y i − ( h i ( w ; A , X ))) 2 + r N ∥ w ∥ 2 2 . [4] W e are in terested in the training and test risk in the limit of large graphs, R train = lim N →∞ E R N ( V train ) , R test = lim N →∞ E R N ( V test ) , [5] § GCNs without activations are sometimes called “linear” in analogy with feed-f orward netw orks, but that terminology is misleading. In graph learning, both A and X are bona fide parts of the input and a function which depends on their multiplication is a nonlinear function. What is more, in many applications A is constructed deterministically from a dataset X , for e xample as a neighborhood graph, resulting in e ven stronger nonlinearity . 4 | Shi et al. as well as in the expected accuracy , A CC = lim N →∞ E " 1 | V test | X i ∈ V test 1 { y i = sign( h i ( w ∗ )) } # . [6] W e will sometimes write R train ( A ) , R test ( A ) , A CC ( A ) to em- phasize that the matrix A in Eq. ( 3 ) follows a distribution A , A ∼ A . The exp ectations are o v er the random graph adjacency matrix A , random features X , and the uniformly random test–train partition V = V train ∪ V test . Our analysis in fact shows that the quantities all concen trate around the mean for large N (and M and F ): In the language of statistical ph ysics, they are self-aver aging . This pr op ortional aysmptotics regime where F , M , and N all grow large at constan t ratios is more c hallenging to analyze than the regimes where dataset size or model complexit y is constant, but it results in phenom- ena we see with production-scale machine learning mo dels on real data; see also ( 26 , 34 ). Contextual stochastic block model. W e apply the GCN to the contextual sto chastic block model (CSBM). CSBM adds no de features to the stochastic blo ck model (SBM)—a random comm unit y graph mo del ( 24 ) where the probabilit y of a link b et w een nodes depends on their comm unities. The low er triangular part of the adjacency matrix A bs has distribution P A bs ij = 1 = c in / N if i ≤ j and y i = y j c out / N if i ≤ j and y i = y j . [7] A conv enient parameterization is c in = d + √ dλ, c out = d − √ dλ, where d is the av erage node degree and the sign of λ determines whether the graph is homophilic or heterophilic; | λ | can b e regarded as the graph signal noise ratio (SNR). W e will also study a directed SBM ( 45 , 46 ) with adjacency matrix distributed as P A bn ij = 1 = c in / N if y i = y j c out / N if y i = y j . [8] Man y real graphs hav e directed links, including chemical con- nections b etw een neurons, the electric grid, folow ee–folo w er relation in so cial media, and Bay esian graphs. In our case the directed SBM facilitates analysis with self-lo ops while exhibit- ing the same qualitative behavior and phenomenology as the undirected one. The features of CSBM follow the spik ed co v ariance mo del, x i = q µ N y i u + ξ i , [9] where u ∼ N (0 , I F /F ) is the F -dimensional hidden feature and ξ i ∼ N (0 , I F /F ) are i.i.d. Gaussian noise; the parameter µ is the feature SNR. W e w ork in the prop ortional scaling regime where N F → γ , with γ b eing the inv erse relativ e mo del complexit y , and ascrib e feature vec tors to the ro ws of the data matrix X , X = [ x 1 , · · · , x N ] ⊺ = q µ N y u ⊺ + Ξ x . [10] W e assume throughout that the t w o comm unities are balanced; without loss of generality w e let y i = 1 for i = 1 , 2 , . . . , N / 2 and y i = − 1 for i > N/ 2 . W e will sho w that CSBM is a comparatively tractable statis- tical mo del to c haracterize generalization in GNNs. In tuitiv ely , when N → ∞ , the risk should concen trate around a n um ber that dep ends on five parameters: λ Degree of homophily (Graph SNR) µ F eature SNR, α Relativ e mo del complexity (= γ − 1 ) τ Lab el ratio r Ridge regularization parameter. W e emphasize that w e study the c hallenging w eak-signal regime where λ , µ and γ do not scale with N (but F do es). This stands in contrast to recent machine learning work on CSBM ( 47 , 48 ) which studies the low-noise regime where µ or λ 2 scale with N , or even the noiseless regime where the classes b ecome linearly separable after applying a graph filter or a GCN. W e argue that the w eak-signal regime is closer to real graph learning problems which are neither to o easy (as in linearly separable) nor to o hard (as with a v anishing signal). The fact that we discov er phenomena which o ccur in state-of-the-art netw orks and real datasets supp orts this claim. W e outline our analysis in Section 5 and provide the de- tails in the SI appendices. But first, in the follo wing section, w e show that the derived expressions precisely characterize generalization of shallo w GCNs on CSBM and also give a correct qualitative description of the behavior of “big” graph neural netw orks on complex datasets, p ointing to in teresting phenomena and interpretations. 3. Phenomenology of generalization in GCNs W e focus on the behavior of the test risk under v arious lev els of graph homophily , emphasizing t w o main aspects: i) different lev els of homophily lead to different t ypes of double descent; ii) self-lo ops, standard in GCNs, create an im balance b etw een het- erophilic and homophilic datasets; negative self-loops improv e the handling of heterophilic datasets. Double descent in shallow GCNs on CSBM. As we show in Section 5 and SI App endix Section A , the expression for the test risk for unregularized regression ( r = 0 ) with shallo w GCN can b e obtained in closed form as R test = γ τ ( γ + µ ) ( γ τ − 1) ( γ + λ 2 ( µ + 1) + µ ) when γ τ > 1 . It is eviden t that the denominator v anishes as γ τ approac hes 1. When this happ ens, the system matrix I train P ( A ) X , where I train selects the rows for which w e ha v e lab els; see Section 5 , Eq. ( 12 ), is square and near-singular for large N , whic h leads to the explosion of R test (Fig. 3 A ). When relativ e mo del complexity is high, i.e., γ = N/F < 1 is low, τ γ is alwa ys less than 1 . In such cases, no in terp olation p eak app ears, which is consisten t with our exp erimental results for the Texas dataset where γ = 0 . 11 ; cf. Fig. 5 D . A t the other extreme, for strongly regularized training (large r ) the double descent disappears (Fig. 3 C ); it has b een sho wn that this happ ens at optimal regularization ( 35 , 49 ). The absolute risk v alues in Fig. 3 B and 3 C sho w the same b eha vior. Shi et al. | January 24, 2024 | vol. XXX | no . XX | 5 A B C Fig. 3. Theoretical results computed by the replica method (solid line) versus e xperimental results (solid circles) on CSBM, with P ( A ) = A , for v arying training label ratios τ . A : training and test risks with λ = µ = 1 , γ = 5 and r = 0 . (F or τ < 0 . 2 , we use the pseudoinverse in Eq. ( 11 ) in numerics and r = 10 − 5 for the theoretical curves). We fur ther study the impact of varying λ in B and r in C . We set r = 0 . 02 , γ = 2 , µ = 1 in B and λ = 3 , µ = 1 , γ = 2 in C . In all experiments we set N = 5000 and d = 30 . We work with the symmetric binar y adjacency matrix ensemble A bs . Each experimental data point is av eraged ov er 10 independent trials; their standard deviation is shown b y vertical bars. The theoretical cur ves agree perf ectly with e xperiments but also qualitatively with the phenomena w e observed on real data in Section 1 . Fig. 3 B shows that when the graph is very noisy ( λ is small) the test error starts to increase as soon as the training label ratio τ increases from 0 . When λ is large, meaning that the graph is discriminative, the test error first decreases and then increases. Similar b ehavior can b e observed when v arying the feature SNR µ instead of λ . Double descent also app ears in test accuracy (Fig. 5 ). While these curves all illustrate double descen t in the sense that they all hav e the in terpolation peak on b oth sides of whic h the error decreases, they are qualitativ ely differen t. The emergence of these different shapes can b e explained by looking at the distribution of the predicted i th lab el h i ( w ∗ ) . As w e sho w in SI App endix A , h i ( w ∗ ) is normally distributed with mean and v ariance given by the solutions of a saddle p oint equation outlined in Section 5 . The test accuracy can thus be expressed by the error function (cf. Eq. ( 17 )). As we increase the num ber of lab els, the mean E [ h i ( w ∗ )] ap- proac hes y i monotonically . Ho w ev er, the v ariance V ar [ h i ( w ∗ )] b eha v es diferently for differen t mo del complexities α = 1 γ and regularizations r , resulting in distinct double descent curv es. F or example, when r → 0 and τ → 1 γ , the v ariance of h i ( w ∗ ) for i ∈ V test div erges and the accuracy approac hes 50% , a random guess. On the other hand, when r is large, the v ariance is small and double descent is mild or absent, as sho wn in Fig. 5 A . Figure 5 B shows a typical double descent curve with t w o regimes where additional lab els h urt generalization. In Fig. 5 C we also see a mild double descent when the relative mo del complexit y is close to 1 : this is consisten t with exper- imen tal observ ations on Cora in Fig. 1 . In certain extremal cases, for example when γ is very small, the test accuracy con tin uously decreases after a very small ascen t around τ = 0 (Fig. 5 D ); this is consisten t with our exp erimental observ ations for the Texas dataset. Double descent as a function of the relative model complexity . As men tioned earlier, the theoretical model makes it easy to study double descent as w e v ary the mo del complexit y α = 1 /γ rather than τ ; this is closer to the traditional reports of double descen t in sup ervised learning. The resulting plots follow a similar logic: as shown in Fig. 4 , adding randomness in the graph (low | λ | ), makes the double descent more prominent. Con versely , for a highly homophilic graph (large λ ), the test risk decreases monotonically as the relative model complexity α grows. 0 1 α = 1 /γ 1 2 R test λ = 0 0 1 α = 1 /γ 1 . 0 1 . 2 1 . 4 λ = 1 0 1 α = 1 /γ 0 . 6 0 . 8 λ = 2 0 1 α = 1 /γ 0 . 1 0 . 2 0 . 3 λ = 10 Fig. 4. T est risk as a function of relative model complexity α = γ − 1 : different lev els of homophily lead to distinct types of double descent in CSBM. Plots from left to r ight (with increasing λ ) show curves f or gr aphs of decreasing randomness . V arying model complexity in GNNs yields non-monotonic curves similar to those in the earlier studies of double descent studies in super vised (inductive) lear ning. Note that the over all shape of the curve is strongly modulated by the degree of homophily in the gr aph. Heterophil y , homophily , and positive and negative self-lo ops. GCNs often perform w orse on heterophilic than on homophilic graphs. An activ e line of researc h tries to understand and mit- igate this phenomenon with sp ecial architectures and training strategies ( 12 , 50 , 51 ). W e now sho w that it can b e understo od through the lens of self-lo ops. Strong GCNs ubiquitously employ self-lo ops of the form P ( A ) = A + I N on homophilic graphs ( 8 , 12 , 41 , 42 , 52 ). ¶ Self-lo ops, ho w ev er, deteriorate performance on heterophilic net w orks. CSBM is well suited to study this phenomenon since λ allo ws us to transition b etw een homophilic and heterophilic graphs. W e allo w the self-loop strength c to v ary contin uously so that the effective adjacency matrix b ecomes A + c I N . Im- p ortan tly , we also allow c to b e negative (see SI App endix B ). In Fig. 6 w e plot the test risk as a function of c for both p ositiv e and negativ e c . W e find that a negativ e self-loop ( c < 0 ) results in muc h b etter p erformance on heterophilic data ( λ < 0 ). W e sk etc h a signal-pro cessing in terpretation of this phenomenon in SI App endix D . Negative self-loops in state-of-the-art GCNs. It is remarkable that this finding generalizes to complex state-of-the-art graph neural netw orks and datasets. W e exp eriment with t w o com- mon heterophilic b enchmarks, Chameleon and Squirrel , first ¶ One wa y to characterize link semantics in g raphs is by notions of homophily and heterophily . In a friendship graph links signify similarity: if Alice and Bob both know Jane it is reasonab le to e xpect that Alice and Bob also know each other . In a protein interaction graph, if proteins A and B interact, a small mutation A ’ of A will likely still inter act with B but not with A . Thus “interaction” links signify partition. Most graphs are somewhere in between the homophilic and heterophilic e xtremes. 6 | Shi et al. A B C D Fig. 5. Four typical generalization curves in CSBM model. The solid lines represent theoretical results of test risk (black) and accuracy ( red ) computed via Eq. ( 17 ) . We also plot the mean and variance of test output h i ( w ∗ ) where i ∈ V test . This illustrates how the tradeoff of Mean-V ariance leads to different doub le descent curves. Note we only display results for nodes with label y i = 1 ; the result for the y i = − 1 class simply has opposite mean and identical variance. A : monotonic ACC (increasing) and R test (decreasing) when regularization r is large; B : A typical double descent with small regularization r ; C slight double descent with relative model complexity α close to 1 ; D (near-monotonically) decreasing ACC and increasing R test with large relative model complexity α = 1 /γ . The parameters are chosen as A : µ = 1 , λ = 2 , γ = 5 , r = 2 ; B : µ = 1 , λ = 2 , γ = 5 , r = 0 . 1 ; C : µ = 1 , λ = 2 , γ = 1 . 2 , r = 0 . 05 ; D : µ = 5 , λ = 1 , γ = 0 . 1 , r = 0 . 005 . The solid circles and vertical bars represent the mean and standard deviation of risk and accuracy from experiment results. Each experimental data point is averaged over 10 independent trials; the standard deviation is indicated by ver tical bars. W e use N = 5000 and d = 30 for A , B and C , and N = 500 and d = 20 for D . In all case we use the symmetric binary adjacency matr ix ensemble A bs . with a tw o-la yer ReLU GCN. The default GCN (for example in pytorch-geometric ) contains self-loops of the form A + I ; w e immediately observ e in Fig. 7 that remo ving them improv es p erformance on b oth datasets. W e then make the in tensit y of the self-lo op adjustable as a hyper-parameter and find that a negativ e self-loop with c b et w een − 1 . 0 and − 0 . 5 results in the highest accuracy on b oth datasets. It is notable that the b est p erformance in the tw o-la y er ReLU GCN with c = − 0 . 5 (76.29%) is already close to state-of-the-art results by the F ea- ture Selection Graph Neural Netw ork (FSGNN) ( 40 ) (78.27%). FSGNN uses a graph filter bank B = { A k , ( A + I ) k } with careful normalization. T aking a cue from the abov e findings, w e show that a simple addition of negativ e self-lo op filters ( A − 0 . 5 I ) k to FSGNN yields the new state of the art (78.96%); see also T able 1 . GCN ( c = 0 ) GCN ( c ∗ ) FSGNN FSGNN ( c ∗ ) Chameleon 75.81±1.69 76.29±1.22 78.27±1.28 78.96±1.05 Squirrel 67.19±1.48 68.62±2.13 74.10±1.89 74.34±1.21 T able 1. Comparison of test accuracy when negative self-loop is absent (first and third column) or present (second and f ourth column). The datasets and splits are the same as Fig. 7 . 4. Discussion Before delving into the details of the analytical metho ds in Section 5 and conceptual connections betw een GNNs and spin glasses, w e discuss the v arious interpretations of our results in the context of related w ork. Related w ork on theory of GNNs. Most theoretical work on GNNs addresses their expressivity ( 53 , 54 ). A key result is that the common message-passing formulation is limited b y the pow er of the W eisfeiler–Lehman graph isomorphism test ( 55 ). This is of great relev ance for computational chemistry where one must discriminate betw een the differen t molecular structures ( 56 ), but it do es not explain how the interaction b et w een the graph structure and the node features leads to gen- eralization. Indeed, simple architectures lik e graph con v olution net w orks (GCNs) are far from b eing universal appro ximators but they often ac hiev e excellen t p erformance on real problems with real data. Existing studies of generalization in GNNs leverage com- plexit y measures such as the V apnik–Cherv onenkis dimension ( 57 – 59 ) or the Rademacher complexity ( 21 ). While the result- ing bounds sometimes predict coarse qualitative behavior, a precise c haracterization of relev ant phenomena remains elusive. Ev en the more refined tec hniques lik e P A C-Ba y es perform only marginally better ( 22 ). It is striking that only in rare cases do these b ounds explicitly incorp orate the interaction b etw een the graph and the features ( 23 ). Our results show that under- standing this interaction is crucial to understanding learning on graphs. Indeed, recall that a standard practice in the design of GNNs is to build (generalized) filters from the adjacency matrix or the graph Laplacian and then use these filters to pro cess data. But if the underlying graph is an Erdős–Rényi random graph, the induced filters will b e of little use in learning. The k ey is th us to understand ho w m uch useful information the graph pro vides about the lab els (and vice-versa), and in what w a y that information is complemen tary to that contained in the features. A statistical mechanics approac h: precise analysis of simple models. An alternative to the t ypically v acuous ‖ complexit y- based risk b ounds for graph neural netw orks ( 21 – 23 ) is to adopt a statistical mec hanics persp ective on learning; this is what w e do here. Indeed, one key asp ect of learning algorithms that is not easily captured b y complexit y measures of statistical learning theory is the emergence of qualitativ ely distinct phases of learning as one v aries certain k ey “order parameters” . Such phase diagrams emerge naturally when one views machine learning models in terms of statistical mechanics of learning ( 26 , 37 ). Martin and Mahoney ( 26 ) demonstrate this elegantly by form ulating what they call a very simple de ep learning mo del , and showing that it displa ys distinct learning phases reminis- cen t of many realistic, complex mo dels, despite abstracting a wa y all but the essential “load-lik e” and “temp erature-like” parameters. They argue that such parameters can be iden tified in machine learning models across the b oard. The statistical mec hanics paradigm requires one to commit to a specific mo del and do different calculations for differen t ‖ We quote the authors of the P A C-Bay esian analysis of generalization in GNNs ( 22 ): “[...] we are far from being able to e xplain the practical behaviors of GNNs . ” Shi et al. | January 24, 2024 | vol. XXX | no . XX | 7 A B C Fig. 6. T rain and test risks on CSBM f or diff erent intensities of self loops. A : train and test risk for τ = 0 . 8 and λ = − 1 (heterophilic). B : test risks for γ = 0 . 8 , τ = 0 . 8 , µ = 0 under different λ . C : training risk for different µ when τ = λ = 1 . Each data point is av eraged ov er 10 independent trials with N = 5000 , r = 0 , and d = 30 . We use the non-symmetric binar y adjacency matrix ensemble A bn . The solid lines are the theoretical results predicted by the replica method. In B we see that the optimal generalization perf ormance requires adapting the self-loop intensity c to the degree of homophily . Fig. 7. T est accuracy ( black ) and test error ( red ) in node classification with GCNs on real heterophilic graphs with diff erent self-loop intensities. We implement a two-la yer ReLU GCN with 128 hidden neurons and an additional self-loop with strength c . Each setting is aver aged over different training–test splits taken from ( 11 ) (60% training, 20% validation, 20% test). The relatively large standard deviation (vertical bars) is mainly due to the randomness of the splits. The randomness from model initialization and training is comparatively small. The optimal test accuracy for these two datasets is obtained for self-loop intensity − 0 . 5 < c ∗ < − 1 . mo dels ( 25 ), but it results in sharp c haracterizations of relev an t phases of learning. Imp ortan t results within this paradigm, b oth rigorous and heuristic, w ere deriv ed ov er the last decade for regularized least- squares ( 60 – 62 ), random-feature regression ( 17 , 34 , 49 , 63 ), and noisy Gaussian mixture and spiked co v ariance mo dels ( 64 – 66 ), using a v ariety of analytical techniques from statistical ph ysics, high-dimensional probabilit y , and random matrix theory . Not all of these works explicitly declare adherence to the statistical mechanics tradition. It nonetheless seems appropriate to categorize them thus since they provide precise analyses of learning in sp ecific mo dels in terms of a few order parameters. Ev en though these papers study comparatively simple mo d- els, man y key results only app eared in the last couple of years, motiv ated by the proliferation of o ver-parameterized models and adv ances in analytical tec hniques. One should make sure to work in the correct scaling of the v arious parameters ( 34 ); while this may complicate the analysis it leads to results whic h matc h the b ehavior of realistic machine learning systems. W e extend these recent results b y allo wing the information to prop- agate on a graph; this giv es rise to in teresting new phenomena of some relev ance for the practitioners. In order to obtain precise results we similarly study simple graph netw orks, but w e also show that the salient predictions closely match the b eha vior of state-of-the-art netw orks on real datasets. W e precisely traced the connection b etw een generalization, the in- teraction t ype (homophilic or heterophilic) and the parameters of the GCN architecture and the dataset for a sp e cific graph mo del. Exp eriments sho w that the learned lessons apply to a broad class of GNNs and can be used constructiv ely to impro v e the p erformance of state-of-the-art graph neural netw orks on heterophilic data. Finally , let us men tion that phenomenological characteriza- tions of phase diagrams of risk are not the only wa y to apply to ols from statistical mechanics and more broadly physics to mac hine learning and neural netw orks. These to ols may help address a rather different set of “design” questions, as review ed b y Bahri et al. ( 67 ). Negative self-loops in other graph learning models. Recen t theoretical work ( 19 , 20 ) shows that optimal message passing in heterophilic datasets requires aggregating neighbor mes- sages with a sign opp osite from that of no de-sp ecific up dates. Similarly , in earlier GCN arc hitectures such as GraphSA GE ( 9 ), node and neighbor features are extracted using different trainable functions. This immediately allows the p ossibility of aggregating neighbors with an opp osite sign in heterophilic settings. W e sho w that self-loops with sign and strength de- p ending on the degree of heterophily improv e p erformance b oth in theory and in real state-of-the-art GCNs. The no- tion of self-lo ops in the context of GCNs usually indicates an explicit connection b etw een a no de and itself, A ← A + I . GCNs with a few labels outperform optimal unsupervised detection. One interpretation of our results is that they quan- tify the v alue of lab els in communit y detection, traditionally approac hed with unsup ervised metho ds. These approaches are sub ject to fundamental information-theoretic detection limits whic h ha v e drawn considerable attention o v er the last decade ( 64 , 68 , 69 ). The most challenging and most realistic high-dimensional setting is when the signal strength is compa- rable to that of the noise for b oth the graph and the features ( 24 , 68 , 70 ). The results of Deshpande et al. indicate that when µ 2 /γ + λ 2 < 1 , no unsupervised estimator can detect the laten t structure y from A and X ( 24 ). Our analysis shows that even a small fraction of revealed lab els allow a simple GCN to break this unsup ervise d barrier. In Fig. 8 , w e compare the accuracy of a one-la yer GCN with unsup ervised b elief propagation (BP) ( 24 ). W e first run BP with µ = λ = γ = 1 and record the achiev ed accuracy . W e then plot the smallest training lab el ratio τ for which the GCN ac hiev es the same accuracy . W e rep eat this pro cedure for differen t feature SNRs µ and graph SNRs λ . The black solid 8 | Shi et al. Fig. 8. T raining label ratio when a one-lay er GCN matches the perfo rmance of unsupervised belief propagation at µ = λ = γ = 1 . The black solid line denotes the information-theoretic detection threshold in the unsuper vised setting where no label information is av ailable ( i.e., when we use only A , X ). If given a small number of labels, a simple, gener ally sub-optimal estimator matches the perf ormance of the optimal unsupervised estimator. line indicates the information-theoretic threshold for detecting the latent structure from A and X . Earlier analyses of b elief propagation in the SBM without features unco v er a detectability phase transition ( 71 ). Our analysis shows that no such transition happ ens with GCNs. Indeed, our primary in terest is in understanding GCNs, whic h are a general to ol for a v ariety of problems, but unlike b elief propagation, GCNs need not b e near-optimal for communit y detection. F or the optimal inference strategy , the phase tran- sition may not be destroy ed b y rev ealing labels. 5. Generalization in GCNs via statistical ph ysics The optimization problem Eq. ( 4 ) has a unique minimizer as long as r > 0 . Since it is a linear least-squares problem in w , w e can write down a closed-form solution, w ∗ = ( r I F + ( P ( A ) X ) T I train P ( A ) X ) − 1 ( P ( A ) X ) T I train y , [11] where ( I train ) ij = 1 if i = j ∈ V train 0 otherwise . [12] Analyzing generalization is, in principle, as simple as sub- stituting the closed-form expression Eq. ( 11 ) into Eq. ( 5 ) and Eq. ( 6 ) and calculating the requisite av erages. The procedure is, ho w ev er, complicated b y the in teraction betw een the graph A and the features X and the fact that A is a random binary adjacency matrix. F urther, for a symmetric A , I train P ( A ) is correlated with I test P ( A ) even in a shallow GCN (and certainly in a deep one). The statistical ph ysics program. W e in terpret the (scaled) loss function as an energy , or a Hamiltonian, H ( w ; A , X ) = τ N L A , X ( w ) . Corresp onding to this Hamiltonian is the Gibbs measure ov er the weigh ts w , d P β ( w ; A , X ) = exp( − β H ( w ; A , X ))d w Z β ( A , X ) where Z β ( A , X ) = Z d w exp ( − β H ( w ; A , X )) , β is the inverse temp eratur e and Z β is the p artition function . A t infinite temp erature ( β → 0 ), the Gibbs measure is diffuse; as the temp erature approaches zero ( β → ∞ ) , it conv erges to an atomic measure concentrated on the unique solution of Eq. ( 4 ), w ∗ = lim β →∞ R w P β ( w ; A , X )d w . In this latter case the partition function is similarly dominated by the minimum of the Hamiltonian. The exp ected loss can thus be computed from the fr e e ener gy density f β , E A , X [ L A , X ( w ∗ )] = − 1 τ lim β →∞ f β where f β := − lim N →∞ 1 N β E A , X ln Z β ( A , X ) . Since the quenched a v erage E ln Z β is usually intractable, w e apply the replica metho d ( 72 ) which allows us to take the exp ectation inside the logarithm and compute the annealed a v erage, E A , X ln Z β ( A , X ) = lim n → 0 ln E A , X Z n β ( A , X ) n . The gist of the replica method is to compute E A , X Z n β for in teger n and then “pretend” that n is real and take the limit n → 0 . The computation for in teger n is facilitated by the fact that Z n β normalizes the joint distribution of n indep enden t copies of w , { w a } n a =1 . W e obtain E A , X Z n β ( A , X ) = E A , X ( Z β ( A , X )) 1 × · · · × ( Z β ( A , X )) n = Z n Y a =1 d w a E A , X exp n X a =1 − β ∥ I train AX w a − I train y ∥ 2 2 ! × exp( − β τ r ∥ w a ∥ 2 2 ) . [13] Instead of w orking with the product AX , replica allo ws us to express the free energy density as a stationary p oint of a function where the dep endence on A and X is separated (see App endix A for details), f β = 1 β extr lim n → 0 lim N →∞ 1 nN ( E A [ c ( P ( A ))] + E X [ e ( X )]) + D ( m, p, q , b m, b p, b q ) = 1 β extr m,p,q b m, b p, b q C ( m, p, q ) + E ( b m, b p, b q ) + D ( m, p, q , b m, b p, b q ) , [14] where w e defined C def = 1 nN E A [ c ( P ( A ))] , E def = 1 nN E X [ e ( X )] , whic h in the limit N → ∞ , n → 0 only depend on the so- called order parameters m, p, q and b m, b p, b q . The separation th us allows us to study the influence of the distribution of A in isolation; w e provide the details in SI App endix A . The risks (called the observ ables in ph ysics) can b e obtained from f β . Gaussian adjacency equivalence. A challenge in computing the quantities in Eq. ( 13 ) and Eq. ( 14 ) is to a v erage ov er the binary adjacency matrix A . W e argue that f in Eq. ( 14 ) do es not c hange if we instead a verage o v er the Gaussian ensem ble with a correctly chosen mean and co v ariance. F or a one-lay er GCN ( P ( A ) = A ), we sho w that replacing E A bs c ( P ( A bs )) by Shi et al. | January 24, 2024 | vol. XXX | no . XX | 9 E A gn c ( P ( A gn )) will not change f in Eq. ( 14 )with A gn b eing a spiked non-symmetric Gaussian random matrix, A gn = λ N y y T + Ξ gn , [15] with Ξ gn ha ving i.i.d. cen tered normal en tries with v ariance 1 / N . This substitution is inspired by the univ ersalit y results for the disorder of spin glasses ( 73 – 75 ) and the universalit y of m utual information in CSBM ( 24 ). Deshpande et al. ( 24 ) sho wed that the binary adjacency matrix in the stochastic blo c k mo del can b e replaced by A gs = λ N y y T + Ξ gs , [16] where Ξ gs ∈ R N × N is a sample from the standard Gaussian orthogonal ensem ble, without affecting the mutual information b et w een y (whic h they modeled as random) and ( A , X ) when N → ∞ and d → ∞ . Our claim refers to certain av erages inv olving A ; w e record it as a conjecture since our deriv ations are based on the non- rigorous replica method. W e first define four probabilit y dis- tributions: • A bs : The distribution of adjacency matrices in the undi- rected CSBM (cf. Eq. ( 7 )) scaled b y 1 / √ d , 1 √ d A bs ∼ A bs ; • A bn : the distribution of adjacency matrices in the directed CSBM (cf. Eq. ( 8 )), scaled by 1 / √ d ; • A gs : the distribution of spiked Gaussian orthogonal en- sem ble (cf. Eq. ( 16 ); • A gn : the distribution of spik ed Gaussian random matrices (cf. Eq. ( 15 ). With these definitions in hand we can state Conjecture 1 (Equiv alence of graph matrices) . A ssume that d sc ales with N so that 1 /d → 0 and d/ N → 0 when N → ∞ . L et P ( A ) b e a p olynomial in A use d to define the GCN function in Eq. ( 3 ) . It then holds that R train ( A b • ) = R train ( A g • ) , R test ( A b • ) = R test ( A g • ) , A CC( A b • ) = A CC( A g • ) , with • ∈ { s , n } . When P ( A ) = A , the ab ove quantities for symmetric and non-symmetric distributions also coincide. In the case when P ( A ) = A w e justify Conjecture 1 by the replica method (see SI App endix A ). In the general case w e provide abundant n umerical evidence in Fig. 9 . W e first consider the case when P ( A ) = A . Fig. 9 A and Fig. 9 D show estimates of R train and R test a veraged ov er 100 indep endent runs. The standard deviation ov er independent runs is indi- cated by the shading. W e see that the means conv erge and the v ariance shrinks as N grows. W e also show absolute differences betw een the a v erages of R train and R test in Fig. 9 B and Fig. 9 E . W e find that the v alues of R train and R test can b e w ell fitted b y a linear relationship in the logarithmic scale, suggesting that the absolute differences approac h zero exp onentially fast as N → ∞ . W e next consider P ( A ) = A 2 . In Fig. 9 C and Fig. 9 F we can see that for in termediate v alues of d , R train and R test corresp onding to A bs and A bn are b oth close to that corresp onding to A gs and A gn . This is consisten t with the results sho wn in Fig. 3 and Fig. 6 where the theoretical results computed b y the replica metho d and A gn p erfectly matc h the n umerical results with A bn (for P ( A ) = A + c I N ) and A bs (for P ( A ) = A ), further v alidating the conjecture. Solution to the saddle point equation. W e can now solv e the saddle p oint equation Eq. ( 14 ) by a v eraging o v er A gn . In the general case the solution is easy to obtain numerically . F or an one-la y er GCN with P ( A ) = A w e can compute a closed-form solution. Denoting the critical p oint in Eq. ( 14 ) by ( m ∗ , p ∗ , q ∗ ) w e obtain R train = ( λm ∗ − 1) 2 + p ∗ (2 q ∗ + 1) 2 , R test = ( λm ∗ − 1) 2 + p ∗ , A CC = 1 2 1 + erf λm ∗ √ 2 p ∗ , [17] where erf is the usual error function. While the general expres- sions are complicated (see SI App endix A ), in the ridgeless limit r → 0 we can compute simple closed-form expressions for train and test risks, R train = ( γ + µ )( γ τ − 1) γ τ ( γ + λ 2 ( µ + 1) + µ ) , R test = γ τ ( γ + µ ) ( γ τ − 1) ( γ + λ 2 ( µ + 1) + µ ) , [18] assuming that τ γ > 1 . A rigorous solution. W e note that for a one-lay er GCN risks can b e computed rigorously using random matrix theory pro- vided that Conjecture 1 holds and we begin with a Gaussian “adjacency matrix” instead of the true binary SBM adjacency matrix. W e outline this approach in SI Appendix C ; in par- ticular, for r = 0 , the result of course coincides with that in Eq. ( 18 ). 6. Conc lusion W e analyzed generalization in graph neural netw orks by mak- ing an analogy with a system of in teracting particles: particles corresp ond to the data points and the in teractions are speci- fied by the adjacency relation and the learnable weigh ts. The latter can b e interpreted as defining the “in teraction physics” of the problem. The b est w eigh ts correspond to the most plausible interaction physics, coupled in turn with the net w ork formation mechanism. The setting that we analyzed is maybe the simplest combi- nation of a graph conv olution net w ork and data distribution whic h exhibits interesting, realistic behavior. In order to theo- retically capture a broader spectrum of complexity in graph learning we need to w ork on new ideas in random matrix theory and its neural net w ork coun terparts ( 76 ). While very deep GCNs are kno wn to suffer from ov ersmoothing, there ex- ists an interesting in termediate-depth regime beyond a single la yer ( 77 ). Our techniques should apply simply by replacing A b y any p olynomial P ( A ) b efore solving the saddle p oint equation, but w e will need a generalization of existing random matrix theory results for HCIZ in tegrals. Finally , it is likely that these generalized results could b e made fully rigorous if “univ ersalit y” in Conjecture 1 could b e established formally . 10 | Shi et al. A B C D E F Fig. 9. Numerical validation of Conjecture 1 . In A & D : we show training and test risks with different numbers of nodes f or P ( A ) = A . The parameters are set to γ = λ = µ = 2 , r = 0 . 01 , τ = 0 . 8 and d = √ N / 2 . In B & E , we show the absolute diff erence of the risks between binary and Gaussian adjacency as a function of N , using the same data in A & D . The solid lines correspond to a linear fit in the logarithmic scale, which shows that the error scales as | ∆ | ∼ N − 0 . 5 . In C & F we show the training and test risks when P ( A ) = A 2 under different a ver age node degrees d . Other parameters are set to λ = µ = 1 , γ = 2 , N = 2000 , τ = 0 . 8 and r = 0 . 01 . In these settings, the conjecture empirically holds up to scrutiny . A CKNO WLEDGMENTS. W e thank the anonymous reviewers for suggestions on how to improv e presentation. Cheng Shi and Liming P an w ould lik e to thank Zhen yu Liao (HUST) and Ming Li (ZJNU) for v aluable discussions ab out RMT. Cheng Shi and Iv an Dokmanić w ere supp orted b y the European Research Council (ERC) Starting Gran t 852821—SWING. Liming Pan would like to ackno wledge supp ort from National Natural Science F oundation of China (NSFC) under Grant No. 62006122 and 42230406. 1. R Lam, et al., GraphCast: Lear ning skillful medium-range global weather f orecasting. arXiv preprint arXiv:2212.12794 (2022). 2. R Mandal, C Casert, P Sollich, Robust prediction of force chains in jammed solids using gr aph neural networks. Nat. Commun . 13 , 4424 (2022). 3. J Ingr aham, V Garg, R Barzilay , T Jaakkola, Gener ative models for gr aph-based protein design. Adv. neural information processing systems 32 (2019). 4. V Gligor ijevi ´ c, et al., Structure-based protein function prediction using graph convolutional networks. Nat. communications 12 , 3168 (2021). 5. J Jumper, et al., Highly accurate protein structure prediction with AlphaFold. Nature 596 , 583–589 (2021). 6. JE Bruna, W Zaremba, A Szlam, Y LeCun, Spectral networks and deep locally connected networks on graphs in International Conference on Learning Representations . (2014). 7. M Defferrard, X Bresson, P V andergheynst, Convolutional neural networks on graphs with f ast localized spectral filtering. Adv. neural information processing systems 29 (2016). 8. TN Kipf, M W elling, Semi-supervised classification with gr aph convolutional networks in International Conference on Learning Representations . (2017). 9. W Hamilton, Z Ying, J Leskov ec, Inductive representation learning on large graphs. Adv. neural information processing systems 30 (2017). 10. J Zhu, et al., Beyond homophily in graph neural networks: Current limitations and effective designs. Adv. neural information processing systems 33 , 7793–7804 (2020). 11. H P ei, B Wei, KCC Chang, Y Lei, B Y ang, Geom-GCN: Geometric gr aph convolutional networ ks in International Conference on Learning Representations . (2020). 12. E Chien, J P eng, P Li, O Milenko vic, Adaptiv e universal generaliz ed P ageRank graph neural network in International Conference on Learning Representations . (2021). 13. K Oono, T Suzuki, Graph neural networks exponentially lose expressive power for node classification in International Conference on Learning Representations . (2020). 14. P Nakkiran, et al., Deep doub le descent: Where bigger models and more data hurt. J. Stat. Mech. Theory Exp . 2021 , 124003 (2021). 15. YY Liu, JJ Slotine, AL Barabási, Observability of complex systems. Proc. Natl. Acad. Sci . 110 , 2460–2465 (2013). 16. L Chen, Y Min, M Belkin, A Karbasi, Multiple descent: Design your own generalization curve. Adv. Neural Inf. Process. Syst . 34 , 8898–8912 (2021). 17. M Belkin, D Hsu, J Xu, T wo models of double descent f or weak f eatures. SIAM J. on Math. Data Sci . 2 , 1167–1180 (2020). 18. M McPherson, L Smith-Lovin, JM Cook, Birds of a feather: Homophily in social networ ks. Annu. revie w sociology pp . 415–444 (2001). 19. R Wei, H Y in, J Jia, AR Benson, P Li, Understanding non-linearity in gr aph neural networks from the Bay esian-inference perspectiv e. arXiv preprint arXiv:2207.11311 (2022). 20. A Baranwal, A J agannath, K F ountoulakis, Optimality of message-passing architectures f or sparse graphs. arXiv prepr int arXiv:2305.10391 (2023). 21. V Garg, S Jegelka, T Jaakkola, Generalization and representational limits of graph neural networks in International Conference on Machine Learning . (PMLR), pp. 3419–3430 (2020). 22. R Liao, R Urtasun, R Zemel, A P AC-Ba yesian approach to gener alization bounds for g raph neural networks in International Conference on Learning Representations . (2021). 23. P Esser , L Chennuru V ankadara, D Ghoshdastidar , Learning theory can (sometimes) explain generalisation in graph neural networks. Adv. Neural Inf. Process. Syst . 34 , 27043–27056 (2021). 24. Y Deshpande , S Sen, A Montanari, E Mossel, Contextual stochastic block models. Adv. Neural Inf. Process. Syst . 31 (2018). 25. TL Watkin, A Rau, M Biehl, The statistical mechanics of learning a rule. Revie ws of Modern Physics 65 , 499 (1993). 26. CH Martin, MW Mahoney , Rethinking generalization requires revisiting old ideas: statistical mechanics approaches and complex learning beha vior . arXiv preprint (2017). 27. C Zhang, S Bengio, M Hardt, B Recht, O Vinyals , Understanding deep lear ning requires rethinking generalization in 5th International Conference on Learning Representations, ICLR 2017, T oulon, Fr ance, April 24-26, 2017, Conference T r ack Proceedings . (OpenRevie w .net), (2017). 28. T Hastie, R Tibshirani, JH F riedman, JH F riedman, The elements of statistical learning: data mining, inference , and prediction . (Springer) V ol. 2, (2009). 29. M Opper, W Kinzel, J Kleinz, R Nehl, On the ability of the optimal perceptron to generalise. Journal of Physics A: Mathematical and General 23 , L581 (1990). 30. A Engel, C V an den Broeck, Statistical Mechanics of Learning . (Cambridge University Press), (2001). 31. HS Seung, H Sompolinsky , N Tishby , Statistical mechanics of lear ning from examples. Phys. revie w A 45 , 6056 (1992). 32. M Opper , Learning and generalization in a two-la yer neural netw ork: The role of the Vapnik– Chervonvenkis dimension. Phys. revie w letters 72 , 2113 (1994). 33. M Belkin, D Hsu, S Ma, S Mandal, Reconciling moder n machine-lear ning practice and the classical bias–variance trade-off. Proc. Natl. Acad. Sci . 116 , 15849–15854 (2019). 34. Z Liao , R Couillet, MW Mahone y , A random matrix analysis of random Fourier features: beyond the gaussian kernel, a precise phase transition, and the corresponding double descent. Adv. Neural Inf. Process. Syst . 33 , 13939–13950 (2020). Shi et al. | January 24, 2024 | vol. XXX | no . XX | 11 35. A Canatar , B Bordelon, C P ehlev an, Spectral bias and task-model alignment e xplain general- ization in kernel regression and infinitely wide neural networks. Nat. communications 12 , 2914 (2021). 36. Q Li, Z Han, XM Wu, Deeper insight s into graph con volutional networks f or semi-supervised learning in Proceedings of the AAAI conference on artificial intelligence . V ol. 32, (2018). 37. Y Y ang, et al., T axonomizing local versus global structure in neural network loss landscapes. Adv. Neural Inf. Process. Syst . 34 , 18722–18733 (2021). 38. P Sen, et al., Collectiv e classification in network data. AI magazine 29 , 93–93 (2008). 39. B Rozemberczki, C Allen, R Sarkar, Multi-scale attributed node embedding. J. Complex Networks 9 , cnab014 (2021). 40. SK Maurya, X Liu, T Murata, Improving graph neural networks with simple architecture design. arXiv preprint arXiv:2105.07634 (2021). 41. P V eli ˇ ckovi ´ c, et al., Graph attention networks in International Conference on Learning Repre- sentations . (2018). 42. F Wu, et al., Simplifying graph con volutional networks in International conference on machine learning . (PMLR), pp. 6861–6871 (2019). 43. X Wang, M Zhang, Ho w powerful are spectr al graph neural networks in International Confer- ence on Machine Learning . (PMLR), pp. 23341–23362 (2022). 44. M He, Z Wei, H Xu, , et al., Ber nnet: Lear ning arbitrar y graph spectral filters via Bernstein approximation. Adv. Neural Inf. Process. Syst . 34 , 14239–14251 (2021). 45. YJ W ang, GY W ong, Stochastic b lockmodels f or directed gr aphs. J. Am. Stat. Assoc . 82 , 8–19 (1987). 46. FD Malliaros, M V azirgiannis, Clustering and community detection in directed networks: A survey. Phys. reports 533 , 95–142 (2013). 47. W Lu, Learning guarantees for graph conv olutional networks on the stochastic block model in International Conference on Learning Representations . (2021). 48. A Baranwal, K Fountoulakis, A J agannath, Graph con volution for semi-supervised classification: improved linear separability and out-of-distribution gener alization in International Conference on Machine Learning . (PMLR), pp. 684–693 (2021). 49. S Mei, A Montanari, The generalization error of random f eatures regression: Precise asymp- totics and the double descent curve. Commun. on Pure Appl. Math . 75 , 667–766 (2022). 50. X Li, et al., Finding global homophily in gr aph neural networks when meeting heterophily in International Conference on Machine Learning . (PMLR), pp. 13242–13256 (2022). 51. S Luan, et al., Re visiting heterophily for graph neural networ ks. Adv. neural information processing systems 35 , 1362–1375 (2022). 52. J Gasteiger, A Bojchevski, S Günnemann, Predict then propagate: Graph neural networks meet personalized pagerank. arXiv preprint arXiv:1810.05997 (2018). 53. R Sato , A survey on the e xpressive power of graph neural networks. arXiv preprint arXiv:2003.04078 (2020). 54. F Geerts, JL Reutter, Expressiveness and appro ximation properties of graph neural networks in International Conference on Learning Representations . (2022). 55. K Xu, W Hu, J Lesko vec , S Jegelka, How po werful are graph neur al networks? in Inter national Conference on Learning Representations . (2019). 56. J Gilmer , SS Schoenholz, PF Riley , O Vinyals , GE Dahl, Neural message passing f or quantum chemistry in Inter national conference on machine learning . (PMLR), pp. 1263–1272 (2017). 57. V V apnik, A Y Chervonenkis, On the uniform conv ergence of relative frequencies of e v ents to their probabilities. Theory Probab. & Its Appl . 16 , 264–280 (1971). 58. V Vapnik, The nature of statistical learning theory . (Springer science & business media), (1999). 59. F Scarselli, AC Tsoi, M Hagenbuchner , The V apnik–Chervonenkis dimension of graph and recursive neural netw orks. Neural Networks 108 , 248–259 (2018). 60. S Oymak, C Thrampoulidis, B Hassibi, The squared-error of generalized lasso: A precise analysis in 2013 51st Annual Allerton Conference on Communication, Control, and Computing (Allerton) . (IEEE), pp . 1002–1009 (2013). 61. C Thr ampoulidis, E Abbasi, B Hassibi, Precise error analysis of regularized M -estimators in high dimensions. IEEE T ransactions on Inf. Theory 64 , 5592–5628 (2018). 62. S Boyd, et al., Distributed optimization and statistical learning via the alternating direction method of multipliers. Foundations T rends Mach. learning 3 , 1–122 (2011). 63. H Hu, YM Lu, Universality laws for high-dimensional lear ning with random features. IEEE T ransactions on Inf. Theory (2022). 64. A El Alaoui, MI Jordan, Detection limits in the high-dimensional spik ed rectangular model in Conference On Learning Theory . (PMLR), pp. 410–438 (2018). 65. J Barbier , N Macris, C Rush, All-or-nothing statistical and computational phase transitions in sparse spiked matrix estimation. Adv. Neural Inf. Process. Syst . 33 , 14915–14926 (2020). 66. F Mignacco, F Krzakala, Y Lu, P Urbani, L Zdeborová, The role of regularization in classification of high-dimensional noisy Gaussian mixture in Inter national Conference on Machine Learning . (PMLR), pp. 6874–6883 (2020). 67. Y Bahri, et al., Statistical mechanics of deep lear ning. Annu. Rev. Condens. Matter Phys . 11 , 501–528 (2020). 68. Y Deshpande, E Abbe , A Montanari, Asymptotic mutual inf ormation for the balanced binary stochastic block model. Inf. Inference: A J. IMA 6 , 125–170 (2017). 69. E Mossel, J Neeman, A Sly , A proof of the block model threshold conjecture. Combinator ica 38 , 665–708 (2018). 70. O Duranthon, L Zdeborová, Optimal inference in conte xtual stochastic block models. arXiv preprint arXiv:2306.07948 (2023). 71. P Zhang, C Moore, L Zdeborová, Phase transitions in semisuper vised clustering of sparse networks. Phys. Rev. E 90 , 052802 (2014). 72. M Mézard, G P arisi, MA Virasoro, Spin glass theory and bey ond: An introduction to the replica method and its applications . (World Scientific Publishing Company) V ol. 9, (1987). 73. M T alagrand, Gaussian av erages, Bernoulli av erages, and Gib bs’ measures. Random Struct. & Algorithms 21 , 197–204 (2002). 74. P Carmona, Y Hu, Universality in Sherrington–Kirkpatrick’ s spin glass model in Annales de l’Institut Henri Poincare (B) Probability and Statistics . (Elsevier), V ol. 42, pp . 215–222 (2006). 75. D Panchenko , The Sherrington-Kir kpatrick model . (Spr inger Science & Business Media), (2013). 76. J Pennington, P Worah, Nonlinear random matr ix theor y for deep lear ning. Adv. neur al information processing systems 30 (2017). 77. N Keriven, Not too little, not too much: A theoretical analysis of graph (over)smoothing in Advances in Neural Inf ormation Processing Systems , eds. AH Oh, A Agarwal, D Belg rav e, K Cho. (2022). 78. D V V oiculescu, KJ Dykema, A Nica, F ree random v ariables . (Amer ican Mathematical Soc.) No. 1, (1992). 79. T Dupic, IP Castillo, Spectr al density of products of Wishar t dilute random matrices. par t i: the dense case. arXiv preprint arXiv:1401.7802 (2014). 80. DI Shuman, SK Narang, P Frossard, A Or tega, P Vanderghe ynst, The emerging field of signal processing on graphs: Extending high-dimensional data analysis to networks and other irregular domains. IEEE signal processing magazine 30 , 83–98 (2013). 81. A Ortega, P Frossard, J K ov a ˇ cevi ´ c, JM Moura, P V andergheynst, Graph signal processing: Overview , challenges , and applications. Proc. IEEE 106 , 808–828 (2018). 12 | Shi et al. A. Sketch of the deriv ation A. Replica method. W e now outline the replica-based deriv ations. W e first consider one-lay er GCN P ( A ) = A to sho w the main idea. The training and test risks in this case is given by Eq. ( 5 ) in the main text. W e further extend the analysis when self-lo ops are included in Appendix B . W e b egin by defining the augmente d p artition function , Z β ( A , X ) = Z d w exp ( − β H ( w ) + t 0 β O train ( w ) + t 1 β O test ( w )) , where β is the in verse temp erature. The Hamiltonian in the ab ove equation reads H ( w ) = ∥ I train AX w − I train y ∥ 2 2 + τ r ∥ w ∥ 2 2 , [19] which is the loss Eq. ( 4 ) scaled by N τ . The “observ ables” O train and O test (the scaled training and test risks) are the quantities we are interested in: O train ( w ) = ∥ I train AX w − I train y ∥ 2 2 , O test ( w ) = ∥ I test AX w − I test y ∥ 2 2 . When the in verse temperature β is small, the Gibbs measure Z − 1 β ( A, X ) exp ( − β H ( w )) d w is diffuse; when β → ∞ , the Gibbs measure conv erges to an atomic measure concentrated on the unique solution of Eq. ( 4 ). That is to sa y , for t 0 = t 1 = 0 , we can write w ∗ = lim β →∞ Z w P β ( w ; A , X )d w , where P β ( w ; A , X ) = 1 Z β ( A , X ) exp ( − β H ( w )) . The idea is to compute the v alues of the observ ables in the large system limit at a finite temperature and then take the limit β → ∞ . T o this end, we define the fr e e ener gy density f β corresponding to the augmented partition function, f β := − lim N →∞ 1 N β E A , X ln Z β ( A , X ) . [20] The exp ected risks can b e computed as R train = − 1 τ lim β →∞ ∂ f β ∂ t 0 t 0 =0 ,t 1 =0 , R test = − 1 1 − τ lim β →∞ ∂ f β ∂ t 1 t 0 =0 ,t 1 =0 . [21] Although ln Z β ( A , B ) / N concentrates for large N , a direct computation of the quenc hed av erage Eq. ( 20 ) is intractable. W e no w use the r eplic a trick which takes the expectation inside logarithm, or replaces the quenc hed av erage by annealed a v erage in ph ysics jargon: E A , X ln Z β ( A , X ) = lim n → 0 ln E A , X Z n β ( A , X ) n . [22] The main idea of the replica method is to first compute E A , X Z n β for in teger n by interpreting Z n β = ( Z β ) 1 ( Z β ) 2 . . . ( Z β ) n as the pro duct of n partition functions for n independent configurations { w a } n a =1 . Then w e obtain E A , X ln Z β by taking the limit n → 0 in Eq. ( 22 ), even though the formula for ln E A , X Z β n is valid only for integer n . The exp ectation of replicated partition function reads E A , X Z n β ( A , X ) = E A , X Z β ( A , X ) 1 × · · · × Z β ( A , X ) n = Z n Y a =1 d w a E A , X exp n X a =1 − I β AX w a − I β y 2 2 ! exp( − β τ r ∥ w a ∥ 2 2 ) , [23] where we denote I β def = p β − β t 0 I train + p − β t 1 I test . W e first keep X fixed and take the expectation o v er A . Directly computing the expectation ov er the binary graph matrix A ∼ A bs is non-trivial. T o make progress, w e av erage ov er A ∼ A gn (instead cf. Eq. ( 15 )). In Appendix B we show that this Gaussian substitution does not c hange the free energy densit y , ultimately yielding the same risks and accuracies as detailed in Conjecture 1 . Letting σ a = X w a , the elements of A gn σ a are now join tly Gaussian for any fixed σ a and C = 1 nN ln E A exp P n a =1 − I β Aσ a − I β y 2 can b e computed by multiv ariate Gaussian integration. It is not hard to see that C dep ends only on a vector m ∈ R n and a matrix Q ∈ R n × n defined as m a = y T σ a / N , and Q ab = ( σ a ) ⊺ σ b / N . [24] In statistical physics these quan tities are called the or der p ar ameters . W e then define C ( m , Q ) = 1 nN ln E A c ( A ) = 1 nN ln E A exp − X a I β Aσ a − I β y 2 2 ! . [25] Using the F ourier represen tation of the Dirac delta function δ ( t − t 0 ) = 1 2 π R d ω exp( iω ( t − t 0 )) , we ha v e δ N Q ab − ( w a ) ⊺ X ⊺ X w b = 1 2 π Z d b Q ab exp i b Q ab N Q ab − ( w a ) ⊺ X ⊺ X w b , δ ( N m a − y ⊺ X w a ) = 1 2 π Z d b m a exp i b m a ( N m a − y ⊺ X w a ) , [26] Shi et al. | January 24, 2024 | vol. XXX | no . XX | 13 so that Eq. ( 23 ) b ecomes E A , X Z n β ( A , X ) = iN 2 π n 2 +3 n 2 Z Y a ≤ b d Q ab Y a ≤ b d b Q ab Y a d m a Y a d b m a × exp ( nN C ( m , Q )) × exp nN E b m , b Q × exp N X a ≤ b b Q ab Q ab + N X a b m a m a ! , [27] where E ( b m , b Q ) = 1 nN ln E X e ( X ) = 1 nN ln E X Z n Y a =1 d w a exp − X a ≤ b b Q ab ( w a ) T X ⊺ X w b − X a b m a y ⊺ X w a − τ rβ X a ∥ w a ∥ 2 2 . [28] In Eq. ( 27 ) and Eq. ( 28 ), we apply the c hange of v ariables i Q ab → Q ab , i m a → m a . Note that while Eq. ( 25 ) still depends on X , w e do not a v erage over it. As A and X appear as a product in Eq. ( 22 ), it is not straightforw ard to a v erage o v er them simultaneously . W e av erage ov er A first to arrive at Eq. ( 27 ), and then find that Eq. ( 25 )-Eq. ( 28 ) are self-av eraging, meaning that they concentrate around their expectation as N → ∞ . Ultimately , this allo ws us to isolate the randomness in A and X . It also allo ws the p ossibility to adapt our framework to other graph filters b y simply replacing A by P ( A ) in Eq. ( 25 ). Since Eq. ( 4 ) has a unique solution, w e tak e the replica symmetry assumption where the order parameters are structured as m = m 1 n , b m = b m 1 n , Q = q I n + p 1 n 1 ⊺ n , b Q = b q I n + b p 1 n 1 ⊺ n . [29] In the limit N → ∞ , n → 0 , w e are only interested in the leading order contributions to C ( m , Q ) so w e write (with a small abuse of notation), C ( m, p, q ) = τ (2 β (1 − t 0 ) q + λm ) 2 2 q (2 β (1 − t 0 ) q + 1) − β (1 − t 0 ) τ − τ 2 2 β (1 − t 0 ) p 2 β (1 − t 0 ) q + 1 − τ λ 2 m 2 2 q + (1 − τ ) ( − 2 t 1 q + λm ) 2 2 q ( − 2 t 1 + 1) + t 1 (1 − τ ) − (1 − τ ) 2 − 2 t 1 p − 2 t 1 q + 1 − (1 − τ ) λ 2 m 2 2 q + o (1) + β o β (1) . ∗∗ [30] Similarly , we ha v e E ( b m, b p, b q ) = 1 2(2 b q + b p ) γ b p 1 − b rT + γ b m 2 1 − T b r + γ − 1 T 2 µ b r + ( γ − 1) T µ + γ + o (1) + β o β (1) , [31] where T = 1 2 b r 1 − b r − γ + p 1 + b r 2 + 2 b r + 2 γ b r − 2 γ + γ 2 and b r = 2 τ r 2 b q + b p . [32] W e give the details of the deriv ation of C in Appendix B and of E in Appendix C . When r → 0 , w e hav e T → 1 1 − γ , and E ( b m, b p, b q ) = 1 2 b m 2 2 b q + b p µ + 1 γ + µ − 1 2 γ b p 2 b q + b p + o (1) . [33] W e can now compute Eq. ( 27 ) b y integrating only on 6 parameters: m , b m , q , b q , p , and b p . F or N → ∞ , the integral can be computed via the saddle p oint method: f β = 1 β extr m, b m, q, b q ,p, b p lim n → 0 lim N →∞ C ( m, p, q ) + E ( b m, b p, b q ) + ( q + p ) b q + b p − 1 2 p b p + m b m. [34] The stationary p oint satisfies ∂ f β ∂ m = ∂ f β ∂ b m = ∂ f β ∂ p = ∂ f β ∂ b p = ∂ f β ∂ q = ∂ f β ∂ b q = 0 . [35] When β → ∞ , the stationary point exists only if m, b m, p, b p, q , b q scale as p = O (1) , q = O 1 β , b p = O β 2 , 2 b q + b p = O ( β ) , m = O (1) , b m = O ( β ) . W e thus reparameterize them as p → p, β q → q, b p β 2 → b p, 1 β 2 b q + b p → b q , m → m, 1 β b m → b m. ∗∗ We use the asymptotic notation o (1) for deterministic and random quantities which v anish in the limit n → 0 , N → ∞ in a suitable sense . We similarly use o β (1) in the limit β → ∞ . The order parameters m, p, q in Eq. ( 30 ) as well as ˆ m, ˆ p, ˆ q in Eq. ( 33 ) scale in linear order of β or a polynomial of β . 14 | Shi et al. Ignoring the small terms which v anish when n → 0 , N → ∞ , β → ∞ , and denoting f = lim β →∞ f β , we get f = extr m, b m, q, b q ,p, b p g ( t 0 − 1 , τ ) + g ( t 1 , 1 − τ ) + 1 2 b q p + q b p + 2 m b m + 1 2 b m 2 b q 1 − T b r + γ − 1 T 2 µ b r + ( γ − 1) T µ + γ − 1 2 γ b p 1 − b rT b q , [36] where g ( t, τ ) = tτ − τ tp 2 tq + 1 − τ λ 2 m 2 2 q + τ (2 tq + λm ) 2 2 q (2 tq + 1) , and b r = 2 τ r b q . W e denote by m ∗ , p ∗ , q ∗ , b m ∗ , b p ∗ , b q ∗ the stationary p oint in Eq. ( 36 ) and substitute in to Eq. ( 21 ) yields the risks in 17 . W e analyze the connection between the stationary point and w ∗ . As w ∗ is the unique solution in Eq. ( 4 ), and from the definition of order parameters Eq. ( 24 ), stationarity in Eq. ( 36 ) implies that p ∗ = lim N →∞ E A , X w ∗ T X T X w ∗ / N , m ∗ = lim N →∞ E A , X y T X w ∗ / N . [37] Let A train ∈ R F × N be the selection of ro ws from A corresponding to i -th row for all i ∈ V train and A test ∈ R ( N − F ) × N be the selection of rows corresponding to i -th row for all i ∈ V test . The neural netw ork output for the test no des reads h test = A test σ ∗ , where σ ∗ = X w ∗ . Since we work with a non-symmetric Gaussian random matrix A ∼ A gn as our graph matrix, A test is indep endent of A train and σ ∗ (Note σ ∗ = X w ∗ depends on A train ). Therefore, for any fixed A train and X but random A test , the netw ork outputs for test nodes are jointly Gaussian, A test σ ∗ ∼ N λ y ⊺ σ ∗ N y , ( σ ∗ ) ⊺ σ ∗ I N . Combining this with the results from Eq. ( 37 ), w e obtain the test accuracy as ACC = P ( x > 0) , where x ∼ N ( λm ∗ , p ∗ ) > 0 . [38] B. Computation of C ( · ) . Recall that in Eq. ( 25 ) w e define G ( A ) := 1 nN ln E A ∼A c ( A ) . [39] In this section, we begin b y computing G ( A gn ) = C ( m, p, q ) in Eq. ( 30 ) where A gn denotes the distribution of non-symmetric Gaussian spiked matrices Eq. ( 15 ). W e then show that the symmetry do es not influence the v alue of Eq. ( 39 ), i.e., G ( A gn ) /β = G ( A gs ) /β when N , d, β → ∞ and d/ N , n → 0 . Finally , we show that the Gaussian substitution for the binary adjacency matrix do es not influence the corresponding free energy density , which ultimately leads to the same risks and accuracies under differen t adjacency matrices (Conjecture 1 ). Let’s first concatenate { σ a } n a =1 as ˜ σ = ( σ 1 ) 1 , · · · , ( σ a ) 1 , · · · , ( σ n ) 1 , ( σ 1 ) 2 , · · · , ( σ a ) 2 , · · · , ( σ n ) 2 , · · · , ( σ n ) N ⊺ . Then we can rewrite Eq. ( 39 ) in vector form G ( A ) = 1 nN ln E A exp − I β A ⊗ 1 n ˜ σ − ( I β y ) ⊗ 1 n 2 2 , [40] where ⊗ is the Kroneck er pro duct. By the cen tral limit theorem, when N → ∞ , the vectors ( A ⊗ 1 n ) ˜ σ for A ∼ A gn , A ∼ A bn , A ∼ A gs and A ∼ A bs all conv erge in distribution to Gaussian random v ectors. Letting µ ( A ) and Σ ( A ) b e the mean and the co v ariance of A ∼ A , we get G ( A ) = 1 nN ln 1 q det I nN + 2 I 2 nβ Σ ( A ) − 1 2 µ ⊺ ( A ) Σ − 1 ( A ) µ ( A ) − ( y ⊗ 1 n ) ⊺ I 2 nβ ( y ⊗ 1 n ) + 1 2 2 ( y ⊗ 1 n ) ⊺ I 2 nβ + µ ⊺ ( A ) Σ − 1 ( A ) Σ − 1 ( A ) + 2 I 2 nβ − 1 × 2 I 2 nβ y ⊗ 1 n + Σ − 1 ( A ) µ ( A ) + o (1) [41] where I nβ = I β ⊗ I n . The v anishing low er-order term o (1) comes from the tails in the cen tral limit theorem and it is th us absent when A = A gn . In this case we hav e µ ( A gn ) = λ y ⊗ m , Σ ( A gn ) = I N ⊗ Q , [42] with m and Q defined in Eq. ( 24 ). Lev eraging the replica symmetric assumption Eq. ( 29 ), we compute the determinant term in Eq. ( 41 ) as 1 nN det I nN + 2 I 2 nβ Σ ( A gn ) = τ ln (2 β (1 − t 0 ) q + 1) + τ 2 β (1 − t 0 ) np 2 β (1 − t 0 ) q + 1 + (1 − τ ) ln (2 ( − β t 1 ) q + 1) + (1 − τ ) 2 ( − β t 1 ) p 2 ( − β t 1 ) q + 1 = τ 2 β (1 − t 0 ) p 2 β (1 − t 0 ) q + 1 + (1 − τ ) 2 ( − β t 1 ) p 2 ( − β t 1 ) q + 1 + o (1) + τ ln (2 β (1 − t 0 ) q + 1) + (1 − τ ) ln (2 ( − β t 1 ) q + 1) . [43] Shi et al. | January 24, 2024 | vol. XXX | no . XX | 15 The o (1) in the third line comes from the appro ximation 1 n ln (1 + n ) = 1 + o (1) . The last tw o terms in Eq. ( 43 ) do not increase with β and can thus b e neglected in the limit β → ∞ when computing G ( A ) /β : they give rise to β o β (1) in Eq. ( 30 ). The rest terms in Eq. ( 41 ) can b e computed as 1 2 nN µ ( A gn ) ⊺ Σ − 1 ( A gn ) µ ( A gn ) = λ 2 m 2 2 q + o (1) , 1 nN ( y ⊗ 1 n ) ⊺ I 2 nβ ( y ⊗ 1 n ) = τ β (1 − t 0 ) + (1 − τ ) ( − β t 1 ) , 1 nN × last t w o lines in Eq. ( 41 ) = τ (2 β (1 − t 0 ) q + λm ) 2 2 q (1 + 2 β (1 − t 0 ) q ) + (1 − τ ) (2 ( − β t 1 ) q + λm ) 2 2 q (1 + 2 ( − β t 1 ) q ) + o (1) . Collecting everything we get G ( A gn ) in Eq. ( 30 ). Note that G ( A gn ) /β = O (1) , and we are going to show that G ( A gn ) /β − G ( A gs ) /β = o (1) . F or A gs , A bn and A bs , we find the means and co v ariances of ( A ⊗ 1 n ) ˜ σ as µ ( A gs ) = µ ( A gn ) , Σ ( A gs ) = Σ ( A gn ) + 1 N ˜ σ ⊺ ˜ σ , µ ( A bn ) = µ ( A gn ) + √ d 1 N ⊗ l , Σ ( A bn ) = Σ ( A gn ) 1 + O 1 √ d + d N , µ ( A bs ) = µ ( A gn ) + √ d 1 N ⊗ l , Σ ( A bs ) = Σ ( A gn ) 1 + O 1 √ d + d N + 1 + O 1 √ d + d N N ˜ σ ⊺ ˜ σ , [44] where l ∈ R n with entries l a = 1 ⊺ N σ a N are order parameters analogous to m in Eq. ( 24 ). Substituting Eq. ( 44 ) into Eq. ( 41 ), we see that the perturbation 1 N ˜ σ ⊺ ˜ σ in Σ ( A gs ) leads to a O ( 1 N ) perturbation in G ( A gs ) , while the p erturbation of O 1 √ d + d N in Σ( A bn ) and Σ( A bs ) leads to a O ( 1 √ d + d N ) perturbation in G ( A ) . In µ ( A bn ) and µ ( A gn ) , there is a bias l . By the replica symmetric assumption Eq. ( 29 ), we hav e l = l 1 n . It is easy to sho w that a critical p oint in the saddle point equation with l and ˆ l exists only when l = 0 for β → ∞ . Therefore, the term √ d 1 N ⊗ l will not influence the value of free energy density when β → ∞ . It further implies that the elemen ts of σ ∗ = X w ∗ are symmetrically distributed around zero. This is analogous to the v anishing av erage magnetization for the Sherrington-Kirkpatric k mo del ( 72 ). T o summarize this section, as long as 1 N , 1 √ d , d N → 0 , a v eraging ov er A bs , A gn , A gs and A gn are equiv alent in Eq. ( 34 ) when β → ∞ for a one-lay er GCN with P ( A ) = A . †† C. Computation of E . W e recall Eq. ( 28 ) and denote ¯ Q = b Q + diag ( b Q ) , then E ( b m , b Q ) = 1 nN ln E X s (2 π ) nN det X ⊺ X ⊗ ¯ Q + 2 τ r β I nF × exp 1 2 y ⊺ X ⊗ c M ⊺ X ⊺ X ⊗ ¯ Q + 2 r τ β I nF − 1 X ⊺ y ⊗ c M . [45] W e can compute the determinant term and the exponential term in Eq. ( 45 ) separately when N → ∞ . Denoting b y λ f ( X ⊺ X ) the f -th largest eigenv alue of X ⊺ X , we have 1 nN ln s (2 π ) nN det X ⊺ X ⊗ b Q + 2 τ r β I nF ! = − b p 2 γ 2 b q + b p 1 − F X f 1 F 2 τ rβ / 2 b q + b p λ f + 2 τ rβ / 2 b q + b p ! + 1 2 γ log (2 π ) − 1 F n 2 γ F X f =1 log 2 b q + b p λ f + 2 τ rβ + o (1) . [46] F or the same reasons as in Eq. ( 43 ), the t wo logarithmic terms in the last line of Eq. ( 46 ) can be ignored since they do not gro w with β . W e denote b r def = 2 τ r β / 2 b q + b p . The first term in the RHS of Eq. ( 46 ) is then T ( b r , γ ) = 1 b r F X f 1 F b r λ f + b r = 1 2 b r 1 − b r + p 1 + b r 2 + 2 b r + 2 γ b r − 2 γ + γ 2 − γ + o (1) , [47] which is obtained by integrating ov er the Marc henk o–P astur distribution. †† In general it does not hold that G ( A gn ) = G ( A bn ) nor that G ( A gs ) = G ( A bs ) . The equivalence stems from the fact that σ ∗ = X w ∗ are symmetrically distr ibuted, but f or any fixed σ ∗ with l = 1 ⊺ N σ ∗ = 0 , we hav e G ( A gn ) = G ( A bn ) + l 2 O (1) and G ( A gs ) = G ( A bs ) + l 2 O (1) . 16 | Shi et al. The term inside the exp onential in Eq. ( 45 ) can b e computed as 1 2 nN y ⊺ X ⊗ b m ⊺ X ⊺ X ⊗ ¯ Q + 2 τ r β I nF − 1 X ⊺ y ⊗ b m = 1 2 nN y ⊺ X ⊗ b m ⊺ X ⊺ X ⊗ ¯ Q − p 1 n 1 n ⊺ + 2 τ rβ I nF − 1 X ⊺ y ⊗ b m + o (1) = 1 2 nN b m ⊺ ¯ Q − b p 1 n 1 n − 1 b m y ⊺ X X ⊺ X + b r I F − 1 X ⊺ y + o (1) = 1 2 b m 2 2 b q + b p 1 − T b r + γ − 1 T 2 µ b r + ( γ − 1) T µ + γ + o (1) , in which w e first perturb ¯ Q by p 1 n 1 ⊺ n in the second line and then compute y ⊺ X X ⊺ X + b r I F − 1 X ⊺ y by the W oo dbury matrix identit y . B. Self-loop computation When P ( A ) = A + c I N , we still follow the replica pip eline from Section A but with different (more complicated) C and E in Eq. ( 27 ). A. C with self-loop. W e replace A b y A + c I N in Eq. ( 25 ). Now the exp ectation over A depends not only on m and Q , but also m 0 a = 1 N y ⊺ I train σ a , m 1 a = 1 N y ⊺ I test σ a , Q 0 ab = 1 N ( σ a ) ⊺ I train σ b , Q 1 ab = 1 N ( σ a ) ⊺ I test σ b . [48] F or A ∼ A gn , since (( A + c I N ) ⊗ 1 n ) ˜ σ is a Gaussian with mean and cov ariance µ ( A gn ) = λ y ⊗ m + c ˜ σ , Σ ( A gn ) = I N ⊗ Q , we can compute Eq. ( 41 ) directly . Lev eraging the replica symmetric assumption, i.e., m 0 = m 0 1 n m 1 = m 1 1 n Q 0 = q 0 I n + p 0 1 n 1 ⊺ n Q 1 = q 1 I n + p 1 1 n 1 ⊺ n , we hav e C ( m 0 , m 1 , Q 0 , Q 1 ) = τ (2 β 0 q + λm ) 2 q (1 + 2 β 0 q ) + (1 − τ ) (2 β 1 q + λm ) 2 q (1 + 2 β 1 q ) + c 2 (1 + 2 β 0 q ) p 0 q − (1 + 4 β 0 q ) pq 0 q 2 (1 + 2 β 0 q ) 2 + c 2 (1 + 2 β 1 q ) p 1 q − (1 + 4 β 1 q ) pq 1 q 2 (1 + 2 β 1 q ) 2 + 2 c λm + 2 β 0 q q (1 + 2 β 0 q ) m 0 + λm + 2 β 1 q q (1 + 2 β 1 q ) m 1 + o (1) + o β (1) . where β 0 = β (1 − t 0 ) , β 1 = − β t 1 , q = q 0 + q 1 , m = m 0 + m 1 and p = p 0 + p 1 . B. E with self-loop. After applying the F ourier representation metho d Eq. ( 26 ) to the order parameters Eq. ( 48 ), we obtain dual v ariables b m 0 , b m 1 , b Q 0 , b Q 1 . W e then get a new Eq. ( 28 ) as E ( b m 0 , b m 1 , b Q 0 , b Q 1 ) = 1 nN ln E X Z n Y a =1 d w a exp − X a ≤ b ( b Q 0 ) ab ( w a ) ⊺ X ⊺ I train X w b − X a ( b m 0 ) a y ⊺ X I train w a − X a ≤ b ( b Q 1 ) ab ( w a ) ⊺ X ⊺ I test X w b − X a ( b m 1 ) a y ⊺ X I test w a − τ rβ X a ∥ w a ∥ 2 2 ! . Integrating ov er w a yields E = 1 nN ln E X s (2 π ) nN det X ⊺ I train X ⊗ ¯ Q 0 + X ⊺ I test X ⊗ ¯ Q 1 + 2 τ rβ I nF × exp 1 2 y ⊺ ⊗ b m 0 ⊺ I train X + y ⊺ I test X ⊗ b m 1 ⊺ × X ⊺ I train X ⊗ ¯ Q 0 + X ⊺ I test X ⊗ ¯ Q 1 + 2 τ rβ I nF − 1 X ⊺ I train y ⊗ b m 0 + X ⊺ I test y ⊗ b m 1 , [49] where ¯ Q 0 = b Q 0 + diag( b Q 0 ) and ¯ Q 1 = b Q 1 + diag( b Q 1 ) . By replica symmetry , we hav e b m 0 = b m 0 1 n b m 1 = b m 1 1 n ¯ Q 0 = b q 0 I n + b p 0 1 n 1 ⊺ n ¯ Q 1 = b q 1 I + b p 1 1 n 1 ⊺ n . [50] Similarly as in App endix C , we can compute the determinan t term and the exp onential term separately when N → ∞ . F or the sake of simplicity , we only consider r = 0 and µ = 0 in what follo ws. Denoting Y 0 = X ⊺ I train X and Y 1 = X ⊺ I test X , w e write the determinant Shi et al. | January 24, 2024 | vol. XXX | no . XX | 17 term in Eq. ( 49 ) in the n → 0 limit as lim n → 0 1 nN ln det Y 0 ⊗ ¯ Q 0 + Y 1 ⊗ ¯ Q 1 = lim n → 0 1 nN ln I F + n b p 0 Y 0 + b p 1 Y 1 b q 0 Y 0 + b q 1 Y 1 − 1 b q 0 Y 0 + b q 1 Y 1 n = 1 N T r b p 0 Y 0 + b p 1 Y 1 b q 0 Y 0 + b q 1 Y 1 − 1 . [51] The exp onential term in Eq. ( 49 ) can b e computed similarly , with noticing that Y 0 and Y 1 are rotationally inv ariant since µ = 0 , exp n 1 2 y ⊺ I train X ⊗ b m 0 ⊺ + y ⊺ I test X ⊗ b m 1 ⊺ X ⊺ I train X ⊗ ¯ Q 0 + X ⊺ I test X ⊗ ¯ Q 1 − 1 × X ⊺ I train y ⊗ b m 0 + X ⊺ I test y ⊗ b m 1 o = exp n T r n b q 0 Y 0 + b p 1 Y 1 b m 2 0 Y 0 + b m 2 1 Y 1 − 1 o , [52] Both Eq. ( 51 ) and Eq. ( 52 ) inv olv e the same quantit y , U ( a, b, c, d ) def = E X h T r a Y 0 + b Y 1 c Y 0 + d Y 1 − 1 i = a c E X T r Y 0 Y 0 + d c Y 1 − 1 + b d E X T r Y 1 c d Y 0 + Y 1 − 1 , [53] which can be computed b y random matrix free conv olution ( 78 ). The Green’s function (also called the Cauch y function in the mathematical literature) is defined via the Stieltjes transform G Y ( z ) := Z ρ Y ( λ ) z − λ d λ = 1 N T r ( z I N − Y ) − 1 , [54] which in turn yields the sp ectrum transform ρ Y ( λ ) = − 1 π lim ϵ → 0 ℑ G Y ( z ) z = λ + iϵ . The corresp onding V oiculescu S–transform reads S Y ( w ) = 1 + w w χ ( w ) where 1 χ ( w ) G Y 1 χ ( w ) − 1 = w and 1 χ ( w ) = z . W e get the m ultiplicativ e free con v olution as S Y 0 Y 1 ( w ) = S Y 0 ( w ) S Y 1 ( w ) . [55] After computing S Y 0 ( Y 1 ) − 1 and S Y 1 ( Y 0 ) − 1 , we obtain the expression for U in Eq. ( 53 ). F or example, when τ = 0 . 8 and γ = 5 , the eigenv alue distributions of Y 0 , Y 1 asymptotically follow the Marchenk o–P astur distribution as ρ Y 0 ( λ ) = √ 16 − λ 8 π √ λ 1 λ ∈{ 1 , 9 } , ρ Y 1 ( λ ) = √ 4 − λ 2 π √ λ 1 λ ∈{ 0 , 1 } . W e then get U ( a, b, c, d ) = − aF c − 2 d c + p 9 + 16 d c − 3 2 d c ( d c − 1) − bF d 5 − q 9 c d +16 c d − 2 c d + 2 . [56] Once C and E are computed, we hav e all the ingredients of the saddle p oint equation Eq. ( 34 ) with 12 v ariables, m 0 , m 1 , c m 0 , c m 1 , p 0 , p 1 , b p 0 , b p 1 , q 0 , q 1 , b q 0 and c m 1 . A critical p oint of this saddle point equation giv es the explicit formulas for the risks in Section A . C. A random matrix theory approac h As men tioned in the main pap er, if we start with the Gaussian adjacency matrices defined before Conjecture 1 we can obtain some of the results described abov e. F or simplicit y , w e outline this approach for the full observ ation case I train = I N , that is, for τ = 1 , and compute the empirical risk. The partial observ ation case follows the same strategy but in v olv es more complicated calculations. W e let α def = 1 γ = F N , and rescale v ariables as √ µγ → µ , √ F u → u . F ollo wing Conjecture 1 , w e replace the binary symmetric adjacency matrix A bs by the Gaussian random matrix with a rank-one spike so that A = Ξ gn + λ N y y ⊺ , X = Ξ x + µ N y u ⊺ . The ridge loss reads L ( w ) = 1 N ∥ y − AX w ∥ 2 2 + r N ∥ w ∥ 2 , and has the unique minimum w ∗ = arg min w L ( w ) = ( r I F + X ⊺ A ⊺ AX ) − 1 X ⊺ A ⊺ = ( r I F + Φ ⊺ Φ ) − 1 Φ ⊺ y , 18 | Shi et al. with Φ = AX . W e need to compute the empirical risk, R train = 1 N ∥ y − AX w ∗ ∥ 2 2 = r 2 N T r y y ⊺ Q 2 = − r 2 N ∂ ∂ r T r ( yy ⊺ Q ) , as well as the empirical loss L ( w ∗ ) = r y ⊺ Qy / N, [57] where we set Q def = ( r I N + ΦΦ ⊺ ) − 1 . W e first define four thin matrices, U = 1 √ N Ξ gn y + λ √ N y λ √ N y ∈ R N × 2 V = µ √ N u 1 √ N ( Ξ x ) ⊺ y ∈ R F × 2 , L = O V + U V ⊺ V U ∈ R N × 4 , M = U O V ∈ R F × 4 . [58] where O = Ξ gn Ξ x . Then Φ = U V ⊺ + O ΦΦ ⊺ = LM ⊺ + O O ⊺ [59] Using W o o dbury matrix identit y , and denoting R = ( r I N + O O ⊺ ) − 1 , we ha v e Q = ( r I N + O O ⊺ + LM ⊺ ) − 1 = ( r I N + O O ⊺ ) − 1 − ( r I N + O O ⊺ ) − 1 L I 4 + M ⊺ ( r I N + O O ⊺ ) − 1 L − 1 M ⊺ ( r I N + O O ⊺ ) − 1 = R − R L ( I N + M ⊺ RL ) − 1 M ⊺ R . Now Eq. ( 57 ) can be computed as 1 N y ⊺ Qy = 1 N y ⊺ Ry | {z } R 1 × 1 − 1 √ N y ⊺ RL | {z } R 1 × 4 ( I 4 + M ⊺ RL ) − 1 | {z } R 4 × 4 1 √ N M ⊺ Ry | {z } R 4 × 1 . [60] The curly braces indicate 25 random v ariables whic h all concen trate around their means (they are self-a v eraging in statistical physics terminology). Their expectations can b e computed as follows: • 1 N y ⊺ Ry : The first term of the RHS of 60 is a special case discussed in Section 3.2.1 ( 76 ) and also has b een discussed in ( 79 ). Recalling R = ( r I N + O O ⊺ ) − 1 , we first compute the Green function 54 of O O ⊺ as G OO ⊺ ( z ) = 1 z P 1 z where P ( t ) is the solution of P = 1 + (1 + ( P − 1) /α ) (1 + ( P − 1)) t 1 − (1 + ( P − 1) /α ) (1 + ( P − 1)) P t . [61] Since R is rotationally inv ariant, we hav e E 1 N y ⊺ Ry = E 1 N T r( y y ⊺ R ) = E 1 N T r( R ) = q , where q is the real solution of q r = 1 − (1 + ( q r − 1) /α ) q 1 + (1 + ( q r − 1) /α ) q . It is easy to chec k that when r → 0 , we hav e q → 1 − α r for α ≤ 1 . • 1 √ N y ⊺ RL and 1 √ N M ⊺ Ry : w e use Eq. ( 58 ) and recall the definition of R again we get E 1 √ N y ⊺ RL = αµ 2 λ λ λ λ × q , as well as E 1 √ N M ⊺ Ry = E 1 √ N h U ⊺ V ⊺ O ⊺ i Ry = λ λ 0 0 q . Shi et al. | January 24, 2024 | vol. XXX | no . XX | 19 • ( I 4 + M ⊺ RL ) − 1 : we find the entries of M ⊺ RL are self-av eraging, and w e again use Eq. ( 58 ) to a v erage M ⊺ RL , E M ⊺ RL = αµ 2 a + αλ 2 µ 2 q b + λ 2 q a + λ 2 q λ 2 q αλ 2 µ 2 q λ 2 q λ 2 q λ 2 q µ 2 c 0 0 0 αµ 2 b d b 0 , where a ( α, r ) = E 1 N y ⊺ ( Ξ gn ) ⊺ R Ξ gn y b ( α, r ) = E 1 N y ⊺ Ξ x O ⊺ R Ξ gn y c ( α, r ) = E 1 N u ⊺ O ⊺ RO u d ( α, r ) = E 1 N y ⊺ R Ξ x O ⊺ RO Ξ x ⊺ y q ( α, r ) = E 1 N y ⊺ Ry . [62] Now we hav e all the ingredients in the RHS of Eq. ( 60 )/Eq. ( 57 ). Putting them together gives L ( w ∗ ) = r N y ⊺ RL − y ⊺ RL ( I 4 + M ⊺ RL ) − 1 M ⊺ Ry N →∞ − − − − → r q − q 2 λ 2 ( aαµ 2 + cµ 2 ( − ( a +( b − 1) 2 )) + d ( aµ 2 ( c − α ) − 1 ) + αµ 2 + αb 2 µ 2 − 2 αbµ 2 +1 ) λ 2 q ( aαµ 2 + cµ 2 ( − ( a +( b − 1) 2 )) + d ( aµ 2 ( c − α ) − 1 ) + αµ 2 + αb 2 µ 2 − 2 αbµ 2 +1 ) + aµ 2 ( α − c )+1 . [63] The full expressions for quan tities in Eq. ( 62 ) are complicated. W e thus analytically study the ridgeless limit r → 0 in whic h the following hold: a → (1 − α ) 2 r , b → α − α 2 (1 − α ) 2 r, c → α − α 2 (1 − α ) 2 r, d → 1 − α 1 − α r, q → 1 − α r + α 2 (1 − α ) 2 . Substituting into Eq. ( 63 ) yields L ( w ∗ ) → (1 − α ) α 2 µ 2 + 1 α 2 ( λ 2 + 1) µ 2 + αλ 2 + 1 . Finally , reverse the rescaling of α → 1 γ , µ 2 → µγ , w e get the same expressions for R train as in Eq. ( 18 ) for τ = 1 . 1 0 1 2 3 0.0 0.2 0.4 0.6 0.8 L ( w * ) P ( A ) = A , = 1 . 2 5 P ( A ) = A , = 5 P ( A ) = A 2 , = 1 . 2 5 P ( A ) = A 2 , = 5 Fig. 10. Theoretical results (solid line) vs. experimental results (solid circles) for v arying homophily of graphs ( λ ). We compare the one-hop case ( P ( A ) = A ) and two-hops case ( P ( A ) = A 2 ) for non-symmetric CSBM with µ = 0 , τ = 1 , N = 2000 and d = 30 . We use non-symmetric binary adjacency matrix A bn . Each experimental data point is av eraged ov er 10 independent tr ials and the standard deviation is indicated b y vertical lines. If we assume Conjecture 1 and b egin with Gaussian adjacency matrices, this approach can b e easily extended to multi-hop by defining O = P (Ξ gn )Ξ x and computing corresp onding L , M , R . W e can then obtain a closed-form expression via Eq. ( 63 ) after a longer 20 | Shi et al. computation. F or example, when P ( A ) = A 2 (tw o hops), τ = 1 , µ = 0 , r → 0 , we get the training loss as L ( w ∗ ) → (1 − α ) αλ 2 + 1 α ( λ 2 + 2) λ 2 + 1 . The accurate matching b etw een the n umerical and theoretical results in Figure 10 also supports Conjecture 1 . D . A signal pr ocessing interpretation of self-loops W e now show a simple interpretation of negativ e self-lo ops based on a graph signal pro cessing in tuition ( 80 , 81 ). In homophilic graphs the lab els c hange slowly on the graph: they are a low-pass signal ( 12 , 81 ) with most of their energy concentrated on the eigenv ectors of the graph Laplacian which correspond to small eigen v alues or small “frequencies” . Equiv alen tly , they correspond to large eigen v alues of the adjacency matrix since L = diag ( A 1 ) − A . ‡‡ On heterophilic graphs the labels usually change across an edge, which corresp onds to a high-frequency signal concentrated on the small-eigenv alue eigen v ectors of the adjacency matrix. A graph F ourier transform can be defined via the Laplacian but also via the adjacency matrix ( 81 ). The matrix product Ax = h is a delay-lik e filter, diagonal in the graph F ourier domain with basis functions whic h are the eigenv ectors u 1 , . . . , u N of A . W e hav e ( c Ax ) i = ⟨ x , u i ⟩ = λ i b x i = λ i ⟨ x , u i ⟩ , where λ i is the i -th smallest eigenv alue of A . Figure 11 illustrates the sp ectra of homophilic and heterophilic lab els and graphs. A homophilic graph §§ has a lo w-pass spectrum while a heterophilic graph has a high-pass sp ectrum. A self-lo op shifts the spectrum of A so that it becomes either a lo wpass filter for p ositive c or a highpass filter for negative c . As a result, the corresp onding GCNs b etter suppress noise and enhance signal for the corresponding graph t yp es. In particular, assuming that the lab el-related signal in x lives b etw een eigenv alues λ a and λ b (say , negative, so w e are in a heterophilic situation), we can quan tify the distortion induced b y the filter A + c I as ( λ a + c ) / ( λ b + c ) whic h is close to 1 for large | c | . E. Double descent in v arious GNNs In Figure 12 we exp eriment with node classification on the citeeer dataset and some p opular GNN architectures: the graph attention netw ork ( 41 ), GraphSA GE ( 9 ), and Chebyshev graph net w ork ( 7 ). The architectures of these GNNs incorporate v arious strategies to mitigate o v erfitting. As a result there is no clear double descen t in the test accuracy curv es, but we still observ e non-monotonicity in the test risk. F . Experimental Details In this section w e provide more details for the exp eriments in the main text. In the real-world data experiments, all GCNs in Figure 1 are trained by the ADAM optimizer with learning rate 10 − 2 and w eigh t decay 10 − 5 . W e run AD AM for 10 4 iterations and select the mo del with minimal training loss. In eac h trial, the training and test no des are selected uniformly randomly . W e sample training no des separately for each label to av oid the pathology where a lab el has few or zero samples , which can happ en at extremely lo w training ratios. W e a v erage 10 differen t trials for each p oint; the error bars show their standard deviation. The standard deviation in the figures is mainly due to the train-test splits in the different trials; The fluctuations due to random initialization and stochastic optimization training are comparativ ely small. W e do not normalize features and repro cess the data. All results in this paper are fully reproducible; code a v ailable at https://github.com/DaDaCheng/SMGCN . Datasets Cora Citeseer Squirrel Chameleon T e xas Features ( F ) 1433 3703 2089 2325 1703 Nodes ( N ) 2708 3327 5201 2277 183 Edges 5278 4552 198353 31371 279 Inv erse relative model comple xity ( γ = N/F ) 1.89 0.90 2.49 0.98 0.11 H ( G ) 0.825 0.718 0.217 0.247 0.057 T able 2. Benchmark dataset properties and statistics. H ( G ) is the level of homophil y defined in ( 11 ). F or the CSBM experiments in Fig. 3 , 5 and 6 , w e calculate w ∗ by Eq. ( 11 ) and then compute Eq. ( 5 ) and Eq. ( 5 ). In Fig. 3 and 5 , we use symmetric binary adjacency matrix set A bs ; In Fig. 6 we use non-symmetric binary adjacency matrix A bn as defined in Conjecture 1 . The theoretical results in Fig. 3 , 4 , 5 and 6 are obtained b y computing the extreme v alues in 36 . ‡‡ If node degrees are all the same the eigenv ectors of the adjacency matrix and the Laplacian coincide. §§ More precisely , a homophilic graph–label pair . Shi et al. | January 24, 2024 | vol. XXX | no . XX | 21 Homophilic T ar get spec trum Het er ophilic T ar get spec trum T ar get spec trum R andom Fig. 11. A spectral perspective understanding of self-loops in GCNs. The first (blue) column shows a projection of the true signal into the graph spectral domain. The f ollowing three columns illustrate the process of graph signal filtering Ax = h in the graph spectrum domain. The second column shows the eigenvalues f or A and A − I . The third column shows the signal x in the spectral domain, and the forth column show the corresponding filtered signal in the spectral domain. The signal x = y + ξ is noisy , and it in general becomes closer to the target signal y after been filtered. In the homophilic case, the signal been filtered by Ax is closer to the true signal compared to ( A + I ) x ; while in the heterophilic case, ( A − I ) x is better than Ax . In all the figures, the spectr al basis are arranged in the order of increasing frequency . 22 | Shi et al. (A) (B) (C) (D) Fig. 12. T est error and classification accuracy at diff erent training r atios f or Chebyshe v GNN (ChebNet), Gr aph Attention Network (GA T), the Graph Sample and Aggregate Network (SAGE), T opology Adaptive Graph Conv olutional Networks (T A GCN), on the Citeeer dataset. All models have two la y ers with ReLU activations , and are trained b y AD AM with the cross-entropy loss . Shi et al. | January 24, 2024 | vol. XXX | no . XX | 23
Original Paper
Loading high-quality paper...
Comments & Academic Discussion
Loading comments...
Leave a Comment