Evolution of the Informational Complexity of Contemporary Western Music
We measure the complexity of songs in the Million Song Dataset (MSD) in terms of pitch, timbre, loudness, and rhythm to investigate their evolution from 1960 to 2010. By comparing the Billboard Hot 100 with random samples, we find that the complexity…
Authors: Thomas Parmer, Yong-Yeol Ahn
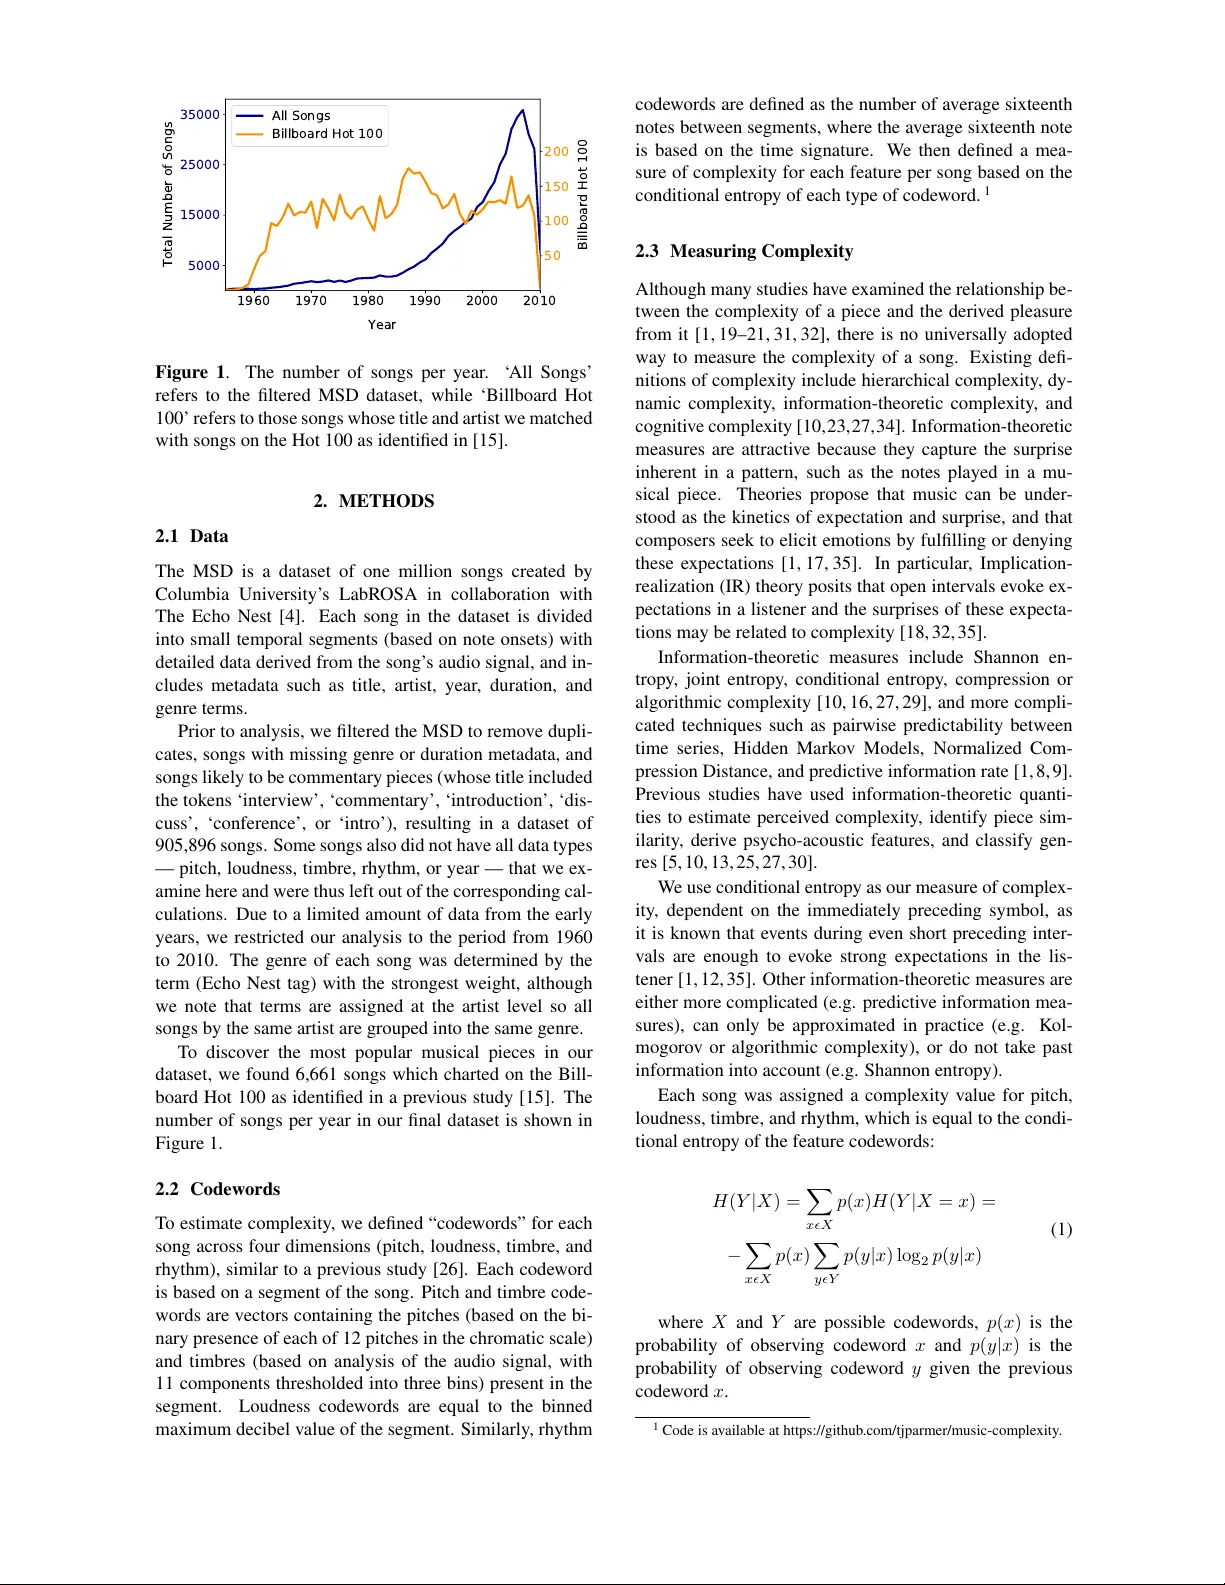
EV OLUTION OF THE INFORMA TION AL COMPLEXITY OF CONTEMPORAR Y WESTERN MUSIC Thomas Parmer , Y ong-Y eol Ahn School of Informatics, Computing, and Engineering Indiana Uni versity , Bloomington, IN, USA tjparmer@indiana.edu, yyahn@iu.edu ABSTRA CT W e measure the complexity of songs in the Million Song Dataset (MSD) in terms of pitch, timbre, loudness, and rhythm to in vestigate their ev olution from 1960 to 2010. By comparing the Billboard Hot 100 with random samples, we find that the complexity of popular songs tends to be more narrowly distributed around the mean, supporting the idea of an in verted U-shaped relationship between comple xity and hedonistic value. W e then exam- ine the temporal e volution of complexity , reporting consis- tent changes across decades, such as a decrease in aver - age loudness complexity since the 1960s, and an increase in timbre complexity o verall but not for popular songs. W e also show , in contrast to claims that popular songs sound more alik e over time, that they are not more similar than they were 50 years ago in terms of pitch or rhythm, although similarity in timbre shows distincti ve patterns across eras and similarity in loudness has been increasing. Finally , we sho w that musical genres can be differentiated by their distinctiv e complexity profiles. 1. INTR ODUCTION Our ev eryday life is surrounded by cultural products; we wake up to a song, read a book on the subway , watch a movie with friends, or even trav el far to admire a piece of art. Despite such pervasi veness, we cannot fully ex- plain why we like a particular song ov er others or what makes something a great piece of art. Although the per- ceiv ed quality of a piece is af fected by numerous contex- tual factors, including one’ s cultural, social, and emotional background, theories suggest that preference, or ‘hedonis- tic value’, may also be af fected by innate properties of the products, such as novelty and complexity [1, 18, 28]. In particular , a popular theory suggests there is a Goldilocks principle — that just the right amount of no velty or com- plexity elicits the largest amount of pleasure, whereas pieces with too little or too much complexity are less in- teresting and enjoyable [3]. On the other hand, cultural © Thomas Parmer , Y ong-Y eol Ahn. Licensed under a Cre- ativ e Commons Attribution 4.0 International License (CC BY 4.0). At- tribution: Thomas Parmer , Y ong-Y eol Ahn. “Evolution of the Informa- tional Complexity of Contemporary W estern Music”, 20th International Society for Music Information Retrie v al Conference, Delft, The Nether- lands, 2019. products are also fashionable — what is popular no w may be completely out of fashion next month. Such seemingly contrasting observations prompt us to ask the follo wing questions: as fads come and go, is ther e still a consistent pr efer ence towards the optimal amo unt of complexity in cultural pr oducts? How has the complexity of contempo- rary cultur al pr oducts changed over time? This question may apply to any type of cultural prod- uct, b ut we focus here on the complexity of contemporary W estern songs. Although v arious studies hav e already re- ported evidence of the ‘in verted U-shaped’ relationship be- tween perceived complexity and the pleasantness of mu- sic in terms of individual-le vel preference [1, 11, 32], ev- idence of this preference at the population-lev el is un- clear [7, 22, 30], and many past studies hav e been limited by the size or e xtent of the data, in terms of genres or tem- poral range. Recently , datasets such as the Million Song Dataset (MSD) began to allow researchers to systematically ana- lyze patterns in music at a massive scale [6, 8, 26]. For example, Serra et al. used musical ‘codewords’ based on song se gments in the MSD to identify changes in pitch, timbre, and loudness over time, finding that newer songs restrict pitch transitions, homogenize timbre, and in- crease loudness (without increasing the variability in loud- ness) [26]. Mauch et al. used a corpus of 17,000 songs from the Billboard Hot 100 to analyze ho w popular music has ev olved between 1960 and 2010 in the United States; using timbral and harmonic features deri ved from songs on the Hot 100, they identified three stylistic rev olutions that occurred in 1964, 1983, and 1991 [15]. In this paper , we analyze the large-scale ev olution of complexity in contemporary music in terms of pitch, loud- ness, timbre, and rhythm, during the period from 1960 to 2010 using the Million Song Dataset (MSD) [4]. W e find that complexity does seem to constrain popularity , as e vi- denced by the most popular songs (those on the Billboard Hot 100) clustering around average v alues and exhibiting smaller variance compared to a random sample. Howe ver , complexity values do fluctuate over time, as long-term trends are seen in loudness, timbre, and rhythm complex- ity and in the similarity between songs on the Billboard Hot 100. Finally , we compare the complexity of different genres and find that genres ha ve characteristic comple xity profiles, leading us to hypothesize that comple xity may be a factor in an indi vidual’ s musical selection. 1960 1970 1980 1990 2000 2010 Year 5000 15000 25000 35000 Total Number of Songs All Songs Billboard Hot 100 50 100 150 200 Billboard Hot 100 Figur e 1 . The number of songs per year . ‘ All Songs’ refers to the filtered MSD dataset, while ‘Billboard Hot 100’ refers to those songs whose title and artist we matched with songs on the Hot 100 as identified in [15]. 2. METHODS 2.1 Data The MSD is a dataset of one mill ion songs created by Columbia Uni v ersity’ s LabR OSA in collaboration with The Echo Nest [4]. Each s on g in the dataset is di vided into small temporal se gments (based on note onsets) with detailed data deri v ed from the song’ s audio signal, and in- cludes metadata such as title, artist, year , duration, and genre terms. Prior to analysis, we filtered the MSD to remo v e dupli- cates, songs with missing genre or duration metadata , and songs lik ely to be commentary pieces (whose title included the tok ens ‘intervie w’, ‘commentary’, ‘introduction’, ‘dis- cuss’, ‘conference’, or ‘intro’), resulting in a dataset of 905,896 songs. Some songs also did not ha v e all data types — pitch, loudness, timbre, rh ythm, or year — that we e x- amine here and were thus left out of the corresponding cal- culations. Due to a limited amount of data from the early years, we restricted our analysis to the period from 1960 to 2010. The genre of each song w as determined by the term (Ec ho Nest tag) with the strongest weight, although we note that terms are assigned at the artist le v el so all songs by the same artist are grouped into the same genre. T o disco v er the most popular musical pieces in our dataset, we found 6,661 songs which charted on the Bill- board Hot 100 as identified in a pre vious study [15]. The number of songs per year in our final dataset is sho wn in Figure 1. 2.2 Codew ords T o estimate comple xity , we defined “code w ords” for each song across four dimensions (pitch, loudness, timbre, and rh ythm), similar to a pre vious study [26]. Each code w ord is based on a se gment of the song. Pitch and timbre code- w ords are v ectors containing the pitches (based on the bi- nary presence of each of 12 pitches in the chromatic scale) and timbres (based on analysis of the audio signal, with 11 components thresholded into three bins) present in the se gment. Loudness code w ords are equal to the binned maximum decibel v alue of the se gment. Si milarly , rh ythm code w ords are defined as the number of a v erage sixteenth notes between se gments, where the a v erage sixteenth note is based on the time signature. W e then defined a mea- sure of comple xity for each feature per song based on the conditional entrop y of each type of code w ord. 1 2.3 Measuring Complexity Although man y studies ha v e e xamined the relationship be- tween the comple xity of a piece and the deri v ed pleasure from it [1, 19–21, 31, 32], there is no uni v ersally adopted w ay to measure the comple xity of a song. Existing defi- nitions of com ple xity include hierarchical comple xity , dy- namic comple xity , information-theoretic comple xity , and cogniti v e comple xity [10, 23, 27, 34]. Information-theoretic measures are attracti v e because the y capture the surprise inherent in a pattern, such as the notes played i n a mu- sical piece. Theories propose that music can be under - stood as the ki netics of e xpectation and surprise, and that composers seek to elicit emotions by fulfill ing or den ying these e xpectations [1, 17, 35]. In particular , Implication- realization (IR) theory pos its that open interv als e v ok e e x- pectations in a listener and the surprises of these e xpecta- tions may be related to comple xity [18, 32, 35]. Information-theoretic measures include Shannon en- trop y , joint entrop y , conditional entrop y , compression or algorithmic comple xity [10, 16, 27, 29], and more compli- cated techniques such as pairwise predictabil ity between time series, Hidden Mark o v Models, Normalized Com- pression Distance, and predicti v e information rate [1, 8, 9]. Pre vious studies ha v e used information-theoretic quanti- ties to estimate percei v ed comple xity , identify piece sim- ilarity , deri v e psycho-acoustic features, and classify gen- res [5, 10, 13, 25, 27, 30]. W e use conditional entrop y as our measure of comple x- ity , dependent on the immediately preceding symbol, as it is kno wn that e v ents during e v en short preceding inter - v als are enough to e v ok e strong e xpectations in the lis- tener [1, 12, 35]. Other information-theoretic measures are either more complicated (e.g. predicti v e information mea- sures), can only be approximated in practi ce (e.g. K ol- mogoro v or algorithmic comple xity), or do not tak e past information into account (e.g. Shannon entrop y). Each song w as assigned a comple xity v alue for pitch, loudness, timbre, and rh ythm, which is equal to the condi- tional entrop y of the feature code w ords: (1) H ( Y | X ) = X xX p ( x ) H ( Y | X = x ) = − X xX p ( x ) X y Y p ( y | x ) log 2 p ( y | x ) where X and Y are possible code w ords, p ( x ) is the probability of observing code w ord x and p ( y | x ) is the probability of observing code w ord y gi v en the pre vious code w ord x . 1 Code is a v ailable at https://github .com/tjparmer/music-comple xity . 3. RESUL TS 3.1 Complexity and Popularity The complexity distribution of songs is approximately bell-shaped, although timbre is ske wed to wards zero com- plexity — unlike the other features, timbre becomes easily predictable after only one previous codew ord. The distri- butions of the Hot 100 songs are similar , although the Hot 100 tends to exhibit statistically lower complexity in pitch and timbre and higher loudness complexity , compared to 95% confidence intervals of 1,000 bootstrap random sam- ples of the same size (see Fig. 2). Furthermore, we found that the v ariances of the Hot 100 complexity values are smaller than for other songs (based on 95% confidence in- tervals of 1,000 bootstrap samples from the Hot 100 com- pared to 1,000 bootstrap samples from the overall distri- bution); thus, the po pular songs tend to be located in a narrower range near the mean across pitch, loudness, and rhythm complexity . This result supports the theory for an in verted U-shaped curv e where global popularity is maxi- mized by medium complexity . 3.2 Complexity Across T ime T o examine the e volution of song complexity , we calculate the mean complexity values for each year (for all songs and the Hot 100 songs separately) in Fig. 3, which shows sev eral long-term trends. Later years mark the appearance of songs with low loudness and rhythm complexity and songs with high timbre complexity , but they were not re- flected strongly in the Hot 100 songs. The low loudness complexity may be due to the trend often called the “loud- ness war” [26], which describes the tendency to produce the entire song to be as loud as possible. Another possi- ble reason may be the emergence of low comple xity gen- res in recent years. For instance, terms associated with low loudness complexity outliers include ‘grindcore’, ‘hip hop’, and ‘black metal’, all of which are relativ ely newer genres in the dataset. Low rhythm and high timbre com- plexity may be due to pop or electronic music that contain modern production techniques with many different synthe- sized textures and strong dance beats. T erms associated with lo w rhythm outliers include ‘tech house’, ‘techno’, and ‘hard trance’, while terms associated with high tim- bre complexity outliers include ‘tech house’, ‘techno’, and ‘deep house’. Previous research has indicated that the ev olution of W estern popular music experienced significant changes during three musical ‘re volutions’ in 1964, 1983, and 1991 [15]. The first was associated with rock and soul music, the second with disco, new wa ve, and hard rock, and the third with the emerging popularity of rap music ov er rock music. These three rev olutions split our period of analy- sis into three ‘epochs’: 1964-1983, 1983-1991, and 1991- 2010. W ith this reference frame, we e xamine our measures of complexity . If we consider the entire dataset, each aspect of com- plexity shows a dif ferent pattern. The pitch complexity has been more or less stable across the whole period; the loud- ness complexity has been decreasing ov erall, although the period from 1983 to 1991 sho ws a slight increase; the tim- bre complexity has been steadily increasing and reached a plateau after the 1990s; finally , the rh ythm comple xity was decreasing through the period from 1964 to 1983, and then stabilized. Meanwhile, we find that the temporal evolution of the Hot 100 songs does not follow the overall pattern. The largest difference can be observ ed in the timbre complex- ity . While the timbre complexity of the entire dataset has been steadily increasing, it has been almost completely flat for the most popular songs, di verging from the overall trend. This may indicate that the emergence of new gen- res with high timbre complexity primarily happened for more niche musical tastes. Pitch and loudness complexity , by contrast, have been higher for popular songs in recent years, while rh ythm comple xity was lower until the 2000s. 3.3 Popular Song Similarity The analysis of complexity over time suggests that modern day popular songs (at least from the 2000s) are more likely to have higher pitch, loudness, and rhythm complexity (and lower timbre complexity) than their less popular contem- poraries. Howev er, while this suggests that popular songs are not simpler than the a verage song, it does not necessar - ily indicate whether the y sound more or less similar to their popular contemporaries (that is, other Hot 100 songs that are released in the same year). A recent report suggests that popular songs are sounding more and more similar to other songs on the charts [33]. In contrast, other research finds that songs that perform well on the charts do not sound too similar to their contemporaries b ut often hav e an opti- mal le vel of differentiation [2]. T o analyze whether pop- ular songs become more similar to their contemporaries ov er time, we measure the Kullback-Leibler (KL) diver - gence [14] from each song in the Hot 100 to other popular songs that were released in the same year . KL diver gence captures the unexpectedness of a song’ s codewords gi ven the code words present in other popular songs and thus in- dicates the spread of codew ord usage per year . In Fig. 4, we sho w the KL di ver gence per year for each feature, with each epoch marked. Larger KL diver gence in the figure suggests that the songs in that year are more different from their contemporaries as compared to other years. Our measurement shows that the 1964-1983 and 1991-2010 period are similar to each other while 1983- 1991 shows a rev ersing trend. Across features, the KL div ergence was either decreasing (songs are more similar to each other) or stable during 1964-1983 and 1991-2010, while 1983-1991 marked either a positiv e trend re versal or a slow-do wn of the decreasing trend. These changing trends suggest that musical revolutions are not born equal; some may have spurred di versity among popular songs while some may hav e homogenized the field. Despite these fluctuations, the div ergence trend is roughly stable over time for pitch and rhythm, while tim- bre rebounds after similarity decreases; thus, our findings are consistent with research that songs that perform well 1 2 3 4 5 Complexity (bits) 0.00 0.03 0.06 0.09 0.12 Proportion of Songs Pitch 1 2 3 4 5 Complexity (bits) 0.00 0.03 0.06 0.09 0.12 Loudness 0.1 0.4 0.7 1.0 1.3 Complexity (bits) 0.00 0.03 0.06 0.09 0.12 Timbre Random Sample Hot 100 1 2 3 4 5 Complexity (bits) 0.00 0.03 0.06 0.09 0.12 Rhythm 0.1 0.2 0.3 Variance electronica heavy metal jazz hip hop pop all songs Hot 100 0.1 0.2 0.3 Variance electronica heavy metal jazz hip hop pop all songs Hot 100 0.0 0.1 0.2 Variance electronica heavy metal jazz hip hop pop all songs Hot 100 0.1 0.2 0.3 0.4 Variance electronica heavy metal jazz hip hop pop all songs Hot 100 Figur e 2 . Feature comple xities and v ariances. Com ple xity distrib utions are sho wn (in bins of 0.1 bits, e xcept for timbre which is in bins of 0.02 bits). The v ariance plots include 95% confidence interv al s in black (although confidence interv als are smaller than the symbol and not visible), based on 1000 bootstrap samples of 1000 songs from the respecti v e genre. on the charts do not sound too similar to their contempo- raries b ut rather maintain a de gree of uniqueness which is statistically consistent o v er time. 3.4 Complexity Acr oss Genr es Let us turn our attention to musical genres and their com- ple xity . As some genres may be characterized by comple x harmonic structures or simple, repeated patterns, we e x- pect to see dif ferences across dif ferent genres in terms of comple xity . F or e xample, jazz is often considered to ha v e comple x patterns whereas dance music may be assumed to use simpler rh ythmic patterns. Our measurement concurs with such speculation, b ut finds that dif ferent subsets of genres may be relati v ely comple x across one or tw o fea- tures b ut not others. F or instance, electronic and dance styles tend to ha v e high pitch comple xity v alues, whereas jazz and blues ha v e high loudness comple xity v alues. The highest timbre comple xity v alues belong to electronic gen- res, although metal also scores highly , b ut electr o ni c gen- res ha v e reduced rh ythmic comple xity which is instead maximal in jazz, progressi v e and v ocal genres. W e found that a v ariety of common genres were sig- nificantly dif ferent from a random sample dra wn from the o v erall distrib ution in terms of each feature comple xity (based on a tw o-sample K olmogoro v-Smirnof f nonpara- metric test as well as 95% confidence interv als of the means of each feature), with the e xception that pop w as not rh ythmically distinct. Thus each genre seems to ha v e dis- tincti v e comple xity features that describe its songs: jazz is relati v ely comple x (e xcept in terms of timbre), hip hop has higher than a v erage pitch and loudness comple xity , hea vy metal has high rh ythm comple xity b ut lo w pitch and loud- ness comple xity , and electronica has high timbre comple x- ity b ut lo w rh ythm comple xity (Fig. 6). This pattern may be indicati v e of some trade-of fs that listeners mak e. If the y prefer timbre at the e xpense of rh ythmic comple xity , the y may prefer electronic genres. If the y prefer pitch and loudness comple xity , the y may prefer hip hop or jazz. If the y care about timbre and rh ythm o v er pitch and loudness, the y may prefer hea vy metal. There is a positi v e correlation between pi tch and loudness comple x- ity (Pearson’ s r=0.77) across all songs, suggesting that gen- res tend to ha v e high pitch and loudness comple xity (e.g. hip hop, jazz) or lo w pit ch and loudness comple xity (e.g. hea vy metal). There is also a ne g ati v e correlation seen be- tween timbre and rh ythm comple xity (Pearson’ s r=-0.55), suggesting that rh ythmic comple xity decreases with higher timbre comple xity (although this is not true for metal gen- res). Interestingly , the Hot 100 is similar to the pop genre in feature means and v ariances (although statistic ally dif fer - ent). Both pop music (whose songs are gi v en no genre- specific term with higher weight than ‘pop’) and the Hot 100 (whose songs are primarily classified as genres other than ‘pop’) ha v e near a v erage v alues of pitch, loudness, and rh ythm comple xity , and lo wer than a v erage v alues of timbre comple xity , while also ha ving smaller v ariance than the other selected genres (refer to Figures 2 and 6). This may suggest that listeners e xpect the same from listening to the Hot 100 as the y do when listening to music labeled as ‘pop’: mildly surprising songs that do not v ary too much in comple xity and which are sonically predictable. One may also e xpect similar genres to share similar comple xity scores. W e used agglomerati v e clustering on genres represented with o v er 5000 songs in the dataset (a total of 41 genres), using Euclidean distance between the genre mean com ple xity scores of each feature, and then used the silhouette coef ficient [24, 28] to find nine opti- mal communities. The result matches intuiti v e e xpecta- tions, such that rock genres are grouped together as are electronic genres; interestingly jazz is grouped with hip hop and rap, due to these genres ha ving similar comple xity scores. These results suggest that a genre may be defined, to some de gree, by its pitch, loudness, timbre, and rh yth- mic comple xity . 2.0 2.2 2.4 Pitch 2.9 3.1 3.3 Loudness 0.1 0.2 0.3 Timbre 1960 1970 1980 1990 2000 2010 1964 1983 1991 Year 2.6 2.8 3.0 Complexity (bits) Rhythm All Songs Hot 100 All Songs best fit Hot 100 best fit Complexity over time across features Figur e 3 . A v erage comple xity o v er time across features. Linear trend lines (obtained using OLS linear re gression) are sho wn for each epoch, along with 95% confidence interv als of the mean. Light blue lines indicate the musical re v olutions found in [15]. 1.9 2.1 2.3 Pitch 0.5 0.8 1.1 Loudness 6.8 7.3 7.8 Timbre 1960 1970 1980 1990 2000 2010 1964 1983 1991 Year 0.4 0.5 0.6 Divergence from Yearly Hot 100 Rhythm Yearly KL divergence across features Figur e 4 . Y early KL di v er gence of Hot 100 songs across features. Comple xity v ariance, as measured by KL di v er gence between a song’ s code w ords and code w ords from other songs released in that year , sho ws changing trends at the time of certain musical ‘re v olutions ’ in 1964, 1983, and 1991 (indicated by light blue lines). Linear trend lines (obtained using OLS linear re gression) are sho wn for each epoch, along with 95% confidence interv als of the mean. tech house deep house progressive house hard trance electro future jazz trip hop chill-out europop dance pop disco pop rap hip hop smooth jazz gangster rap jazz funk roots reggae dancehall garage rock heavy metal alternative metal easy listening country rock soft rock blues-rock folk rock chanson ballad ccm experimental rock indie rock power pop art rock british pop post-grunge rock alternative rock pop rock new wave vocal jazz hard bop 0.0 0.1 0.2 0.3 0.4 0.5 0.6 0.7 Distance Figur e 5 . Dendrogram of top genres. Clustering is based on the Euclidean distance between comple xity features. Colors indicate dif ferent communities. Pitch Loudness Timbre Rhythm 0.3 0.2 0.1 0.0 0.1 0.2 0.3 Deviation from average Hot 100 pop hip hop jazz heavy metal electronica Complexity per genre Figur e 6 . Com p l e xity of select genres across features. F or each feature, the de viation of the genre comple xity mean from the mean of 100 bootstrapped samples of the same size as the genre is sho wn. Note the similarity between the Hot 100 and the pop genre. 4. DISCUSSION Understanding and characterizing the comple xity of music is an important area of study with both cultural and eco- nomic significance. Although music may seem compli- cated, songs quickly become predictable as you tak e pre- vious kno wledge into account. This suggests that condi- tional entrop y may be a useful w ay to characterize musi- cal comple xity , although our approach here assumes that the uniform distrib ution of code w ords is the state of maxi- mum uncertainty and e xpectations are made based on only one pre vious symbol, which cannot distinguish counts of repeating patterns or phrasing [1]. Our approach is thus in- trinsic to the song itself and ignores an y a priori conte xtual information. Using this measure, we find that pitch comple xity has been g e nerally stable o v er the period from 1960 to 2010, while loudness and rh ythm comple xity ha v e decreased and timbre comple xity has increased. Comple xity norms seem to constrain the most popular songs, as those on the Hot 100 are distrib uted around the o v erall feature means with small v ariance in comple xity , the e xception being timbre which is lo wer than a v erage. Indeed, the Hot 100 is simi- lar to songs labeled as ‘pop’, in that pop also has a v erage pitch, loudness, and rh ythm comple xity and lo w v ariance. This result pro vides e vidence of a global, in v erted U- shaped relationship between popularity and comple xity , where popular songs are, on a v erage, the most pleasant to the population. Listeners may e xpect popular songs to be mildly comple x, b ut not to de viate f ar from e xpected tim- bre or comple xity norms. Comple xity of the Hot 100 has in f act been consistent o v er fifty years in pitch and tim- bre, while increasing recently in rh ythm and decreasing in loudness. Similarly , popular songs continue to maintain a consistent le v el of dif ferentiation from their contempo- raries in terms of pitch, timbre, and rh ythm. Certain genres do dif fer significantly across comple x- ity features, suggesting that the y ha v e specific comple xity profiles that help define them. W e h ypothesize that certain genres may ‘mak e up’ for lack of comple xity in one area by increased comple xity in another . Perhaps f ans of elec- tronic genres prioritize comple xity in timbre b ut rh ythmi- cally simple dance beats , or metal f ans prioritize rh ythmic comple xity and high v olume at the e xpense of loudness comple xity . More research needs to be done to fully elucidate the relationship between comple xity and musical appreciation. F or e xample, future research can relate musical comple x- ity to the listening habits of people on a lar ge scale to de- termine a more fine-grained measure of song popularity . The consistenc y of popular songs o v er time suggests that, collecti v ely , people tend to w ards songs that are a certain optimal le v el of comple xity rather than being too simple or complicated. Ho we v er , it remains an open question to what de gree comple xity plays a role in people’ s cogniti v e appreciation of music. 5. REFERENCES [1] Samer Abdallah and Mark Plumble y . Information dy- namics: patterns of e xpectation and surprise in the per - ception of music. Connection Science , 21(2-3):89–117, 2009. [2] Noah Askin and Michael Mauskapf. What makes pop- ular culture popular? Product features and optimal dif- ferentiation in music. American Sociological Review , 82(5):910–944, 2017. [3] Daniel E Berlyne. Novelty , complexity , and hedo- nic v alue. P erception & Psychophysics , 8(5):279–286, 1970. [4] Thierry Bertin-Mahieux, Daniel P .W . Ellis, Brian Whitman, and Paul Lamere. The million song dataset. In Pr oceedings of the 12th International Confer ence on Music Information Retrieval (ISMIR 2011) , pages 591– 596, 2011. [5] Rudi Cilibrasi, Paul V itányi, and Ronald de W olf. Al- gorithmic clustering of music based on string compres- sion. Computer Music Journal , 28(4):49–67, 2004. [6] Sander Dieleman, Philémon Brakel, and Benjamin Schrauwen. Audio-based music classification with a pretrained con v olutional network. In Pr oceedings of the 12th International Conference on Music Informa- tion Retrieval (ISMIR 2011) , pages 669–674, 2011. [7] Tuomas Eerola and Adrian C North. Expectancy-based model of melodic complexity . In Pr oceedings of the Sixth International Conference on Music P er ception and Cognition , 2000. [8] Peter Foster , Simon Dixon, and Anssi Klapuri. Iden- tifying cov er songs using information-theoretic mea- sures of similarity . IEEE/A CM T ransactions on Audio, Speech, and Language Pr ocessing , 23(6):993–1005, 2015. [9] Peter Foster , Anssi Klapuri, and Simon Dixon. A method for identifying repetition structure in musical audio based on time series prediction. In 2012 Pr o- ceedings of the 20th Eur opean Signal Pr ocessing Con- fer ence (EUSIPCO) , pages 1299–1303. IEEE, 2012. [10] Barbra Gregory . Entropy and complexity in music: some examples . PhD thesis, University of North Car- olina at Chapel Hill, 2005. [11] Ronald G Heyduk. Rated preference for musical com- positions as it relates to complexity and exposure frequency . P erception & Psychophysics , 17(1):84–90, 1975. [12] David Brian Huron. Sweet anticipation: Music and the psychology of e xpectation . MIT press, 2006. [13] Heather D Jennings, Plamen Ch Ivano v , Allan de M Martins, PC da Silv a, and GM V iswanathan. V ariance fluctuations in nonstationary time series: a comparativ e study of music genres. Physica A: Statistical Mec han- ics and its Applications , 336(3-4):585–594, 2004. [14] Solomon K ullback and Richard A Leibler . On informa- tion and sufficienc y . The annals of mathematical statis- tics , 22(1):79–86, 1951. [15] Matthias Mauch, Robert M MacCallum, Mark Levy , and Armand M Leroi. The ev olution of popular mu- sic: USA 1960–2010. Royal Society open science , 2(5):150081, 2015. [16] David Meredith. Music analysis and kolmogorov complexity . In Pr oceedings of the 19th Colloquio d’Informatica Musicale (XIX CIM) , 2012. [17] Leonard B Meyer . Music, the Arts and Ideas: P atterns and Pr edictions in T wentieth-century Cultur e . Univ er- sity of Chicago Press, 1967. [18] Eugene Narmour . The analysis and cognition of basic melodic structur es: The implication-r ealization model. Univ ersity of Chicago Press, 1990. [19] Adrian C North and David J Hargrea ves. Experimental aesthetics and e veryday music listening. In The social psychology of music , pages 84–103. Oxford Univ ersity Press, Oxford, 1997. [20] Adrian C North and David J Hargreav es. Liking, arousal potential, and the emotions expressed by mu- sic. Scandinavian journal of psychology , 38(1):45–53, 1997. [21] Mark G Orr and Stellan Ohlsson. Relationship between complexity and liking as a function of expertise. Music P erception: An Interdisciplinary Journal , 22(4):583– 611, 2005. [22] Robert Mitchell P arry . Musical complexity and top 40 chart performance. T echnical report, Georgia Institute of T echnology , 2004. [23] Jeffrey Pressing. Cognitiv e complexity and the struc- ture of musical patterns. In Pr oceedings of the 4th Con- fer ence of the A ustralasian Cognitive Science Society , 1999. [24] Peter J Rousseeuw . Silhouettes: a graphical aid to the interpretation and validation of cluster analysis. Jour - nal of computational and applied mathematics , 20:53– 65, 1987. [25] Eric D Scheirer , Richard B W atson, and Barry L V er- coe. On the percei ved comple xity of short musical seg- ments. In Pr oceedings of the 2000 International Con- fer ence on Music P er ception and Cognition , 2000. [26] Joan Serrà, Álvaro Corral, Marián Boguñá, Martín Haro, and Josep Ll Arcos. Measuring the e volution of contemporary western popular music. Scientific re- ports , 2:521, 2012. [27] Ilya Shmule vich and D-J Povel. Measures of temporal pattern complexity . J ournal of New Music Resear ch , 29(1):61–69, 2000. [28] Higor YD Sigaki, Matjaž Perc, and Haroldo V Ribeiro. History of art paintings through the lens of entropy and complexity . Pr oceedings of the National Academy of Sciences , 115(37):E8585–E8594, 2018. [29] S.J. Simon. A multi-dimensional entr opy model of jazz impr ovisation for music information r etrieval . PhD thesis, Univ ersity of North T exas, 2005. [30] Dean Keith Simonton. Computer content analysis of melodic structure: Classical composers and their com- positions. Psychology of Music , 22(1):31–43, 1994. [31] Loren Steck and Pa vel Machotka. Preference for mu- sical complexity: Effects of conte xt. J ournal of Ex- perimental Psycholo gy: Human P erception and P er- formance , 1(2):170, 1975. [32] Sebastian Streich et al. Music complexity: a multi- faceted description of audio content . Univ ersitat Pom- peu Fabra Barcelona, Spain, 2006. [33] Andrew Thompson and Matt Daniels. The musi- cal div ersity of pop songs, 2018. A vailable from: https://pudding.cool/2018/05/similarity/. [34] Eric Thul and Godfried T T oussaint. Rhythm complex- ity measures: A comparison of mathematical models of human perception and performance. In Proceedings of the 9th International Conference on Music Informa- tion Retrieval (ISMIR 2008) , pages 663–668, 2008. [35] Pablo H Rodriguez Zi vic, Fa vio Shifres, and Guillermo A Cecchi. Perceptual basis of ev olving western musical styles. Pr oceedings of the National Academy of Sciences , 110(24):10034–10038, 2013. SUPPLEMENT AR Y MA TERIALS Thomas Parmer , Y ong-Y eol Ahn School of Informatics, Computing, and Engineering Indiana Uni versity , Bloomington, IN, USA tjparmer@indiana.edu, yyahn@iu.edu 1. FIL TERING THE MSD The MSD contained songs with bad metadata and se gment data, duplicates, and tracks that were talking pieces rather than musical pieces (such as interviews with musicians). As such, the MSD was filtered to remove any song that met any of the follo wing criteria: • the song had no genre terms • the song had no duration • the song had duration less than three standard de via- tions below expectation for its genre (where standard deviations where calculated from a random 39100 song sample, directory ‘ A/’) • the song title contained the w ords ‘interview’, ‘com- mentary’, ‘introduction’, ‘discuss’, ‘conference’, ‘intro’ Additionally , se veral tracks in the MSD were duplicates of the same song. Man y of these are recognized in the offi- cial duplicate list of the MSD [1] while others were found by the authors by comparing song and artist names. Songs were considered duplicates if they shared the same song id or if their song name and artist name matched, subject to the following modifications: • song and artist names were made lowercase • whitespaces were removed • the following characters were remov ed: " ’ , . ? ! ( ) • any ‘&’ was replaced with ‘and’ • any instance of the w ord ‘featuring’ was replaced with ‘ft’ When considering duplicates, one track was arbitrarily chosen to keep in the filtered set and the rest were dis- carded. The resulting filtered dataset contained over 90% of the original songs. Ho we ver not all songs had pitch, loudness, or rhythm data and these songs were kept out of © Thomas Parmer , Y ong-Y eol Ahn. Licensed under a Cre- ativ e Commons Attrib ution 4.0 International License (CC BY 4.0). Attri- bution: Thomas Parmer , Y ong-Y eol Ahn. “Supplementary Materials”, 20th International Society for Music Information Retrieval Conference, Delft, The Netherlands, 2019. the respecti ve analyses. Additionally , nearly half of the songs were missing year metadata and so were ignored during overtime analyses. A list of song ids comprising our dataset is av ailable at https://github .com/tjparmer/music- complexity . 2. COMPLEXITY CORRELA TIONS In comparing between ev ery pair of features, two interest- ing correlations were noted: the positi ve correlation be- tween pitch and loudness and the negati ve correlation be- tween timbre and rhythm. Correlation by genre was cal- culated using the complexity average of all songs in each genre. Graphs are sho wn with genres labeled (refer to Fig- ure 1). 3. REFERENCES [1] Thierry Bertin-Mahieux. The 921,810 song dataset - duplicates, 2011. 1.4 1.6 1.8 2.0 2.2 2.4 2.6 Pitch Complexity 2.2 2.4 2.6 2.8 3.0 3.2 3.4 Loudness Complexity hip hop pop rock blues-rock tech house indie rock ballad heavy metal hard trance deep house new wave roots reggae vocal jazz progressive house smooth jazz alternative rock jazz funk garage rock hard bop flamenco oi speed metal hardcore punk pop punk emo doo-wop alternative dance ska punk grindcore classic rock tejano black metal cabaret trance ragtime opera lovers rock r&b comedy bolero 0.1 0.2 0.3 0.4 0.5 0.6 0.7 0.8 0.9 Timbre Complexity 2.0 2.2 2.4 2.6 2.8 3.0 3.2 Rhythm Complexity hip hop blues-rock country rock tech house disco trip hop heavy metal future jazz ccm chill-out hard trance deep house europop roots reggae post-grunge vocal jazz progressive house smooth jazz dancehall alternative metal experimental rock hard bop soul jazz progressive trance dub oi speed metal downtempo hardcore punk jungle music reggae free jazz grindcore gabba death metal instrumental rock black metal trance kraut rock dubstep motown opera doom metal ranchera breakcore power metal classical electronica reggaeton merengue club mariachi bhangra hardstyle Figur e 1 . Feature correlations across genres, where each data point represents one genre. A positi v e correlation is seen between pitch and loudness comple xity (Pearson’ s r=0.77) and a ne g ati v e correlation is seen between timbre and rh ythm comple xity (Pearson’ s r=-0.55). Only genres with more than 1000 songs are sho wn.
Original Paper
Loading high-quality paper...
Comments & Academic Discussion
Loading comments...
Leave a Comment