Sub-Architecture Ensemble Pruning in Neural Architecture Search
Neural architecture search (NAS) is gaining more and more attention in recent years due to its flexibility and remarkable capability to reduce the burden of neural network design. To achieve better performance, however, the searching process usually …
Authors: Yijun Bian, Qingquan Song, Mengnan Du
IEEE TRANSA CTIONS ON NEURAL NETWORKS AND LEARNING SYSTEMS 1 Sub-Architecture Ensemble Pruning in Neural Architecture Search Y ijun Bian, Qingquan Song, Mengnan Du, Jun Y ao, Huanhuan Chen, Senior Member , IEEE, and Xia Hu Abstract —Neural architectur e search (NAS) is gaining more and more attention in r ecent years due to its flexibility and remarkable capability to reduce the burden of neural netw ork design. T o achie ve better perf ormance, howe ver , the searching process usually costs massive computations that might not be af- fordable for researchers and practitioners. While recent attempts hav e employed ensemble lear ning methods to mitigate the enor- mous computational cost, however , they neglect a key property of ensemble methods, namely diversity , which leads to collecting more similar sub-architectures with potential redundancy in the final design. T o tackle this pr oblem, we pr opose a pruning method for NAS ensembles called “ Sub-Architecture Ensemble Pruning in Neural Architecture Search (SAEP) . ” It targets to leverage diversity and to achiev e sub-ensemble architectur es at a smaller size with comparable performance to ensemble architectures that are not pruned. Thr ee possible solutions are proposed to decide which sub-architectur es to prune during the searching process. Experimental results exhibit the effectiveness of the pr oposed method by largely reducing the number of sub-architectur es without degrading the performance. Index T erms —ensemble learning, diversity , ensemble pruning, neural architectur e search. I . I N T RO D U C T I O N D ESIGNING neural netw ork architectures usually requires manual, laborious architectural engineering, extensi ve expertise, and high costs. Neural architecture search (NAS), which aims to mitigate these challenges, is attracting increas- ing attention recently [1]–[3]. Howe ver , N AS methods usually require a huge computational effort to achie ve an architecture with the expected performance, which is too expensi ve for many infrastructures and too costly for researchers [4]. Recent work [5]–[7] proposes to employ ensemble methods to mit- igate this shortcoming by combining weak sub-architectures trained with lower computational cost into powerful neu- ral architectures. AdaNet, as a prominent example of them, contributes to present a theoretical analysis of the problem of learning both the netw ork architecture and its parameters Y . Bian and H. Chen are with the School of Computer Science and T echnology , University of Science and T echnology of China, Hefei 230027, China. E-mails: yjbian@mail.ustc.edu.cn; hchen@ustc.edu.cn Q. Song, M. Du, and X. Hu are with the Department of Computer Science and Engineering, T exas A&M University , College Station, TX, 77840, United States. E-mails: song 3134@tamu.edu; dumengnan@tamu.edu; hu@cse.tamu.edu J. Y ao is with the Data Science and Analytics Department, W eBank, Shenzhen, 518000, China. E-mail: junyao@webank.com Manuscript receiv ed December 05, 2019; revised May 17, 2020; revised February 12, 2021; accepted May 18, 2021. This research is supported in part by the National Key Research and Dev elopment Program of China under Grant No. 2016YFB1000905, the National Natural Science Foundation of China under Grant No. 91746209, and the Fundamental Research Funds for the Central Universities. Corresponding author: Huanhuan Chen. simultaneously , and proposes the first generalization bounds for the problem of structural learning of neural networks [5], [8]. Howe ver , all of them overlook a crucial principle in ensem- ble methods (i.e., model di versity) in the search for ne w sub- architectures, which is usually beneficial for creating better model ensembles [9]–[11]. Besides, lots of ensemble pruning methods exploit the div ersity property to obtain sub-ensembles with a smaller size than the original ensembles [12], [13]. It has been proved that a few diverse individual learners could ev en construct a more powerful ensemble learner than the unpruned ensembles [14], [15]. This moti vates us to in vestigate the NAS ensemble pruning problem, where dif- ferent sub-ensemble architectures are aligned to a smaller but effecti ve ensemble model. Moreov er , it is quite challenging to describe the characteristics of div ersity for different sub- architectures and decide which one of them should be pruned or kept in the ensemble architecture. First, there are plenty of definitions or measurements for diversity in the ensemble learning community [15]. Unlik e the model accurac y , ho wever , there is no well-accepted formal definition of diversity [16]. Second, div ersity among indi vidual learners usually decreases as those individual learners approach higher levels of accuracy [17]. Combining some diverse indi vidual learners with some relativ ely weak ones is usually better than combining accurate ones only since di versity is more important than pure accurac y . Third, selecting the best combination of sub-architectures from an ensemble architecture is NP-complete hard with exponen- tial computational complexity [18], [19]. Thus, how to manage the trade-of f between accuracy and div ersity properly , and how to select the best subset of ensemble architectures, is a significant problem in the NAS ensemble pruning problems. Motiv ated by the characteristic of div ersity in ensemble learning, we stri ve for di verse sub-ensemble architectures at a smaller size, meanwhile, maintaining comparable accurac y performance to the original ensemble architecture without pruning. The idea is to prune the ensemble architecture on- the-fly based on various criteria and keep more valuable sub- architectures in the searching process. Our N AS ensemble pruning method is named as “ Sub-Ar chitectur e Ensemble Pruning in Neural Ar chitectur e Searc h (SAEP) , ” motiv ated by AdaNet [5] and ensemble pruning methods, with three pro- posed criteria to decide which sub-architectures to prune. Note that SAEP also has some dif ferences from typical ensemble pruning problems, since most pruning methods are usually handled on the original ensemble that has been trained, but pruning in SAEP is done in the process of searching rather than after the searching. Moreov er , SAEP might lead to distinct IEEE TRANSA CTIONS ON NEURAL NETWORKS AND LEARNING SYSTEMS 2 deeper architectures than the original one if the degree of div ersity is insuf ficient, which could be a bonus due to pruning. Our contribution in this paper is threefold: • W e propose a N AS ensemble pruning method to search sub-ensemble architectures at a smaller size that benefits from an essential characteristic, i.e., div ersity in ensemble learning. It could achiev e comparable accuracy perfor - mance to ensemble architectures that are not pruned. • Moreover , our proposed method would lead to distinct deeper architectures than the original ensemble architec- ture that is not pruned if the div ersity is insuf ficient. • Experimental results exhibit the effecti veness of the pro- posed method in largely reducing the number of sub- architectures in ensemble architectures and increasing the div ersity while maintaining the final performance. I I . P R O BL E M S TA T E M E N T Notations : In this paper , we denote tensors with bold italic lowercase letters (e.g., x ), vectors with bold lowercase letters (e.g., x ), and scalars with italic lowercase letters (e.g., x ). W e use x T to represent the transpose of a vector . Data/hypothesis spaces are denoted by bold script uppercase letters (e.g., X ). W e use R , P , E , and I to denote the real space, the probability measure, the expectation of a random variable, and the indicator function, respectively . W e summarize the notations and their definitions in T able I. W e follo w the notations and the definition of the search space in AdaNet to formulate the problem and introduce the proposed method, as it is one of the most popular ensemble search methods in the N AS literature. It is worth mentioning that the proposed pruning criteria could also be generalized to other ensemble methods, which could be interesting for future research. Let f be a neural network with l layers searched via AdaNet [5], [8], where each layer would be connected to the previous layers. The output for each x ∈ X would connect to all intermediate units, i.e., f ( x ) = X 1 6 k 6 l w k · h k ( x ) , (1) where P l k =1 k w k k 1 = 1 and h k = [ h k, 1 , ..., h k,n k ] T . h k,j is the function of a unit in the k th layer , i.e., h k,j ( x ) = X 0 6 s 6 k − 1 u s · φ s h s ( x ) , k ∈ [ l ] , (2) where h 0 ( x ) = x is the 0 th layer denoted by the input. Note that φ s ( h s ) denotes that φ s ( h s ) = φ s ( h s, 1 ) , ..., φ s ( h s,n s ) where the φ s is assumed to be 1-Lipschitz activ ation functions, such as the ReLU 1 or sigmoid 2 function [5]. If u s = 0 for s < k − 1 and w k = 0 for k < l , this architecture of f will coincide with the standard multi-layer feed-forward ones [5]. T o in vestigate the search space F , H k is used to denote the family of the function in the k th layer . Let e H k def = H k ∪ ( −H k ) denote the union of H k and its reflection, and 1 The Rectified Linear function (ReLU function) [20]–[22] is defined as g ( z ) = max { 0 , z } . 2 The sigmoid function [23] is defined as σ ( z ) = 1 1+ e − z . T ABLE I T H E U S ED S Y M BO L S A N D D E FIN I T I ON S I N T H I S PAP E R . Notation Definition [ n ] the representation of { 1 , ..., n } for clarity x ∈ X the input of neural networks f ( · ) ∈ F the function of a neural network with l layers n s the number of units in the s th layer h k,j ( · ) the function of a unit in the k th layer ( k ∈ [ l ]) u s ∈ R n s the weight of the s th layer for the units of the k th layer h k ( · ) the function vector of units in the k th layer w k ∈ R n k the weight of the k th layer for f ( · ) k w k k p the l p -norm of w k where p > 1 T > 1 the number of iterations in the neural architecture search- ing process Γ a specific complexity constraint based on the Rademacher complexity let H def = ∪ l k =1 e H k denote the union of the families e H k . Then F coincides with the con ve x hull of H , which means that generalization bounds for ensemble methods could be utilized to analyze learning with F [5]. Therefore, Cortes et al. [5], [8] attempted to propose learning guarantees based on a Rademacher complexity analysis [24] to guide their design of algorithms. While AdaNet attempts to train multiple weak sub- architectures with lo wer computational costs to comprise powerful neural architectures inspired by ensemble methods [5], the crucial characteristic of diversity brings opportunities to achie ve sub-ensemble architectures at a smaller size with div erse sub-architectures, yet still with the comparable per - formance to an original ensemble architecture generated by AdaNet. Based on the abo ve notions, we formally define the N AS ensemble pruning problem. Problem Definition (NAS Ensemble Pruning) . Given an ensemble arc hitectur e f ( x ) = P 1 6 k 6 l w k · h k ( x ) ∈ F sear ched by ensemble NAS methods such as AdaNet, and a training set S = { ( x 1 , y 1 ) , ..., ( x m , y m ) } with the size of m , assuming that all training instances ar e drawn i.i.d. (independently and identically distributed) from a distrib ution D over X × { c 1 , ..., c n c } with n c as the number of labels, the goal is to prune the ensemble arc hitectur e f and sear ch for a sub-ensemble ar chitectur e of a smaller size, while maintaining comparable performance to the original ensemble ar chitectur e f . I I I . S U B - A R C H I T E C T U R E E N S E M B L E P R U N I N G I N N E U R A L A R C H I T E C T U R E S E A R C H ( SAEP ) In this section, we elaborate on the proposed N AS en- semble pruning method to obtain smaller yet ef fective neural ensemble architectures. Before pruning the less valuable sub- architectures, we need to generate sub-architectures first. W e take advantage of AdaNet [5] here due to its popularity and superiority in ensemble NAS research, and utilize its objectiv e function to generate candidate sub-architectures in the searching process. The objecti ve function for generating new candidates in AdaNet is defined as L g ( w ) = ˆ R S,ρ ( f ) + Γ , (3) IEEE TRANSA CTIONS ON NEURAL NETWORKS AND LEARNING SYSTEMS 3 (a) (b) Fig. 1. This figure is used to illustrate the difference between SAEP and AdaNet during the incremental construction of neural architectures. Layers in blue and green indicate the input and output layers, respecti vely . Units in yellow , cyan, and red are added at the first, second, and third iteration, respectiv ely . (a) AdaNet [5]: A line between two blocks of units indicates that these blocks are fully-connected. (b) SAEP : Only some valuable blocks are kept (those that will be pruned are denoted by black dashed lines), which is the ke y dif ference from AdaNet. The criteria used to decide which sub- architectures will be pruned hav e three proposed solutions in our SAEP , i.e., PRS , P AP , and PIE . where ˆ R S,ρ ( f ) denotes the empirical margin error of function f on the training set S , and Γ denotes a specific complexity constraint. As the learning guarantee in [5] applies to binary classifica- tion, we introduce an auxiliary function g ( x , y, f ) in Eq. (4) to extend the objecti ve to multi-class classification problems consistent with our problem statement, i.e., g ( x , y , f ) = 2 I f ( x ) = y − 1 . (4) In this case, the empirical mar gin error ˆ R S,ρ ( f ) would be ˆ R S,ρ ( f ) = 1 m X 1 6 i 6 m I g ( x i , y i , f ) 6 ρ . (5) Guided by Eq. (3), AdaNet only generates new candidates by minimizing the empirical error and architecture complex- ity , while ov erlooking the di versity and dif ferences among different sub-architectures. T o achiev e smaller yet effecti ve ensembles via taking the di versity property into account, we need first to measure the di versity of dif ferent sub-architectures so that a corresponding objective function could be deriv ed to guide us for the selection of more v aluable sub-architectures during the searching process. Specifically , we propose three different ways to enhance the div ersity of different sub-architectures. Except for the first solution, the latter two pro vide specific objecti ve quantification where diversity is inv olved as guidance among dif ferent sub- architectures for NAS. Besides, the di versity of sub-ensemble architectures generated by them could be quantified to verify whether these ways work or not. Our final NAS ensemble pruning method, named as “ Sub- Ar chitectur e Ensemble Pruning in Neural Ar chitectur e Sear ch (SAEP) , ” is shown in Algorithm 1. The key dif ference between SAEP and AdaNet is that SAEP prunes the less v aluable sub- architectures based on certain criteria during the searching process (lines 10–11 in Algorithm 1), instead of keeping all of them, as sho wn in Figure 1. At the t th iteration ( t ∈ [ T ]) in Algorithm 1, let f ( t − 1) = P 1 6 k 6 l w k · h k denote the neural network constructed before the start of the t th iteration, with the depth l ( t − 1) of f . The first target at the t th iteration is to generate new candidates (lines 3 – 4) and select the better one Algorithm 1 Sub-Architecture Ensemble Pruning in Neural Architecture Search ( SAEP ) Input: Dataset S = ( x i , y i ) m i =1 Parameter: Number of iteration T Output: Final function f ( T ) 1: Initialize f (0) = 0 , and l (0) = 1 . 2: for t = 1 to T do 3: w 0 , h 0 = argmin w , h L g ( f ( t − 1) + w · h ) s.t. h ∈ H l ( t − 1) . 4: w 00 , h 00 = argmin w , h L g ( f ( t − 1) + w · h ) s.t. h ∈ H l ( t − 1) +1 . 5: if L g ( f ( t − 1) + w 0 · h 0 ) 6 L g ( f ( t − 1) + w 00 · h 00 ) then 6: f ( t ) = f ( t − 1) + w 0 · h 0 . 7: else 8: f ( t ) = f ( t − 1) + w 00 · h 00 . 9: end if 10: Choose w p based on one certain criterion, i.e., picking randomly in PRS , L d ( w ) of Eq. (6) in P AP , or L e ( w i ) of Eq. (16) in PIE . 11: Set w p to be zero. 12: end f or to be added in the model of f ( t − 1) (lines 4 – 9) since we expect the searching process is progressiv e. The second target at the t th iteration is to prune the less valuable sub-architectures for f ( t ) and keep beneficial ones to construct the final architecture (lines 10 – 11). T o ev aluate the most v aluable sub-architectures, we propose three solutions to tackle this problem. Now we introduce them to decide which sub-architectures are less valuable to be pruned. A. Pruning by Random Selection ( PRS ) The first solution, named as “ Pruning by Random Selection (PRS) , ” is to randomly prune some of the sub-architectures in the searching process, with one difference from other solutions. In PRS , we firstly decide randomly whether or not to pick one of the sub-architectures to be pruned; if we indeed decide to prune one of them, the objectiv e to decide which sub-architectures to prune is random as well, instead of the specific objectiv e in the next two solutions. Howe ver , there is no specific objectiv e for PRS to follo w in the pruning process. That might lead to a situation where some valuable sub-architectures are pruned as well. Therefore, we need to find more explicit objectiv es to guide our pruning. B. Pruning by Accuracy P erformance ( P AP ) T o measure dif ferent sub-architectures better, we propose the second pruning solution based on their accuracy per- formance. This method is named as “ Pruning by Accuracy P erformance (P AP) . ” T o choose the valuable sub-architectures from those individual sub-architectures in the original model, this second optional objectiv e function for this target is defined as L d ( w ) = 1 m X 1 6 i 6 m [ g ( x i , y i , f ) − g ( x i , y i , f − w · h )] , (6) where h is the sub-architecture corresponding to the weight w . The target is to pick up the w and h by minimizing Eq. (6), and prune them if their loss is less than zero. The reason why IEEE TRANSA CTIONS ON NEURAL NETWORKS AND LEARNING SYSTEMS 4 we do this is that the generalization error of gathering all sub- architectures is defined as R ( f ) = E ( x ,y ) ∼D I g ( x , y , f ) 6 0 ; (7) if the j th sub-architecture is excluded from the final archi- tecture, the generalization error of the pruned sub-ensemble architecture will become R ( ¯ f j ) = E ( x ,y ) ∼D [ I ( g ( x , y , f − w j · h j ) 6 0)] . (8) Then, if we expect the pruned architecture works better than the original one, we need to make sure that R ( f ) − R ( ¯ f j ) > 0 , i.e., E ( x ,y ) ∼D g ( x , y , f ) − g ( x , y , f − w j · h j ) 6 0 . (9) Therefore, if the j th sub-architecture meeting Eq. (9) is ex- cluded from the final architecture, the performance will not be weakened and could be ev en better than the original one. The hidden meaning behind Eq. (9) is that the final architecture makes mistakes; howe ver , the pruned architecture that excludes the j th sub-architecture will work correctly . These sub-architectures that make too serious mistakes to affect the final architecture ne gatively would be e xpected to be pruned, leading to our loss function Eq. (6). In this case, we could impr ove the performance of the final ar chitectur e without br eaking the learning guarantee . Howe ver , this objectiv e in Eq. (6) only considers the accu- racy performance of different sub-architectures and misses out on the crucial characteristic of div ersity in ensemble methods. Therefore, we need to find an objective to reflect accuracy and div ersity both. C. Pruning by Information Entr opy ( PIE ) T o consider accuracy and diversity simultaneously , we propose another strategy , named “ Pruning by Information Entr opy (PIE ) . ” The objective is based on information entropy . For any sub-architecture w j in the ensemble architecture, w j = w j · [ h j ( x 1 ) , ..., h j ( x m )] T represents its classification results on the dataset S . y = [ y 1 , ..., y m ] T is the class label vector . Notice that H ( · ) and H ( · , · ) are the entropy function and the joint entropy function, respectively , i.e., H ( w i ) = − X w ∈ w i p ( w ) log p ( w ) , (10) H ( w i , y ) = − X w ∈ w i X y ∈ y p ( w, y ) log p ( w , y ) . (11) T o exhibit the rele v ance between this sub-architecture and the class label vector , the normalized mutual information [25], MI( w i , y ) = I( w i ; y ) p H( w i )H( y ) = P w ∈ w i ,y ∈ y p ( w, y ) log p ( w,y ) p ( w ) p ( y ) q P w ∈ w i p ( w ) log p ( w ) P y ∈ y p ( y ) log p ( y ) , (12) is used to imply its accurac y . Note that I( w i ; y ) =H( w i ) − H( w i | y ) = X w ∈ w i ,y ∈ y p ( w, y ) log p ( w, y ) p ( w ) p ( y ) , (13) is the mutual information [26]. T o re veal the redundancy between two sub-architectures ( w i and w j ) in the ensemble architecture, the normalized variation of information [25], VI( w i , w j ) =1 − I( w i ; w j ) H( w i , w j ) =1 − P w ∈ w i ,y ∈ y p ( w, y ) log p ( w,y ) p ( w ) p ( y ) − P w ∈ w i ,y ∈ y p ( w, y ) log p ( w , y ) , (14) is used to indicate the di versity between them. The objecti ve function for handling the trade-off between div ersity and accuracy of two sub-architectures is defined as L p ( w i , w j ) = (1 − α )VI( w i , w j ) + α MI( w i , y ) + MI( w j , y ) 2 , (15) if w i · h i 6 = w j · h j , otherwise L p ( w i , w j ) = 0 . Note that α is a regularization factor introduced to balance between these two criteria, indicating their importance as well. Our target is to pick up the w and h , and prune them by minimizing L e ( w ) in Eq. (16), i.e., L e ( w i ) = X w j · h j ∈ f \{ w i · h i } L p ( w i , w j ) . (16) This loss function considers both div ersity and accurac y con- currently according to the essential characteristics in ensemble learning. I V . E X P E R I M E N T A L S T U DY In this section, we describe the e xperiments to verify the effecti veness of the proposed SAEP method. There are four major questions that we aim to answer . (1) Could SAEP achiev e sub-ensemble architectures at a smaller size yet still with comparable accuracy performance to the original en- semble architecture? (2) Could SAEP generate sub-ensemble architectures with more diversity than the original ensemble architecture? (3) What are the impacts of the parameter α on the sub-ensemble architectures generated by PIE ? (4) Could PIE generate different sub-architectures from that in the original ensemble architecture? A. Thr ee Ima ge Classification Datasets The three image classification datasets that we employ in the experiments are all publicly a v ailable. The ImageNet [28] dataset is not included since the cost for it is not affordable for one GPU (NVIDIA GTX 1080) that we use. CIF AR-10 [29]: 60,000 32x32 color images in 10 classes are used as instances, with 6,000 images per class, representing airplanes, automobiles, birds, cats, deer , dogs, frogs, horses, ships, and trucks, respecti vely . There are 50,000 training images and 10,000 test images. MNIST [30]: 70,000 28x28 grayscale images of handwritten digits in 10 different classes are used as instances. There are 60,000 instances as a training set and 10,000 instances as a test set. The digits hav e been size-normalized and centered in a fixed-size image. Fashion-MNIST [31]: 70,000 28x28 grayscale images are used as instances, including 60,000 instances for training and 10,000 instances for testing. They are categorized into ten classes, representing T -shirts/tops, trousers, pullovers, dresses, IEEE TRANSA CTIONS ON NEURAL NETWORKS AND LEARNING SYSTEMS 5 T ABLE II E M PI R I C AL R E S ULT S O F E N SE M B LE - A R CH I T E CT U R E S ’ P E R FO R M A NC E F O R B I NA RY C L A SS I FI C A T I ON O N C I F A R - 1 0, F A S HI O N - MN I S T , A N D M N IS T DAT A S E T S . E AC H M E TH O D I N C L UD E S T H R E E C O LU M N S , I . E . , T H E test accuracy (%) , T H E size O F G E NE R A T E D ( S UB - ) E NS E M B LE A R C HI T E C TU R E S , A N D T H E time cost (min) O F T H E S E AR C H I NG P RO C E SS . T H E B E S T O F T H E M A R E I N D IC A T E D W I TH B O L D F O N TS F O R E AC H L A BE L PAI R ( RO W ) . N OT E T H A T S U B - A R C HI T E CT U R E S U S ED I N T H ES E E X PE R I M EN T S A R E M L P S . Label Pair T est Accuracy (%) AdaNet PRS PAP PIE AdaNet .W PRS.W P AP.W PIE.W digits 6-9 99.85 ± 0.07 99.83 ± 0.05 99.85 ± 0.07 99.85 ± 0.09 99.84 ± 0.05 99.88 ± 0.04 ‡ 99.84 ± 0.14 † 99.83 ± 0.07 digits 5-8 99.14 ± 0.13 99.18 ± 0.21 99.19 ± 0.18 99.21 ± 0.10 ‡ 99.16 ± 0.18 99.26 ± 0.15 99.19 ± 0.18 99.20 ± 0.15 top-pullover 97.03 ± 0.47 97.06 ± 0.15 ‡ 97.03 ± 0.39 ‡ 97.04 ± 0.34 ‡ 97.04 ± 0.30 ‡ 97.16 ± 0.18 ‡ 97.08 ± 0.21 ‡ 96.94 ± 0.17 top-coat 98.62 ± 0.14 98.57 ± 0.29 † 98.61 ± 0.07 98.64 ± 0.32 98.61 ± 0.22 † 98.61 ± 0.22 † 98.66 ± 0.23 98.67 ± 0.14 top-shirt 85.87 ± 0.77 86.36 ± 0.82 86.33 ± 0.77 ‡ 86.18 ± 0.80 86.14 ± 0.54 ‡ 86.48 ± 0.62 ‡ 86.27 ± 0.69 ‡ 86.36 ± 0.54 ‡ trouser-dress 98.35 ± 0.16 98.42 ± 0.16 98.39 ± 0.17 98.38 ± 0.28 98.30 ± 0.14 98.39 ± 0.14 ‡ 98.41 ± 0.27 98.32 ± 0.24 † sandal-ankle boot 98.74 ± 0.19 98.78 ± 0.27 98.79 ± 0.24 98.71 ± 0.11 98.78 ± 0.14 ‡ 98.71 ± 0.10 98.69 ± 0.19 98.69 ± 0.31 † deer-truck 87.91 ± 0.38 88.01 ± 0.42 87.87 ± 0.85 † 87.99 ± 0.67 87.95 ± 0.35 ‡ 88.05 ± 0.47 87.93 ± 0.40 87.91 ± 0.49 deer-horse 75.54 ± 1.45 76.22 ± 1.17 ‡ 76.22 ± 1.07 ‡ 76.62 ± 0.94 ‡ 76.10 ± 1.28 ‡ 76.31 ± 1.15 ‡ 76.22 ± 0.41 ‡ 76.25 ± 0.46 ‡ automobile-truck 72.93 ± 0.24 72.82 ± 0.57 † 72.91 ± 0.29 † 72.84 ± 0.85 † 72.58 ± 0.94 † 72.78 ± 0.50 † 72.90 ± 0.81 † 72.95 ± 1.10 cat-dog 61.15 ± 0.69 61.11 ± 0.23 61.02 ± 1.24 † 60.67 ± 1.05 † 61.63 ± 0.81 61.60 ± 0.68 ‡ 61.22 ± 0.47 ‡ 61.53 ± 1.34 dog-horse 78.21 ± 0.30 77.95 ± 1.02 † 78.29 ± 0.61 78.44 ± 0.23 ‡ 78.20 ± 0.81 † 78.41 ± 0.71 78.23 ± 0.98 78.38 ± 0.95 t -test (W/T/L) — 3/7/2 3/6/3 2/6/4 3/4/5 2/4/6 2/6/4 2/8/2 A verage Rank 5.71 4.75 4.71 3.92 5.58 2.67 4.25 4.42 1 The reported results are the av erage v alues of each method and the corresponding standard deviation under 5-fold cross-validation on each dataset. 2 By two-tailed paired t -test at 5% significance level, ‡ and † denote that the performance of AdaNet is inferior to and superior to that of the comparative SAEP method with their variants, respectively . 3 The last two rows show the results of t -test and average rank, respectively . The “W/T/L ” in t -test indicates that AdaNet is superior to, not significantly different from, or inferior to the corresponding comparative SAEP methods including their variants. The average rank is calculated according to the Friedman test [27]. (a) Comparison on the test accuracy (%) performance. Label Pair Number of Sub-Architectures AdaNet PRS PAP PIE AdaNet .W PRS.W P AP.W PIE.W digits 6-9 4.20 ± 1.47 5.80 ± 0.40 6.00 ± 0.89 5.80 ± 0.98 6.20 ± 0.98 5.20 ± 1.17 5.60 ± 0.49 5.00 ± 1.79 † digits 5-8 6.80 ± 0.40 6.00 ± 0.63 ‡ 6.60 ± 0.49 5.80 ± 0.75 6.00 ± 0.63 ‡ 6.20 ± 1.17 5.60 ± 0.49 ‡ 6.00 ± 1.10 top-pullover 5.00 ± 0.63 5.40 ± 0.49 5.80 ± 0.98 † 5.20 ± 0.98 † 5.00 ± 0.89 3.80 ± 1.17 4.20 ± 0.75 3.20 ± 0.40 ‡ top-coat 5.40 ± 0.80 4.80 ± 0.40 ‡ 4.60 ± 0.80 ‡ 5.40 ± 0.80 5.20 ± 0.75 ‡ 5.40 ± 0.49 ‡ 4.40 ± 0.80 3.00 ± 0.00 ‡ top-shirt 5.60 ± 0.49 5.40 ± 0.80 5.60 ± 0.80 5.20 ± 1.47 5.60 ± 1.02 5.80 ± 0.75 † 4.20 ± 0.98 4.60 ± 1.62 trouser-dress 4.20 ± 1.47 5.20 ± 0.75 5.20 ± 1.17 4.40 ± 1.36 5.00 ± 1.10 4.00 ± 1.79 4.00 ± 0.63 ‡ 4.60 ± 1.62 † sandal-ankle boot 5.20 ± 0.75 5.80 ± 1.17 † 5.40 ± 1.02 † 5.40 ± 1.36 † 6.20 ± 0.75 † 5.40 ± 0.49 4.80 ± 0.75 ‡ 3.40 ± 0.80 ‡ deer-truck 4.80 ± 1.17 4.80 ± 1.17 5.00 ± 0.89 4.60 ± 1.02 ‡ 5.20 ± 0.75 5.20 ± 1.33 † 4.60 ± 0.80 ‡ 4.20 ± 0.98 ‡ deer-horse 4.00 ± 0.63 4.40 ± 0.80 † 5.20 ± 1.17 † 3.40 ± 0.80 5.00 ± 0.00 † 5.00 ± 0.00 † 5.00 ± 0.63 † 5.20 ± 0.75 † automobile-truck 4.40 ± 1.02 4.20 ± 1.47 4.40 ± 0.80 ‡ 3.20 ± 1.33 5.00 ± 1.41 † 5.00 ± 1.26 † 5.20 ± 0.40 4.80 ± 0.75 cat-dog 4.00 ± 1.10 4.00 ± 1.26 4.00 ± 1.26 4.40 ± 1.50 † 3.40 ± 0.49 ‡ 5.40 ± 0.80 4.60 ± 1.02 3.60 ± 0.49 ‡ dog-horse 4.00 ± 1.10 5.00 ± 0.89 5.40 ± 1.02 5.00 ± 0.63 4.60 ± 0.80 5.00 ± 0.63 † 4.20 ± 0.75 5.40 ± 0.80 t -test (W/T/L) — 2/8/2 3/7/2 3/8/1 3/6/3 5/6/1 1/7/4 3/4/5 A verage Rank 3.96 4.79 6.00 4.00 5.38 5.38 3.25 3.25 (b) Comparison on the size of the (sub-)ensemble architectures. Label Pair Time Cost (min) AdaNet PRS P AP PIE AdaNet .W PRS.W P AP.W PIE.W digits 6-9 10.92 ± 1.82 12.35 ± 0.99 12.91 ± 1.31 13.04 ± 0.76 12.74 ± 1.29 12.24 ± 0.92 13.50 ± 0.28 12.61 ± 1.84 † digits 5-8 13.00 ± 0.46 12.25 ± 0.64 ‡ 13.96 ± 0.34 † 12.16 ± 0.49 ‡ 13.07 ± 0.46 † 13.07 ± 0.83 † 13.16 ± 0.62 † 13.55 ± 1.18 † top-pullover 11.83 ± 0.46 11.93 ± 0.52 † 12.78 ± 1.29 † 11.73 ± 1.77 11.84 ± 0.98 † 11.22 ± 1.01 12.08 ± 0.58 † 11.02 ± 0.28 ‡ top-coat 12.00 ± 0.68 11.21 ± 0.34 ‡ 11.05 ± 0.70 11.78 ± 1.27 12.42 ± 0.52 11.90 ± 0.67 ‡ 12.04 ± 0.62 11.09 ± 0.17 ‡ top-shirt 11.80 ± 1.06 12.06 ± 1.18 † 12.63 ± 0.85 10.89 ± 2.53 12.55 ± 0.66 12.63 ± 0.74 12.04 ± 0.83 12.26 ± 1.34 † trouser-dress 10.88 ± 1.40 11.98 ± 0.61 12.36 ± 1.02 † 11.24 ± 1.74 † 12.19 ± 0.66 10.75 ± 1.72 11.92 ± 0.71 12.25 ± 1.23 sandal-ankle boot 11.75 ± 0.94 12.09 ± 0.99 † 12.55 ± 1.04 † 10.20 ± 2.35 13.03 ± 0.40 12.34 ± 0.47 12.20 ± 0.77 11.34 ± 0.91 ‡ deer-truck 15.50 ± 1.81 13.32 ± 2.08 11.72 ± 1.01 ‡ 11.39 ± 0.81 ‡ 16.74 ± 1.00 16.11 ± 1.24 16.90 ± 0.90 15.51 ± 1.18 deer-horse 14.66 ± 1.09 12.70 ± 0.98 ‡ 11.94 ± 1.08 ‡ 9.82 ± 0.58 ‡ 16.22 ± 0.68 15.99 ± 1.08 16.94 ± 1.04 17.12 ± 1.03 † automobile-truck 15.31 ± 1.33 12.64 ± 2.23 11.35 ± 1.15 ‡ 10.04 ± 1.31 ‡ 15.87 ± 1.70 † 16.42 ± 1.36 † 16.52 ± 0.50 16.97 ± 0.89 cat-dog 24.28 ± 17.37 17.17 ± 1.48 ‡ 23.06 ± 11.87 ‡ 75.08 ± 113.67 † 14.45 ± 1.29 ‡ 78.41 ± 104.25 † 113.55 ± 193.13 † 35.34 ± 38.05 † dog-horse 16.79 ± 2.68 23.08 ± 12.98 † 77.02 ± 116.93 † 16.07 ± 1.02 ‡ 71.94 ± 108.17 † 119.54 ± 189.82 † 17.00 ± 1.81 46.69 ± 39.39 † t -test (W/T/L) — 4/4/4 5/3/4 2/5/5 4/7/1 4/7/1 3/9/0 6/3/3 A verage Rank 3.25 3.50 5.17 2.50 5.58 5.00 6.08 4.92 (c) Comparison on the time cost (min) of the searching process. (a) (b) Fig. 2. Comparison of the baseline AdaNet and the proposed SAEP including their variants on the test accuracy , using MLPs as sub-architectures for binary classification. (a) Friedman test chart (non-ov erlapping means significant difference) [27], which rejects the assumption that “all methods have the same accuracy performance” at the significance le vel of 10% . (b) The aggregated rank of test accuracy for each method (the smaller the better) [32]. coats, sandals, shirts, sneak ers, bags, and ankle boots, respec- tiv ely . B. Baseline Methods T o analyze the effecti veness of SAEP , we compare the three proposed solutions (i.e., PRS , P AP , and PIE ) with AdaNet [5]. Besides, AdaNet (usually set to use uniform a verage weights in practice) has a variant to use mixture weights, which we call AdaNet .W [33]. Similarly , PRS.W , P AP.W , and PIE.W (i.e., SAEP.W ) are v ariants of PRS , P AP , and PIE using mixture weights, respecti vely . Our baselines include AdaNet and their corresponding variants. Besides, to objectively ev aluate the performance of these methods, standard 5 -fold cross-v alidation is used in these experiments, i.e., in each iteration, the entire data set is split into two parts, with 80% as the training set and 20% as the test set. C. Experimental Settings In the same experiment, all methods would use the same kind of sub-architectures in consideration of fairness during the comparisons to verify whether their objectives work well. The optional sub-architectures that we use include multi- layer perceptrons (MLPs) and con volutional neural netw orks (CNNs). Note that those CNNs are only composed of con vo- lution layers with 16 channels, without pooling layers. As for the hyper-parameters in the experiments, the learning rate is set to be 0 . 003 , and cosine decay is applied to the learning IEEE TRANSA CTIONS ON NEURAL NETWORKS AND LEARNING SYSTEMS 6 T ABLE III E M PI R I C AL R E S ULT S O F E N SE M B LE - A R CH I T E CT U R E S ’ P E R FO R M A NC E F O R M U L T I - C LA S S C L A S SI FI C A T I O N . E AC H M E TH O D I N C L UD E S F O U R C O LU M N S , I . E . , T H E test accuracy (%) , T H E size O F G E NE R A T E D ( S UB - ) E NS E M B LE A R C HI T E CT U R E S , T H E diversity O F T H E P RU N ED S U B - E N S EM B L E A R C HI T E CT U R E S , A N D T H E time cost (min) O F T H E S E AR C H I NG P RO C E SS . T H E B E S T O F T H E M A R E I N D IC A T E D W I TH B O L D F O NT S F O R E AC H D A TA SE T ( RO W ) . N OT E T H A T S U B - AR C H IT E C T UR E S U S ED I N T H ES E E X PE R I ME N T S A R E M L P S A N D C N N S . Dataset T est Accuracy (%) AdaNet PRS P AP PIE AdaNet .W PRS .W P AP.W PIE.W MNIST 94.88 ± 0.22 94.82 ± 0.36 † 94.79 ± 0.23 † 94.75 ± 0.25 † 94.94 ± 0.29 94.66 ± 0.13 94.56 ± 0.28 † 94.94 ± 0.19 ‡ Fashion-MNIST 83.74 ± 0.52 83.76 ± 0.88 83.95 ± 0.50 ‡ 83.89 ± 0.64 83.81 ± 0.32 ‡ 83.98 ± 0.40 ‡ 84.24 ± 0.18 ‡ 83.93 ± 0.21 ‡ MNIST ∗ 90.54 ± 0.24 90.46 ± 0.25 † 90.44 ± 0.15 90.35 ± 0.24 † 90.55 ± 0.18 ‡ 90.38 ± 0.27 † 90.27 ± 0.16 90.23 ± 0.35 † Fashion-MNIST ∗ 81.39 ± 0.43 81.48 ± 0.30 ‡ 81.40 ± 0.23 ‡ 81.32 ± 0.45 † 81.39 ± 0.26 ‡ 81.41 ± 0.18 ‡ 81.20 ± 0.09 81.05 ± 0.58 † t -test (W/T/L) — 2/1/1 1/1/2 3/1/0 0/1/3 1/1/2 1/2/1 2/0/2 A verage Rank 4.50 3.75 3.75 5.75 3.25 4.00 5.75 5.25 Dataset Number of Sub-Ar chitectures AdaNet PRS P AP PIE AdaNet .W PRS .W P AP.W PIE.W MNIST 6.80 ± 0.40 6.60 ± 0.49 7.00 ± 0.00 6.60 ± 0.49 6.60 ± 0.49 6.20 ± 0.98 5.20 ± 0.75 ‡ 6.80 ± 0.40 Fashion-MNIST 5.40 ± 1.02 5.60 ± 0.80 5.40 ± 1.02 6.00 ± 0.63 6.00 ± 0.89 5.60 ± 0.80 5.00 ± 0.63 ‡ 4.00 ± 1.10 MNIST ∗ 5.80 ± 0.75 4.80 ± 0.75 ‡ 5.60 ± 1.50 4.80 ± 0.40 ‡ 5.40 ± 1.36 5.00 ± 1.41 3.80 ± 1.17 3.00 ± 0.00 ‡ Fashion-MNIST ∗ 5.40 ± 1.36 3.80 ± 1.47 ‡ 6.40 ± 0.49 5.00 ± 0.63 ‡ 5.60 ± 0.49 4.00 ± 0.63 ‡ 4.00 ± 0.89 ‡ 3.20 ± 0.40 ‡ t -test (W/T/L) — 0/2/2 0/4/0 0/2/2 0/4/0 0/3/1 0/1/3 0/2/2 A verage Rank 6.00 3.75 6.63 5.00 6.13 4.00 2.13 2.38 Dataset Time Cost (min) AdaNet PRS P AP PIE AdaNet .W PRS .W P AP.W PIE.W MNIST 78.65 ± 89.02 23.42 ± 2.32 ‡ 21.51 ± 0.16 ‡ 31.73 ± 12.46 ‡ 81.13 ± 87.66 43.36 ± 12.72 ‡ 92.39 ± 117.81 † 33.11 ± 1.94 ‡ Fashion-MNIST 21.75 ± 1.87 20.07 ± 0.65 ‡ 25.50 ± 9.07 † 39.30 ± 6.03 † 42.92 ± 9.71 † 91.41 ± 117.32 † 31.77 ± 2.16 † 75.92 ± 89.19 † MNIST ∗ 30.73 ± 1.10 29.03 ± 0.74 ‡ 28.04 ± 3.87 20.47 ± 1.27 ‡ 30.46 ± 1.72 25.88 ± 2.62 ‡ 29.08 ± 1.23 28.25 ± 0.08 ‡ Fashion-MNIST ∗ 29.61 ± 1.53 27.74 ± 1.75 ‡ 30.63 ± 1.53 † 20.90 ± 0.83 ‡ 31.12 ± 0.57 † 25.01 ± 3.19 28.22 ± 1.92 28.28 ± 0.19 ‡ t -test (W/T/L) — 0/0/4 2/1/1 1/0/3 2/2/0 1/1/2 2/2/0 1/0/3 A verage Rank 5.50 2.75 3.50 2.50 7.00 4.25 5.50 5.00 1 Empirical results with ∗ represent experiments using CNNs as sub-architectures; Empirical results without ∗ represent experiments using MLPs as sub-architectures. 2 The reported results are the average v alues of each method and the corresponding standard deviation under 5-fold cross-validation on each dataset. 3 By two-tailed paired t -test at 5% significance level, ‡ and † denote that the performance of AdaNet is inferior to and superior to that of the comparative SAEP method with their variants, respectiv ely . 4 The last two rows show the results of t -test and av erage rank, respectively. The “W/T/L” in t -test indicates that AdaNet is superior to, not significantly dif ferent from, or inferior to the corresponding comparative SAEP methods including their variants. The average rank is calculated according to the Friedman test [27]. rate using a momentum optimizer in the training process. The number of training steps is 5 , 000 , and that of the batch size is 64 . W e use three datasets mentioned before for image classi- fication. In the multi-class classification scenario, we use all of the categories in the corresponding dataset; in the binary classification scenario, we reduce these datasets by considering sev eral pairs of classes. For example, we consider fiv e pairs of classes in CIF AR-10 (i.e., deer -truck, deer -horse, automobile- truck, cat-dog, and dog-horse), five pairs of classes in Fashion- MNIST (i.e., top-pullov er, top-coat, top-shirt, trouser -dress, and sandal-ankle boot), and two pairs of digits in MNIST (i.e., digits 6 - 9 , and 5 - 8 ). D. SAEP Could Achieve Ensemble Ar chitectur es with Better P erformance of Accuracy In this subsection, we verify whether the pruned sub- ensemble architectures could achieve comparable performance with the original ensemble architecture. Experimental results are reported in T ables II–III contain the av erage test accuracy (%) of each method and the corresponding standard deviation under 5 -fold cross-validation on each data set. F or instance, each row (data set) in T able II compares the classification accuracy using sub-architectures with the same type, indicating results with higher accuracy and lower standard de viation by bold fonts. When comparing one method with AdaNet, the one with higher values of accuracy and lo wer standard deviation would win; otherwise, the winner would be decided based on the significance of the difference in the accuracy performance between the two methods, which is examined by two-tailed paired t -test at 5% significance lev el to tell if two methods hav e significantly different results. Specifically , two (a) (b) (c) (d) Fig. 3. Comparison of the baseline AdaNet and the proposed SAEP including their variants, using MLPs as sub-architectures for image classification. (a– b) Comparison on the size of generated (sub-)ensemble architectures. (c– d) Comparison on the time cost of the searching process. Notice that: the Friedman test chart in (a) rejects the assumption that “the size of ensemble architectures of different methods has no significant difference” at 5% significant level; that in (c) rejects the assumption that “the time cost of different methods has no significant difference” at 5% significant lev el. methods end up with a tie if there is no significant statistical difference between them; otherwise, the one with higher values of accuracy would win. The performance of each method is reported in the last two rows of T able II, compared with AdaNet in terms of the av erage rank and the number of data sets that AdaNet has won, tied, or lost, respectiv ely . W e may notice that SAEP achie ved better results than AdaNet in most cases, yet with possible larger time cost in a few cases. There- fore, it could be referred that SAEP could generate ensemble architectures with better performance of accuracy . Figure 2(a) shows that SAEP (indicated by PRS , P AP , and PIE ) achiev es the same le vel of accuracy performance as AdaNet at least, and their variants even exhibits better accuracy performance than AdaNet and AdaNet .W . Similar results are presented in Figure 2(b) and T able III. E. SAEP Leads to Ensemble Arc hitectur es with Smaller Size In this subsection, we verify whether the pruned sub- ensemble architectures could generate comparable perfor- mance of architectures with smaller size. Experimental results are reported in T ables II – III and Figures 3 – 4. As we can see in T able II, SAEP achieves ensemble architectures with the smallest size in most cases, although the significant difference between dif ferent methods might not be as large as that of ac- curacy , as sho wn in Figures 3(a) – 3(b). Meanwhile, T able II and Figures 3(c) – 3(d) presents that variants of AdaNet and SAEP might cost more time than themselves. Howe ver , considering that SAEP already achie ves the comparable performance with AdaNet and that SAEP generates ensemble architectures with smaller size indeed, we belie ve that our N AS ensemble pruning method is still meaningful somehow . Similar observ ations are IEEE TRANSA CTIONS ON NEURAL NETWORKS AND LEARNING SYSTEMS 7 (a) (b) (c) (d) (e) (f) Fig. 4. Comparison of the baseline AdaNet and the proposed SAEP including their corresponding variants, using MLPs as sub-architectures for image classification. The horizontal axis represents empirical results in dif ferent specific experiments like different rows in T ables II–III. (a–c) Comparison of performance of AdaNet and SAEP . (d–f) Comparison of performance of their corresponding variants. exhibited in Figure 4 as well: (1) SAEP could achieve the same level of accuracy performance as AdaNet, as shown in Figures 4(a) and 4(d); (2) SAEP could generate ensemble architectures with competitiv e performance yet smaller size, as shown in Figure 4(e). F . PIE Generates Sub-Ensemble Ar chitectur es with Mor e Di- versity In this subsection, we verify whether the purpose of increas- ing the diversity of ensemble architectures is satisfied. W e use the normalized of information VI in PIE to imply the redun- dancy between two different sub-architectures, indicating the div ersity between them. Ho we ver , in this experiment, we use another measure named the disagreement measure [34], [35] here to calculate the diversity for the ensemble architecture and the pruned sub-ensemble architectures, because there is no analogous term like VI in PRS and P AP . Note that researchers proposed many other measures to calculate diversity , and the disagreement measure is one of them [36]. W e choose the disagreement measure here because this measure is easy to be calculated and understood. The disagreement between two sub-architectures w i and w j is dis( w i , w j ) = 1 m X 1 6 i 6 m I ( h i ( x i ) 6 = h j ( x i )) , (17) the div ersity of the ensemble architecture f using the disagree- ment measure is dis ( f ) = 2 l ( l − 1) X w i · h i ∈ f X w j · h j ∈ f , h j 6 = h i dis( w i , w j ) , (18) and the di versity of the sub-ensemble architecture f \ { w · h } could be calculated analogously . T able IV and Figures 5–6 report their performance with the corresponding disagreement v alue reflecting the diversity of the whole ensemble architecture as well. Besides, T able IV reports the div ersity of the sub-architectures using PIE and other corresponding information. Note that the larger the disagreement is, the larger the diversity of the ensemble architecture or the pruned sub-architecture is. P AP in T able IV achiev es better accuracy performance and more diversity con- currently . Similar results are observed in PRS.W and P AP.W compared with AdaNet .W in T able IV, which illustrates that the accurac y of the sub-ensemble architecture could benefit from increasing di versity . Meanwhile, T able IV shows that larger sub-ensemble architectures correspond to less diversity sometimes. In addition, Figure 6 indicate the effect of the α value in Eq. (15) on the div ersity , the accurac y performance, the time cost, and the size of the sub-ensemble architectures. G. Effect of the α V alue This subsection will in vestigate the ef fect of the hyper- parameter α in PIE . The value of α indicates the relation between two criteria in Eq. (15) as well. T o re veal this issue, different α values (from 0.0 to 1.0 with 0.05 steps) are ev aluated in the experiments. Figure 6 ex emplify the effect of α on the MNIST dataset, taking the label pairs of digits 5 - 8 and digits 6 - 9 as an example. Figure 6(a) illustrates that the accuracy of sub-ensemble architectures is affected slightly under different α v alues yet would not cause much accuracy decline. Figure 6(b) illustrates that the diversity of the sub-ensemble architectures in PIE.W is affected under different α v alues yet without large changes of absolute v alues; meanwhile, the di versity of that in PIE is almost not af fected under dif ferent α values. Figures 6(c) – 6(d) present that the IEEE TRANSA CTIONS ON NEURAL NETWORKS AND LEARNING SYSTEMS 8 T ABLE IV E M PI R I C AL R E S ULT S U N D ER D I FF ER E N T α V A L U ES O N T H E M N IS T DAT A SE T F O R B I NA RY C L A S SI FI C A T I O N ( TO B E S P EC I FI C , T H E L A B E L PAI R O F D I GI T S 5 − 8 ) , U S IN G M L P S A S S U B - A R CH I T E CT U R E S . E AC H M E TH O D I N C L UD E S F O U R C O L UM N S : T H E test accuracy (%) , T H E diversity (disagr eement) , T H E size ( I . E . , T HE N U M B ER O F S U B - AR C H I TE C T U RE S ) , A N D T H E time cost (min) O F T H E S E AR C H I NG P RO C E SS . N OT E T HAT “ O R I G .” R E P R ES E N T S A DA N ET , PRS , P AP , O R PIE ; “ V A RI .” R E P R ES E N TS A DA N E T .W , PRS.W , P AP.W , O R PIE.W , C O RR E S PO N D I NG LY . T est Accuracy (%) Diversity (Disagreement) Size Time Cost (min) orig. vari. orig. vari. orig. vari. orig. vari. AdaNet 99.86 ± 0.06 99.86 ± 0.05 0.0003 ± 0.0001 0.0005 ± 0.0003 5.60 ± 5.60 5.80 ± 5.80 11.53 ± 0.43 12.37 ± 0.75 PRS 99.83 ± 0.07 99.88 ± 0.05 0.0037 ± 0.0043 0.0019 ± 0.0031 5.40 ± 5.40 4.80 ± 4.80 11.93 ± 0.71 11.16 ± 1.52 P AP 99.87 ± 0.05 99.88 ± 0.04 0.0011 ± 0.0018 0.0003 ± 0.0001 5.80 ± 5.80 5.40 ± 5.40 12.76 ± 1.06 12.89 ± 0.62 PIE ( α = 0 . 5 ) 99.80 ± 0.06 99.85 ± 0.04 0.0037 ± 0.0069 0.0030 ± 0.0053 4.80 ± 4.80 5.80 ± 5.80 12.29 ± 1.14 13.15 ± 0.54 PIE ( α = 0 . 0 ) 99.15 ± 0.23 99.19 ± 0.26 0.0022 ± 0.0004 0.0399 ± 0.0201 7.00 ± 0.00 5.80 ± 0.40 14.53 ± 0.10 13.98 ± 0.63 PIE ( α = 0 . 05 ) 99.16 ± 0.24 99.16 ± 0.13 0.0024 ± 0.0004 0.0280 ± 0.0135 6.60 ± 0.80 6.00 ± 1.10 9.56 ± 2.14 13.60 ± 1.16 PIE ( α = 0 . 1 ) 99.13 ± 0.04 99.21 ± 0.15 0.0019 ± 0.0003 0.0456 ± 0.0250 6.40 ± 0.49 5.40 ± 1.20 13.59 ± 0.80 13.22 ± 0.91 PIE ( α = 0 . 15 ) 99.24 ± 0.14 99.25 ± 0.17 0.0020 ± 0.0004 0.0313 ± 0.0299 6.00 ± 0.89 5.80 ± 0.98 12.95 ± 0.64 14.00 ± 0.75 PIE ( α = 0 . 2 ) 99.14 ± 0.17 99.21 ± 0.06 0.0022 ± 0.0006 0.0574 ± 0.0162 6.20 ± 0.75 6.40 ± 0.49 14.20 ± 0.72 14.58 ± 0.18 PIE ( α = 0 . 25 ) 99.22 ± 0.12 99.15 ± 0.19 0.0020 ± 0.0004 0.0378 ± 0.0294 6.00 ± 0.63 6.40 ± 0.80 13.08 ± 0.61 14.30 ± 0.71 PIE ( α = 0 . 3 ) 99.29 ± 0.12 99.18 ± 0.22 0.0023 ± 0.0003 0.0415 ± 0.0251 7.00 ± 0.00 6.40 ± 0.49 13.16 ± 1.54 14.36 ± 0.41 PIE ( α = 0 . 35 ) 99.19 ± 0.11 99.24 ± 0.09 0.0021 ± 0.0006 0.0210 ± 0.0158 5.60 ± 1.02 5.40 ± 1.20 12.85 ± 0.73 13.20 ± 0.93 PIE ( α = 0 . 4 ) 99.22 ± 0.13 99.20 ± 0.22 0.0022 ± 0.0002 0.0364 ± 0.0288 6.80 ± 0.40 6.20 ± 0.75 11.02 ± 0.12 14.49 ± 0.53 PIE ( α = 0 . 45 ) 99.12 ± 0.12 99.18 ± 0.18 0.0023 ± 0.0009 0.0486 ± 0.0232 6.60 ± 0.80 6.60 ± 0.80 13.62 ± 0.40 14.59 ± 0.44 PIE ( α = 0 . 55 ) 99.17 ± 0.19 99.18 ± 0.20 0.0022 ± 0.0004 0.0454 ± 0.0107 6.00 ± 0.63 6.40 ± 0.49 12.99 ± 0.69 14.45 ± 0.59 PIE ( α = 0 . 6 ) 99.23 ± 0.08 99.19 ± 0.15 0.0022 ± 0.0002 0.0499 ± 0.0275 6.00 ± 1.10 5.60 ± 0.80 9.96 ± 1.46 13.65 ± 1.03 PIE ( α = 0 . 65 ) 99.20 ± 0.14 99.29 ± 0.12 0.0018 ± 0.0003 0.0173 ± 0.0147 6.40 ± 0.80 5.40 ± 1.02 13.14 ± 0.87 13.21 ± 1.08 PIE ( α = 0 . 7 ) 99.23 ± 0.21 99.25 ± 0.12 0.0020 ± 0.0003 0.0234 ± 0.0228 6.60 ± 0.80 6.00 ± 1.26 8.17 ± 0.64 13.78 ± 0.83 PIE ( α = 0 . 75 ) 99.16 ± 0.21 99.22 ± 0.15 0.0022 ± 0.0005 0.0428 ± 0.0216 6.60 ± 0.49 6.00 ± 0.63 13.48 ± 0.51 14.21 ± 0.64 PIE ( α = 0 . 8 ) 99.17 ± 0.15 99.19 ± 0.03 0.0028 ± 0.0017 0.0269 ± 0.0213 6.40 ± 0.49 5.40 ± 1.20 7.80 ± 0.47 13.35 ± 1.05 PIE ( α = 0 . 85 ) 99.20 ± 0.13 99.18 ± 0.17 0.0020 ± 0.0003 0.0411 ± 0.0224 5.60 ± 0.49 6.60 ± 0.49 12.81 ± 0.35 14.45 ± 0.47 PIE ( α = 0 . 9 ) 99.20 ± 0.23 99.28 ± 0.16 0.0017 ± 0.0003 0.0596 ± 0.0172 6.00 ± 0.63 6.00 ± 0.63 7.67 ± 0.92 13.99 ± 0.45 PIE ( α = 0 . 95 ) 99.22 ± 0.19 99.22 ± 0.10 0.0020 ± 0.0003 0.0283 ± 0.0210 5.80 ± 0.40 5.80 ± 1.17 12.51 ± 0.38 13.82 ± 0.80 PIE ( α = 1 . 0 ) 99.19 ± 0.19 99.28 ± 0.15 0.0021 ± 0.0006 0.0483 ± 0.0159 6.20 ± 0.75 6.40 ± 0.49 8.07 ± 0.35 14.34 ± 0.27 (a) (b) (c) (d) (e) (f) (g) (h) Fig. 5. Comparison of the baseline AdaNet and the proposed SAEP including their corresponding variants, using MLPs as sub-architectures for binary classification. The horizontal axis represents empirical results in dif ferent specific experiments like different rows in T ables II–III. (a–c) Comparison of performance of AdaNet and SAEP . (d–f) Comparison of performance of their corresponding variants. (a) (b) (c) (d) Fig. 6. The ef fect of different α values in PIE and PIE.W for binary classification. (a) The effect of the α value on the test accuracy performance of sub-ensemble architectures. (b) The effect of the α value on the di versity of sub-ensemble architectures, measured by the disagreement measure in Eq. (18). (c) The effect of the α value on the size of sub-ensemble architectures. (d) The ef fect of the α value on the time cost. IEEE TRANSA CTIONS ON NEURAL NETWORKS AND LEARNING SYSTEMS 9 T ABLE V E M PI R I C AL R E S ULT S O F T H E E X AC T S U B - A R C HI T E C TU R E S T H A T A R E K E PT I N T H E FI NA L S U B - EN S E MB L E A R CH I T EC T U R E A F TE R P RU N I NG O N T H E D I GI T S 5 - 8 L A BE L PAI R I N T H E M N I S T D A TA SE T . E AC H M E T HO D I N CL U D E S FI V E C O LU M N S : T H E test accuracy (%) , T H E diversity (disagr eement) , T H E time cost (min) , T H E size ( I . E . , T H E N U M BE R O F S U B - A R C HI T E CT U R E S ) , A N D T H E indexes O F T H E G E N ER ATE D S U B - A R C HI T E CT U R E S . N OT E T H A T T H E S U B - A R C HI T E C TU R E S U S E D I N T H ES E E X PE R I M EN T S A R E M L P S . Accuracy Diversity T ime Size Indexes AdaNet 99.86 0.0001 10.71 6 [0,1,3,4,5,6] PRS 99.92 0.0101 10.54 4 [0,1,2,5] P AP 99.93 0.0002 13.95 7 [0,1,2,3,4,5,6] PIE ( α =0.25) 99.24 0.0016 13.31 6 [0,1,2,3,4,5] PIE ( α =0.5) 99.89 0.0002 12.89 5 [0,1,2,3,4] PIE ( α =0.75) 99.12 0.0024 13.53 6 [0,1,2,3,5,6] AdaNet .W 99.82 0.0002 11.69 5 [0,1,2,3,6] PRS.W 99.93 0.0006 13.82 7 [0,1,2,3,4,5,6] P AP.W 99.86 0.0003 12.47 6 [0,1,3,4,5,6] PIE.W ( α =0.25) 99.20 0.0029 12.91 5 [0,1,2,3,6] PIE.W ( α =0.5) 99.78 0.0004 13.69 6 [0,1,2,3,4,5] PIE.W ( α =0.75) 99.01 0.0445 13.99 6 [0,1,2,3,4,6] size and time cost of sub-ensemble architectures would be more affected under different α values. Generally , the size and time cost of sub-ensemble architectures in PIE tend to be decreased with the increase of α v alue. H. AdaNet v .s. SAEP over the T ime Cost In this subsection, we compare the time cost of AdaNet and SAEP with their corresponding variants. Experimental results are reported in T ables II – IV and Figures 3 – 6, con- taining the accuracy on the test set of each method and their corresponding time cost. Although Figures 3(c)–3(d) illustrate that the time cost is not an adv antage of SAEP compared with AdaNet while achieving the same lev el of accuracy , T ables II– III present that SAEP could generate satisfactory sub-ensemble architectures within less time sometimes. Generally , the time cost depends on the number of sub-architectures that are gener- ated during the entire searching process, although the pruning is proceeded through the same process. Therefore, it is quite understandable that SAEP might take a longer time if more sub-architectures are generated during searching. Moreover , Figure 6(d) presents the effect of different α v alues in PIE on the time cost of generating sub-ensemble architectures with more div ersity . I. SAEP Could Generate Distinct Deeper Sub-Arc hitectures than AdaNet In a few cases, we observe that PIE could achieve a larger ensemble architecture than AdaNet, which makes us wonder whether SAEP could lead to distinct architectures from AdaNet. Thus, we dig the sub-architectures that are kept in the final architecture to explore more details deep down inside. As we can see in T able V, the size of sub-ensemble architectures tends to be larger under the lo wer level of div ersity . The reason why PIE (or PIE .W ) generates distinct deeper sub- architectures might be the diversity is not sufficient for its objectiv e in Eq. (16). In this case, the objecti ve would guide the pruning process to search for more distinct deeper sub- architectures to increase diversity . V . R E L A T E D W O R K In this section, we introduce the neural architecture search (N AS) briefly . The concept of “neural architecture search (N AS)” was proposed by Zoph and Le [4] for the very first time. They presented NAS as a gradient-based method to find good architectures. A “controller”, denoted by a recurrent network, was used to generate v ariable-length string which specified the structure and connecti vity of a neural network; the generated “child netw ork, ” specified by the string, w as then trained on the real data to obtain accuracy as the reward signal, to generate an architecture with higher probabilities to receive high accuracy [1], [4], [37]. Existing NAS methods could be categorized under three dimensions: search space, search strategy , and performance estimation strategy [2], [38]–[40]. Classical NAS methods yielded chain-structured neural archi- tectures [2], [41], yet ignored some modern designed elements from hand-crafted architectures, such as skip connections from ResNet [42]. Thus some researchers also attempted to build complex multi-branch networks by incorporating those and achiev ed positi ve results [43]–[50]. Recently , NAS methods in volved ensemble learning are attracting researchers’ attention gradually . Cortes et al. [5] proposed a data-dependent learning guarantee to guide the choice of additional sub-networks and presented AdaNet to learn neural networks adapti vely . They claimed that AdaNet could precisely address some of the issues of wasteful data, time, and resources in neural architecture search since their optimization problem for AdaNet was con ve x and admitted a unique global solution. Besides, Huang et al. [6] special- ized sub-architectures by residual blocks and claimed that their BoostResNet boosted over multi-channel representa- tions/features, which was different from AdaNet. Macko et al. [7] also proposed another attempt named as AdaNAS to utilize ensemble methods to compose a neural network automatically , which was an extension of AdaNet with the difference of using subnetworks comprising stacked N ASNet [1], [4] blocks. Howe ver , both of them gathered all searched sub-architectures together and missed out on the critical char- acteristic that ensemble models usually benefit from di verse individual learners. Moreov er , Chang et al. [51] proposed Differentiable AR- chiT ecture Search with Ensemble Gumbel-Softmax (D AR TS- EGS) and dev eloped ensemble Gumbel-Softmax to maintain efficienc y in searching. Ardywibo wo et al. [52] constructed an ensemble model to perform the Out-of-Distribution (OoD) detection in their Neural Architecture Distribution Search (N ADS), which searched for a distribution of architectures instead of one single best-performing architecture in standard neural architecture search methods. These two methods are not discussed in this paper since they are not assembling sub- architectures during searching. V I . C O N C L U S I O N Recent attempts on NAS with ensemble learning methods hav e achieved prominent results in reducing the search com- plexity and improving the effecti veness [5]. Howe ver , current approaches usually miss out on an essential characteristic IEEE TRANSA CTIONS ON NEURAL NETWORKS AND LEARNING SYSTEMS 10 of div ersity in ensemble learning. T o tackle this problem, in this paper , we target the ensemble learning methods in N AS and propose an ensemble pruning method named “ Sub- Ar chitectur e Ensemble Pruning in Neural Ar chitectur e Sear ch (SAEP) ” to reduce the redundant sub-architectures during the searching process. Three solutions are proposed as the guiding criteria in SAEP that reflect the characteristics of the ensemble architecture (i.e., PRS , P AP , and PIE ) to prune the less v aluable sub-architectures. Experimental results indicate that SAEP could guide diverse sub-architectures to create sub-ensemble architectures in a smaller size yet still with comparable performance to the ensemble architecture that is not pruned. Besides, PIE might lead to distinct deeper sub- architectures if di versity is insuf ficient. In the future, we plan to generalize the current method to more div erse ensemble strategies and derive theoretical guarantees to further improve the performance of the NAS ensemble architectures. R E F E R E N C E S [1] B. Zoph, V . V asude van, J. Shlens, and Q. Le, “Learning transferable architectures for scalable image recognition, ” in CVPR , 2018, pp. 8697– 8710. [2] T . Elsken, J. H. Metzen, and F . Hutter , “Neural architecture search, ” in Automated Machine Learning . Springer , 2019, pp. 63–77. [3] M. Wistuba, A. Rawat, and T . Pedapati, “ A survey on neural architecture search, ” arXiv preprint , 2019. [4] B. Zoph and Q. Le, “Neural architecture search with reinforcement learning, ” in ICLR , 2017. [5] C. Cortes, X. Gonzalvo, V . Kuznetsov , M. Mohri, and S. Y ang, “ Adanet: Adaptiv e structural learning of artificial neural networks, ” in ICML , 2017, pp. 874–883. [6] F . Huang, J. Ash, J. Langford, and R. Schapire, “Learning deep resnet blocks sequentially using boosting theory , ” in ICML , 2018. [7] V . Macko, C. W eill, H. Mazzawi, and J. Gonzalvo, “Improving neural architecture search image classifiers via ensemble learning, ” arXiv pr eprint arXiv:1903.06236 , 2019. [8] C. Cortes, M. Mohri, and U. Syed, “Deep boosting, ” in ICML , 2014, pp. 1179–1187. [9] H. Chen and X. Y ao, “Regularized negativ e correlation learning for neural network ensembles, ” IEEE T Neural Networ , vol. 20, no. 12, pp. 1962–1979, 2009. [10] ——, “Multiobjecti ve neural network ensembles based on regularized negati ve correlation learning, ” IEEE T Knowl Data En , vol. 22, no. 12, pp. 1738–1751, 2010. [11] ——, “Evolutionary random neural ensembles based on negati ve corre- lation learning, ” in IEEE CEC . IEEE, 2007, pp. 1468–1474. [12] Y . Bian, Y . W ang, Y . Y ao, and H. Chen, “Ensemble pruning based on objection maximization with a general distributed framework, ” IEEE T Neur Net Lear , vol. 31, no. 9, pp. 3766–3774, 2020. [13] H. Chen, P . Tino, and X. Y ao, “ A probabilistic ensemble pruning algorithm, ” in ICDM W orkshops . IEEE, 2006, pp. 878–882. [14] H. Chen, P . Ti ˇ no, and X. Y ao, “Predictive ensemble pruning by expecta- tion propagation, ” IEEE T Neural Networ , vol. 21, no. 7, pp. 999–1013, 2009. [15] H. Chen, “Di versity and regularization in neural network ensembles, ” Ph.D. dissertation, University of Birmingham, 2008. [16] Y . Bian and H. Chen, “When does div ersity help generalization in classification ensembles?” IEEE T rans. Cybern. , pp. 1–17, 2021. [17] Z. Lu, X. W u, X. Zhu, and J. Bongard, “Ensemble pruning via individual contribution ordering, ” in SIGKDD . A CM, 2010, pp. 871–880. [18] N. Li, Y . Y u, and Z.-H. Zhou, “Diversity regularized ensemble pruning, ” in ECML-PKDD , 2012, pp. 330–345. [19] G. Mart ´ ınez-Mu ˜ noz and A. Su ´ arez, “Using boosting to prune bagging ensembles, ” P attern Recogn Lett , vol. 28, no. 1, pp. 156–165, 2007. [20] K. Jarrett, K. Kavukcuoglu, M. Ranzato, and Y . LeCun, “What is the best multi-stage architecture for object recognition?” in ICCV . IEEE, 2009, pp. 2146–2153. [21] V . Nair and G. Hinton, “Rectified linear units improve restricted boltz- mann machines, ” in ICML , 2010, pp. 807–814. [22] X. Glorot, A. Bordes, and Y . Bengio, “Deep sparse rectifier neural networks, ” in AIST A TS , 2011, pp. 315–323. [23] I. Goodfellow , Y . Bengio, A. Courville, and Y . Bengio, Deep Learning . MIT press Cambridge, 2016, vol. 1. [24] V . K oltchinskii, D. P anchenko et al. , “Empirical margin distributions and bounding the generalization error of combined classifiers, ” Ann Stat , vol. 30, no. 1, pp. 1–50, 2002. [25] S. Zadeh, M. Ghadiri, V . Mirrokni, and M. Zadimoghaddam, “Scalable feature selection via distributed diversity maximization, ” in AAAI , 2017, pp. 2876–2883. [26] T . Cover and J. Thomas, Elements of information theory . John Wile y & Sons, 2012. [27] J. Dem ˇ sar , “Statistical comparisons of classifiers o ver multiple data sets, ” J Mach Learn Res , vol. 7, no. Jan, pp. 1–30, 2006. [28] J. Deng, W . Dong, R. Socher, L.-J. Li, K. Li, and L. Fei-Fei, “Imagenet: A large-scale hierarchical image database, ” in CVPR . IEEE, 2009, pp. 248–255. [29] A. Krizhevsk y and G. Hinton, “Learning multiple layers of features from tiny images, ” Citeseer , T ech. Rep., 2009. [30] Y . LeCun, L. Bottou, Y . Bengio, and P . Haffner , “Gradient-based learning applied to document recognition, ” Proceedings of the IEEE , vol. 86, no. 11, pp. 2278–2324, 1998. [31] H. Xiao, K. Rasul, and R. V ollgraf, “Fashion-mnist: a novel image dataset for benchmarking machine learning algorithms, ” arXiv preprint arXiv:1708.07747 , 2017. [32] C. Qian, Y . Y u, and Z.-H. Zhou, “Pareto ensemble pruning, ” in AAAI , 2015, pp. 2935–2941. [33] C. W eill, J. Gonzalvo, V . Kuznetsov , S. Y ang, S. Y ak, H. Mazza wi, E. Hotaj, G. Jerfel, V . Macko, M. Mohri, and C. Cortes, “ Adanet: Fast and flexible automl with learning guarantees, ” 2018. [Online]. A vailable: https://github.com/tensorflo w/adanet [34] D. B. Skalak et al. , “The sources of increased accuracy for two proposed boosting algorithms, ” in AAAI , vol. 1129, 1996, p. 1133. [35] T . K. Ho, “The random subspace method for constructing decision forests, ” IEEE T P attern Anal , vol. 20, no. 8, pp. 832–844, 1998. [36] Z.-H. Zhou, Ensemble Methods: F oundations and Algorithms . CRC press, 2012. [37] B. Baker , O. Gupta, N. Naik, and R. Raskar , “Designing neural network architectures using reinforcement learning, ” in ICLR , 2017. [38] K. Kandasamy , W . Neiswanger , J. Schneider , B. Poczos, and E. Xing, “Neural architecture search with bayesian optimisation and optimal transport, ” in NeurIPS , Feb 2018, pp. 2020–2029. [39] H. Cai, T . Chen, W . Zhang, Y . Y u, and J. W ang, “Efficient architecture search by network transformation, ” in AAAI , 2018. [40] H. Liu, K. Simonyan, and Y . Y ang, “Darts: Differentiable architecture search, ” in ICLR , 2019. [Online]. A vailable: https://openrevie w .net/ forum?id=S1eYHoC5FX [41] A. Zela, A. Klein, S. Falkner, and F . Hutter, “T owards automated deep learning: Efficient joint neural architecture and hyperparameter search, ” in ICML W orkshop on AutoML , 2018. [42] K. He, X. Zhang, S. Ren, and J. Sun, “Deep residual learning for image recognition, ” in CVPR , 2016, pp. 770–778. [43] H. Cai, J. Y ang, W . Zhang, S. Han, and Y . Y u, “Path-lev el network transformation for efficient architecture search, ” in ICML , June 2018. [44] E. Real, A. Aggarwal, Y . Huang, and Q. Le, “Regularized ev olution for image classifier architecture search, ” in AAAI , vol. 33, no. 01, 2019, pp. 4780–4789. [45] T . Elsken, J. H. Metzen, and F . Hutter , “Efficient multi-objectiv e neural architecture search via lamarckian evolution, ” in ICLR , 2019. [Online]. A vailable: https://openreview .net/forum?id=ByME42AqK7 [46] A. Brock, T . Lim, J. Ritchie, and N. W eston, “Smash: One-shot model architecture search through hypernetworks, ” in NIPS W orkshop on Meta- Learning, , 2017. [47] T . Elsken, J. Metzen, and F . Hutter, “Simple and efficient architecture search for conv olutional neural networks, ” in NIPS W orkshop on Meta- Learning , 2017. [48] Z. Zhong, J. Y an, W . W u, J. Shao, and C.-L. Liu, “Practical block-wise neural network architecture generation, ” in CVPR , 2018, pp. 2423–2432. [49] H. Pham, M. Guan, B. Zoph, Q. Le, and J. Dean, “Efficient neural architecture search via parameter sharing, ” in ICML , 2018. [50] Z. Zhong, Z. Y ang, B. Deng, J. Y an, W . Wu, J. Shao, and C.-L. Liu, “Blockqnn: Ef ficient block-wise neural network architecture generation, ” IEEE T P attern Anal , 2020. [51] J. Chang, X. Zhang, Y . Guo, G. Meng, S. Xiang, and C. P an, “Dif- ferentiable architecture search with ensemble gumbel-softmax, ” arXiv pr eprint arXiv:1905.01786 , 2019. IEEE TRANSA CTIONS ON NEURAL NETWORKS AND LEARNING SYSTEMS 11 [52] R. Ardywibow o, S. Boluki, X. Gong, Z. W ang, and X. Qian, “Nads: Neural architecture distribution search for uncertainty aw areness, ” in ICML . PMLR, 2020, pp. 356–366. [Online]. A vailable: https: //openrevie w .net/forum?id=rJeXD ANKwr
Original Paper
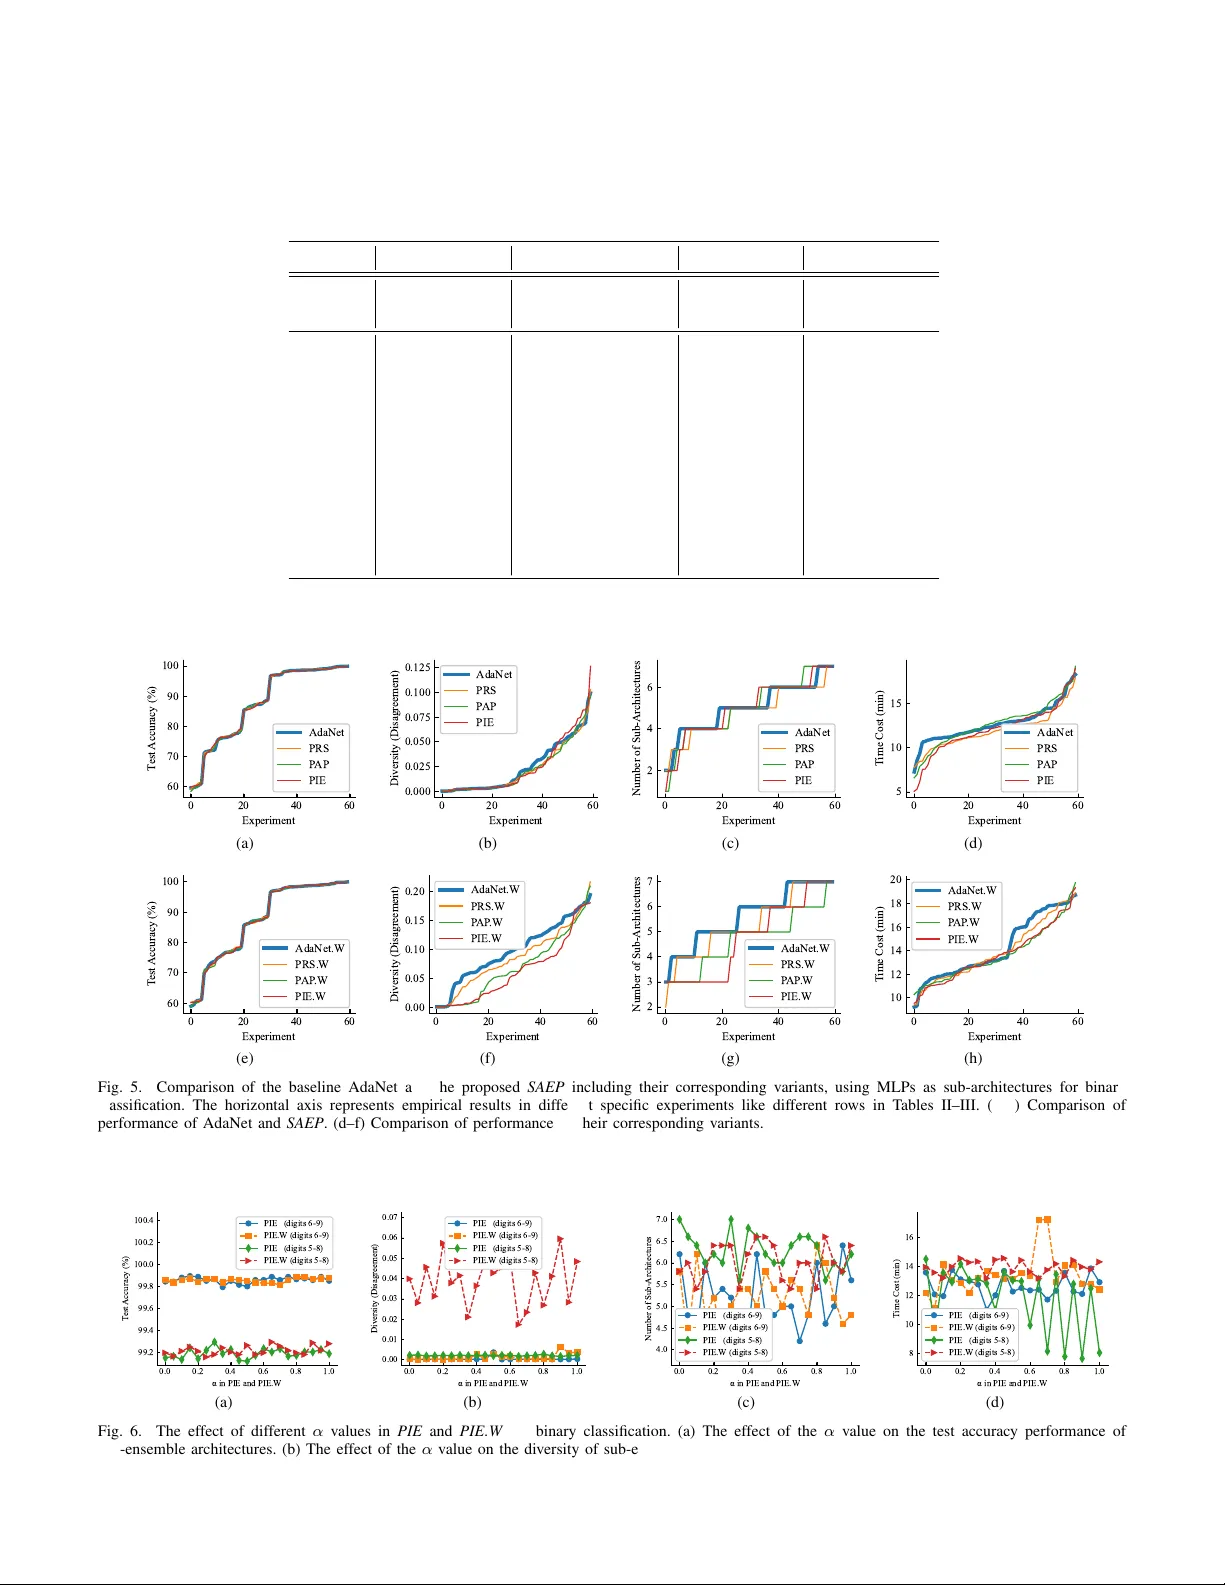
Loading high-quality paper...
Comments & Academic Discussion
Loading comments...
Leave a Comment