MOSNet: Deep Learning based Objective Assessment for Voice Conversion
Existing objective evaluation metrics for voice conversion (VC) are not always correlated with human perception. Therefore, training VC models with such criteria may not effectively improve naturalness and similarity of converted speech. In this pape…
Authors: Chen-Chou Lo, Szu-Wei Fu, Wen-Chin Huang
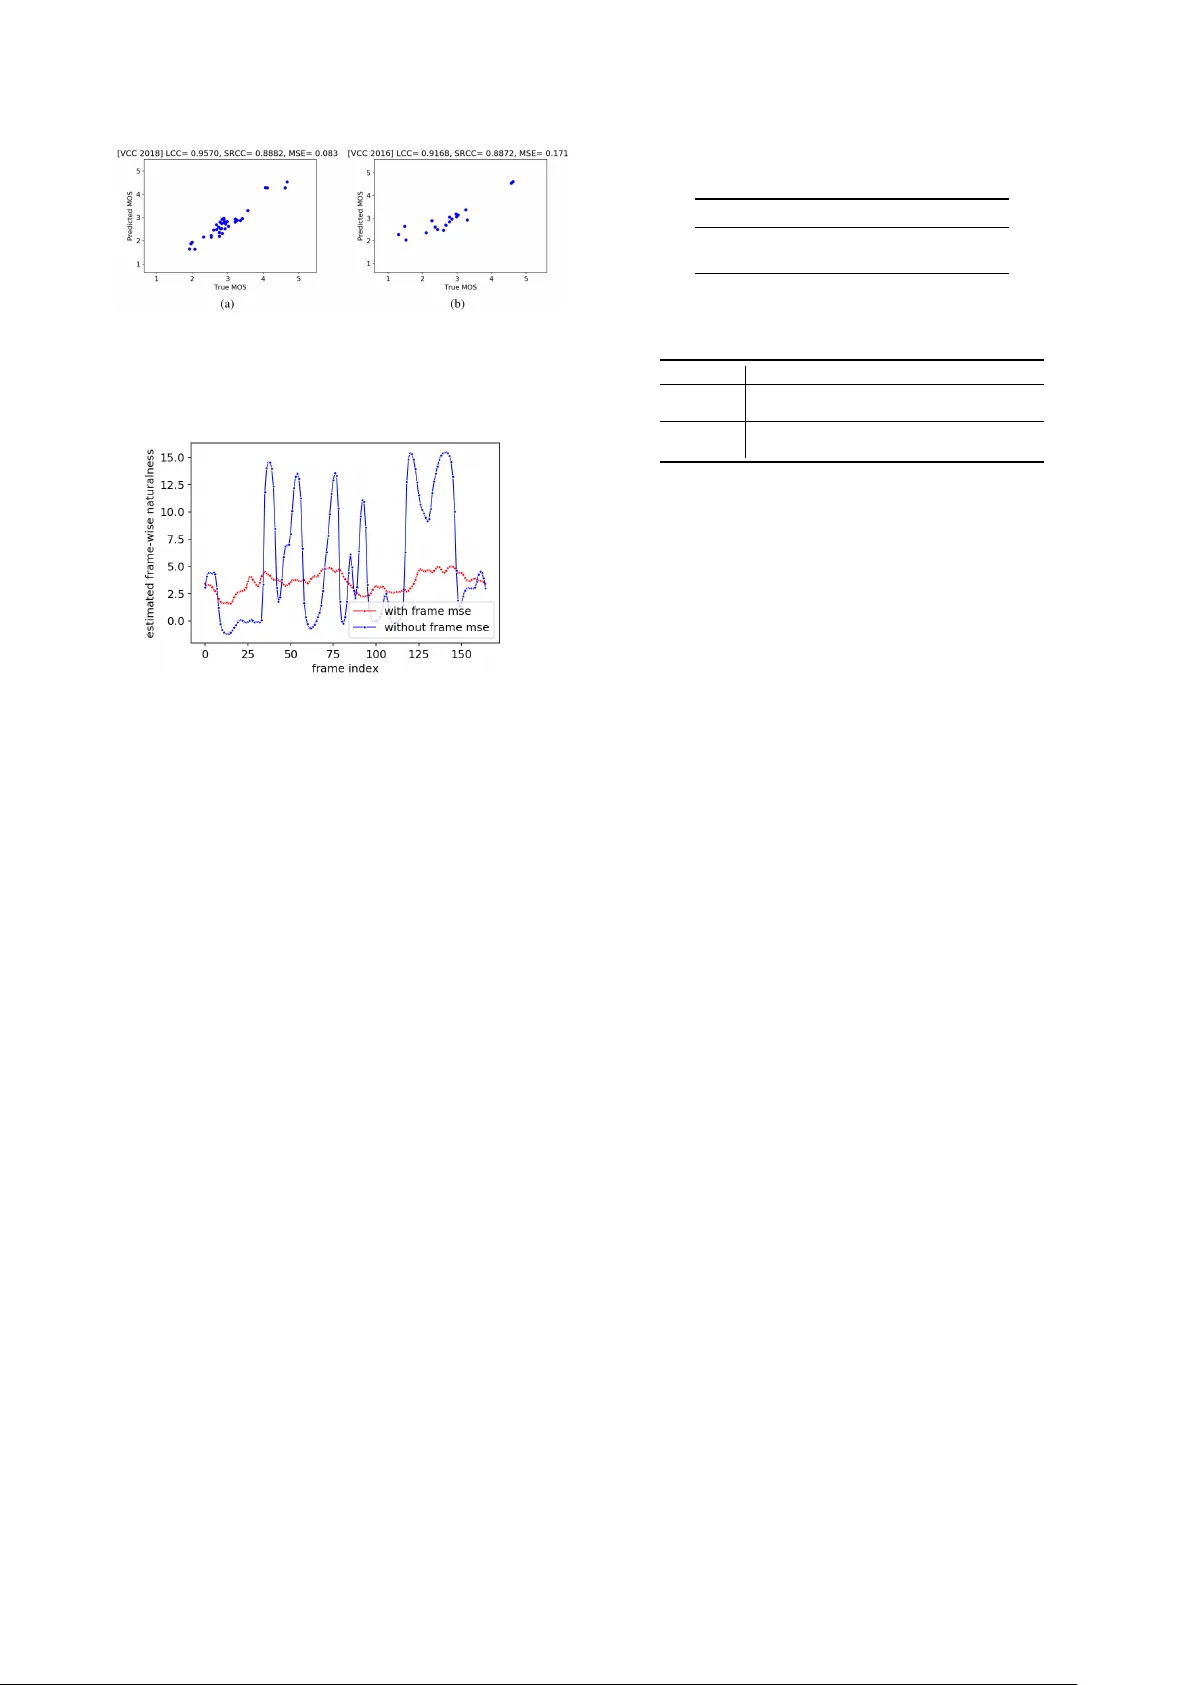
MOSNet: Deep Learning-based Objecti ve Assessment f or V oice Con v ersion Chen-Chou Lo 1 , Szu-W ei Fu 2 , W en-Chin Huang 1 , Xin W ang 3 , J unichi Y amagishi 3 , Y u Tsao 2 , Hsin-Min W ang 1 1 Institute of Information Science, Academia Sinica, T aipei, T aiwan 2 Research Center for Information T echnology Innov ation, Academia Sinica, T aipei, T aiwan 3 National Institute of Informatics, Japan { lochenchou,unilight,whm } @iis.sinica.edu.tw; { jasonfu,yu.tsao } @citi.sinica.edu.tw; { wangxin,jyamagis } @nii.ac.jp Abstract Existing objectiv e ev aluation metrics for v oice con version (VC) are not always correlated with human perception. There- fore, training VC models with such criteria may not effecti vely improv e naturalness and similarity of conv erted speech. In this paper , we propose deep learning-based assessment models to predict human ratings of con v erted speech. W e adopt the con- volutional and recurrent neural network models to b uild a mean opinion score (MOS) predictor , termed as MOSNet. The pro- posed models are tested on lar ge-scale listening test results of the V oice Con version Challenge (VCC) 2018. Experimental re- sults show that the predicted scores of the proposed MOSNet are highly correlated with human MOS ratings at the system lev el while being fairly correlated with human MOS ratings at the utterance le vel. Meanwhile, we have modified MOSNet to predict the similarity scores, and the preliminary results show that the predicted scores are also fairly correlated with human ratings. These results confirm that the proposed models could be used as a computational e valuator to measure the MOS of VC systems to reduce the need for expensi ve human rating. Index T erms : speech naturalness assessment, speech quality assessment, MOS, voice con v ersion, non-intrusiv e, 1. Introduction The quality quantification of generated speech has been a long- standing problem in speech synthesis, speech enhancement, and voice conv ersion (VC) systems. The e valuation of these sys- tems reports both objective and subjectiv e measurements. In the VC community , objective measures such as the Mel-cepstral distance (MCD) [1] are widely used for automatically measur- ing the quality of conv erted speech. Howe ver , such metrics are not always correlated with human perception as they measure mainly the distortion of acoustic features. Subjective measures such as the mean opinion score (MOS) and similarity score could represent the intrinsic naturalness and similarity of a VC system, b ut these type of ev aluations are time-consuming and expensi ve as they need large number of participants to undergo listening tests and provide perceptual ratings. Many assessment algorithms and models have been pro- posed to overcome the abov e-mentioned problem. For instance, in the speech enhancement field, the perceptual e valuation of speech quality (PESQ) [2] released by ITU-T is an intrusiv e as- sessment for measuring the quality of enhanced speech because a golden reference is needed for evaluation. There are sev eral non-intrusiv e assessment metrics [3, 4, 5, 6, 7, 8, 9, 10] for ev aluating the quality of enhanced speech and synthetic speech. For instance, Fu et al. [7] proposed Quality-Net as a quality as- sessment model based on bidirectional long short-term mem- ory (BLSTM) to predict the utterance-le vel quality of enhanced speech in a frame-wise manner . The high correlation between the predicted scores and the PESQ scores confirmed its ef fec- tiv eness as a non-intrusiv e assessment model for speech en- hancement. Y oshimura et al. [6] proposed a naturalness pre- dictor for synthetic speech based on a fully connected neural network and a con v olutional neural network (CNN) to predict the utterance-le vel and system-lev el MOS. The model was con- ducted on handcrafted features and trained with large-scale lis- tening test ratings. It is worth noting that both [6] and [8] hav e reported a high variance in the utterance-level human ratings since the listening test is subjectiv e and listeners may provide variant ratings to the same utterance. Therefore, it is difficult for an assessment model to get a high correlation with human utterance-lev el ratings. Nev ertheless, the system-lev el predic- tion would be relati vely reliable. Pre vious works have sho wn the capability of neural networks in modeling human percep- tion for enhanced synthetic speech. Howe ver , there is no such assessment model for VC systems. Our goal is to develop a speech naturalness and similarity assessment model for VC sys- tems using large-scale listening test results of the V oice Con ver - sion Challenge (VCC) 2018 [11]. In this paper , we present a nov el deep learning based end- to-end speech naturalness assessment model, termed MOSNet. T o develop such objective measures to model and align with human subjective ratings, we inv estigated the con volutional neural netw ork (CNN), bidirectional long short-term mem- ory (BLSTM), and CNN-BLSTM, as these architectures have shown their capability to model human perception. W e used such architectures for extracting valuable features and then used fully connected (FC) layers to predict the corresponding nat- uralness scores. In virtue of the capacity of neural networks and the large-scale human naturalness e valuations of the VCC 2018, the MOS prediction of our naturalness assessment model achiev ed high correlation with human MOS ratings at the sys- tem lev el and fair correlation at the utterance level. In addition, we modified MOSNet to predict the similarity scores, and the preliminary results showed that the predicted similarity scores are fairly correlated with human similarity ratings. The experi- mental results sho wed that our proposed models have high ca- pability to measure speech naturalness and similarity of VC sys- tems. As per our kno wledge, this is the first deep learning-based speech quality and similarity assessment model for VC. The paper is organized as follo ws: The data and its distrib u- tion from VCC 2018 are described in Section 2. The proposed models are presented in Section 3. The experiments and results are discussed in Section 4. Finally , the conclusions and future work are presented in Section 5. 2. The V oice Con version Challenge Evaluation Data 2.1. The V oice Conversion Challenge 2018 The V oice Conv ersion Challenge (VCC) 2018, the second edi- tion of VCC, is a large-scale voice con version challenge. The VCC 2018 corpus was prepared by selecting a part of speak- ers from the device and production speech (D APS) dataset [12] recorded by professional US English speakers in a clean and noise-free en vironment. Participants in the challenge needed to use their VC systems trained by parallel or non-parallel train- ing data to con vert speech signals from a source speaker to a target speaker . All the parallel and non-parallel VC systems participating in the challenge had been ev aluated in terms of naturalness and similarity scores via cro wd-sourcing listening tests. The ev aluation of the VCC 2018 was as follo ws: There were 2,572 evaluation sets, each consisting of 44 utterances. A total of 113,168 human ev aluations fully covered 28,292 submitted audio samples. Each audio sample was rated by 4 listeners. 113,168 e valuations were split into 82,304 natural- ness assessments and 30,864 speaker similarity assessments. 82,304 naturalness ev aluations covered 20,580 submitted utter- ances with MOS ranging from 1 to 5, with lo west score of 1 and highest score of 5. The detailed specification of the corpus, listeners and ev aluation methods can be found in [11]. W e took the av erage score of the four MOS ratings for each utterance as its ground-truth score. 2.2. Data along with its distribution and predictability The histograms of the mean and standard deviation of the four MOS ratings for each utterance are sho wn in Figure 1. It can be seen that the distribution of the mean MOS is closer to a Gaussian, and the mean MOS values are concentrated around 3.0. Howev er , for about half of the submitted utterances, the standard deviation of the four MOS ratings is greater than 1, suggesting a higher degree of v ariation in the scores. This is expected because the perceptual ratings for the same utterance depend on the listeners’ personal experiences and preferences when conducting listening tests. Therefore, we established that it is important to consider the intrinsic predictability of data and the inherent correlation among listeners. In this study , we used the bootstrap method in [6, 13, 14] to verify the inherent pre- dictability of human ev aluations in the VCC 2018. W e took 1,000 replications to estimate the MOS correla- tion between each subset and the whole dataset. Note that the MOS ev aluations of natural speech was excluded. For each replication, we randomly sampled 134 listeners from a total of 267 listeners to measure their mean MOS as MOS sub . Then, MOS sub was compared to MOS all (computed using the entire set of MOS ratings) in terms of the linear correlation coefficient (LCC) [15], Spearman’ s rank correlation coef ficient (SRCC) [16] and mean square error (MSE). The a verage LCC, SRCC, and MSE values are sho wn in T able 1. Hence, it became clear that LCC and SRCC are quite high at the system level but lower at the utterance lev el. MSE shows a similar trend. The results indicate that although subjectiv e perceptual ratings of different listeners vary at the utterance lev el, they ha ve good consistenc y at the system le vel. This analysis sho ws that although the MOS at the system level is predictable, b ut, the MOS at the utterance lev el can be predicted only up to a certain extent, although not as good as the prediction at the system lev el. Figure 1: Histograms of the mean (a) and standard de viation (b) of four MOS ratings for eac h utterance in the VCC 2018. T able 1: Inher ent correlation of human evaluations in the VCC 2018 at the utterance and system le vels. Level LCC SRCC MSE Utterance 0.805 0.806 0.396 System 0.994 0.978 0.005 3. MOSNet This paper proposes a deep learning-based objecti ve assessment to model human perception in terms of MOS, referred to as MOSNet. Raw magnitude spectrogram is used as the input feature and three neural network-based models, namely CNN, BLSTM and CNN-BLSTM are used to extract valuable features from the input features of the fully connected (FC) layers and pooling mechanism to generate predicted MOS. In the follow- ing sections, we will detail each component of MOSNet. 3.1. Model details The detailed configuration of different architectures of MOSNet is shown in T able 2, including CNN, BLSTM, and CNN- BLSTM. The BLSTM architecture is the same as the one used in Quality-Net [7]. In virtue of forward and backward process- ing through time, BLSTM has the ability to inte grate long-term time dependencies and sequential characteristics into represen- tativ e features. CNN has been widely used to model time series data and yielded satisfactory performance. CNN expands its receptiv e field through stacking more con v olutional layers. The architecture of CNN used in this study has 12 con volutional lay- ers, its recepti ve field for each neuron in the last conv olutional layer is 25 frames (around 400 ms in the time-scale). W e belie ve that, by considering the segment of 25 frames, the MOSNet can capture more temporal information to predict the quality scores. Recent studies have confirmed the effecti veness of combining CNN and RNN (BLSTM) for enhancement [17, 18], classifica- tion [19, 20], and recognition [21, 22] tasks. Thus, we also in- vestigate the CNN + BLSTM architecture for feature extraction in the MOSNet, which is referred to as CNN-BLSTM in T able 2 and in subsequent discussions. With the extracted features, we use two FC layers to regress frame-wise features into a frame- lev el scalar to indicate the naturalness score of each frame. Fi- nally , a global averaging operation is applied to the frame-lev el scores to obtain the utterance-lev el naturalness score. 3.2. Objective function As described in the previous section, we formulate MOS pre- diction as a regression task. The input of the MOSNet is a se- quence of spectral features, extracted from a speech utterance. The MOS ev aluations of VCC 2018 are used as the ground-truth to train the model. Fu et al. [7] stated that by using frame-lev el prediction errors in the objective function, utterance-level pre- dictions will be more correlated with human ratings. Thus, we T able 2: Configuration of differ ent model arc hitectur es. The con volutional layer parameters are denoted as “con v { receptive field size } - { number of channels } / { stride } . ” The ReLU [23] ac- tivation function after eac h con volutional layer is not shown for br evity . N is for the number of frames. model BLSTM CNN CNN-BLSTM input layer input ( N X 257 mag spectrogram ) con v . layer conv 3 − ( channels ) / 1 conv 3 − ( channels ) / 1 conv 3 − ( channels ) / 3 X 4 channels = [16, 32, 64, 128] recurrent layer BLSTM-128 BLSTM-128 FC layer FC-64, ReLU, dropout FC-64, ReLU, dropout FC-128, ReLU, dropout FC-1 ( frame-wise scores) output layer av erage pool ( utterance score ) T able 3: Utterance-level and system-level pr ediction results for differ ent models, wher e the subscript denotes the batch size . utterance-level system-level Model batchsize LCC SRCC MSE LCC SRCC MSE BLSTM 1 [7] 0.511 0.484 0.604 0.826 0.808 0.165 BLSTM 16 0.487 0.453 0.658 0.818 0.797 0.190 BLSTM 64 0.251 0.254 0.803 0.412 0.427 0.404 CNN 1 0.638 0.587 0.486 0.945 0.875 0.058 CNN 16 0.620 0.573 0.512 0.944 0.890 0.067 CNN 64 0.624 0.585 0.522 0.946 0.872 0.057 CNN-BLSTM 1 0.584 0.551 0.634 0.951 0.873 0.135 CNN-BLSTM 16 0.607 0.569 0.540 0.944 0.897 0.055 CNN-BLSTM 64 0.642 0.589 0.538 0.957 0.888 0.084 formulate the objectiv e function for training the MOSNet as: O = 1 S S X s =1 [( ˆ Q s − Q s ) 2 + α T s T s X t =1 ( ˆ Q s − q s,t ) 2 ] (1) where ˆ Q s and Q s denote the ground-truth MOS and predicted MOS for the s -th utterance, respecti vely , α is the weighting f ac- tor , q s,t denotes the frame-le vel prediction at time t , T s is the total number of frames in the s -th utterance, and S denotes the number of training utterances. Notably , the objective function in Eq. (1) combines the utterance-le vel MSE and frame-le vel MSE. In [7], the weighting factor ( α ) was used to mitigate se- vere MSE variations across frames in a speech enhancement task. Our preliminary experiments show that the quality of con verted speech is much more stable across frames compared to the quality of enhanced speech. Specifically , the conv erted speech generated from a high MOS VC system typically pro- duces high frame-wise MOSs, and vice versa. Thus, we set the weighting factor α to 1 in this study . T o compute the frame- lev el MSE, the ground-truth MOS is used for all the frames in the speech utterance. From the experiments, it can be estab- lished that the frame-le vel MSE helps MOSNet con verge with better prediction accuracy , which will be discussed in the next section. Figure 2: Scatter plot (a) and histogram (b) of the utterance- level pr edictions of CNN-BLSTM 64 . 4. Experiments In this section, different model architectures will be e v aluated and the results at the utterance and system lev els will be dis- cussed. W e explain our implementation details first. The en- tire set of 20,580 speech samples (along with the corresponding MOSs) were divided into 13,580, 3,000 and 4,000 samples for training, v alidation and testing, respecti vely . All speech sam- ples were down-sized to 16 kHz. For feature extraction, we conducted short-time Fourier transform (STFT) of 512 sample points (i.e., 32 ms frame size) ev ery 256 sample points (i.e., 16 ms frame shift), which resulted in a sequence of frame- based spectral feature of 257 dimensions for each utterance. For the MOSNet, the dropout [24] rate was set to 0.3. The model was trained by the Adam [25] optimizer with a learning rate of 0.0001, without batch normalization. W e applied early stopping based on the MSE of the validation set with 5 epochs patience. 4.1. Comparison of different model architectures First, we intend to compare the prediction performance of dif- ferent models. T able 3 sho ws the LCC, SRCC and MSE val- ues of these models with different batch sizes at the utterance and system levels. The model BLSTM 1 used in [7] is consid- ered to be the baseline system. From T able 3, BLSTM 1 yielded 0.511 in terms of LCC, and its performance dropped drasti- cally when the batch size increased, as zero-padding might af- fect the prediction performance. Next, the CNN-based models yielded more stable results when the batch size increased and boosted the LCC from 0.511 to 0.638. Among all the mod- els, CNN-BLSTM 64 achiev ed the best LCC of 0.624, indicat- ing that the combination of CNN (for feature extraction) and BLSTM (considering time dependencies) could effecti vely ex- tract features from the spectrogram to perform MOS prediction. CNN-BLSTM 64 also achiev ed the highest LCC of 0.957 at the system level, which is very close to the LCC of 0.994 for human ev aluation sho wn in T able 1. 4.1.1. Evaluated r esults at the utterance level Figure 2 shows a scatter plot and histogram of the utterance- lev el predictions of CNN-BLSTM 64 . As seen from Figure 2 (a), the model a voided low predictions although there were quite a few training samples in the lo w MOS, and the predictions were mainly distributed around scores of 2 to 3. Figure 2 (b) sho ws that MOSNet rarely predicted MOS between 3.5 to 4 and mostly predicted MOS between 1.5 and 3.5. As the a verage MOS of the submitted systems fell mainly between 2 to 3.5 at the sys- tem le vel, it is reasonable for the model to a void prediction of such low and high scores. This is a common limitation when using MSE-based objective functions for the data is in a Gaus- sian distribution. It can be improv ed by using other objecti ve functions, which can be a scope of future research. Figure 3: Scatter plot of system-level pr edictions on the testing set in (a) the VCC 2018 and (b) the VCC 2016. Figure 4: F rame-wise MOS pr edictions of CNN-BLSTM 64 . 4.1.2. Evaluated r esults at the system level Figure 3 (a) sho ws the scatter plot of system-le vel predictions by CNN-BLSTM 64 for the VCC 2018. System-lev el predic- tions were highly correlated with human ev aluations. The re- sults sho wn in Figure 3 (a) and T able 3 confirmed the ef fectiv e- ness of the proposed MOSNet as a substitute for human listeners to ev aluate VC systems. T o test the generalization of MOSNet, we applied CNN- BLSTM 64 trained by the VCC 2018 data to the VCC 2016 data. The scatter plot of system-le vel predictions is shown in Figure 3 (b). Although, the audio samples in both VCC 2016 and VCC 2018 came from the D APS dataset, the selected speakers for testing of VCC 2016 were different from those of VCC 2018. The participating VC systems for the two challenges were also different. As the pair correspondence results for audio samples were not accessible, we could only report the system-level pre- diction results. Figure 3 (b) sho ws that MOSNet achie ved a suf- ficiently high correlation of 0.917 for system-level predictions, thereby confirming its generalization ability in a training-testing mismatched scenario. 4.2. The effect of the frame-level MSE Here, we intend to inv estigate the effect of the frame-level MSE used in the objective function in Eq. (1). Figure 4 and T a- ble 4 shows the effect of training with or without the frame- lev el MSE on the CNN-BLSTM 64 model (the best system in T able 3). As seen in Figure 4, the estimated frame-wise scores vary greatly when the model was trained without the frame- lev el MSE, but are relativ ely stable when the model was trained with the frame-level MSE. Unstable frame-wise predictions af- fect the final utterance-level predictions. T able 4 shows that with frame-lev el MSE, the LCC of utterance-lev el predictions was 0.6424, and it dropped significantly to 0.5604 when the model was trained without the frame-le vel MSE. T able 4: The effect of frame-level MSE on the utterance-le vel pr edictions of CNN-BLSTM 64 . LCC SRCC MSE with frame MSE 0.642 0.589 0.538 without frame MSE 0.560 0.528 2.525 T able 5: Similarity prediction r esults of the modified MOSNet model. model Level A CC LCC SRCC MSE CNN utterance 0.696 0.453 0.455 0.197 (scalar) system 0.701 0.394 0.395 0.195 CNN utterance 0.670 0.329 0.329 0.336 (2 classes) system 0.674 0.292 0.292 0.326 4.3. Experiments on similarity prediction The similarity in the measurement of the conv erted speech and the target speech is another k ey indicator of the success of VC systems. In addition to predicting the MOS, we also tried to ex- tend the MOSNet to predict the similarity scores. As there were two input audio samples at the same time, we applied a shared CNN (with the same architecture as described in T able 2) to extract features into latent vectors for both the input samples. The paired vectors were combined to form a concatenated fea- ture vector and inferred by two FC layers and a SoftMax layer to generate the final predicted score. T wo models with dif ferent types of output were created: the first model had a scalar output, and the output of the second model was a two-class v ector . In VCC 2018, there were 30,864 e v aluated similarity scores. Each similarity score was obtained by evaluating a pair of speech samples with 4 lev els. W e merged scores 1 and 2 as label 1 (same speaker), and scores 3 and 4 as label 0 (dif- ferent speaker). The dataset was divided into 80% and 20% for training and testing, respecti vely . The similarity prediction results of the two models are shown in T able 5. From the ta- ble, we found that when the model is trained with one scalar output, it can achiev e an accuracy of 69.6%, which is notably higher than 66.9% yielded by the two-class model. The results in T able 5 confirmed that the modified MOSNet can be used to predict similarity scores with fair correlation values to human ratings. 5. Conclusions This paper presented a deep learning-based quality assessment model for the VC task, referred to as MOSNet. Based on large- scale human perceptual MOS ev aluation results from VCC 2018, our experimental results sho w that MOSNet yields pre- dictions with a high correlation to human ratings at the system lev el and a fair correlation at the utterance level. W e hav e shown decent generalization capability of MOSNet by applying the model trained with the VCC 2018 data to the VCC 2016 data. Moreov er , with a slight modification, MOSNet can fairly pre- dict the similarity scores of the con verted speech relative to the target speech. As per our knowledge, the proposed MOSNet is the first end-to-end speech objective assessment model for VC. In future, we will consider the human perception theory and im- prov e the model architecture and objecti ve function of MOSNet to attain improv ed correlation with human ratings. Acknowledgements : W e are grateful to the VCC for releasing the ev aluation data of the VCC 2018. 6. References [1] R. K ubichek, “Mel-cepstral distance measure for objecti ve speech quality assessment, ” in Pr oc. IEEE P acific Rim Confer ence on Communications Computers and Signal Pr ocessing , vol. 1, 1993, pp. 125–128. [2] A. W . Rix, J. G. Beerends, M. P . Hollier, and A. P . Hekstra, “Per- ceptual evaluation of speech quality (PESQ)-a new method for speech quality assessment of telephone networks and codecs, ” in Pr oc. ICASSP , 2001, pp. 749–752. [3] M. Cernak and M. Rusko, “ An ev aluation of synthetic speech us- ing the PESQ measure, ” in Pr oc. F orum Acusticum , 2005. [4] D.-Y . Huang, “Prediction of perceived sound quality of synthetic speech, ” in Pr oc. APSIP A ASC , 2011. [5] U. Remes, R. Karhila, and M. Kurimo, “Objective evaluation measures for speaker-adapti ve HMM-TTS systems, ” in Proc. SSW , 2013. [6] T . Y oshimura, G. Eje Henter, O. W atts, M. W ester , J. Y amagishi, and K. T okuda, “ A hierarchical predictor of synthetic speech nat- uralness using neural networks, ” in Proc. Interspeech , 2016, pp. 342–346. [7] S.-W . Fu, Y . Tsao, H.-T . Hwang, and H.-M. W ang, “Quality-Net: An end-to-end non-intrusive speech quality assessment model based on BLSTM, ” in Pr oc. Inter speech , 2018. [8] B. Patton, Y . Agiomyrgiannakis, M. T erry , K. W . Wilson, R. A. Saurous, and D. Sculley , “ AutoMOS: Learning a non-intrusiv e assessor of naturalness-of-speech, ” in Pr oc. NIPS End-to-end Learning for Speech and A udio Pr ocessing W orkshop , 2016. [9] A. R. A vila, H. Gamper, C. Reddy , R. Cutler , I. T ashev , and J. Gehrke, “Non-intrusi ve speech quality assessment using neu- ral networks, ” in Proc. ICASSP , 2019. [10] T . H. Falk and W . Y . Chan, “Single-ended speech quality mea- surement using machine learning methods, ” IEEE T ransactions on Audio, Speech, and Language Processing , vol. 14, no. 6, pp. 1935–1947, Nov 2006. [11] J. Lorenzo-Trueba, J. Y amagishi, T . T oda, D. Saito, F . V illavicen- cio, T . Kinnunen, and Z. Ling, “The voice conversion challenge 2018: Promoting development of parallel and nonparallel meth- ods, ” in Pr oc. Odysse y The Speaker and Language Recognition W orkshop , 2018, pp. 195–202. [12] G. J. Mysore, “Can we automatically transform speech recorded on common consumer devices in real-world environments into professional production quality speech? — a dataset, insights, and challenges, ” IEEE Signal Pr ocessing Letters , vol. 22, no. 8, pp. 1006–1010, 2015. [13] B. Efron and R. J. Tibshirani, An Intr oduction to the Bootstrap . CRC Press LLC, 1993. [14] M. Bisani and H. Ney , “Bootstrap estimates for confidence inter- vals in ASR performance e valuation, ” in Pr oc. ICASSP , 2004. [15] K. Pearson, “Notes on The History of Correlation, ” Biometrika , vol. 13, no. 1, pp. 25–45, 10 1920. [Online]. A v ailable: https://doi.org/10.1093/biomet/13.1.25 [16] C. Spearman, “The proof and measurement of association between two things, ” The American Journal of Psycholo gy , vol. 15, no. 1, pp. 72–101, 1904. [Online]. A vailable: http://dx.doi.org/10.2307/1412159 [17] H. Zhao, S. Zarar , I. T ashe v , and C.-H. Lee, “Conv olutional- recurrent neural networks for speech enhancement, ” in Pr oc. ICASSP , 2018, pp. 2401–2405. [18] K. T an and D. W ang, “ A conv olutional recurrent neural network for real-time speech enhancement, ” in Pr oc. Interspeech , 2018, pp. 3229–3233. [19] T . Sainath, O. V inyals, A. Senior, and H. Sak, “Conv olutional, long short-term memory , fully connected deep neural networks, ” in Pr oc. ICASSP , 2015, pp. 4580–4584. [20] X. Lu, P . Shen, S. Li, Y . Tsao, and H. Kawai, “T emporal attentiv e pooling for acoustic ev ent detection, ” in Proc. Interspeech , 2018, pp. 1354–1357. [21] T . N. Sainath, R. J. W eiss, A. W . Senior, K. W . W ilson, and O. V in yals, “Learning the speech front-end with raw waveform CLDNNs, ” in Pr oc. Inter speech , 2015. [22] D. W ang, S. Lv , X. W ang, and X. Lin, “Gated conv olutional LSTM for speech commands recognition, ” in Pr oc. International Confer ence on Computational Science , 2018, pp. 669–681. [23] V . Nair and G. E. Hinton, “Rectified linear units improve restricted Boltzmann machines, ” in Pr oc. ICML . USA: Omnipress, 2010, pp. 807–814. [Online]. A v ailable: http: //dl.acm.org/citation.cfm?id=3104322.3104425 [24] N. Sri vasta va, G. Hinton, A. Krizhevsky , I. Sutske ver , and R. Salakhutdinov , “Dropout: A simple way to prevent neural networks from ov erfitting, ” Journal of Machine Learning Resear ch , vol. 15, pp. 1929–1958, 2014. [Online]. A vailable: http://jmlr .org/papers/v15/sri v astav a14a.html [25] D. P . Kingma and J. Ba, “ Adam: A method for stochastic opti- mization, ” CoRR , v ol. abs/1412.6980, 2015.
Original Paper
Loading high-quality paper...
Comments & Academic Discussion
Loading comments...
Leave a Comment