Improving Reverberant Speech Training Using Diffuse Acoustic Simulation
We present an efficient and realistic geometric acoustic simulation approach for generating and augmenting training data in speech-related machine learning tasks. Our physically-based acoustic simulation method is capable of modeling occlusion, specu…
Authors: Zhenyu Tang, Lianwu Chen, Bo Wu
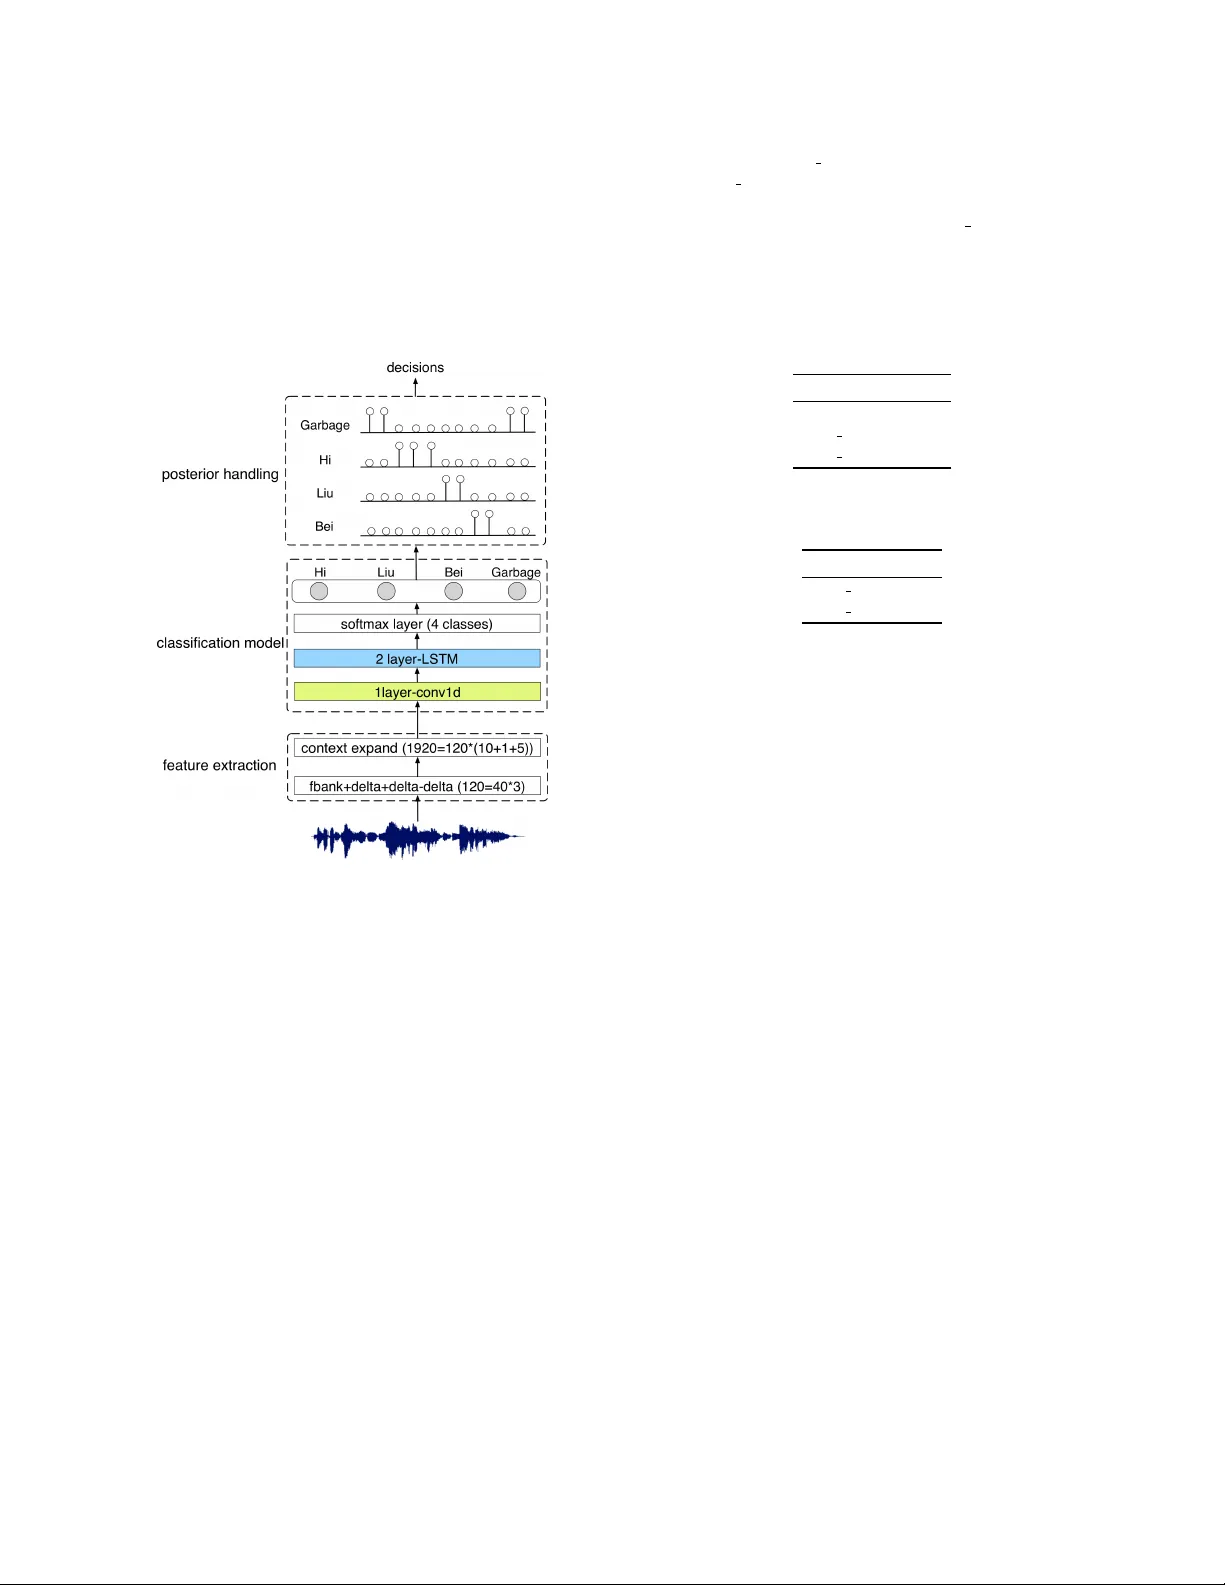
IMPR O VING REVERBERANT SPEECH TRAINING USING DIFFUSE A COUSTIC SIMULA TION Zhenyu T ang ? Lianwu Chen † Bo W u † Dong Y u † Dinesh Manocha ? ? Uni versity of Maryland † T encent AI Lab { zhy , dm } @cs.umd.edu, { lianwuchen, lambowu, dyu } @tencent.com ABSTRA CT W e present an efficient and realistic geometric acoustic simulation ap- proach for generating and augmenting training data in speech-related machine learning tasks. Our physically-based acoustic simulation method is capable of modeling occlusion, specular and diffuse reflec- tions of sound in complicated acoustic en vironments, whereas the classical image method can only model specular reflections in simple room settings. W e show that by using our synthetic training data, the same neural networks gain significant performance impro vement on real test sets in far-field speech recognition by 1.58% and keyw ord spotting by 21%, without fine-tuning using real impulse responses. Index T erms — rev erberation, diffuse reflection, speech recogni- tion, data augmentation, acoustic simulation 1. INTR ODUCTION Over the past fe w years, deep learning approaches have g ained signif- icant ground in the speech community , surpassing the performance of many classical machine learning models in a v ariety of related sub- fields. State-of-the-art deep neural networks (DNNs) are powerful tools for exploiting variable-length contextual information embed- ded in noisy speech sequences. Some very f amous applications of DNN techniques in speech include Microsoft Cortana ® , Apple Siri ® , Google Now ® , and Amazon Alexa ® . These applications usually in- tegrate se veral fundamental speech tasks such as speech enhancement and separation [ 1 , 2 ], automated speech recognition (ASR) [ 3 , 4 , 5 , 6 ], and keyw ord spotting (KWS) [ 7 , 8 ]. Another important enabling fac- tor behind the success of DNNs in these tasks is the huge amount of annotated speech corpus made av ailable by research groups and large companies. Deep learning theory indicates that having more training examples is crucial to reduce the generalization error of trained mod- els in real test cases [ 9 ]. Ho wever , the majority of popular speech corpuses were recorded under relatively ideal conditions, i.e. ane- choic speech with negligible noise and en vironmental reverberation. When training models for real-world applications, it is common to distort the clean speech by adding noise and rev erberation as a pre- processing step to augment the training data [ 10 , 11 ]. Rev erberation is a characteristic effect of a particular acoustic environment and can be described by impulse responses (IRs) or frequency responses. In practice, both recorded IRs and synthetic IRs hav e been used to con volv e with the clean speech. Significant improv ements in model accuracy ha ve been observ ed due to this type of data augmentation. Howe ver , there is still a performance gap when the application is This work is supported in part by AR O grant W911NF-18-1-0313, NSF grant #1910940, T encent, Adobe, Facebook and Intel. The authors thank Jie Chen and Dan Su from T encent for their help with the ASR and KWS systems. Project website https://gamma.umd.edu/pro/speech/asr deployed in conditions not matched to training conditions. IRs pre- recorded in a limited number of environments may not generalize well to infinite real-world conditions. Howe ver, it is in-efficient to shrink the gap by collecting more real-world IRs; recording IRs is not a trivial task because it requires professional equipment and trained people. An alternativ e and cost-effecti ve way is simulating room im- pulse responses (RIRs) by using acoustic simulators. A simple RIR simulator should take in the room geometry , source and listener posi- tions, and surface absorption/reflection properties, and generate an RIR for each source-listener pair . One classical approach is the image method (IM), which models specular sound reflections in rectangular rooms and has been prov en to w ork well in some tasks. Howe ver , one notable drawback of this method is its over -simplification of room acoustics by ignoring dif fuse reflections that are very common in real- world environments. Furthermore, it does not deal with occlusion. These limitations make the image method less realistic in terms of augmenting data, especially in applications where late re verberation plays a significant role. Main contribution: T o ov ercome limitations of existing simulation methods and better augment the training data, we propose an ef ficient and realistic geometric acoustic simulation approach that models occlusion, specular , and diffuse reflections, where sound ener gy can be reflected randomly and thus not follo wing an ideal specular path. W e sample 5000 different acoustic room configurations and use our method to simulate far-field sound propagation in each room. The speech training data is generated by randomly con volving o ver 1500 hours of clean speech utterances with simulated RIRs and adding en vironmental noise. W e train two different models independently based on 1D/2D con volution + long short-term memory (LSTM) structures for an ASR task and a KWS task, and then e valuate them on different real-world data. W e observ e accurac y impro vement using our method by 1.58% in terms of ASR and by 21% in terms of KWS. The rest of the paper is organized as follows. In Section 2 we explain our ray-tracing based geometric acoustic simulation algorithm. W e describe several speech training benchmarks in Section 3 and present our results in Section 4. 2. A COUSTIC SIMULA TION 2.1. Impulse Response Modeling Acoustic simulation engines have been used in computer aided de- signs (CAD), theoretical research, the game industry , and many other fields. The simulation goal is usually to observe ho w the sound pres- sure changes according to time at some position when there is a sound source at some other position in space. IR is the most common way to describe sound propagation between two points in a fixed envi- ronment, so we use IR ( x s , x r , t ) to denote the IR at time t from the point source at location x s to the listener at location x r . In practice, an IR can be measured by exciting an impulse using a shotgun as a sound source; the sound pressure is then recorded at the tar get re- ceiv er location. From a first principle view , the propagation of sound wa ves follow the acoustic wave equation [ 12 ], which describes the sound pressure variation in both spatial and temporal domain and is the foundation of wav e-based solvers. There are sev eral ways to implement wa ve-based solvers, including Finite Element Methods (FEM), Boundary Element Methods (BEM), finite-difference time domain (FDTD) approaches [ 13 ], and Adaptiv e Rectangular Decom- position (ARD) methods [ 14 ]. W av e-based techniques yield the most accurate results, but are only feasible for lo w frequencies and small scenes because the y do not scale well with space and time granularity . When the wav elength of the sound is smaller than the size of the obstacles in the en vironment, the sound wave can be treated in the form of a ray , which is the key idea of geometric methods. T ypical geometric methods include the image method [ 15 ], path tracing meth- ods [ 16 , 17 , 18 , 19 ], and beam or frustum tracing methods [ 20 , 21 ]. Our method is based on efficient Monte Carlo path tracing [22]. (a) Specular reflections (b) Dif fuse reflections Fig. 1 . T wo types of reflections of sound at a surface. Both phenom- ena are frequency dependent. 2.2. Sound Propagation From the perspectiv e of geometric methods, there are two types of reflections that can occur at a rigid surface: specular reflections and dif fuse reflections. Specular reflections occur at mostly flat and uniform surfaces and the outgoing direction of the sound ray is the same as the incident angle in Fig. 1(a), kno wn as Snell’ s La w in geometric optics. Howe ver , real-world object surfaces usually do not completely satisfy the specular condition and scatter sound energy in all directions according to Lambert’ s cosine-law , which is called diffuse reflections as illustrated in Fig 1(b). IRs are constructed by accumulating sound energy from both specular and dif fuse reflection paths with the correct time delay and energy decay , which can be calculated from the total length of the path. Con ventionally , an IR is decomposed into 3 parts: direct response, early reflections, and late rev erberation. The direct response is determined by the visibility between the source and listener . Early reflections are mostly due to specular reflections, whereas the late reverberation is caused by diffuse reflections. A typical IR ener gy distrib ution is shown in Fig. 2. Fig. 2 . Energy distrib ution of an impulse response in time. Our goal is to accurately model the late rev erberation effects in simulated IRs. 2.3. Image Method The image method is the current most widely used method in the speech community for generating RIRs in various learning-based tasks [ 23 ]. It is based on the principle of specular reflections where all reflection paths can be constructed by mirroring sound sources with respect to the reflecting plane, shown in Fig 3. A source will be mirrored multiple times depending on the desired order of reflections. Therefore, the image method fails to model the late re verberation part of an IR. Computationally , for a scene with one source, N reflectiv e surfaces, and reflection order d , the time comple xity is O ( N d ) , which is prohibitiv e for simulations at high orders or scene complexities. Fig. 3 . Construction and v alidation of image paths. The source S is mirrored into 5 image sources marked as S 1 ∼ S 5 by 5 planes. A sound path is connected to the listener L from each image source. Then a path v alidation is performed by checking whether the image path intersects with the plane that generates this image source. The path from S 1 to L does not intersect with plane 1; therefore it is infeasible and rejected. The other 4 image paths are valid and can be used to compute the IR analytically . 2.4. Diffuse Acoustic Simulation Diffuse reflections occur when sound energy is scattered into non- specular directions. Diffuse reflections are widely observ ed in real- world and have been sho wn to be important for modeling sound fields in room en vironments [ 24 , 25 , 26 ]. Dif fuse acoustic simulations correctly model not only the specular, b ut also the diffuse soundfield. W e propose our geometric acoustic simulation (GAS) method for this purpose. In contrast to the image method, our method is based on stochastic path tracing illustrated in Fig. 4: sound paths are randomly traced in all directions and each path follows either specular or diffuse reflections. W e explicitly define the scattering coefficient s between 0 and 1, which denotes the proportion of sound energy that is diffusely reflected at a surface (0 means perfectly specular and 1 means perfectly diffuse). Specifically , the sound energy L r reflected at a surface point x to direction ~ ω r is computed by integrating the incoming energy o ver a hemisphere Ω centered at x on the surface: L r ( x , ~ ω r ) = Z Ω f r ( x , ~ ω i → ~ ω r ) L i ( x , ~ ω i ) cos θ i dω i , (1) where θ is the incident angle, ~ ω i is the incoming direction, and f r ( x , ~ ω i → ~ ω r ) is the probability distribution function that describes the probability of generating the sound path from ~ ω i to ~ ω r , which is generic to include both specular and dif fuse reflections. In practice, Eq. 1 is recursive and can only be solved numerically using Monte Carlo integration. The diffuse reflection paths are generated by tracing random rays from the source, the listener , or both [ 27 ]. A large number of ray samples is required for solution con vergence. The complexity of Monte Carlo path tracing is O ( M log N ) , where M is the total number of rays traced to solve Eq. 1 and N is the number of surfaces in the scene. One of its computational adv antages over the image method is that most in valid paths that are generated, verified, and rejected in the image method are not considered in path tracing, so the number of surfaces does not greatly impact the efficiency of path tracing. This allows us to compute both early reflections and late rev erberation efficiently . In a far-field speech simulation setting, we define an acoustic room by its length, width, and height. Acoustic absorption and scat- tering coefficients can be defined for each surface element (triangular mesh), which determines the relativ e strength of diffraction. After specifying the sound source and recei ver locations within the room, our simulation generates an RIR. Detailed configurations are in Sec- tion 3.1. One speech-related problem that has benefited from more accurate simulations is the direction-of-arri val estimation task [ 28 ]. W e ar gue that using a more accurate geometric acoustic simulation that f aithfully models the late rev erberation for general speech-related training will lead to better performance in learning-based models. Fig. 4 . Monte Carlo path tracing for solving the sound transport problem. Ray samples are generated in random directions from the source S . Reflections upon hitting a plane are simulated by generating subsequent random rays while conserving the total energy . Once a ray intersects with the listener L , the energy is accumulated to the IR. 3. TRAINING WITH A COUSTIC SIMULA TION T o evaluate our proposed approach, we conduct far -field automated speech recognition and keyw ord spotting experiments and then com- pare our approach with the popular image method. Both e xperiments are rev erberant speech training tasks in which the test set is always real-world noisy re verberant speech recordings, but the training set can consist of clean speech or synthetic rev erberant speech generated by either the image method or our geometric acoustic simulation. 3.1. Impulse Response Generation W e consider a 6-microphone circular array with 7cm diameter with speakers and the microphone array randomly located in the room at least 0.3m away from the wall. Both the image method and the geometric sound simulation method were employed to simu- late the impulse response randomly generated from 5000 different room configurations with the size (length-width-height) ranging from 3m-3m-2.5m to 8m-10m-6m. The distance between the speaker and microphones ranges from 0.5m to 6m. The re verberation time T60 is sampled in a range of 0.05s to 0.5s. In general, there are two IR sets, each with 5000 IRs generated with the image method and the geometric sound simulation method, respectively . The IRs were used for data augmentation in ASR and KWS tasks. 3.2. A utomated Speech Recognition 3.2.1. Data The training corpus consists of two sets: (i) a clean corpus of 1.5 million clean speech utterances that translates to about 1500 hours in total and (ii) a noisy far -field training set simulated based on the clean corpus by adding reverberations and mixing with v arious en vironmental noises with SNRs ranging from 0 to 24 dB. F or each IR generation method, the corresponding noisy far -field training set was generated using the IRs described in Section 3.1, and the first channel of simulated data w as used as the input to the ASR system. The clean speech was first used to train the acoustic model and then both the clean speech and the simulated noisy speech were used to fine-tune the model. Depending on which of the two IR simulation methods were used to generate the noisy training sets, we got two acoustic models, one for the image method and one for the GAS method. The dataset sizes for clean, the image method, and the GAS method are the same. The testing corpus contains 2000 utterances of real far-field recording from 48 speakers; each utterance is 5 seconds on av erage and the whole set is about 3 hours. The data is recorded in 5 different rooms with sizes of about 4m-4m-3m. The distances between the microphones and the speaker are randomly set as 0.5 m, 1 m, 3 m and 5 m, and the SNR ranges from 5 to 20dB with the background noise of an air-conditioning or f an. Fig. 5 . The framework of our ASR system used for e valuations. 3.2.2. Model Configuration The framework of the ASR system is shown in Fig. 5 and consists of feature extraction, an acoustic model [ 29 ], and a decoder . 40- dimensional Mel filter bank features were computed with a 25-ms window length and a 10-ms hop size to form a 120-dimensional vector along with their first and second order dif ferences. After nor- malization, the feature vector of the current frame is concatenated with that of the 5 preceding and 5 subsequent frames, resulting in an input vector of dimension 1320 = 120 × (5 + 1 + 5). The acoustic model contains two 2-dimensional con volutional layers, each with a kernel size of (3, 3) and a stride of (1, 1), follo wed by a maxpooling layer with a kernel size of (2, 2) and a stride of (2, 2), and then fi ve LSTM layers, each with 1024 hidden units and peepholes, and then one full-connection layer plus a softmax layer . Batch normalization is applied after each CNN and LSTM layer to accelerate conv er- gence and improv e model generalization. W e use context-dependent (CD) phonemes as the output units, which form 12000 classes in our Chinese ASR system. The Adam optimizer was adopted with an initial learning rate of 0.0001. A 5-gram language model with size of 190 GB was used. The vocab ulary’ s size was 280K and the training corpus was collected from news, blogs, messages, encyclopedias, etc. 3.3. Keyw ord Spotting 3.3.1. Data The original training corpus contains 2500 hours of clean speech data, including 1250 hours of target keyword “Hi, Liu Bei” and 1250 hours of negati ve speech samples. The corresponding multi-channel rev erberant data was simulated using each IR generation method. Noises with SNRs ranging from 0 to 24dB were also added into the augmented speech. The 2500 hours of simulated rev erberant data are used for model training. The test corpus contains 8000 utterances with target keyword randomly selected from real user data from smart-speakers in a typical li ving room scenario, as well as 33 hours of negati ve samples from dif ferent categories, including music, TV noise, chatter, and other indoor noises. The 6-channel microphone signals were processed by an MVDR beamformer [ 30 ], and the output enhanced mono-channel signal was used for ke yword spotting. Fig. 6 . The framework of our KWS system used for e valuations. 3.3.2. Model Configuration The framew ork of the ke yword spotting system, which is similar to [ 7 ] is shown in Fig. 6, comprising feature e xtraction, a classification model, and a posterior handling module. The 40-dimensional Mel filter bank features were computed with a 25-ms windo w length and a 10-ms hop size, and then combined with the first and second order differences to form a 120-dimensional frame feature. The current frame feature was concatenated with the 10 preceding frames and 5 subsequent frames, resulting in an input vector of dimension 1920=40 × 3 × (10 + 1 + 5). The classification model contains one layer of 1D CNN [ 31 ] with a kernel size of 4 and is follo wed with a maxpooling layer with a kernel size of 3. The output of the CNN is passed to two layers of LSTM (hidden units 256) and then to a softmax layer with 4 (3 words + 1 garbage) output classes. Cross entropy is used for loss calculation. The outputs were then passed through a posterior handling module to obtain decisions. The final ke yword score is defined as the largest product of the smoothed posteriors in an input sliding window , subject to the constraint that the individual words “fire” in the same order as specified in the keyw ord. 4. RESUL TS AND ANAL YSIS T able 1 shows the character accurac y of ASR systems achieved with the clean acoustic model (Clean), the noisy acoustic model based on the image method (Noisy IM), and the geometric sound simulation method (Noisy GAS). W e collected 2K real-world test utterances that are corrupted by rev erberations and noises to ev aluate IR methods. Compared with the “Clean” setup, the “Noisy IM” setup improved the system performance significantly by adding simulated noisy train- ing data. Our proposed approach outperformed the image method by increasing the accurac y from 59.96% to 61.54%, illustrating the supe- riority of the proposed realistic geometric sound simulation approach. T able 1 . Character accuracy of ASR systems. Our GASmethod has the highest accuracy and outperforms IM by 1.58%. Model % Clean 31.178 Noisy IM 59.961 Noisy GAS 61.540 T able 2 . Equal error rates of KWS systems. Our GASmethod has the lowest equal error rate and results in a 21% error reduction relati ve to that of IM. Model % Noisy IM 1.48 Noisy GAS 1.17 The equal error rates (EERs) of keyword spotting systems are shown in T able 2. These results indicate that we can achiev e an EER of 1.17% and 1.48% when the augmented training data was generated using the geometric sound simulation method and the image method, respectiv ely . This translates to a 21% EER reduction. In these experiments, the input to the ke yword spotting system is the enhanced speech from an MVDR beamformer . This indicates that the proposed IRs are rob ust to multichannel signal processing algorithms. In both experiments, we carefully controlled the training and ev aluation conditions, where the only dif ference is the RIR simulation method. Due to our faithful simulation of dif fuse sound reflections, the domain gap between synthetic training data and real data is further reduced and therefore we observe significant accurac y gains. 5. DISCUSSION AND FUTURE WORK In this paper , we described a geometric acoustic simulation method that simulates both the specular and the diffuse soundfields for re- verberant speech training. On the speech recognition and keyword spotting tasks, we showed that the proposed approach outperformed the popular image method, where the gain is mostly attributable to the more realistic simulation of rev erberation and diffuse reflections. One limitation of this work is that neither method can model low- frequency or dif fraction phenomena. A partial solution would be to compensate RIRs at low-frequenc y bands [32]. Although we demonstrated the ef ficacy of the proposed approach mainly on speech recognition and keyword spotting tasks, we believ e a similar improv ement on performance can be achiev ed on tasks such as source localization [ 33 ], speech separation, and the cocktail problem [ 1 , 2 ], all of which can benefit from data-dri ven techniques and are future research directions. The proposed approach is thus of wide interest, especially because it can significantly reduce the effort of collecting training data under real-usage scenarios. 6. REFERENCES [1] J. R. Hershey , Z. Chen, J. Le Roux, and S. W atanabe, “Deep clustering: Discriminativ e embeddings for segmentation and separation, ” in 2016 IEEE International Confer ence on Acous- tics, Speech and Signal Pr ocessing (ICASSP) . IEEE, 2016, pp. 31–35. [2] D. Y u, M. K olbæk, Z.-H. T an, and J. Jensen, “Permutation in variant training of deep models for speaker-independent multi- talker speech separation, ” in 2017 IEEE International Confer- ence on Acoustics, Speec h and Signal Processing (ICASSP) . IEEE, 2017, pp. 241–245. [3] F . Seide, G. Li, and D. Y u, “Con versational speech transcrip- tion using context-dependent deep neural networks, ” in T welfth annual confer ence of the international speec h communication association , 2011. [4] G. E. Dahl, D. Y u, L. Deng, and A. Acero, “Context-dependent pre-trained deep neural networks for large-v ocabulary speech recognition, ” IEEE T ransactions on audio, speech, and lan- guage pr ocessing , vol. 20, no. 1, pp. 30–42, 2011. [5] W . Xiong, J. Droppo, X. Huang, F . Seide, M. Seltzer, A. Stol- cke, D. Y u, and G. Zweig, “The microsoft 2016 con versational speech recognition system, ” in IEEE International Confer ence on Acoustics , 2017. [6] D. Y u and J. Li, “Recent progresses in deep learning based acoustic models, ” IEEE/CAA Journal of automatica sinica , vol. 4, no. 3, pp. 396–409, 2017. [7] G. Chen, C. Parada, and G. Heigold, “Small-footprint keyword spotting using deep neural networks, ” 05 2014, pp. 4087–4091. [8] R. Prabhav alkar, R. Alv arez, C. Parada, P . Nakkiran, and T . N. Sainath, “ Automatic gain control and multi-style training for robust small-footprint k eyword spotting with deep neural net- works, ” 2015. [9] M. L. Seltzer , Y . Dong, and Y . W ang, “ An in vestigation of deep neural networks for noise rob ust speech recognition, ” in IEEE International Confer ence on Acoustics , 2013. [10] C. Kim, A. Misra, K. Chin, T . Hughes, A. Narayanan, T . N. Sainath, and M. Bacchiani, “Generation of lar ge-scale simulated utterances in virtual rooms to train deep-neural networks for far -field speech recognition in google home, ” in Interspeech , 2017. [11] M. Doulaty , R. Rose, and O. Siohan, “ Automatic optimization of data perturbation distributions for multi-style training in speech recognition, ” in Spoken Language T echnolo gy W orkshop , 2017. [12] R. P . Feynman, R. B. Leighton, and M. Sands, The F eynman lectur es on physics, V ol. I: The new millennium edition: mainly mechanics, r adiation, and heat . Basic books, 2011, vol. 1. [13] S. Sakamoto, A. Ushiyama, and H. Nagatomo, “Numerical anal- ysis of sound propagation in rooms using the finite dif ference time domain method, ” The Journal of the Acoustical Society of America , vol. 120, no. 5, pp. 3008–3008, 2006. [14] N. Raghuvanshi, R. Narain, and M. C. Lin, “Ef ficient and accu- rate sound propagation using adapti ve rectangular decomposi- tion, ” V isualization and Computer Gr aphics, IEEE T ransactions on , vol. 15, no. 5, pp. 789–801, 2009. [15] J. B. Allen and D. A. Berkley , “Image method for efficiently simulating small-room acoustics, ” The Journal of the Acoustical Society of America , vol. 65, no. 4, pp. 943–950, 1979. [16] M. T . T aylor , A. Chandak, L. Antani, and D. Manocha, “Re- sound: interactiv e sound rendering for dynamic virtual environ- ments, ” in Pr oceedings of the 17th ACM international confer- ence on Multimedia . A CM, 2009, pp. 271–280. [17] M. T aylor , A. Chandak, Q. Mo, C. Lauterbach, C. Schissler, and D. Manocha, “Guided multi view ray tracing for fast au- ralization, ” IEEE T ransactions on V isualization and Computer Graphics , v ol. 18, no. 11, pp. 1797–1810, 2012. [18] C. Schissler and D. Manocha, “Interacti ve sound propagation and rendering for large multi-source scenes, ” A CM T ransactions on Graphics (T OG) , vol. 36, no. 1, p. 2, 2016. [19] C. Schissler and D. Manocha, “Interacti ve sound rendering on mobile devices using ray-parameterized re verberation filters, ” arXiv pr eprint arXiv:1803.00430 , 2018. [20] T . Funkhouser , I. Carlbom, G. Elko, G. Pingali, M. Sondhi, and J. W est, “ A beam tracing approach to acoustic modeling for interacti ve virtual en vironments, ” in Pr oceedings of the 25th annual confer ence on Computer graphics and inter active techniques . A CM, 1998, pp. 21–32. [21] A. Chandak, C. Lauterbach, M. T aylor, Z. Ren, and D. Manocha, “ Ad-frustum: Adaptive frustum tracing for interacti ve sound propagation, ” IEEE T ransactions on V isualization and Com- puter Graphics , v ol. 14, no. 6, pp. 1707–1722, 2008. [22] J. T . Kajiya, “The rendering equation, ” in A CM SIGGRAPH computer graphics , v ol. 20, no. 4. A CM, 1986, pp. 143–150. [23] T . K o, V . Peddinti, D. Po ve y , M. L. Seltzer, and S. Khudanpur , “ A study on data augmentation of reverberant speech for rob ust speech recognition, ” in 2017 IEEE International Confer ence on Acoustics, Speech and Signal Pr ocessing (ICASSP) . IEEE, 2017, pp. 5220–5224. [24] M. Hodgson, “Evidence of dif fuse surface reflections in rooms, ” The Journal of the Acoustical Society of America , vol. 89, no. 2, pp. 765–771, 1991. [25] B.-I. Dalenb ¨ ack, M. Kleiner , and P . Svensson, “ A macroscopic view of diffuse reflection, ” Journal of the Audio Engineering Society , vol. 42, no. 10, pp. 793–807, 1994. [26] Z. T ang, N. J. Bryan, D. Li, T . R. Langlois, and D. Manocha, “Scene-aware audio rendering via deep acoustic analysis, ” arXiv pr eprint arXiv:1911.06245 , 2019. [27] C. Cao, Z. Ren, C. Schissler, D. Manocha, and K. Zhou, “Inter- activ e sound propagation with bidirectional path tracing, ” ACM T ransactions on Graphics (T OG) , vol. 35, no. 6, p. 180, 2016. [28] Z. T ang, J. Kanu, K. Hogan, and D. Manocha, “Regression and classification for direction-of-arri val estimation with con volu- tional recurrent neural networks, ” in Interspeech , 2019. [29] T . N. Sainath, O. V inyals, A. Senior, and H. Sak, “Con volutional, long short-term memory , fully connected deep neural networks, ” in IEEE International Confer ence on Acoustics , 2015. [30] O. Hoshuyama and A. Sugiyama, “Robust adapti ve beamform- ing, ” IEEE T ransactions on Acoustics Speech & Signal Pr ocess- ing , vol. 35, no. 10, pp. 1365–1376, 2008. [31] O. Abdel-Hamid, A. R. Mohamed, H. Jiang, L. Deng, G. Penn, and D. Y u, “Con volutional neural netw orks for speech recogni- tion, ” IEEE/A CM T ransactions on Audio Speec h & Language Pr ocessing , vol. 22, no. 10, pp. 1533–1545, 2014. [32] Z. T ang, H.-Y . Meng, and D. Manocha, “Lo w-frequency com- pensated synthetic impulse responses for improv ed far -field speech recognition, ” arXiv pr eprint arXiv:1910.10815 , 2019. [33] R. T akeda and K. Komatani, “Sound source localization based on deep neural networks with directional acti vate function ex- ploiting phase information, ” in 2016 IEEE international con- fer ence on acoustics, speech and signal pr ocessing (ICASSP) . IEEE, 2016, pp. 405–409.
Original Paper
Loading high-quality paper...
Comments & Academic Discussion
Loading comments...
Leave a Comment