The Design and Implementation of a Scalable DL Benchmarking Platform
The current Deep Learning (DL) landscape is fast-paced and is rife with non-uniform models, hardware/software (HW/SW) stacks, but lacks a DL benchmarking platform to facilitate evaluation and comparison of DL innovations, be it models, frameworks, li…
Authors: Cheng Li, Abdul Dakkak, Jinjun Xiong
The Design and Implementation of a Scalable DL Benchmarking Platform Cheng Li ∗ University of Illinois Urbana-Champaign Urbana, Illinois cli99@illinois.edu Abdul Dakkak ∗ University of Illinois Urbana-Champaign Urbana, Illinois dakkak@illinois.edu Jinjun Xiong IBM T . J. W atson Research Center Y orktown Heights, New Y ork jinjun@us.ibm.com W en-mei Hwu University of Illinois Urbana-Champaign Urbana, Illinois w- hwu@illinois.edu Abstract The current Deep Learning (DL) landscape is fast-paced and is rife with non-uniform models, hardware/software (HW/SW) stacks, but lacks a DL b enchmarking platform to facilitate evaluation and comparison of DL innovations, be it models, frameworks, libraries, or hardware . Due to the lack of a benchmarking platform, the current practice of evaluat- ing the benets of proposed DL innovations is b oth arduous and error-prone — stiing the adoption of the innovations. In this work, we rst identify 10 design features which are desirable within a DL benchmarking platform. These features include: performing the evaluation in a consistent, repro- ducible, and scalable manner , b eing framew ork and hardware agnostic, supporting real-world benchmarking workloads, providing in-depth mo del execution inspe ction across the HW/SW stack levels, etc. W e then propose MLModelScope, a DL benchmarking platform design that realizes the 10 objectives. MLMo delScope proposes a specication to de- ne DL model evaluations and techniques to provision the evaluation workow using the user-specied H W/SW stack. MLModelScope denes abstractions for frame works and sup- ports board range of DL models and evaluation scenarios. W e implement MLModelScope as an open-source project with support for all major frameworks and hardware architec- tures. Through MLModelScope’s e valuation and automated analysis workows, we performed case-study analyses of 37 models across 4 systems and show how model, hardware , and framework selection aects model accuracy and perfor- mance under dierent benchmarking scenarios. W e further demonstrated how MLModelScope’s tracing capability gives a holistic view of model e xecution and helps pinpoint bottle- necks. 1 Introduction The emergence of Deep Learning (DL) as a p opular applica- tion domain has led to many inno vations. Every day , diverse 1 The two authors contributed equally to this paper . DL models, as well as hardware/software (H W/SW) solu- tions, ar e proposed — be it algorithms, frameworks, libraries, compilers, or hardware. DL innovations are introduce d at such a rapid pace [ 10 ] that being able to evaluate and com- pare these inno vations in a timely manner is critical for their adoption. As a result, there have been concerted community eorts in developing DL benchmark suites [ 1 , 6 , 14 , 24 ] where common models are selected and curated as b enchmarks. DL benchmark suites require signicant eort to develop and maintain and thus have limited coverage of models (usu- ally a few models ar e chosen to repr esent a DL task). Within these benchmark suites, model b enchmarks ar e often devel- oped independently as a set of ad-hoc scripts. T o consistently evaluate two models requires one to use the same evaluation code and H W/SW environment. Since the model b enchmarks are ad-hoc scripts, a fair comparison requires a non-trivial amount of eort. Furthermore , DL benchmarking often re- quires evaluating mo dels across dierent combinations of HW/SW stacks. As H W/SW stacks are increasingly being proposed, there is an urging need for a DL benchmarking platform that consistently evaluates and compares dierent DL models across HW/SW stacks, while coping with the fast-paced and diverse landscape of DL. As a edgling eld, the benchmarking platform design for DL faces new challenges and requirements. DL model eval- uation is a complex pr ocess where the model and HW/SW stack must work in unison, and the benet of a DL innova- tion is dependent on this interplay . Currently , there is no standard to specify or provision DL evaluations, and repr o- ducibility is a signicant “pain-point” within the DL commu- nity [ 15 , 23 , 31 ]. Thus, the b enchmarking platform design must guarantee a F1 reproducible evaluation along with F2 consistent evaluation . Aside from F1-2 , the design should: be F3 frameworks and hardware agnostic to support model evaluation using diverse HW/SW stacks; be capable of performing F4 scal- able evaluation across systems to cope with the large num- ber of evaluations due to the diverse model/H W/SW com- binations; support dierent F7 benchmarking scenarios 1 Cheng Li, Abdul Dakkak, et al. which mimic the real-world workload exhibited in online, oine, and interactive applications; hav e a F8 benchmark- ing analysis and reporting workow which analyzes b ench- marking results across e valuation runs and generates sum- mary reports; enable F9 model execution inspection to identify b ottlenecks within a model-, framework-, and system- level components. Other features such as: F5 artifact ver- sioning , F6 ecient evaluation workow , and F10 dif- ferent user interfaces are also desirable to increase the design’s scalability and usability . W e discuss the design ob- jectives in detail in Section 3 . In this paper , we propose MLMo delScope , a scalable DL benchmarking platform design that realizes the above 10 objectives and facilitates benchmarking, comparison, and un- derstanding of DL model executions. MLModelScope achieves the design objectives by proposing a specication to dene DL model evaluations; introducing techniques to consume the specication and provision the evaluation workow us- ing the specied H W/SW stack; using a distributed scheme to manage, schedule, and handle model evaluation requests; supporting pluggable workload generators; dening com- mon abstraction API across frameworks; providing acr oss- stack tracing capability that allows users to inspect model execution at dierent HW/SW abstraction levels; dening an automated evaluation analysis workow for analyzing and reporting evaluation r esults; and, nally , exposing the capabilities through a web and command-line interface . W e implement MLModelScope and integrate it with the Cae [ 21 ], Cae2 [ 20 ], CNTK [ 34 ], MXNet [ 4 ], Py T orch [ 29 ], T ensorFlow [ 40 ], T ensorFlow Lite [ 37 ], and T ensorRT [ 5 ] frameworks. MLModelScope runs on ARM, PowerPC, and x86 and supports CP U, GP U , and FPGA execution. W e bo ot- strap MLModelScop e with over 300 built-in models cover- ing dierent DL tasks such as image classication, object detection, semantic segmentation, etc. MLModelScop e is open-source, extensible, and customizable — coping with the fast-paced DL landscape. T o the authors’ knowledge, this paper is the rst to describ e the design and implementation of a scalable DL benchmarking platform. W e showcase MLModelScope’s benchmarking, inspe ction, and analysis capabilities using several case studies. W e use MLModelScope to evaluate 37 DL models and systematically compare their p erformance using 4 systems under dier- ent benchmarking scenarios. W e p erform comparisons to understand the correlation between a model’s accuracy , its size, and its achiev ed latency and maximum throughput. W e then use MLModelScope’s tracing capability to identify the bottlenecks of the evaluation and use its “zoom-in” feature to inspect the model execution at dierent H W/SW levels. W e demonstrate how , using the analysis workow , users can easily digest the evaluation results produced by MLMod- elScope to understand model-, frame work-, and system-le vel bottlenecks. This paper describes the design and implementation of MLModelScope and is structured as follows. Section 2 gives a background. Section 3 describes the objectives of MLMo d- elScope. Section 4 proposes the MLModelScope design which addresses these objectives and describes its implementa- tion. Section 5 p erforms in-depth evaluations using MLMod- elScope. Section 6 details related w ork before we conclude in Section 7 . 2 Background This se ction gives a brief background of DL model evaluation and current DL benchmarking practice. 2.1 DL Model Evaluation Pipeline A DL model evaluation pipeline performs input pre-processing, followed by model prediction and output post-processing (Figure 3 ). Pre-processing is the process of transforming the user input into a form that can be consumed by the mo del and post-processing is the process of transforming the model’s output to compute metrics. If we take image classication as an example, the pre-pr ocessing step decodes the input image into a tensor of dimensions [ b at ch , he i д ht , w id t h , ch a nnel ] ( [ N , H , W , C ] ), then performs resizing, normalization, etc. The image classication model’s output is a tensor of dimen- sions [ b at ch ∗ num C l as se s ] which is sorted to get the top K predictions (label with probability). A DL model is dene d by its graph topology and its w eights. The graph topology is dene d as a set of no des where each node is a function operator with the implementation provided by a framework (e .g. T ensorFlow , MXNet, PyT orch). The framework acts as a “runtime ” for the model prediction and maps the func- tion operators into system librar y calls. As can be observed, this pipeline is intricate and has many levels of abstraction. When a slowdown is observed, any one of these levels of abstraction can be suspect. 2.2 Current DL Benchmarking While there has been a drive to provide refer ence DL bench- marks [ 1 , 14 , 24 ], the current benchmarking eort is still scattered, lacks a standard benchmarking methodology , and revolv es around a series of scripts that evaluate a model on a local system. T o consistently evaluate two models in- volves: instantiating the same hardware; installing the same software packages and their dependencies; and, nally , mea- suring and analyzing the results of both models in the same way . Because of the use of ad-hoc scripts and lack of a stan- dard way to e valuate models, the above process requires a lot of manual work, and can be error-prone — often r esult- ing in non-reproducible [ 15 , 17 , 23 ] b enchmarking results. Due to the daunting eort to perform fair benchmarking, DL innovations proposed have outpaced researchers’ ability to compare and analyze them [ 10 ]. 2 The Design and Implementation of a Scalable DL Benchmarking Platform F PG A Sy s te m 2 R e s N e t 5 0 F PG A A g e n t Sy s te m 3 C PU MXN e t v1 . 5 . 1 Ag e n t PyT o rch v1 . 3 Ag e n t I n t e l C a f f e v1 . 0 Ag e n t T e n so rF l o w v2 . 0 Ag e n t User Input Mo d e l Ma n i f e st H a rd w a re R e q u i re me n t s Be n ch ma rki n g Sce n a ri o + + Client W e b I n t e rf a ce C o mma n d L i n e I n t e rf a ce 1 Ev a l u a ti o n D a ta b a s e T r a c i n g Se r v e r D i s tr i b u te d R e g i s tr y Ag e n t Ke y-V a l u e s Mo d e l Ke y-V a l u e s A r ti fa c t Sto r a g e Mo d e l G ra p h +W e i g h t s Eva l u a t i o n D a t a se t Se r v e r An a l yze r L o a d G e n e ra t o r Sy s te m 1 2 3 G PU C PU Te n s o r F l o w v 1 . 1 5 . 0 A g e n t T e n s o r F l o w v 1 . 1 5 . 0 Pr e d i c to r R PC H a n d l e r B u i l t-i n Mo d e l Ma n i fe s ts BVL C Al e xN e t R e sN e t 5 0 v1 SSD Mo b i l e N e t … F ra me w o rk W ra p p e r T e n so rF l o w v1 . 1 5 . 0 l i b ra ry T ra ci n g H o o ks Data Ma n a g e r 4 9 8 7 6 5 Sy s te m N C a f f e v1 . 0 Ag e n t Pi p e l i n e Exe cu t o r Pi p e l i n e O p e ra t o rs i i a b c d e Legend i I n i t i a l i za t i o n W o rkf l o w a An a l ysi s W o rkf l o w R PC H a n d l e r F PG A Pre d i ct o r R e sN e t 5 0 Bi t F i l e §4.1 §4.2 §4.3 §4.5.2 §4.5.1 §4.5.3 §4.4 §4.4 D i sp a t ch e r R EST Se rve r 1 Eva l u a t i o n W o rkf l o w L o g g e rs F PG A Pi p e l i n e Exe cu t o r Pi p e l i n e O p e ra t o r Figure 1. The MLMo delScope design and worko ws. 3 Design Obje ctiv es In this section, we detail 10 objectives for a DL benchmarking platform design to cope with the fast-evolving DL landscape. These objectives informed MLModelScope’s design choices. F1 Reproducible Evaluation — Model evaluation is a complex process where the mo del, dataset, evaluation method, and H W/SW stack must work in unison to main- tain the accuracy and p erformance claims. Currently , mo del authors distribute their models and code (usually ad-ho c scripts) by publishing them to public repositories such as GitHub. Due to the lack of standard specication, model au- thors may under-specify or omit key aspe cts of model eval- uation. As a consequence, reproducibility is a “pain-point” within the DL community [ 15 , 17 , 19 , 23 , 31 , 36 ]. Thus, all aspects of a model evaluation must b e specied and pro- visioned by the platform design to guarantee repr oducible evaluation. F2 Consistent Evaluation — The current practice of publishing models and code also poses challenges to consis- tent evaluation. The ad-hoc scripts usually have a tight cou- pling between mo del execution and the underlying H W/SW components, making it dicult to quantify or isolate the benets of an individual component ( be it mo del, frame- work, or other SW/HW components). A fair apple-to-apple comparison between model executions requires a consis- tent evaluation methodology rather than running ad-hoc scripts for each. Thus the design should have a well-dened benchmarking specication for all models and maximize the common code base that drives model evaluations. F3 Framework/Hardwar e Agnostic — The DL land- scape is diverse and there are many DL frameworks (e.g. T ensorFlow , MXNet, Py T orch) and hardware (e.g. CP U, GPU, FPGA). Each has its own use scenarios, features, and p er- formance characteristics. T o have broad supp ort of mo del evaluation, the design must support dierent frameworks and hardware. Furthermore, the design must b e valid without modications to the frameworks. F4 Scalable Evaluation — DL innovations, such as mod- els, frameworks, libraries, compilers, and hardware acceler- ators are introduced at a rapid pace [ 10 , 18 ]. Being able to quickly evaluate and compare the benets of DL innovations is critical for their adoption. Thus the ability to perform DL evaluations with dierent model/HW/SW setups in parallel and have a centralized management of the b enchmarking results is highly desired. For example, choosing the best hard- ware out of N candidates for a model is ideally performed in parallel and the results should be automatically gathered for comparison. F5 Artifact V ersioning — DL frameworks ar e continu- ously updated by the DL community , e .g. the recent versions T ensorFlow at the time of writing are v 1 . 15 and v 2 . 0 . There are many unocial variants of models, frameworks, and datasets as r esearchers might update or modify them to suite 3 Cheng Li, Abdul Dakkak, et al. their respective needs. T o enable management and compari- son of model evaluations using dierent DL artifacts (models, frameworks, and datasets), the artifacts used for evaluation within a benchmarking platform should be versioned. F6 Ecient Evaluation W orkow — Before model in- ference can be performed, the input data has to b e loaded into memory and the pre-processing stage transforms it into a form that the model expects. After the model prediction, the post-processing stage transforms the model’s output(s) to a form that can be used to compute metrics. The input data loading and pre-/post-processing can take a non-negligible amount of time, and become a limiting factor for quick eval- uations [ 9 ]. Thus the design should handle and process data eciently in the evaluation workow . F7 Benchmarking Scenarios — DL benchmarking is performed under spe cic scenarios. These scenarios mimic the usage of DL in online, oine, or interactive applications on mobile, edge, or cloud systems. The design should sup- port common inference scenarios and be exible to support custom or emerging workloads as well. F8 Benchmarking Analysis and Reporting — Bench- marking produces raw data which needs to be corr elated and analyzed to produce human-readable results. An automated mechanism to summarize and visualize these results within a benchmarking platform can help users quickly understand and compare the results. Therefor e, the design should have a benchmarking result analysis and reporting workow . F9 Model Execution Inspection — Benchmarking is often followed by performance optimization. How ever , the complexity of DL model evaluation makes performance de- bugging challenging as each level within the H W/SW ab- straction hierarchy can be a suspe ct when things go awry . Current model execution insp ection methods rely on the use of a concoction of proling to ols (e .g. Nvidia’s Nsight System or Intel’s Vtune). Each proling tool captures a spe- cic aspect of the HW/SW stack and researchers manually correlate the results to get an across-stack view of the model execution prole. T o ease insp ecting model execution bot- tlenecks, the benchmarking platform design should provide tracing capability at all levels of HW/SW stack. F10 Dierent User Interfaces — While the command- line is the most common interface in the curr ent benchmark- ing suites, having other UIs, such as web UI, to accommo- date other use cases can greatly boost productivity . While a command-line interface is often used in scripts to quickly perform combinational evaluations across models, frame- works, and systems, a web UI, on the other hand, can serve as a “push-button” solution to benchmarking and pr ovides an intuitive ow for specifying, managing evaluations, and visualizing benchmarking results. Thus the design should provide UIs for dierent use cases. 1 n a m e : M L P e r f _ R e s N e t 5 0 _ v 1 . 5 # m o d e l n a m e 2 v e r s i o n : 1 . 0 . 0 # s e m a n t i c v e r s i o n o f t h e m o d e l 3 d e s c r i p t i o n : . . . 4 f r a m e w o r k : # f r a m e w o r k i n f o r m a t i o n 5 n a m e : T e n s o r F l o w 6 v e r s i o n : ' > = 1 . 1 2 . 0 < 2 . 0 ' # f r a m e w o r k v e r c o n s t r a i n t 7 i n p u t s : # m o d e l i n p u t s 8 - t y p e : i m a g e # f i r s t i n p u t m o d a l i t y 9 l a y e r _ n a m e : ' i n p u t _ t e n s o r ' 10 e l e m e n t _ t y p e : f l o a t 3 2 11 s t e p s : # p r e - p r o c e s s i n g s t e p s 12 - d e c o d e : 13 d a t a _ l a y o u t : N H W C 14 c o l o r _ m o d e : R G B 15 - r e s i z e : 16 d i m e n s i o n s : [ 3 , 2 2 4 , 2 2 4 ] 17 m e t h o d : b i l i n e a r 18 k e e p _ a s p e c t _ r a t i o : t r u e 19 - n o r m a l i z e : 20 m e a n : [ 1 2 3 . 6 8 , 1 1 6 . 7 8 , 1 0 3 . 9 4 ] 21 r e s c a l e : 1 . 0 22 o u t p u t s : # m o d e l o u t p u t s 23 - t y p e : p r o b a b i l i t y # f i r s t o u t p u t m o d a l i t y 24 l a y e r _ n a m e : p r o b 25 e l e m e n t _ t y p e : f l o a t 3 2 26 s t e p s : # p o s t - p r o c e s s i n g s t e p s 27 - a r g s o r t : 28 l a b e l s _ u r l : h t t p s : / / . . . / s y n s e t . t x t 29 p r e p r o c e s s : [ [ c o d e ] ] 30 p o s t p r o c e s s : [ [ c o d e ] ] 31 m o d e l : # m o d e l s o u r c e s 32 b a s e _ u r l : h t t p s : / / z e n o d o . o r g / r e c o r d / 2 5 3 5 8 7 3 / f i l e s / 33 g r a p h _ p a t h : r e s n e t 5 0 _ v 1 . p b 34 c h e c k s u m : 7 b 9 4 a 2 d a 0 5 d . . . 2 3 a 4 6 b c 0 8 8 8 6 35 a t t r i b u t e s : # e x t r a m o d e l a t t r i b u t e s 36 t r a i n i n g _ d a t a s e t : # d a t a s e t u s e d f o r t r a i n i n g 37 - n a m e : I m a g e N e t 38 - v e r s i o n : 1 . 0 . 0 Listing 1. The MLPerf_ResNet50_v1.5 ’s model manifest contains all information ne eded to run the model evaluation using T ensorF low on CP Us or GP Us. 4 MLModelScope Design and Implementation W e propose MLModelScope, a DL benchmarking platform design that achieves the objectives F1-10 set out in Section 3 . T o achieve F4 scalable evaluation, we design MLModelScope as a distributed platform. T o enable F7 real-world bench- marking scenarios, MLModelScop e deploys mo dels to be either evaluated using a cloud (as in model ser ving plat- forms) or edge (as in lo cal model inference) scenario. T o adapt to the fast pace of DL, MLModelScop e is built as a set of extensible and customizable modular components. W e briey describe each comp onent here and will delve into how they ar e used later in this section. Figure 1 shows the high level components which include: • User Inputs — are the required inputs for model evalua- tion including: a model manifest (a specication describing how to evaluate a mo del), a framework manifest (a speci- cation describing the software stack to use), the system requirements ( e.g. an X86 system with at least 32 GB of RAM and an N VIDIA V100 GP U), and the benchmarking scenario to employ . • Client — is either the web UI or command-line interface which users use to supply their inputs and initiate the model evaluation by sending a REST request to the MLModelScope server . • Server — acts on the client requests and performs REST API handling, dispatching the model evaluation tasks to MLModelScope agents, generating benchmark workloads 4 The Design and Implementation of a Scalable DL Benchmarking Platform based on benchmarking scenarios, and analyzing the evalua- tion results. • Agents — runs on dierent systems of interest and per- form model evaluation based on requests sent by the MLMod- elScope server . Each agent includes logic for downloading model assets, performing input pre-processing, using the framework predictor for inference, and performing post- processing. An agent can be run within a container or as a local process. Aside from the framew ork predictor , all code within an agent is common across frameworks. • Framework Predictor — is a wrapp er around a frame- work and provides a consistent interface across dierent DL frameworks. The wrapper is designed as a thin abstraction layer so that all DL frame works can be easily integrated into MLModelScope by exposing a limited number of common APIs. • Middleware — are a set of support services for MLMod- elScope including: a distributed registry (a key-value store containing entries of running agents and available models), an evaluation database (a database containing evaluation re- sults), a tracing server (a server to publish prole ev ents cap- tured during an evaluation), and an artifact storage server (a data store repository containing model assets and datasets). Figure 1 also shows MLModelScop e ’s three main work- ows: i initialization, 1-9 evaluation, and a-e analysis. The initialization workow is one wher e all agents self-register by populating the registry with their software stack, sys- tem information, and available models for evaluation. The evaluation workow w orks as follows: 1 a user inputs the desired model, software and hardware requirements, and benchmarking scenario through a client interface. The 2 server then accepts the user request, resolves which agents are capable of handling the r equest by 3 querying the dis- tributed registry , and then 4 dispatches the request to one or more of the resolved agents. The agent then 5 down- loads the required evaluation assets from the artifact storage, performs the evaluation, and 6-7 publishes the evaluation results to the evaluation database and tracing server . A sum- mary of the results is 8 sent to the server which 9 forwards it to the client. Finally , the analysis workow allows a user to perform a more ne-grained and in-depth analysis of r esults across evaluation runs. The MLModelScope server handles this workow by a-d querying the evaluation database and performing analysis on the results, and e generating a de- tailed analysis report for the user . This section describ es the MLModelScope components and workows in detail. 4.1 User Input All aspects of DL evaluation — model, software stack, sys- tem, and benchmarking scenario — must be specie d to MLModelScope for it to enforce F1 reproducible and F2 consistent evaluation. T o achieve this, MLModelScop e de- nes a benchmarking spe cication covering the 4 aspects of evaluation. A model in MLModelScope is specie d using a model manifest , and a software stack is specied using a framework manifest . The manifests are textual specica- tion in Y AML [ 2 ] format. The system and b enchmarking scenario are user-specied options when the user initiates an evaluation. The benchmarking spe cication is not tie d to a certain framew ork or hardware , thus enabling F3 . As the model, software stack, system, and b enchmarking sce- nario specication are de coupled, one can easily evaluate the dier ent combinations, enabling F4 . For example, a user can use the same MLPerf_ResNet50_v1.5 model manifest (shown in Listing 1 ) to initiate evaluations across dierent T ensorFlow software stacks, systems, and benchmarking sce- narios. T o bootstrap the model evaluation process, MLMod- elScope provides built-in model manifests which are embed- ded in MLModelScope agents (Section 4.4 ). For these built- in mo dels, a user can sp ecify the mo del and framework’s name and version in place of the manifest for ease of use. MLModelScope also provides r eady-made Docker containers to be used in the framework manifests. These containers are hosted on Docker hub. 4.1.1 Model Manifest The model manifest is a text le that species information such as the model assets (graph and w eights), the pre- and post-processing steps, and other metadata used for evalua- tion management. An example model manifest of ResNet50 v 1 . 5 from MLPerf is shown in Listing 1 . The manifest de- scribes the model name (Lines 1 - 2 ), framework name and ver- sion constraint (Lines 4 - 6 ), mo del inputs and pre-pr ocessing steps (Lines 7 - 21 ), model outputs and post-processing steps (Lines 22 - 28 ), custom pre- and post-processing functions (Lines 29 - 30 ), model assets (Lines 31 - 34 ), and other metadata attributes (Lines 35 - 38 ). Framework Constraints — Mo dels are dep endent on the framework and possibly the framework version. Users can specify the framework constraints that a model can ex- ecute on. For example, an ONNX model may work across all frameworks and therefore has no constraint, but other models may only work for T ensorF lo w v ersions greater than 1 . 2 . 0 but less than 2 (e.g. Lines 4 – 6 in Listing 1 ). This allows MLModelScope to support models to target spe cic versions of a framework and custom framew orks. Pre- and Post-Processing — T o perform pre- and post- processing for model evaluation, arbitrary Python functions can be placed within the mo del manifest (Lines | 29 | and | 30 | in Listing 1 ). The pre- and post-processing functions are Python functions which have the signature def fun(env, data) . The env contains metadata of the user input and data is a PyObject representation of the user request for pr e-process- ing or the model’s output for post-processing. Internally , MLModelScope executes the functions within a Python sub- interpret-er [ 32 ] and passes the data arguments by refer ence. The pre- and post-processing functions are general; i.e. the 5 Cheng Li, Abdul Dakkak, et al. functions may import e xternal Python modules or download and invoke external scripts. By allowing arbitrar y processing functions, MLModelScope works with existing processing codes and is capable of supporting arbitrar y input/output modalities. Built-in Pre- and Post-Processing — An alternative way of specifying pre- and post-processing is by dening them as a series of built-in pre- and post-processing pipeline steps (i.e. pipeline operators ) within the model manifest. For example, our MLModelScope implementation provides com- mon pre-processing image operations (e.g. image de cod- ing, resizing, and normalization) and post-processing op- erations (e .g. ArgSort, intersection over union, etc.) which are widely used within vision models. Users can use these built-in operators to dene the pre- and post-processing pipelines within the manifest without writing co de . Users dene a pipeline by listing the operations within the man- ifest code (e.g. Lines 7 – 21 in Listing 1 for pre-processing). The pre- and post-processing steps are executed in the or der they are specied in the mo del manifest. The use of built-in processing and function processing pipelines are mutually exclusive. Model Assets — The data required by the model are speci- ed in the model manifest le; i.e. the graph (the graph_path ) and weights (the weights_path ) elds. The model assets can reside within MLModelScope’s artifact repository , on the web , or the local le system of the MLModelScope agent. If the model assets are remote, then they are downloaded on demand and cached on the local le system. For frame- works (such as T ensorF low and Py T orch) which use a single le for both the model graph and weights (in deplo yment), the weights eld is omitted from the manifest. For example, the T ensorFlow ResNet50 v 1 . 5 model assets in Listing 1 are stored on the Zenodo [ 41 ] website (Lines 31 - 34 ) and are downloaded prior to evaluation. 4.1.2 Framework Manifest & System Requirements The framework manifest is a te xt le that species the soft- ware stack for model evaluation; an example framework manifest is shown in Listing 2 . As the core of the softwar e stack, the framew ork name and version constraints are spec- ied. T o maintain the software stack, and guarante e isola- tion, the user can further specify do cker containers using the containers eld. Multiple containers can be specied to accommo date dierent systems (e.g. CP U or GP Us). At the MLModelScope initialization phase ( i ), MLModelScope agents (described in Section 4.4 ) register themselves by pub- lishing their H W/SW stack information into the distributed registry (described in Section 4.5.1 ). The MLModelScope server uses this information during the agent resolution pro- cess. The server nds MLModelScope agents satisfying the user’s hardware spe cication and model/framework require- ments. Evaluations are then run on one of (or , at the user request, all of ) the agents. If the user omits the frame work 1 n a m e : T e n s o r F l o w # f r a m e w o r k n a m e 2 v e r s i o n : 1 . 1 5 . 0 # s e m a n t i c v e r s i o n o f t h e f r a m e w o r k 3 d e s c r i p t i o n : . . . 4 c o n t a i n e r s : # c o n t a i n e r s 5 a m d 6 4 : 6 c p u : c a r m l / t e n s o r f l o w : 1 - 1 5 - 0 _ a m d 6 4 - c p u 7 g p u : c a r m l / t e n s o r f l o w : 1 - 1 5 - 0 _ a m d 6 4 - g p u 8 p p c 6 4 l e : 9 c p u : c a r m l / t e n s o r f l o w : 1 - 1 5 - 0 _ p p c 6 4 l e - c p u 10 g p u : c a r m l / t e n s o r f l o w : 1 - 1 5 - 0 _ p p c 6 4 l e - g p u Listing 2. An example T ensorF low frame work manifest, which contains the software stacks (containers) to run the model evaluation across CP Us or GP Us. manifest in the user input, the MLModelScope server re- solves the agent constraints using the model manifest and system information. This allows MLModelScope to support evaluation on FPGA systems which do not use containers. 4.1.3 Benchmarking Scenario MLModelScope provides a set of built-in benchmarking sce- narios. Users pick which scenario to evaluate under . The benchmarking scenarios include batched inference and on- line inference with a congurable distribution of time of request (e .g. Poisson distribution of requests). The MLMod- elScope ser v er generates an inference request load based on the benchmarking scenario option and sends it to the re- solved agent( s) to measure the corresponding benchmarking metrics of the model (detailed in Section 4.3 ). 4.2 MLModelScope Client A user initiates a model 1 evacuation or a analysis though the MLModelScope client . T o enable F10 , the client can be either a website or a command-line tool that users inter- act with. The client communicates with the MLModelScope server thr ough REST API and sends user evaluation requests. The web user interface allows users to specify a model e valu- ation through simple clicks and is designed to help users who do not have much DL experience. For e xample, for users not familiar with the dierent models r egistered, MLModelScope allows users to select models based on the application area — this lowers the barrier of DL usage. The command-line interface is provided for those interested in automating the evaluation and proling process. Users can develop other clients that use the REST API to integrate MLModelScope within their AI applications. 4.3 MLModelScope Server The MLModelScope ser v er interacts with the MLModelScop e client, agent, the middleware. It uses REST API to communi- cate with the MLMo delScope clients and middleware, and gRPC (Listing 4 ) to interact with the MLMo delScope agents. T o enforce F4 , the MLModelScope server can be load bal- anced to avoid it being a bottlene ck. In the 1-9 evaluation workow , the server is r esponsible for 2 accepting tasks from the MLMo delScope client, 3 6 The Design and Implementation of a Scalable DL Benchmarking Platform 1 / / O p e n s a p r e d i c t o r . 2 M o d e l H a n d l e M o d e l L o a d ( O p e n R e q u e s t ) ; 3 / / C l o s e a n o p e n p r e d i c t o r . 4 E r r o r M o d e l U n l o a d ( M o d e l H a n d l e ) ; 5 / / P e r f o r m m o d e l i n f e r e n c e o n u s e r d a t a . 6 P r e d i c t R e s p o n s e P r e d i c t ( M o d e l H a n d l e , P r e d i c t R e q u e s t , ← - P r e d i c t O p t i o n s ) ; Listing 3. The predictor interface consists of 3 API functions. querying the distributed registry and resolving the user- specied constraints to nd MLModelScope agents capable of evaluating the request, 4 dispatching the evaluation task to the resolved agent(s) and generating loads for the evalua- tion, 8 collecting the evaluation summary from the agent( s), and 9 returning the result summary to the client. The load generator is placed on the server to avoid other programs in- terfering with the evaluation being measured and to emulate real-world scenarios such as cloud serving ( F7 ). In the a-e analysis workow , the ser v er again a-b takes the user input, but, rather than performing evaluation, it c queries the evaluation database (Section 4.5.2 ), and then ag- gregates and analyzes the evaluation r esults. MLModelScope enables F8 through an across-stack analysis pipeline. It d consumes the benchmarking results and the proling traces in the evaluation database and performs the analysis. Then the ser v er e sends the analysis result to the client. The consistent proling and automated analysis workows in MLModelScope allow users to systematically compar e across models, frameworks, and system oerings. 4.4 Agent and Framework Predictor A MLModelScop e agent is a model serving process that is run on a system of interest (within a container or on bare metal) and handles requests from the MLModelScope ser ver . MLModelScope agents continuously listen for jobs and com- municate with the MLModelScope server through gRPC [ 16 ] as shown in Listing 4 . A framework predictor resides within a MLModelScope agent and is a wrapper around a framework and links to the framework’s C library . During the initialization phase ( i ), a MLModelScop e agent publishes its built-in models and H W/SW information to the MLModelScope distributed registry . T o perform the as- signed evaluation task, the agent rst 5 downloads the re- quired evaluation assets using the data manager , it then executes the model evaluation pipeline which performs the pre-processing, calls the framework’s predictor for inference and then preforms the post-processing. If proling is enabled, the trace information is publishe d to the 6 tracing ser v er to get aggregated into a single proling trace. 7 the bench- marked result and the proling trace are published to the evaluation database. Aside from the framework predictor , all the other code — the data manager , pip eline executor , and tracing hooks — are shar ed across agents for dierent frameworks. While the default setup of MLModelScope is to run each agent on a separate system, the design does not preclude one from running agents on the same system as separate processes. 4.4.1 Data Manager The data manager manages the assets (e.g. dataset or model) required by the evaluation as sp ecied within the mo del manifest. Assets can be hoste d within MLModelScope’s arti- fact repositor y , on the w eb, or r eside in the local le system of the MLModelScope agent. Both datasets and models are downloaded by the data manager on demand if they are not available on the local system. If the checksum is specied in the model manifest, the data manager validates the checksum of the asset before using a cached asset or after download- ing the asset. Model assets are stored using the frameworks’ corresponding deployment format. For datasets, MLMod- elScope supports the use of T ensorFlow’s TFRecord [ 38 ] and MXNet’s RecordIO [ 33 ]. These dataset formats are optimized for static data and lays out the elements within the dataset as contiguous binary data on disk to achieve better read performance. 4.4.2 Pipeline Exe cutor and Operators T o enable F6 ecient evaluation workow , MLMo delScope leverages a streaming data processing pipeline design to perform the mo del evaluation. The pipeline is composed of pipeline operators which are mappe d onto light-weight threads to make ecient use multiple CP Us as well as to overlap I/O with compute. Each operator within the pipeline forms a producer-consumer relationship by receiving values from the upstream operator(s) (via inbound streams), applies the sp ecied function on the incoming data and usually producing new values, and pr opagates values downstream (via outbound streams) to the next operator(s). The pre- and post-processing operations, as well as the model inference , form the operators within the model evaluation pipeline. 4.4.3 Framework Predictor Frameworks pro vide dierent APIs (usually across program- ming languages e.g. C/C++, Python, Java) to perform infer- ence. T o enable F2 consistent evaluation and maximize code reuse, MLModelScope wraps each framework’s C infer ence API. The wrapper is minimal and provides a uniform API across frameworks for performing model loading, unloading, and inference. This wrapper is called the predictor interface and is shown in Listing 3 . MLModelScope does not require modications to a framework and thus pre-compiled binar y versions of frameworks (e.g. distributed through Python’s pip) or customized versions of a framework work within MLModelScope. MLModelScope is designed to bind to the frameworks’ C API to avoid the overhead of using scripting languages. W e demonstrate this overhead by comparing model inference using Python and the C API. W e used T ensorFlow 1.13.0 7 Cheng Li, Abdul Dakkak, et al. 1 2 4 8 16 32 0 0 . 5 1 1 . 5 (b) Normalized CP U Latency . C NumPy Python 1 2 4 8 16 32 0 5 10 (b) Normalized GP U Latency . Figure 2. The tf.Session.Run execution time (normalized to C) across batch sizes for Inception-v3 inference on CP U and GP U using T ensorFlow with C, Python using NumPy arrays (NumPy), and Python using native lists (Python). 1 s e r v i c e P r e d i c t { 2 m e s s a g e P r e d i c t O p t i o n s { 3 e n u m T r a c e L e v e l { 4 N O N E = 0 ; 5 M O D E L = 1 ; / / s t e p s i n t h e e v a l u a t i o n p i p e l i n e 6 F R A M E W O R K = 2 ; / / l a y e r s w i t h i n t h e f r a m e w o r k a n d a b o v e 7 S Y S T E M = 3 ; / / t h e s y s t e m p r o f i l e r s a n d a b o v e 8 F U L L = 4 ; / / i n c l u d e s a l l o f t h e a b o v e 9 } 10 T r a c e L e v e l t r a c e _ l e v e l = 1 ; 11 O p t i o n s o p t i o n s = 2 ; 12 } 13 m e s s a g e O p e n R e q u e s t { 14 s t r i n g m o d e l _ n a m e = 1 ; 15 s t r i n g m o d e l _ v e r s i o n = 2 ; 16 s t r i n g f r a m e w o r k _ n a m e = 3 ; 17 s t r i n g f r a m e w o r k _ v e r s i o n = 4 ; 18 s t r i n g m o d e l _ m a n i f e s t = 5 ; 19 B e n c h m a r k S c e n a r i o b e n c h m a r k _ s c e n a r i o = 6 ; 20 P r e d i c t O p t i o n s p r e d i c t _ o p t i o n s = 7 ; 21 } 22 / / O p e n s a p r e d i c t o r a n d r e t u r n s a P r e d i c t o r H a n d l e . 23 r p c O p e n ( O p e n R e q u e s t ) r e t u r n s ( P r e d i c t o r H a n d l e ) { } 24 / / C l o s e a p r e d i c t o r a n d c l e a r i t s m e m o r y . 25 r p c C l o s e ( P r e d i c t o r H a n d l e ) r e t u r n s ( C l o s e R e s p o n s e ) { } 26 / / P r e d i c t r e c e i v e s a s t r e a m o f u s e r d a t a a n d r u n s 27 / / t h e p r e d i c t o r o n e a c h e l e m e n t o f t h e d a t a a c c o r d i n g 28 / / t o t h e p r o v i d e d b e n c h m a r k s c e n a r i o . 29 r p c P r e d i c t ( P r e d i c t o r H a n d l e P r e d i c t o r H a n d l e , U s e r I n p u t ) ← - r e t u r n s ( F e a t u r e s R e s p o n s e ) { } 30 } Listing 4. MLModelScope’s minimal gRPC interface in protocol buer format. compiled from source with cuDNN 7 . 4 and CUDA Runtime 10 . 0 . 1 on the Tesla_V100 system ( Amazon EC2 P3 instance) in T able 1 . Figure 2 shows the normalized inference latency across language environments on GP Us and CP Us across batch sizes. On CP U, using Python is 64% and NumPy is 15% slower than C; whereas on GP U Python is 3 − 11 × and NumPy is 10% slower than C. For Python, the overhead is proportional to the input size and is due to T ensorF low internally having to unbox the Python linked list objects and create a numeric buer that can be used by the C code. The unboxing is not neede d for NumPy since T ensorF lo w can use NumPy’s internal numeric buer dir ectly . By using the C API directly , MLModelScop e can elide measuring overheads due to language binding or scripting language use. MLModelScope design supports agents on ASIC and FPGA. Any code implementing the predictor interface shown in Pre-proess Input Post-process Output Predict Model Conv Conv Bias Concat Bias Data FC Relu Relu Malloc CUDNN Transpose Free CUDNN flop count SP DRAM Read DRAM Write cudaMalloc ConvKernel cudaFree Model Framework System Figure 3. The model inference is dened by the pre- processing, prediction, and post-processing pipeline. A framework executes a model through a netw ork-layer execu- tion pipeline. Layers executed by a framework are pipelines of system library calls. The system libraries, in turn, invoke a chain of primitive kernels that impact the underlying hard- ware counters. Listing 3 is a valid MLModelScope predictor . This means that FPGA and ASIC hardware , which do not have a framework per se, can be exposed as a predictor . For example, for an FPGA the Open function call loads a bitle into the FPGA, the Close unloads it, and the Predict runs the infer ence on the FPGA. Except for implementing these 3 API functions, no code needs to change for the FPGA to be expose d to MLModelScope. 4.4.4 Tracing Ho oks T o enable F9 , MLModelScope leverages distributed trac- ing [ 35 ] and captures the proles at dierent le vels of gran- ularity (model-, framework-, and system-lev el as shown in Figure 3 ) using the tracing hooks. A tracing ho ok is a pair of start and end code snippets and follows the standards [ 28 ] to capture an interval of time. The captured time interval along with the context and metadata is called a trace event . and is published to the MLModelScope tracer server (Sec- tion 4.5.3 ). Trace events ar e published asynchronously to the MLModelScope tracing ser v er , where they are aggregated using the timestamp and conte xt information into a single end-to-end timeline. The timestamps of trace e vents do no need to reect the actual wall clock time, for example, users may integrate a system simulator and publish simulated time rather than wall-clock time to the tracing server . Model-level — Tracing hooks are automatically placed around each pipeline operator within the model evaluation pipeline. For example, the tracing hook around the model inference step measures the inference latency . 8 The Design and Implementation of a Scalable DL Benchmarking Platform Framework-lev el — The tracing ho oks at the framework- level leverage the DL frameworks’ existing proling capa- bilities and does not require modication to the framework source code. For T ensorFlow , this option is controlled by the RunOptions.TraceLevel setting which is passe d to the TF_- SessionRun function. In MXNet, the MXSetProfilerState function toggles the layer proling. Similar mechanisms ex- ist for other frameworks such as Cae, Cae2, Py T orch, and T ensorRT . The framework’s prole representation is con- verted and is then published to the tracer server . System-level — The tracing hooks at the system-level integrate with hardware and system-level pr oling libraries to capture ne-grained performance information — CP U and GP U proles, system traces, and hardware performance counters. For example , the performance counters on systems are captured through integration with P API [ 3 ] and Linux perf [ 30 ] while the GP U prole is captured by integrating with NVIDIA ’s N VML [ 26 ] and CUPTI [ 8 ]. Since overhead can be high for system-level proling, the user can sele ctiv ely enable/disable the integrated prolers. The trace level is a user-specied option (part of the bench- marking scenario) and allows one to get a hierarchical view of the execution prole. For example, a user can enable model- and framework-level proling by setting the trace level to framework , or can disable the proling all together by setting the trace lev el to none. Through MLModelScope ’s trace, a user can get a holistic view of the model evaluation to identify bottlenecks at each level of inference. 4.5 Middleware The MLModelScope middleware layer is compose d of ser- vices and utilities that support the MLModelScope Ser v er in orchestrating model evaluations and the MLModelScope agents in pro visioning, monitoring, and aggr egating the exe- cution of the agents. 4.5.1 Distributed Registr y MLModelScope leverages a distributed key-value store to store the registered model manifests and running agents, referred to as the distributed registry . MLModelScope uses the registry to facilitate the discovery of mo dels, solv e user- specied constraints for sele cting MLModelScope agents, and load balances the requests across agents. The registr y is dynamic — both model manifests and predictors can be added or deleted at runtime throughout the lifetime of MLMod- elScope. 4.5.2 Evaluation Database In the benchmarking workow , after completing a model evaluation, the MLModelScope agent uses the user input as the key to store the benchmarking result and proling trace in the evaluation database . MLModelScop e summarizes and generates plots to aid in comparing the performance across experiments. Users can view historical evaluations through the website or command line using the input constraints. Since the models are versioned, MLModelScope allows one to track which model version produced the best result. 4.5.3 Tracing Ser ver The MLMo delScope tracing ser ver is a distributed tracing server which accepts proling data published by the MLMod- elScope agent’s trace hooks (Section 4.4.4 ). Through the in- novative use of distributed tracing (originally designed to monitor distributed applications), MLModelScope joins pro- ling results from dierent proling tools and accepts in- strumentation markers within application and library code. All proling data are incorp orated into a single proling timeline. The aggregated proling trace is consumed by the MLModelScope analysis pipeline and also visualized sepa- rately where the user can view the entire timeline and “zoom” into a specic component as shown in Figure 3 . As stated in Section 4.4.4 , user-specie d options control the granularity (model, framework, or system) of the trace ev ents captured (Lines 4 − 9 in Listing 4 ). 4.6 Extensibility and Customization MLModelScope is built from a set of modular components and is designed to be extensible and customizable. Users can disable components, such as tracing, with a runtime option or conditional compilation, for example. Users can extend MLModelScope by adding mo dels, frame works, or tracing hooks. Adding Models — As models are dened through the model manifest le, no coding is required to add mo dels. Once a model is added to MLModelScope, then it can be used through its w ebsite, command line, or API interfaces. Permissions can be set to control who can use or view a model. Adding Frameworks — T o use new or custom versions of a built-in framework requires no code modication but a framework manifest as sho wn in Listing 2 . T o add support for a new type of framework in MLModelScop e, the user needs to implement the framework wrapper and expose the framework as a MLModelScope predictor . The predictor interface is dened by a set of 3 functions — one to open a model, another to perform the inference, and nally , one to close the model — as shown in Listing 3 . The auxiliar y code that forms an agent is common across frameworks and does not need to be mo died. Adding Tracing Hooks — MLModelScope is congured to capture a set of default system metrics using the system- level tracing hooks. Users can congure these existing trac- ing hooks to capture other system metrics. For example, to limit proling overhead, by default, the CUPTI tracing hooks captures only some CUD A runtime API, GP U activi- ties (kernels and memor y copy ), and GP U metrics. They can be congur ed to capture other GP U activities and metrics, or NV TX markers. Moreover , users can integrate other system 9 Cheng Li, Abdul Dakkak, et al. prolers into MLModelScope by implementing the tracing hook interface (Section 4.4.4 ). 4.7 Implementation W e implemented the MLModelScope design with supp ort for common frameworks and hardware . At the time of writ- ing, MLModelScope has built-in support for Cae, Cae2, CN TK, MXNet, Py T orch, T ensorFlow , T ensorFlow Lite, and T ensorRT . MLModelScop e works with binary versions of the frameworks (version distributed through Python’s pip, for example) and support customized versions of the frame- works with no code modication. MLModelScope has b een tested on X86, PowerPC, and ARM CP Us as well as NVIDIA ’s Kepler , Maxwell, Pascal, V olta, and T uring GP Us. It can also evaluate models deployed on FPGAs. During the evaluation, users can specify hardware constraints such as: whether to run on CP U/GP U/FPGA, type of architecture, type of in- terconnect, and minimum memory requirements — which MLModelScope uses for agent resolution. W e populate d MLModelScope with over 300 built-in mod- els covering a wide array of inference tasks such as im- age classication, object detection, segmentation, image en- hancement, recommendation, etc. W e veried MLModelScope’s accuracy and performance results by evaluating the built-in models and frameworks across r epresentative systems and comparing to those publicly reported. W e maintain a run- ning version of MLModelScope ( omitting the web link due to the blind review pr ocess) on a representative set of systems along with the evaluation results of the built-in artifacts. It serves as a portal for the public to evaluate and measure the systems, and to contribute to MLModelScope’s artifacts. Using the analysis pipeline, we automatically generate d pro- ling reports for hundreds of models across frameworks. The analysis reports are publishe d as web pages and a sample is available at scalable20.mlmodelscope.org for the reader’s inspection. W e implemented a MLModelScope web UI using the React Javascript framework. The web UI interacts with a REST API provided by the server . A video demoing the web UI usage ow is available at hps://bit.ly/2N9Z5wR . The REST API can be used by other clients that wish to integrate MLMod- elScope within their workow . A MLMo delScope command- line client is also available and can b e used within shell scripts. The agents also expose a gRPC API which can b e used to perform queries to the agents directly . 5 Evaluation Previous sections discussed in detail how MLModelScope ’s design and implementation achieves the F1-6 and F10 de- sign objectives. In this section, we focus on evaluating how MLModelScope handles F7 dierent benchmarking scenar- ios, F8 result summarization, and F9 inspection of model execution. W e installed MLModelScope on the systems listed in T able 1 . Unless otherwise noted, all MLModelScope agents are run within a docker container built on top of NVIDIA ’s T ensorFlow NGC v 19 . 06 do cker image with the T ensorF low v 1 . 13 . 1 librar y . All evaluations were p erformed using the command-line interface and are run in parallel across the systems. 5.1 Benchmarking Scenarios T o show how MLModelScope helps users choose from dif- ferent models and system oerings for the same DL task, we compared the inference performance across the 37 T en- sorFlow mo dels (shown in T able 2 ) and systems (shown in T able 1 ) under dierent b enchmark scenarios. For each model, we measured its trimmed mean latency 1 and 90 th percentile latency in online (batch size = 1 ) inference sce- nario, and the maximum throughput in batched inference scenario on the AWS P3 system in T able 1 . The model accu- racy achieved using the ImageNet [ 11 ] validation dataset and model size is listed. A model deployer can use this accuracy and performance information to cho ose the best model on a system given the accuracy and target latency or throughput objectives. Model Accuracy , Size, and Performance — W e exam- ined the relationship between the model accuracy and b oth online latency (Figure 5 ) and maximum throughput (Figur e 4 ). In both gures, the area of the circles is proportional to the model’s graph size. In Figur e 4 we nd a limited corre- lation between a model’s online latency and its accuracy — models taking longer time to run do not necessarily achieve higher accuracies; e.g. model 15 vs 22 . While large models tend to have longer online latencies, this is not always true; e.g. model 14 is smaller in size but takes longer to run com- pared to models 3 , 5 , 8 , etc. Similarly , in Figure 5 , we nd a limite d correlation between a mo del’s accuracy and its maximum throughput — two models with comparable maxi- mum throughputs can achie ve quite dierent accuracies; e .g. models 2 and 17 . Moreover , we se e from both gures that the graph size (which roughly r epresents the number of weight values) is not directly correlated to either accuracy or perfor- mance. Overall, models closer to the upper left corner (low latency and high accuracy ) in Figure 4 are fav orable in the online inference scenarios, and models closer to the upper right corner (high throughput and high accuracy) in Figure 5 are favorable in the batched inference scenario. Users can use this information to select the best model depending on their objectives. Model Throughput Scalability Across Batch Sizes — When comparing the model online latency and maximum throughput (Figures 4 and 5 respectively), w e observed that models which exhibit good online inference latency do not 1 Trimmed mean is computed by removing 20% of the smallest and largest elements and computing the mean of the residual; i.e. T rimmedMean ( l i s t ) ) = M ean ( S ort ( l i s t ) [ ⌊ 0 . 2 ∗ l en ( l i s t ) ⌋ : : − ⌊ 0 . 2 ∗ l en ( l i s t ) ⌋ ]) . 10 The Design and Implementation of a Scalable DL Benchmarking Platform Name CP U GP U GP U Architecture GP U The oretical Flops (TF lops) GP U Memor y Bandwidth (GB/s) Cost ($/hr) A WS P3 (2XLarge) Intel Xeon E5-2686 v4 @ 2.30GHz T esla V100-SXM2-16GB V olta 15.7 900 3.06 A WS G3 (XLarge) Intel Xeon E5-2686 v4 @ 2.30GHz T esla M60 Maxwell 9.6 320 0.90 A WS P2 (XLarge) Intel Xeon E5-2686 v4 @ 2.30GHz T esla K80 Kepler 5.6 480 0.75 IBM P8 IBM S822LC Power8 @ 3.5GHz T esla P100-SXM2 Pascal 10.6 732 - T able 1. Four systems with V olta, Pascal, Maxwell, and Kepler GP Us are selected for evaluation. ID Name T op 1 Accuracy Graph Size (MB) Online TrimmedMean Latency (ms) Online 90 th Percentile Latency (ms) Max Throughput (Inputs/Sec) Optimal Batch Size 1 Inception_ResNet_v2 80.40 214 23.95 24.2 346.6 128 2 Inception_v4 80.20 163 17.36 17.6 436.7 128 3 Inception_v3 78.00 91 9.2 9.48 811.0 64 4 ResNet_v2_152 77.80 231 14.44 14.65 466.8 256 5 ResNet_v2_101 77.00 170 10.31 10.55 671.7 256 6 ResNet_v1_152 76.80 230 13.67 13.9 541.3 256 7 MLPerf_ResNet50_v1.5 76.46 103 6.33 6.53 930.7 256 8 ResNet_v1_101 76.40 170 9.93 10.08 774.7 256 9 AI_Matrix_ResNet152 75.93 230 14.58 14.72 468.0 256 10 ResNet_v2_50 75.60 98 6.17 6.35 1,119.7 256 11 ResNet_v1_50 75.20 98 6.31 6.41 1,284.6 256 12 AI_Matrix_ResNet50 74.38 98 6.11 6.25 1,060.3 256 13 Inception_v2 73.90 43 6.28 6.56 2,032.0 128 14 AI_Matrix_DenseNet121 73.29 31 11.17 11.49 846.4 32 15 MLPerf_MobileNet_v1 71.68 17 2.46 2.66 2,576.4 128 16 V GG16 71.50 528 22.43 22.59 687.5 256 17 V GG19 71.10 548 23.0 23.31 593.4 256 18 MobileNet_v1_1.0_224 70.90 16 2.59 2.75 2,580.6 128 19 AI_Matrix_GoogleNet 70.01 27 5.43 5.55 2,464.5 128 20 MobileNet_v1_1.0_192 70.00 16 2.55 2.67 3,460.8 128 21 Inception_v1 69.80 26 5.27 5.41 2,576.6 128 22 BVLC_GoogLeNet 68.70 27 6.05 6.17 951.7 8 23 MobileNet_v1_0.75_224 68.40 10 2.48 2.61 3,183.7 64 24 MobileNet_v1_1.0_160 68.00 16 2.57 2.74 4,240.5 64 25 MobileNet_v1_0.75_192 67.20 10 2.42 2.6 4,187.8 64 26 MobileNet_v1_0.75_160 65.30 10 2.48 2.65 5,569.6 64 27 MobileNet_v1_1.0_128 65.20 16 2.29 2.46 6,743.2 64 28 MobileNet_v1_0.5_224 63.30 5.2 2.39 2.58 3,346.5 64 29 MobileNet_v1_0.75_128 62.10 10 2.3 2.47 8,378.4 64 30 MobileNet_v1_0.5_192 61.70 5.2 2.48 2.67 4,453.2 64 31 MobileNet_v1_0.5_160 59.10 5.2 2.42 2.58 6,148.7 64 32 BVLC_AlexNet 57.10 233 2.33 2.5 2,495.8 64 33 MobileNet_v1_0.5_128 56.30 5.2 2.21 2.33 8,924.0 64 34 MobileNet_v1_0.25_224 49.80 1.9 2.46 3.40 5,257.9 64 35 MobileNet_v1_0.25_192 47.70 1.9 2.44 2.6 7,135.7 64 36 MobileNet_v1_0.25_160 45.50 1.9 2.39 2.53 10,081.5 256 37 MobileNet_v1_0.25_128 41.50 1.9 2.28 2.46 10,707.6 256 T able 2. 37 pre-trained T ensorFlow image classication models from MLPerf [ 24 ], AI-Matrix [ 1 ], and T ensorF lo w Slim are used for evaluation and are sorted by accuracy . The graph size is the size of the frozen graph for a model. W e measured the online latency , 90 th percentile latency , maximum throughput in batched inference at the optimal batch size for each model. necessarily perform well in the batched inference scenario where throughput is important. W e measured how model throughput scales with batch size (referred to as throughput scalability ) and present this model characteristic in Figure 6 . As shown, the throughput scalability varies across models. Even models with similar network architectures can have dierent throughput scalability — e.g. models 4 and 6 , models 5 and 8 , and models 10 and 11 . In general, smaller models tend to have better throughput scalability . However , there 11 Cheng Li, Abdul Dakkak, et al. ( ) Figure 4. Accuracy vs online latency on A WS P3. ( / ) Figure 5. Accuracy vs maximum throughput on A WS P3. 1 2 3 4 5 6 7 8 9 10 11 12 13 14 15 16 17 18 19 20 21 22 23 24 25 26 27 28 29 30 31 32 33 34 35 36 37 1 2 4 8 16 32 64 128 256 1 9 17 26 33 Figure 6. The throughput spe edup (o ver batch size 1) heatmap across batch sizes on A WS P3 for the 37 models in T able 2 . The y − axis shows the batch size, whereas the x − axis shows the model ID. ( ) Figure 7. The batched latency of ResetNet 50 across the GP Us and CP Us listed in T able 1 . are exceptions, for example , the VGG models ( 16 and 17 ) are large and have good throughput scalability . Model Performance Across Systems — Overall, the ResNet_50 class of models oer a balance between model size, accuracy , performance and are commonly used in prac- tice. Thus we use ResNet_50 in online inference as an exam- ple to show how to use MLModelScope to choose the b est system given a mo del. W e evaluated ResNet_50 across all CP Us and GP Us listed in T able 1 and the results are shown in Figure 7 . On the CP U side, IBM S822LC Pow er8 achieves between 1 . 7 × and 4 . 1 × speedup over Intel Xeon E5-2686. The P8 CP U is more performant than X e on CP U [ 12 ], with the P8 running at 3 . 5 GHz and having 10 cores each capable of running 80 SMT threads. On the GP U side, as expected, V100 GP U achieves the lowest latency followed by the P100. The M60 GP U is 1 . 2 × to 1 . 7 × faster than the K80. When this information is coupled with the pricing information of the systems, one can determine which system is most cost- ecient given a latency target and benchmarking scenario. For example, given that K80 costs 0 . 90 $/hr and M60 costs 0 . 75 $/hr on A WS, we can tell that M60 is both more cost- ecient and faster than K80 — thus, M60 is overall better suited for ResNet_50 online inference when compared to K80 on A WS. 5.2 Model Exe cution Insp ection MLModelScope’s evaluation insp ection capability helps users to understand the model e xecution and identify performance bottlenecks. W e show this by performing a case study of “cold-start” inference (where the model needs to be loade d into the memory before inference) of BVLC_AlexNet (ID = 32 ). The cold-start inference is common on low-memory sys- tems and in serving schemes that perform one-o evaluation (thus models do not persist in memor y ). W e choose BVLC_AlexNet because it is easy to see the eects of the “cold-start” inference scenario using Cae on the A WS P3 and IBM P8 GP U systems with batch size 64 . The results are shown in Figure 8 . W e see that IBM P8 with P100 GP U is more performant than A WS P3 which has V100 GP U. W e used MLModelScop e ’s mo del execution inspection capability to delve deeper into the model and to r eveal the reason. W e “zoomed” into the longest-running layer ( fc6 ) and nd that most of the time is spent performing copies for the ( fc6 ) layer weights. On A WS P3, the fc6 layer takes 39 . 44 ms whereas it takes 32 . 4 ms on IBM P8. This is due to the IBM P8 system having an NVLink interconnect which has a theoretical peak CP U to GP U bandwidth of 40 GB/s ( 33 GB/s measured) while the A WS P3 system performs the copy over PCIe-3 which has a maximum theoretical band- width of 16 GB/s ( 12 GB/s measured). Ther efore, despite P3’s lower compute latency , we obser v ed a lower overall layer and model latency on the IBM P8 system due to the fc6 layer being memory b ound. Using MLModelScope’s model execution inspection, it is clear that the memory copy is the bottleneck for the “ cold- start” inference. T o verify this observation, we examined the Cae source code. Cae performs lazy memor y copies 12 The Design and Implementation of a Scalable DL Benchmarking Platform Layer Index Layer Name Layer T ype Layer Shape Dominant GP U Kernel(s) Name Latency (ms) Alloc Mem (MB) 208 conv2d_48/Conv2D Conv2D ⟨ 256 , 512 , 7 , 7 ⟩ volta_cgemm_32x32_tn 7.59 25.7 221 conv2d_51/Conv2D Conv2D ⟨ 256 , 512 , 7 , 7 ⟩ volta_cgemm_32x32_tn 7.57 25.7 195 conv2d_45/Conv2D Conv2D ⟨ 256 , 512 , 7 , 7 ⟩ volta_scudnn_128x128_relu_interior_nn_v1 5.67 25.7 3 conv2d/Conv2D Conv2D ⟨ 256 , 64 , 112 , 112 ⟩ volta_scudnn_128x64_relu_interior_nn_v1 5.08 822.1 113 conv2d_26/Conv2D Conv2D ⟨ 256 , 256 , 14 , 14 ⟩ volta_scudnn_128x64_relu_interior_nn_v1 4.67 51.4 T able 3. The ResNet 50 lay er information using A WS P3 (T esla V100 GP U) with batch size 256. The top 5 most time-consuming layers are summarized from the tracing prole . In total, there are 234 layers of which 143 take less than 1 ms. volta_sgemm_128x64_tn A WS P3 0 10 20 30 40 FC6 14.89 ms Copy 1 44MB to GPU using PCIe3 volta_sgemm_32x32_sliced1x4_nn IBM P8 Copy 1 44MB to GPU using NVLink FC6 7.47 ms maxwell_sgemm_128x64_tn gemmk1_kernel conv fc norm dropout softmax activation pooling compute memcpy over head 0 2 4 6 8 10 12 14 ms ms Figure 8. The MLMo delScope inspe ction of “ cold-start” BVLC_AlexNet inference with batch size 64 running Cae v 0 . 8 using GP U on A WS P3 and IBM P8 (T able 1 ). The color- coding of layers signify that they have the same type but does not imply that the layer parameters are the same. for layer weights just before execution. This causes com- pute to stall while the weights are being copied — since the weights of the FC lay er are the biggest. A better strategy — used by Cae2, MXNet, T ensorF low , and T ensorRT — is to eagerly copy data asynchronously and utilize CUDA streams to overlap compute with memory copies. 5.3 Benchmarking Analysis and Reporting T o show MLMo delScope ’s benchmarking analysis and report- ing capability , we used MLModelScope’s analysis worko w to perform an in-depth analysis of the 37 mo dels. All results were generated automatically using MLModelScope and fur- ther results are available at scalable20.mlmodelscope.org for the reader’s inspection. As an example, we highlight the model-layer-GP U kernel analysis of ResNet_50 using batch size 256 (the optimal batch size with the maximum through- put) on A WS P3. MLModelScope can capture the layers in a model and correlate the GP U kernels calls to each layer; i.e. tell which GP U kernels are executed by a certain layer . For example, layer index 208 is the most time-consuming layer within the model and 7 GP U kernels are launched by this layer: K1 volta_cgemm_32x32_tn taking 6 . 03 ms, K2 flip_filter taking 0 . 43 ms, K3 fft2d_r2c_16x16 taking 0 . 42 ms, K4 fft2d_c2r_16x16 taking 0 . 25 ms, K5 fft2d_- r2c_16x16 taking 0 . 25 ms, K6 ShuffleInTensor3Simple taking 0 . 06 ms, and K7 compute_gemm_pointers taking 0 . 004 ms. K1-5 and K7 are launche d by the cuDNN to perform convolution using the FFT algorithm [ 22 ]. K6 is launched by T ensorFlow and shues a layer shape base d on a permutation and is use d by the T ensorF lo w convolution layer to convert from T ensorF lo w’s lter format to the cuDNN lter format. T able 3 shows the top 5 most time-consuming layers of ResNet_50 as well as the dominant kernel (the ker- nel with the highest latency) within each layer . Through the analysis and summarization workow , users can easily di- gest the results and identify understand model-, framework-, and system-level bottlenecks. 6 Related W ork T o the authors’ knowledge, this the rst paper to describ e the design and implementation of a scalable DL benchmarking platform. While there have be en eorts to develop certain aspects of MLModelScop e , the eorts have b een quite dis- persed and there has not been a cohesive system that ad- dresses F1-10 . For example, while there is active work on proposing benchmark suites, reference workloads, and analy- sis [ 24 , 42 ], they provide F7 a set of benchmarking scenarios and a simple mechanism for F8 analysis and reporting of the results. The models within these benchmarks can be consumed by MLModelScope, and we have shown analysis which uses the benchmark-pro vided models. Other work are purely model ser ving platforms [ 7 , 27 ] which address F4 scalable evaluation and possibly F5 artifact versioning but nothing else. Finally , systems such as as [ 15 , 25 , 39 ] track the model and data fr om their use in training til deployment and can achieve F1 repr oducible and F2 consistent evaluation. T o our knowledge, the most relevant work to MLMo d- elScope is F AI-PEP [ 13 ]. F AI-PEP is a DL benchmarking platform targeted towards mobile devices. F AI-PEP aims to solve F1–5 and has limited support of F8 (limited to computing the n th percentile latency and displaying plot of these analyzed latencies). No in-depth proling and analysis are available within their platform. 7 Conclusion and Future W ork A big hurdle in adopting DL innovations is to evaluate, analyze, and compare their p erformance . This paper rst 13 Cheng Li, Abdul Dakkak, et al. identied 10 design objectives of a DL benchmarking plat- form. It then describe d the design and implementation of MLModelScope— an open-source DL benchmarking plat- form that achieves these design objectives. MLModelScop e oers a unied and holistic way to evaluate and inspect DL models, and provides an automated analysis and report- ing workow to summarize the results. W e demonstrated MLModelScope by using it to evaluate a set of models and show how model, hardware , and framework selection aects model accuracy and performance under dierent b ench- marking scenarios. W e are actively working on curating automated analysis and reports obtained through MLMod- elScope, and a sample of the generated reports is available at scalable20.mlmodelscope.org for the reader’s inspection. W e are further working on maintaining an online public instance of MLMo delScope where users can p erform the analysis presented without instantiating MLModelScope on their system. Acknowledgments This work is supported by IBM-ILLINOIS Center for Cogni- tive Computing Systems Research (C3SR) - a research col- laboration as part of the IBM Cognitive Horizon Network. References [1] AliBaba 2018. AI Matrix. hps://aimatrix.ai . Accessed: 2019-10-04. [2] Oren Ben-Kiki and Clark Evans. 2018. Y AML Ain’t Markup Language (Y AML T M ) V ersion 1.2. http://yaml.org/spec/1.2. Accessed: 2019-10- 04. [3] S. Browne, J. Dongarra, N. Garner , G. Ho, and P. Mucci. 2000. A Portable Programming Interface for Performance Evaluation on Mod- ern Processors. The International Journal of High Performance Comput- ing Applications 14, 3 (Aug. 2000), 189–204. hps://doi.org/10.1177/ 109434200001400303 [4] Tianqi Chen, Mu Li, Y utian Li, Min Lin, Naiyan W ang, Minjie W ang, Tianjun Xiao, Bing Xu, Chiyuan Zhang, and Zheng Zhang. 2015. Mxnet: A exible and ecient machine learning librar y for heterogeneous distributed systems. arXiv preprint arXiv:1512.01274 (2015). [5] Zhangxin Chen, Hui Liu, Song Yu, Ben Hsieh, and Lei Shao. 2013. Reser- voir Simulation on N VIDIA T esla GP Us. hps://developer .nvidia.com/ tensorrt . , 125-133 pages. hps://doi.org/10.1090/conm/586/11670 Accessed: 2019-10-04. [6] Cody Coleman, Matei Zaharia, Daniel Kang, Deepak Narayanan, Luigi Nardi, Tian Zhao, Jian Zhang, Peter Bailis, Kunle Olukotun, and Chris RÃľ. 2019. Analysis of DA WNBench, a Time-to- Accuracy Machine Learning Performance Benchmark. SIGOPS Oper . Syst. Rev . 53, 1 (July 2019), 14–25. hps://doi.org/10.1145/3352020.3352024 [7] Daniel Crankshaw , Xin W ang, Guilio Zhou, Michael J Franklin, Joseph E Gonzalez, and Ion Stoica. 2017. Clipper: A Low-Latency Online Prediction Serving System.. In NSDI . 613–627. [8] CUPTI 2018. The CUD A Proling T ools Interface. hps://developer . nvidia.com/cuda- profiling- tools- interface . Accessed: 2019-10-04. [9] Abdul Dakkak, Cheng Li, Simon Garcia de Gonzalo, Jinjun Xiong, and W en-mei Hwu. 2019. TrIMS: Transparent and Isolated Model Sharing for Low Latency Deep Learning Inference in Function-as-a-Service. In 2019 IEEE 12th International Conference on Cloud Computing (CLOUD) . IEEE, IEEE, 372–382. hps://doi.org/10.1109/cloud.2019.00067 [10] Je Dean, David Patterson, and Cli Y oung. 2018. A New Golden Age in Computer Ar chitecture: Empowering the Machine-Learning Revolution. IEEE Micro 38, 2 (March 2018), 21–29. hps://doi.org/10. 1109/mm.2018.112130030 [11] Jia Deng, W ei Dong, Richard Socher , Li-Jia Li, Kai Li, and Li Fei-Fei. 2009. ImageNet: A large-scale hierarchical image database. In 2009 IEEE Conference on Computer Vision and Pattern Re cognition . IEEE, IEEE, 248–255. hps://doi.org/10.1109/cvpr .2009.5206848 [12] V adim V Elisseev , Milos Puzovic, and Eun Kyung Le e . 2018. A Study on Cross- Architectural Modelling of Power Consumption Using Neural Networks. Supercomputing Frontiers and Innovations 5, 4 (2018), 24–41. [13] F AI-PEP 2019. Faceb ook AI Performance Evaluation Platform. hps: //github.com/facebook/F AI- PEP . Accessed: 2019-10-04. [14] W anling Gao, Fei T ang, Lei W ang, Jianfeng Zhan, Chunxin Lan, Chun- jie Luo, Y unyou Huang, Chen Zheng, Jiahui Dai, Zheng Cao, Daoyi Zheng, Haoning T ang, Kunlin Zhan, Biao Wang, Defei Kong, T ong Wu, Minghe Y u, Chongkang Tan, Huan Li, Xinhui Tian, Y atao Li, Junchao Shao, Zhenyu W ang, Xiaoyu W ang, and Hainan Y e. 2019. AIBench: An Industry Standard Internet Service AI Benchmark Suite. arXiv: cs.CV/1908.08998 [15] Sindhu Ghanta, Lior Khermosh, Sriram Subramanian, Vinay Sridhar , Swaminathan Sundararaman, Dulcardo Arteaga, Qianmei Luo, Dre w Roselli, Dhananjoy Das, and Nisha Talagala. 2018. A Systems Per- spective to Reproducibility in Production Machine Learning Domain. (2018). [16] gRPC 2018. gRPC. hps://w ww .grpc.io . Accessed: 2019-10-04. [17] Odd Erik Gundersen, Y olanda Gil, and David W . Aha. 2018. On Re- producible AI: T owards Reproducible Research, Open Science, and Digital Scholarship in AI Publications. AIMag 39, 3 (Sept. 2018), 56–68. hps://doi.org/10.1609/aimag.v39i3.2816 [18] Kim Hazelwood, Sarah Bird, David Brooks, Soumith Chintala, Utku Diril, Dmytro Dzhulgakov , Mohamed Fawzy , Bill Jia, Y angqing Jia, Aditya Kalro, James Law , Kevin Lee, Jason Lu, Pieter Noordhuis, Misha Smelyanskiy , Liang Xiong, and Xiaodong W ang. 2018. Ap- plied Machine Learning at Facebo ok: A Datacenter Infrastructure Perspective. In 2018 IEEE International Symposium on High Perfor- mance Computer A rchitecture (HPCA) . IEEE, IEEE, 620–629. hps: //doi.org/10.1109/hpca.2018.00059 [19] Matthew Hutson. 2018. Articial intelligence faces reproducibility crisis. [20] Y angqing Jia. 2018. Cae2. hps://www .cae2.ai . [21] Y angqing Jia, Evan Shelhamer , Je Donahue, Sergey Karayev , Jonathan Long, Ross Girshick, Sergio Guadarrama, and T revor Darrell. 2014. Cae. In Proceedings of the ACM International Conference on Multimedia - MM ’14 . A CM, ACM Press, 675–678. hps://doi.org/10.1145/2647868. 2654889 [22] Marc Jorda, Pedro V alero-Lara, and Antonio J Peña. 2019. Performance Evaluation of cuDNN Convolution Algorithms on N VIDIA V olta GP Us. IEEE Access (2019). [23] Liam Li and Ameet T alwalkar . 2019. Random Sear ch and Reproducibil- ity for Neural Architecture Search. arXiv: cs.LG/1902.07638 [24] MLPerf 2019. MLPerf. hps://mlperf.org . Accessed: 2019-10-04. [25] Jon Ander Novella, Payam Emami Khoonsari, Stephanie Herman, Daniel Whitenack, Marco Capuccini, Joachim Burman, Kim Kultima, and Ola Spjuth. 2018. Container-based bioinformatics with Pachy- derm. Bioinformatics 35, 5 (Aug. 2018), 839–846. hps://doi.org/10. 1093/bioinformatics/bty699 [26] nvml 2019. nvml. hps://developer .nvidia.com/nvidia- management- library- nvml . Accessed: 2019-10-04. [27] Christopher Olston, Noah Fiedel, Kiril Gor ovoy , Jeremiah Harmsen, Li Lao, Fangwei Li, Vinu Rajashekhar , Sukriti Ramesh, and Jordan Soyke. 2017. T ensorFlow-Serving: Flexible, high-performance ML ser ving. arXiv preprint arXiv:1712.06139 (2017). [28] OpenTracing 2018. OpenTracing: Cloud Native Computing Founda- tion. hp://opentracing.io . Accessed: 2019-10-04. 14 The Design and Implementation of a Scalable DL Benchmarking Platform [29] Adam Paszke, Sam Gross, Soumith Chintala, and Gregory Chanan. 2017. Pytorch: T ensors and dynamic neural networks in python with strong gpu acceleration. Py T orch: T ensors and dynamic neural networks in Python with strong GP U acceleration 6 (2017). [30] perf-tools 2019. perf-to ols. hps://github.com/brendangregg/perf- tools . Accessed: 2019-10-04. [31] Hans E. P lesser . 2018. Reproducibility vs. Replicability: A Brief History of a Confused T erminology . Fr ont. Neur oinform. 11 (Jan. 2018), 76. hps://doi.org/10.3389/fninf.2017.00076 [32] Python Subinterpreter 2019. Initialization, Finalization, and Threads. hps://docs.python.org/3.6/c- api/init.html#sub- interpreter- support . Accessed: 2019-10-04. [33] RecordIO 2019. RecordIO . hps://mxnet.incubator .apache.org/ versions/master/architecture/note_data_loading.html . Accessed: 2019-10-04. [34] Frank Seide and Amit Agarwal. 2016. Cntk. In Proceedings of the 22nd ACM SIGKDD International Conference on Knowledge Discovery and Data Mining - KDD ’16 . ACM, ACM Press, 2135–2135. hps: //doi.org/10.1145/2939672.2945397 [35] Benjamin H Sigelman, Luiz Andre Barroso, Mike Burrows, Pat Stephen- son, Manoj Plakal, Donald Beaver , Saul Jaspan, and Chandan Shanbhag. 2010. Dapper , a large-scale distributed systems tracing infrastructure . T echnical Report. T echnical report, Google, Inc. [36] Rachael T atman, Jake V anderPlas, and Sohier Dane. 2018. A Practical T axonomy of Reproducibility for Machine Learning Research. (2018). [37] T ensorowLite 2018. T ensorFlow Lite is for mobile and embedded devices. hps://ww w .tensorf low .org/lite/ . Accessed: 2019-10-04. [38] TFRecord 2019. TFRecord. hps://www .tensorf low .org/guide/ datasets#consuming_tfrecord_data . Accessed: 2019-10-04. [39] Jason T say, T odd Mummert, Norman Bobro, Alan Braz, Peter W es- terink, and Martin Hirzel. 2018. Runway: Machine learning mo del experiment management tool. [40] Y uan Yu, Peter Hawkins, Michael Isard, Manjunath Kudlur , Ra- jat Monga, Derek Murray , Xiaoqiang Zheng, MartÃŋn Abadi, Paul Barham, Eugene Brevdo , Mike Burrows, Andy Davis, Je Dean, San- jay Ghemawat, and Tim Harley . 2018. Dynamic control ow in large-scale machine learning. In Proceedings of the Thirteenth EuroSys Conference on - EuroSys ’18 , V ol. 16. ACM Press, 265–283. hps: //doi.org/10.1145/3190508.3190551 [41] Zenodo 2019. Zenodo - Research. Shared. hps://w ww .zenodo.org . Accessed: 2019-10-04. [42] Hongyu Zhu, Mohamed Akrout, Bojian Zheng, Andr ew Pelegris, Amar Phanishayee, Bianca Schroeder , and Gennady Pekhimenko. 2018. Tb d: Benchmarking and analyzing de ep neural network training. arXiv preprint arXiv:1803.06905 (2018). 15
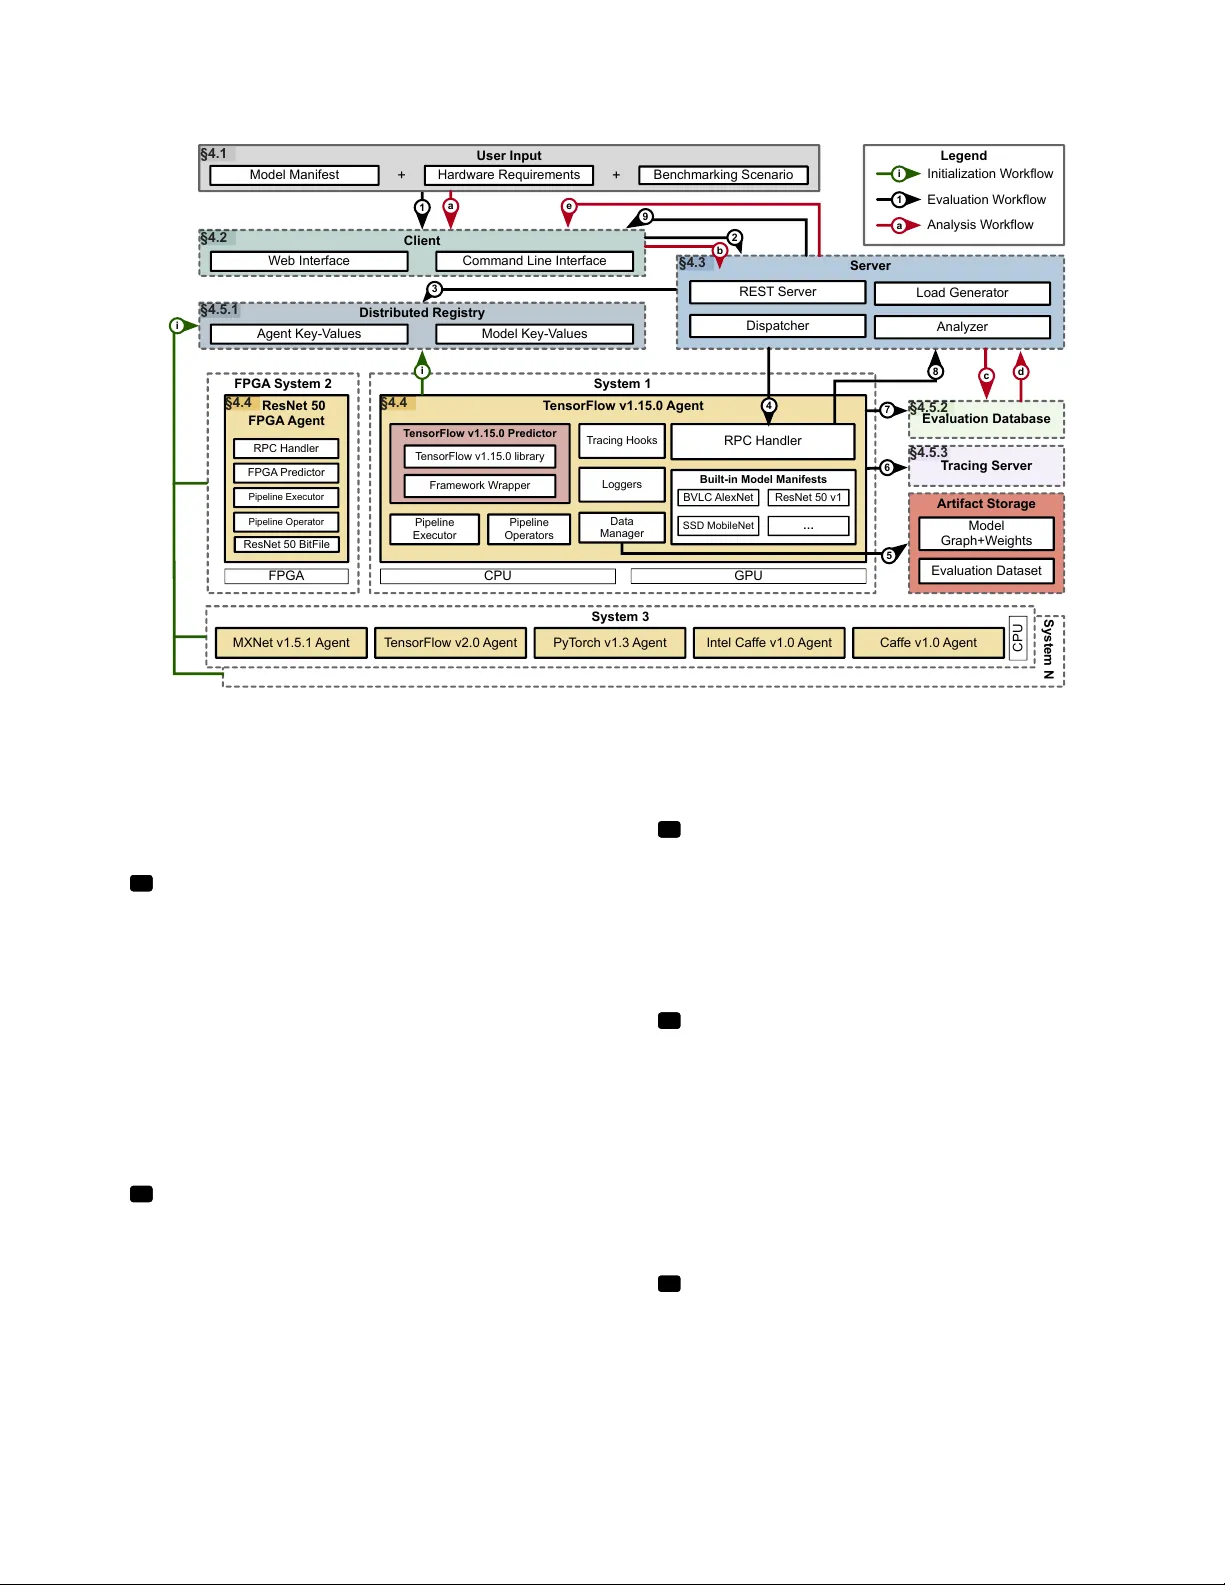
Original Paper
Loading high-quality paper...
Comments & Academic Discussion
Loading comments...
Leave a Comment