Learning Curves for Deep Neural Networks: A Gaussian Field Theory Perspective
In the past decade, deep neural networks (DNNs) came to the fore as the leading machine learning algorithms for a variety of tasks. Their raise was founded on market needs and engineering craftsmanship, the latter based more on trial and error than o…
Authors: Omry Cohen, Or Malka, Zohar Ringel
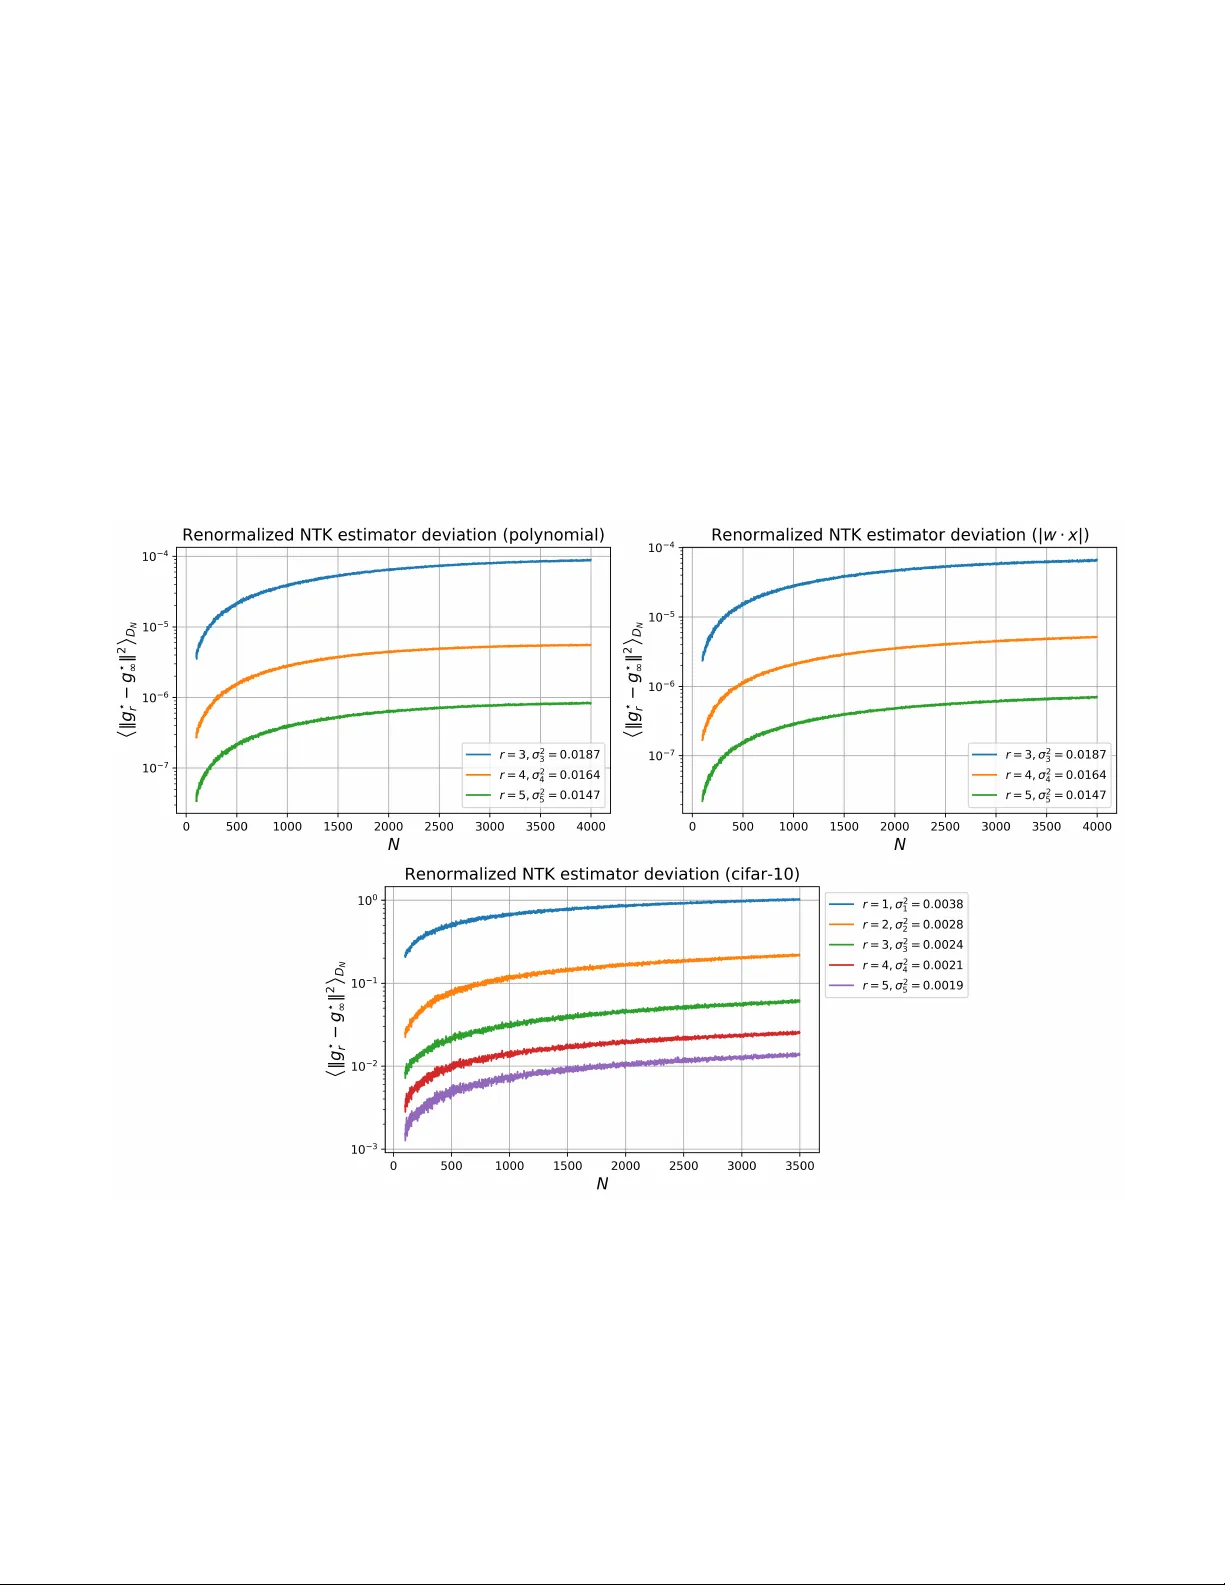
Learning curv es for deep neural net w orks: A field theory p ersp ectiv e Omry Cohen, ∗ Or Malk a, † and Zohar Ringel ‡ The R ac ah Institute of Physics, The Hebr ew University of Jerusalem. (Dated: No vem b er 30, 2020) In the past decade, deep neural net works (DNNs) came to the fore as the leading machin e learn- ing algorithms for a v ariety of tasks. Their raise w as founded on mark et needs and engineering craftsmanship, the latter based more on trial and error than on theory . While still far b ehind the application forefront, the theoretical study of DNNs has recently made imp ortant adv ancements in analyzing the highly ov er-parameterized regime where some exact results hav e been obtained. Lev eraging these ideas and adopting a more physics-lik e approach, here we construct a versatile field-theory formalism for supervised deep learning, inv olving renormalization group, F eynman dia- grams and replicas. In particular we sho w that our approac h leads to highly accurate predictions of learning curves of truly deep DNNs trained on p olynomial regression problems. It also explains in a concrete manner why DNNs generalize well despite b eing highly ov er-parameterized, this due to an en tropic bias to simple functions which, for the case of fully-connected DNNs with data sampled on the hypersphere, are low order p olynomials in the input vector. Being a complex interacting system of artificial neurons, we b eliev e that such to ols and metho dologies b orro wed from condensed matter ph ysics would pro ve essen tial for obtaining an accurate quantitativ e understanding of deep learning. I. INTR ODUCTION Deep artificial neural net works (DNNs) ha ve been rapidly adv ancing the state-of-the-art in mac hine learn- ing, showing human and sometimes sup er-h uman p erfor- mance in image recognition [1], speech recognition [2], reinforcemen t learning [3] and natural language pro cess- ing tasks [4]. Their raise to prominence w as largely results-driv en, with little theoretical supp ort or guaran- tee [5]. Suc h mo de of in ven tion is v ery different from ho w, sa y , the transistor w as discov ered, and more akin to how new materials, suc h as lithium-ion batteries, are disco vered. Indeed, b eing h uge interacting systems of ar- tificial neurons, DNNs are more analogous to a complex meta-material than to an electronic comp onent [6]. Due to this complexit y , a general theory of deep learning with predictiv e p ow er is still lacking. Not withstanding, recen tly sev eral results w ere ob- tained in the highly ov er-parameterized regime [7, 8] where the role pla yed by any sp ecific DNN w eight is small. This facilitated the pro ofs of v arious b ounds [9– 11] on generalization for shallow netw orks and, more rel- ev ant for this w ork, tw o corresp ondences betw een fully- trained DNNs and a different type of inference mo dels called Gaussian Pro cesses (GPs) [12]. As shown below, these can b e though t of as non-in teracting scalar field- theories with disorder and a non-lo cal action. The first such correspondence [8] b et ween GPs and trained DNNs is kno wn as the Neural T angen t Kernel result, which w e would refer to here as the NTK cor- resp ondence. It holds when highly ov er-parameterized DNNs are initialized according to standard practice and ∗ omry .cohen@mail.h uji.ac.il † or.malk a@mail.huji.ac.il ‡ zohar.ringel@mail.huji.ac.il trained with Mean-Square-Error (MSE) loss at v anishing learning rate and without weigh t deca y . The second corresp ondence [13] (the NNSP , Neu- ral Net works Sto chastic Pro cess corresp ondence) applies when DNNs are trained using a similar proto col whic h in volv es random noise, roughly mimicking the Sto chastic Gradien t Descent (SGD) optimization, as well as weigh t- deca y . It relates the outputs of the trained DNN to a Sto c hastic Pro cess (SP) which, in the highly ov er- parameterized limit, tends to a GP . It th us yields an ad- ditional training protocol, complementary in some w ays to the previous one, which is analytically tractable. Ho w m uch of deep learning can b e explained through suc h corresp ondences remains to b e seen. On the one hand, some asp ects suc h as learning sharp filters (fea- tures) in the first DNN lay ers, seem out of reach as sp e- cific DNN w eights c hange only infinitesimally in the NTK case and remain largely random, apart from a small bias, in the NNSP case. In addition, learning in the NTK regime, sometimes dubbed ”lazy-learning”, often lags be- hind state-of-the-art training proto cols (see 14 and Refs. therein) where finite learning-rates, widths, and mini- batc hes are used. On the other hand, lazy-learning or more generally GP metho ds are b eing extended and im- pro ved [15 – 18] b y imp orting technologies such as p o ol- ing and data-augmentation. Currently GP mo dels cor- resp onding to DNNs are comp etitive with deep learning on the UCI datasets [15] as well as F ashion-MNIST [16], whereas on the CIF AR-10 dataset the performance of the best GPs currently lags 5% b ehind celebrated DNNs suc h as AlexNet [16, 18], while surpassing pre-AlexNet non-deep metho ds b y 8% [19]. In addition, there is the prosp ect of extending these corresp ondences by in- clude non-linearities coming from finite-width [13] and finite-learning rates [20, 21] settings. These results and prosp ects invite further study of ho w such DNNs trained in the NTK and NNSP regimes make predictions. 2 In this w ork we introduce a versatile field-theory for- malism for analyzing deep neural netw orks, which in- v olves replicas, F eynman diagrams, and renormalization group techniques. In its most basic version, studied in depth b elo w, it applies to DNNs trained using the pro- to cols for which the NTK and NNSP corresp ondence hold exactly and lead to GP mo dels. F or these cases we pro vide expressions for the generalization p o wer of fully- connected DNNs in the form of learning curves. These learning curves dep end on the dataset distribution and the target which w e learn. F or uniform datasets on the h yp er-sphere and any target function, our learning curv es b ecome fully explicit and pro vide a clear picture of how suc h DNNs generalize. This includes the more challeng- ing case of the NTK correspondence where certain in- finities in the action are remo ved by our renormalization group transformation. T o the b est of our knowledge, the accuracy at whic h our learning-curv es capture the empir- ical ones far exceeds the current theoretical state of the art. In addition our formalism can also accommodate v ar- ious extension of these corresp ondences. F or the case of the NNSP correspondence, we can work with loss func- tions different than MSE as well as corrections to the infinite ov er-parameterization limit. F urthermore, recent results on extensions of the NTK corresp ondence [20], suggest that high-learning-rate leads to a renormalized NTK corresp ondence whose p erformance can again b e analyzed using our approac h. Such extensions ma y prov e useful in addressing the gap [22], b et ween GPs and their DNN counterparts. W e hop e that the results and formalism intro- duced here would aid in dev eloping a more physics- lik e paradigm for studying DNNs, complementary to the pro of-based approach common in theoretical computer science (see also [23 – 27]). Suc h a paradigm should fill in the gap, t ypically large in complex systems, b et w een what can b e predicted follo wing some reasonable assump- tions and what can b e prov en rigorously . This pap er is structured as follo wed. In section I I I w e pro vide the necessary bac kground on Deep neural net- w orks, Gaussian pro cesses and the corresp ondences b e- t ween the tw o. Section IV describes our no vel field theory approac h and analytical results. Section V considers the case of uniformly distributed data on the h yp ersphere, where further analytical simplifications can b e carried. Section VI in tro duces the RG approach used to tackle the noiseless NTK case. Section VI I applies our results to concrete examples and compares them with empiri- cal results. Section VI I I shows how our results can b e used to perform efficien t h yp er-parameters optimization on actual DNNs, and Section IX summarizes the results and discusses p ossible directions for future w ork. I I. PRIOR W ORKS Learning curves for GPs hav e b een analyzed using a v ariety of techniques (see [12] for a review) most of whic h focus on a GP-teac her a v eraged case where the target/teac her is drawn from the same GP used for in- ference (matc hed priors) and is furthermore av eraged o ver. Fixed-teacher or fixed-target learning curves hav e b een analyzed using a grand-canonical/Poisson-a veraged approac h [28] similar to the one we used. How ever, their treatment of the resulting partition function was v ariational whereas we tak e a different, perturbation- theory based, approach. In addition, previous cited re- sults for MSE-loss break in the noiseless limit [28]. T o the b est of our knowledge, noiseless GPs learning-curv es ha ve been analyzed analytically only in the teacher- a veraged case and limited to the follo wing settings: F or matc hed priors, exact results are known for one dimen- sional data [12, 29] and t wo dimensional data with some limitations of how one samples the inputs (in the con- text of optimal design) [30, 31]. In addition [32] de- riv ed a lo wer bound on generalization. F or noiseless in- ference with partially mismatched-priors (matching fea- tures, mismatc hing eigenv alues) and at large input di- mension the teacher and dataset av eraging inv olved in obtaining learning curves, has b een performed analyti- cally and the resulting matrix traces analyzed numeri- cally [33]. Notably none of these cited results apply in an y straightforw ard manner in the NTK-regime. Considering kernel eigenv alues, explicit expression for the features and eigenv alues of dot-pro duct kernels ( K = K ( x · x 0 )) w ere given in [34]. The fact that the l -th eigen- v alue of such k ernels scales as d − l ( d b eing the input di- mension), which we used in our deriv ation of the b ound, has been noticed in [33]. Kernels with a trimmed spec- trum where the sp ectrum is trimmed after the first r ’s leading eigenv alues, has previously b een suggested as a w ay of reducing the computational cost of GP inference [35]. In con trast we trim the T a ylor expansion of the k ernel function rather than the sp ectrum (which has a v ery different effect) and show that an effectiv e observ a- tion noise comp ensates for our trimming/renormalization pro cedure. Sev eral in teresting recen t w orks giv e bounds on gener- alization [9 – 11] whic h show O (1 / √ N ) asymptotic deca y of the learning-curv e (at b est). In con trast our predic- tions are t ypically w ell b elow this b ound. I II. THEORETICAL BA CK GROUND A. DNNs, exp ected error, and learning curv es W e begin with the standard definitions of DNNs as they apply to this w ork. While the ma jority of this w ork is applicable to many netw ork arc hitectures, we will fo cus on a simple feed forward netw ork for the sake of simplic- it y . A fully connected feed forward DNN with L hid- 3 den lay ers of width n l for l = 1 , . . . , L and readout lay er n L +1 = k is a function f defined recursively b y: h l +1 = x l W l +1 + b l +1 x l +1 = φ h l +1 f x ; W 1 , . . . , W l , b 1 , . . . , b l = x L +1 (1) where φ is a p oint-wise activ ation function, x 0 ∈ R d is the input of the netw ork and W l +1 ∈ R n l × n l +1 , b l +1 ∈ R n l +1 are trainable w eights and biases, which will b e collectiv ely referred to as w eights from here on. Eac h comp onen t of the w eights is usually initialized randomly from a normal distribution N 0 , σ 2 w for the weigh ts and N 0 , σ 2 b for the biases. In the usual setting one starts with a training set – a set of input p oints D = { x n } N n =1 where x n ∈ R d along with their lab els { l n } N n =1 where l n ∈ R k . One then pic ks w eights for the net work b y minimizing a loss function L ( f ( D ) , { l n } ) which compares the v alues of net work function o ver D to the labels { l n } N n =1 , assigning a smaller v alue to points where the net work function and lab els are similar. One then finds weigh ts whic h minimize the loss b y some v ariation of gradient descen t , usually sto c hastic gradien t descen t (SGD) wherein one appro ximates the gradien t at each iteration using a random batch of the training set (see [36] for details). The p erformance of the net work is then ev aluated by computing the loss function o ver a set of lab eled p oin ts, different from the training set, known as the test set. This is known as the test error of the netw ork, and is used as a pro xy for the exp e cte d err or – the loss av eraged o ver dra ws from the dataset distribution. One of the most detailed ob jects quan tifying the per- formance of a machine learning algorithm, and the main fo cus of this work, is its learning-curve – a graph of how the exp ected error diminishes with the num b er of data p oin ts ( N ). There are curren tly no analytical predictions or b ounds w e are aw are of for DNN learning-curv es whic h are tigh t even just in terms of their scaling with N , let alone tight in an absolute sense (see App. I I) B. Gaussian pro cesses regression In this w ork w e will in vestigate the prop erties of DNNs b y their correspondence with GPs. W e supply here some standard definitions of GPs and their usage in regression tasks. Regression here simply means appro ximating a function ( g ( x )) based on discrete samples ( { g ( x n ) } N n =1 ). A GP is commonly defined as a sto c hastic pro cess of whic h any finite subset of random v ariables follow a m ul- tiv ariate normal distribution [12]. In a similar fashion to m ultiv ariate normal v ariables, GPs are also determined b y their first and second moments. The first is typically tak en to b e zero, and second is known as the cov ariance function or the kernel K xx 0 = E [ f ( x ) f ( x 0 )], where E [ · ] here denotes expectation with respect to the GP distri- bution. The main app eal of GPs is that Ba y esian Infer- ence with GP priors is tractable [12]. In GP inference we use the mean of the GP distribution conditioned on the data (p osterior) as the predictor g ∗ , and it is given b y: g ∗ ( x ∗ ) = N X n,m =1 K x ∗ ,x n [ K ( D ) + σ 2 I ] − 1 nm l m (2) where x ∗ is a new data p oint, l m are the training targets, x n are the training data-p oints, [ K ( D )] nm = K x n ,x m is the co v ariance-matrix (the cov ariance-function pro jected on the training dataset D ), and σ 2 is the v ari- ance of the assumed Gaussian noise of the lab els, which also acts as a regulator of the prediction. Some intuition for this formula can b e gained by v erifying that in the noiseless case ( σ 2 = 0) the prediction at some training p oin t x ∗ = x q coincides with that p oint’s label g ∗ = l q . The quantit y of interest in this pap er, which we define no w, is the exp ected error av eraged ov er all the p ossible datasets. Throughout this pap er w e will assume that b oth train and test points are drawn from a probabilit y measure dµ x = P ( x ) dx . With this in mind, we define the exp ected error of a prediction g ∗ as k g − g ∗ k 2 = Z dµ x ( g ( x ) − g ∗ ( x )) 2 (3) Note that g ∗ is itself a function of N dra ws from µ whic h make up the training set D N . Our quan tity of in terest, the dataset a veraged exp ected error (D AEE), is Eq. (3) a veraged ov er the ensem ble of all possible N sized training sets. W e denote this av erage as h·i D N , so the D AEE is giv en b y hk g ∗ − g k 2 i D N . The learning curve is the dep endence of the DAEE on N . W e see that in order to calculate learning curves, one needs to calculate quan tities like h g ∗ i D N and h g ∗ 2 i D N . Equation (2) determines the predictions, and therefore the learning-curves, but it is not very conv enient for an- alytic exploration of the exp ected predictions. This fact is due to the (p oten tially very) large matrix inv ersion in- v olved, and the additional av eraging o ver D N required. Nonetheless, there are some approximations for the ex- p ected prediction h g ∗ i D N . The most famous of which is the equiv alence kernel (EK) result [12]: h g ∗ ( x ) i D N ≈ g ∗ E K,N ( x ) = X n λ n λ n + σ 2 N g n φ n ( x ) (4) Where λ n and φ n ( x ) here are the eigenv alues and eigenfunctions of the kernel w.r.t the input probabilit y measure µ , and g ( x ) = P n g n φ n ( x ) is the target func- tion. One notices immediately that this approximation breaks do wn completely in the noiseless case where Eq. (4) implies p erfect estimation of the target with just one data point. T o gain some intuition as to wh y having 4 σ 2 = 0 hinders predictions of h g ∗ i D N one can view it as a hard constraint ( f ( x n ) = g ( x n )), and hard con- strain ts are typically less tractable than soft ones. In a related view, finite σ 2 can b e seen as a form of a verag- ing which smo oths and regulates analytical expressions making them more tractable. Another limitation of the EK result is that (to the b est of our knowledge) there is no systematic wa y to extend it in orders of 1 / N and get a more detailed picture of generalization in GP regression (GPR). C. F rom DNNs to GPs through Langevin dynamics Here w e review, for completeness, sev eral recent cor- resp ondences b etw een DNNs and GPs. It has long b een known [37] that randomly initialized, infinitely wide DNNs with i.i.d weigh ts are equiv alent to samples from a GP known as the neural netw ork GP (NNGP). More recen tly it was shown that training only the last lay er of a netw ork with gradient decent is equiv alent to posterior sampling of the NNGP [38], and consequen tly a verag- ing the prediction of many net works trained on the same dataset is equiv alent to GPR. T urning to more standard training of the en tire DNN, it has b een recently estab- lished [8] that fully training a netw ork with v anishing learning rate for infinitely long time and MSE loss yields the same predictions as a noiseless GPR with a different k ernel, the neural tangen t k ernel (NTK), along with an additional initialization dep enden t term. Averaging o ver man y initialization seeds giv es an exact corresp ondence with a GP whose kernel is the NTK. Recen tly , another nov el corresp ondence b etw een DNNs and GPs has b een introduced [13]. Due to its simplicity w e shall re-deriv e it here. Consider the training of a DNN using gradient descent (full-batch SGD) with weigh t de- ca y and added white noise, in the limit of v anishing learn- ing rate. F or sufficien tly small learning rate, and making the reasonable assumption that the gradients of the loss are globally Lifshitz, the SGD equations are ergo dic and con verge to the same in v ariant measure (equilibrium dis- tribution) as the following Langevin equation [39, 40] dw i dt = − ∂ w i L [ z W ] + X j T w 2 j 2 σ 2 w + √ 2 T ξ i ( t ) (5) where ξ i ( t ) b eing a set of Gaussian white noise ( h ξ i ( t ) ξ j ( t 0 ) i = δ ij δ ( t − t 0 )), T accoun ting for the strength of the noise, w i b eing the set of net works param- eters ( W ), z W is the netw ork output for a given configu- ration of W and L is the loss function. The equilibrium- distribution or in v ariant-measure describing the steady state of the abov e equation is the Boltzmann distribu- tion [40] P ( W ) ∝ e − 1 2 σ 2 L [ z W ] − 1 2 σ 2 w P i w 2 i with T = 2 σ 2 . Notably , v arious works argue that at lo w learning rates, discrete SGD dynamics running for long enough times, reac hes the ab o ve equilibrium, approximately [41, 42]. Next, w e adopt the approach of [8] and describ e the dynamics in function space ( f ) instead of w eight space ( W ). Using the Boltzmann distribution describ ed ab ov e, the p ost-training probabilit y density function for some function f is given by P [ f ] = Z dW P ( W ) δ [ f − z W ] (6) ∝ e − 1 2 σ 2 L [ f ] Z dW e − 1 2 σ 2 w P i w 2 i δ [ f − z W ] ∝ P nd [ f ] e − 1 2 σ 2 L [ f ] where we iden tify P nd [ f ] ∝ R dW e − 1 2 σ 2 w P i w 2 i δ [ f − z W ] as the distribution of the output of the net w ork after b eing trained with no data (or equiv alently , a v anish- ing loss function). δ [ ... ] is a functional delta function, whic h can b e thought of as the limit of a large prod- uct of regular delta-functions on each F ourier comp o- nen t of the argumen t. As we will discuss, for an in- finitely ov er-parameterized netw ork P nd coincides with the prior of a NNGP with the weigh ts and biases v ari- ance determined b y training parameters rather than b y initialization. How ever, for finite ov er-parameterization it b ecomes a more generic sto chastic pro cess determined b y the neural netw ork (an NNSP). In [13], the leading finite-width corrections w ere calculated and shown to re- sult in f 4 corrections to the prior. Clearly the practical use of the ab o ve result hinges on ho w quic kly the dynamics mixes or reac hes ergo d- icit y . While ergo dicity in its full sense (for any weigh t- space observ able) seems unrealistic in this non-conv ex scenario, reaching ergo dicit y in the mean of the outputs of the DNNs (for low order p olynomials in f ( x )) may be quic ker. This milder form of ergo dicity was shown nu- merically for fully-connected DNNs trained on regression problems similar to those studied here as w ell as CNNs trained on CIF AR-10 [13]. F rom no w on we shall focus on the infinite o ver- parameterized limit. IV. FIELD THEOR Y FORMULA TION OF GP LEARNING-CUR VES A. Rephrasing GPs as a field theory W e b egin by phrasing inference with GPs in the lan- guage of field theory . T o this end we first write a Gaus- sian distribution ov er the space of functions that leads to a tw o p oin t correlation function equal to K xx 0 . This is giv en by P 0 [ f ] ∝ e − 1 2 k f k 2 K (7) k f k 2 K = Z dµ x dµ x 0 f ( x ) K − 1 ( x, x 0 ) f ( x 0 ) where K − 1 ( x, x 0 ) is the in verse kernel function, meaning that R dµ x 0 K ( x, x 0 ) K − 1 ( x 0 , x 00 ) = δ ( x − x 00 ) /P ( x ) where 5 FIG. 1. A physical picture of sup ervised deep learn- ing. The output of the DNN, as a function of input data, can b e seen as an elastic mem brane (surface) which relaxes to its equilibrium distribution during training. In this steady state it fluctuates (green surface) so to maximize its en tropy while minimizing its energy . Its energy consists of a data-term pin- ning it to its target v alues (yello w surface) on the training p oin ts (red-p oin ts). In addition an elastic energy term deter- mined by the DNNs arc hitecture, affects its b eha vior b et ween the training p oin ts. F or infinitely ov er-parameterized DNNs, this elastic energy is quadratic and the av erage surface (blue surface) can b e calculated analytically , up to a large matrix in version, using Gaussian Pro cesses regression. dµ = P ( x ) dx . This formalism is sometimes referred to as Information Field Theory (IFT) [43]. A differen t viewp oin t on P 0 [ f ] comes from viewing f ( x ) as the outputs of a wide DNN with weigh ts dra wn from an i.i.d Gaussian distribution P 0 ( W ). It is well known [44] that correlations b etw een the outputs of random DNNs are Gaussian and gov erned by some k ernel, K xx 0 . This k ernel is determined, in a tractable manner, b y the DNNs arc hitecture. F rom a field-theory viewp oint this can be stated as P 0 [ f ] = Z dW P 0 ( W ) δ [ f − z W ] (8) at infinite width, where z W ( x ) is the output of a DNN with weigh ts W on an input p oint x . The keen reader ma y b e alarmed b y the fact that this definition of P 0 [ f ] do es not in volv e the measure µ ( x ). How ever, as sho wn in [12], the norm k f k 2 K (called the RKHS norm), and there- fore Eq. (7) are in fact the same for any tw o probabilit y measures with iden tical supp ort. P erforming Bay esian inference in the con text of GPs means conditioning Eq. (7) using Bay es’ theorem and assuming Gaussian noise with amplitude σ 2 on our target function ( g ( x )). This yields the additional factor P [ f ] ∝ e − 1 2 k f k 2 K − 1 2 σ 2 P N i =1 ( f ( x i ) − g ( x i )) 2 (9) It can be c hec ked that the expectation v alue of f ( x ∗ ) under the ab o v e probabilit y yields Eq. (2). Notably , by taking into account Eq. (8), the ab ov e ex- pression coincides with that obtained via the NNSP cor- resp ondence Eq. (6) in the infinite o v er-parameterization limit where P nd [ f ] = P 0 [ f ] for MSE loss and a suitably c hosen K xx 0 . In the NNSP context, the data-term came out quadratic when training using MSE loss and more generally it could be replaced with a general loss func- tion L [ f ], so the DNNs predictive distribution b ecomes P [ f ] ∝ e − 1 2 k f k 2 K − 1 2 σ 2 L [ f ] (10) where K in this context is the kernel of the DNN trained with no data. Though not necessarily Gaussian, this ex- pression can still b e treated using mean-field or p erturba- tiv e approac hes. A more detailed treatmen t of differen t loss functions, most notably as cross-entrop y loss, is left for future w ork. Denoting S [ f ] = 1 2 k f k 2 K + 1 2 σ 2 L [ f ] (the ”Information Hamiltonian”, in IFT terminology), Eq. (9) gives rise to the partition function Z [ α ] = Z D f e − S [ f ]+ R dxα ( x ) f ( x ) (11) where R dxα ( x ) f ( x ) is a source term used to calculate cum ulants of P [ f ], and sp ecifically the a verage prediction of the net work: g ∗ ( x ∗ ) = δ log ( Z [ α ]) δ α ( x ∗ ) α =0 = 1 Z [0] Z D f · f ( x ∗ ) e − S [ f ] (12) where δ /δ α stands for functional deriv ativ e. As shown visually in Fig. 1, this expression leads to a tangible ph ysical picture of ho w DNNs learn. Their output as a function of the input can b e seen as a fluctuating elastic mem brane ov er input space whic h, in the highly o ver- parameterized limit, is in its linear elastic regime. The training data appears as isolated points at which this mem brane is pinned down to certain v alue by (loss de- p enden t) springs whose constan t is proportional to 1 /σ 2 – the inv erse of the noise on the gradien ts during train- ing. The mem brane then in terp olates and extrap olate b et w een these pinning p oin ts in a wa y whic h, on av er- age, minimizes its elastic energy . This elastic energy dif- fers considerably from that of ph ysical mem brane and in particular has a non-lo cal dep endence on the shap e of the membrane. Different DNNs corresp ond to different elastic energies. Finite netw orks entail non-linear correc- tions to the elastic energy which may b e b eneficial for learning in the case of CNNs [13]. B. Predictions in the grand-canonical ensemble As mentioned, in order to calculate the learning curv e one needs to calculate quantities like h g ∗ i D N and 6 h g ∗ 2 i D N . These av erages in volv e multidimensional in- tegrations ov er all p ossible datasets. T o facilitate their computation w e adopt the approach of [28] and instead consider a related quantit y given by the P oisson av erag- ing of the former h ... i η = e − η ∞ X n =0 η n n ! h ... i D n (13) where ... can b e any quan tit y , in particular g ∗ and g ∗ 2 . This av erage can b e thought of as a grand-canonical ensem ble, though a non-standard one since w e a v erage the observ ables and not the partition function. T aking η = N means we are essen tially av eraging ov er v alues of N in an √ N vicinity of N . This means that as far as the leading asymptotic b ehavior is concerned, one can safely exchange N and η as the differences w ould b e sub- leading. W e therefore focus on calculating the grand- canonical D AEE, hk g ∗ − g k 2 i η . In App. A we compare learning curves as a function of N and η and show that they match v ery w ell. By using the grand canonical ensemble, av eraging ov er dra ws from the dataset can b e carried out as follows. First, using the replica trick: h g ∗ ( x ∗ ) i η = lim M → 0 1 M δ h Z M i η δ α ( x ∗ ) α =0 (14) where for integer M and assuming that the loss function acts point-wise on the training set L [ f ] = P n i =1 L f ( x i ), we ha ve h Z M i η = e − η Z M Y m =1 D f m (15) e − P M m =1 ( 1 2 k f m k 2 K − R dxαf m ) + η R dµ x e − P M m =1 L f m ( x ) 2 σ 2 As sho wn in App. G 2, a T aylor expansion in η of the ab o v e r.h.s. yields the h ... i η a veraging app earing on the l.h.s. Second, w e notice that the main b enefit of Eq. (14) and Eq. (15) ov er Eq. (2) is that it allows for a con- trolled expansion in 1 /η . At large η (or similarly large N ) we exp ect the fluctuations in f m ( x ) to b e small and cen tered around g ( x ). Indeed, such a b ehavior is encour- aged by the term multiplied by η in the exp onen t. W e can therefore systematically T aylor expand the inner ex- p onen t e − P M m =1 L f m ( x ) 2 σ 2 = 1 − P M m =1 L f m ( x ) 2 σ 2 (16) + 1 2 " P M m =1 L f m ( x ) 2 σ 2 # 2 + ... and eac h term will yield a higher order of h g ∗ ( x ∗ ) i η in 1 /η . C. EK as a free theory Notably , so far the choice of a loss function was largely arbitrary . The adv antage of choosing MSE loss, L f ( x ) = ( f ( x ) − g ( x )) 2 , is that P [ f ] also b ecomes a GP , or equiv- alen tly has a quadratic action. F rom no w on we shall fo cus on MSE loss. Aiming for standard pertubative calculations, we wish to p erform diagrammatic calculations w.r.t a free quadratic theory . Expanding Eq. (16) to first order and substituting in Eq. (15) we obtain h Z M i η = Z M E K + O 1 /η 2 (17) Z E K [ α ] = Z D f e − S E K [ f ]+ R dxα ( x ) f ( x ) where S E K [ f ] = 1 2 k f k 2 K + η 2 σ 2 R dµ x ( f ( x ) − g ( x )) 2 , whic h is quadratic in f and therefore induces a Gaussian field. Substituting Eq. (17) in Eq. (14) we get h g ∗ ( x ∗ ) i η = δ log ( Z E K ) δ α ( x ∗ ) α =0 + O 1 /η 2 (18) = arg min [ S E K [ f ]] + O 1 /η 2 = g ∗ E K,η ( x ∗ ) + O 1 /η 2 where the second equality is due to the fact that for Gaus- sian distributions the exp ectation v alue coincides with the most probable v alue, and the third equality is due to [12], with the subtle change that N is b eing replaced by η . Let us denote by h . . . i 0 the free-theory a verage, that is an av erage w.r.t Z E K . W e therefore get h f i 0 = g ∗ E K,η 6 = 0, meaning that our free theory , though Gaussian, is not cen tered. The correlations of the free theory are Co v 0 [ f ( x ) , f ( y )] = X i 1 λ i + η σ 2 − 1 φ i ( x ) φ i ( y ) (19) where again, λ i and φ i are the eigen v alues and eigen- functions of the kernel. D. Next order corrections W e now wish to perform p ertubative calculations w.r.t to the free (Gaussian) EK theory , and obtain a sub- leading (SL) correction for the EK result in the inv erse dataset size: h g ∗ ( x ∗ ) i η = g ∗ E K,η ( x ∗ ) + g ∗ S L,η ( x ∗ ) + O (1 /η 3 ) (20) Expanding Eq. (16) to second order, substituting in Eq. (15) and k eeping only O 1 /η 2 terms, the calcula- tion can b e carried using F eynman diagrams w.r.t to the 7 free EK Gaussian theory . Leaving the details to appendix I, the sub-leading correction is g ∗ S L,η ( x ∗ ) = η σ 4 Z dµ x g ∗ E K,η ( x ) − g ( x ) (21) Co v 0 [ f ( x ) , f ( x )] Co v 0 [ f ( x ) , f ( x ∗ )] or explicitly g ∗ S L,η ( x ∗ ) = (22) − η σ 4 X i,j,k Λ i,j,k g i φ j ( x ∗ ) Z dµ x φ i ( x ) φ j ( x ) φ 2 k ( x ) Λ i,j,k = σ 2 η λ i + σ 2 η 1 λ j + η σ 2 − 1 1 λ k + η σ 2 − 1 As sho wn App. G 2, similar expressions for h g ∗ 2 i η are obtained using tw o replica indices. Interestingly we find that h g ∗ 2 i η = h g ∗ i 2 η + O (1 /η 3 ). Hence, up to O (1 /η 3 ) cor- rections, the av eraged MSE error is ( h g ∗ ( x ∗ ) i η − g ( x ∗ )) 2 in tegrated ov er x ∗ . Since the v ariance of g ∗ came out to b e O (1 /η 3 ) one finds that g ∗ − g , which is O (1 /η ), is asymptotically muc h larger than its standard deviation. This implies self av eraging at large η , or equiv alently that our dataset-av eraged results capture the b ehavior of a single fixed dataset. Equations (20), (22) and their application to the cal- culation of the grand-canonical D AEE are one of our k ey results. They provide us with closed expressions for the DAEE as a function of η , namely the fixed-teacher learning curve. They hold without an y limitations on the dataset or the k ernel and yield a v ariant of the EK result along with its sub-leading correction. F rom an analytic p erspective, once λ i and φ i ( x ) are known, the ab o v e expressions pro vide clear insights to ho w well the GP learns each feature and what cross-talk is generated b et w een features due to the second sub-leading term. Notably for the renormalized NTK introduced b elow, the num b er of non-zero λ i ’s is finite, and so the ab ov e infinite summations reduce to finite ones. This mak es these expressions computationally sup erior to directly p erforming the matrix-in v ersion in Eq. (2) along with an N − dimensional integral inv olv ed in dataset-av eraging. In addition, ha ving the sub-leading correction allows us to estimate the range of v alidity of our appro ximation by comparing the sub-leading and leading contributions, as w e shall do for the uniform case b elo w. V. UNIF ORM DA T ASETS T o make Eq. (22) interpretable, φ i ( x ) and λ i are re- quired. This can b e done most readily for the case of datasets normalized to the hypersphere ( k x n k = 1) with a uniform probabilit y measure and rotation-symmetric k ernel functions. By the latter we mean K x,x 0 = K Ox,O x 0 for any orthogonal matrix O with the same dimension as the inputs. Although b ey ond the scope of the current w ork, ob vious extensions to consider are datasets whic h are uniform only in a sub-space of x and/or small p er- turbations to uniformit y . Imp ortan tly , b oth NNGP and NTK associated with an y DNN with a fully connected first la yer and w eights initialized from a normal distribution, has the abov e sym- metry under rotations (see App. E). It follo ws that such a kernel can b e expanded as K x,x 0 = P n b n ( x · x 0 ) n . An additional corollary [34] is that its features are hyper- spherical harmonics ( Y lm ( x )) as these are the features of all dot pro duct kernels. Hyperspherical harmonics are a complete and orthonormal basis w.r.t a uniform probabil- it y measure on the hypersphere. Note that this implies a non-standard normalization for the Y lm s in this context, as they are usually normalized w.r.t Lebesgue measure. F or each l these can b e written as a sum of p olynomials in the input co ordinates of degree l . The extra index m en umerates an orthogonal set of suc h polynomials (of size deg( l )). F or a k ernel of the ab o ve form the eigenv alues are indep endent of m and given b y [34] λ l = Γ d 2 √ π · 2 l ∞ X s =0 b 2 s + l (2 s + l )! (2 s )! Γ s + 1 2 Γ s + l + d 2 (23) F or ReLU and erf activ ations, the b n ’s, can b e obtained analytically up to any desirable order [44]. Thus one can semi-analytically obtain the eigen v alues up to any de- sired accuracy . F or the particular case of depth 2 ReLU net works with no biases, w e report in App. J closed ex- pression where the ab ov e summation can be carried out analytically for the NNGP and NTK kernels. How ev er, as we shall argue so on, it is in fact desirable to trim the NTK in the sense of cutting-off its T aylor expansion at some order m , resulting in what we call the renormal- ized NTK. F or suc h kernels, which would b e our main fo cus next, Eq. (23) can b e seen as a closed analytical expression for the eigenv alues. In terestingly , for any dot-pro duct kernel and uniform data of dimension d on the hypersphere, there is a uni- v ersal bound giv en b y λ l ≤ K x,x / deg ( l ) ≈ O ( d − l ), where K x,x is a constant in x . Indeed, K x,x = P lm λ l = P l deg( l ) λ l . The degeneracy (deg ( l )) is fixed from prop- erties of hyper spherical harmonics, and equals deg ( l ) = 2 l + d − 2 l + d − 2 l + d − 2 l [45] whic h goes as O ( d l ) for l d . This com bined with the positivity of the λ l ’s implies the abov e b ound. Expressing our target in this feature basis g ( x ) = P l,m g lm Y lm ( x ), Eq. (22) simplifies to g ∗ S L,η ( x ∗ ) = − X l,m η − 1 λ l C K,σ 2 /η ( λ l + σ 2 /η ) 2 g lm Y lm ( x ∗ ) (24) where C K,σ 2 /η = P l deg( l )( λ − 1 l + η /σ 2 ) − 1 and no- tably cross-talk b etw een features has b een eliminated at this order since P m Y 2 lm ( x ) = deg( l ) is indep en- den t of x , yielding P ˜ m R dµ x Y lm ( x ) Y l 0 m 0 ( x ) Y 2 ˜ l ˜ m ( x ) = deg( ˜ l ) δ ll 0 δ mm 0 . 8 By splitting the sum in C K,σ 2 /η , to cases in which λ l < σ 2 /η and their complemen t, one has the bound C K,σ 2 /η < # F σ 2 /η + P lm | λ l <σ 2 /η λ l , where # F is the n umber of eigen v alues suc h that λ l > σ 2 /η . Thus for k er- nels with a finite num b er of non-zero λ i ’s (as the renor- malized NTK in tro duced b elow), and for large enough η , # F b ecomes the num b er of non-zero eigen v alues and C K,σ 2 /η = # F σ 2 /η has a η − 1 asymptotic. This illus- trates the fact that the ab ov e terms are arranged b y their orders in η . W e can use Eq. (24) to understand the v alidity of the EK result. W e therefore lo ok for sufficient conditions for g ∗ E K,η g ∗ S L,η to hold. By a term-wise comparison, for some l we obtain C K,σ 2 /η η ( λ l + σ 2 /η ) whic h holds for C K,σ 2 /η σ 2 . F or trimmed kernels, this yield # F η . Notably it means that the original non-trimmed NTK cannot b e analyzed p erturbativ ely , since with σ 2 = 0, # F b ecomes infinite. In the next section we tackle this issue. VI. GENERALIZA TION IN THE NOISELESS CASE AND THE RENORMALIZED NTK The correspondence b etw een DNNs trained in the NTK regime and GPR using NTK implies noiseless GPR ( σ 2 = 0) for which the p erturbativ e analysis carried in previous sections fails. Here we show that the fluc- tuations of f asso ciated with small λ l s can b e traded for noise on the fluctuations of f asso ciated with large λ l s, thereb y making our p erturbative analysis applicable. As shown in the previous section, for uniform datasets, the smaller λ l s corresp ond to higher spherical harmon- ics (higher l ) and hence hav e higher oscillatory comp o- nen ts. W e argue that these higher oscillatory mo des can b e marginalized ov er in a controlled manner to gener- ate both noise and corrections to the large λ l s. This is very muc h in spirit of the renormalization group tec h- nique, wherein high oscillatory mo des are in tegrated o v er to generate changes (renormalization) of some parame- ters in the probability distribution of the low oscillatory mo des. W e b egin by defining a set of renormalized NTKs. As argued, an NTK of any fully-connected DNN can b e ex- panded as K x,x 0 = P ∞ q =0 b q ( x · x 0 ) q . The renormalized NTK at scale r is then simply K ( r ) x,x 0 = P r q =0 b q ( x · x 0 ) q . Harmoniously with this notation w e denote the pre- diction of GPR with the original kernel as g ∗ ∞ . Our claim is that GPR with K and a noise of σ 2 can b e well approximated by GPR with K ( r ) and noise σ 2 + σ 2 r (where σ 2 r = P ∞ q = r +1 b q ), for sufficiently large r . Specifically , our claim is that the discrepancy b e- t ween the original vs. truncated GPR predictions scales as O ( √ N d − ( r +1) / 2 /K x,x ), where d is the effective data- input dimension. Imp ortan tly , as can be inferred from Eq. (23), the renormalized NTK at scale r has zero eigen- v alues for all spherical Harmonics with l > r , as w ell as mo dified eigen v alues for spherical harmonics with l ≤ r (compared to the non-truncated NTK). Th us, as adv er- tised, these high F ourier mo des ha ve b een remov ed from the problem in exchange for a renormalized theory with a mo dified low energy sp ectrum, and augmented noise. In a related manner, trimming the T a ylor expansion af- ter ( x · x 0 ) r effectiv ely reduces our angular resolution and coarse grains the fine angular features captured by these spherical Harmonics with l > r . T o justify this approximation we consider the differ- ence matrix A nm = K x n ,x m − K ( r ) x n ,x m , giv en a dataset { x n } N n =1 dra wn from a uniform distribution on a hyper- sphere of dimension d . The terms b q ( x n · x m ) q scale roughly as d − q / 2 (see App. K for a more accurate ex- pression) due to the tendency of random vectors in high dimensions to be orthogonal. Consequently the ab ov e difference diminishes very quickly with r . Notably this also applies for the entries of K x ∗ ,x n − K ( r ) x ∗ ,x m , provided x ∗ is a test p oin t and not a train p oin t. In contrast, the diagonal part of A is A nn = σ 2 r and may diminish more slo wly dep ending on the coefficients b q >r . Up on neglect- ing K x ∗ ,x n − K ( r ) x ∗ ,x m and the off-diagonal elements of A , one finds that Eq. (2) with these tw o GPRs yields iden- tical predictions. As shown in App. K, these neglected off-diagonal elemen ts yield a discrepancy whic h scales as √ N d − ( r +1) / 2 . Consequently , the MSE error b et ween the t wo GPRs should scale as N times an exponentially small factor ( d − r − 1 ). This scaling with N should saturate when the accuracy is nearly p erfect since then the predictions remain largely constan t as N is increased. F o cusing back on the question of ho w to tackle noise- less GPR, w e thus find that as long as the b q ’s decays slo wly enough with q , then at an y finite N we can choose a large enough r suc h that tw o desirable prop erties are main tained: A. The discrepancy betw een the GPRs is small and B. σ 2 r is large enough to ensure conv ergence to our p erturbativ e analysis. The required slow deca y of b q is harmonious with the in tuition that DNNs should b e initialized at the edge of chaos [46] where the output of the netw ork has a fine and m ulti-scale sensitivity to small changes in the input. As K x,x 0 is the correlation of t wo outputs with inputs x and x 0 , ha ving a p o w er law deca ying b q implies such fine and multi-scale sensitivit y . Establishing relations b et ween goo d initialization and ef- fectiv eness of our renormalized NTK is left for future w ork. W e hav e tested the accuracy of appro ximating noise- less NTK GPR with renormalized NTK GPR with the appropriate σ 2 r , b oth on artificial datasets (see next sec- tion) and on real world dataset such as CIF AR10 (see app. B). In b oth cases we found an excellent agreement b et w een the tw o GPRs for r ’s as small as 3 and 4. 9 FIG. 2. The exp erimen tal learning curves (solid lines) for a depth 4 ReLU netw orks trained in the NTK regime on different target functions on a d = 50 hypersphere are sho wn along with our analytical predictions for the leading (dotted line) and leading plus sub-leading b eha vior (dashed line). Left panel shows the results for a second order p olynomial in the input, and the righ t panel sho w results for the function | w · x | (where w is a random v ector of norm √ d ) whic h cannot b e expressed as a finite linear combinations of eigenfunctions. The learning curv es of ordinary least squares (OLS) on the same regression tasks are provided to help compare the p erformance of GPs with simpler regression metho ds. VI I. GENERALIZA TION IN THE NTK REGIME Collecting the results of all the preceding sections, w e can obtain a detailed and clear picture of generalization in fully connected DNNs trained in the NTK-regime on datasets with a uniform distribution normalized to some h yp ersphere in input space. W e b egin with a qualitative discussion and consider some renormalized NTK at scale r . F rom Sec. V, we ha ve that the features of this kernel are h yp erspherical harmonics and that λ l scales as d − l . W e also recall that Y lm is a p olynomial of degree l and that all the h yp erspherical harmonics up to degree l span all p olynomials on the h yp ersphere with degree up to l . Examining Eq. (24) w e find that features with λ l σ 2 /η are learnable and via the ab o v e scaling w e find that we learn p olynomials of degree O (log( η /σ 2 ) / log ( d )) or less. In particular, a function like parity , whic h is a p olynomial of degree d is v ery hard to learn whereas a linear function is the easiest to learn. Thus, despite ha ving infinitely more parameters than data-p oints (due to infinite width) and despite b eing able to span almost an y function (due to the richness of the kernel’s features), the DNN here a voids ov erfitting by ha ving a strong bias to wards lo w degree p olynomials. T o mak e more quantitativ e statements we now fo- cus on a sp ecific setting. W e consider input data in dimension d = 50 and a scalar target func- tion g ( x ) = P l =1 , 2; m g lm Y lm ( x ) suc h that the v ectors ( g l, 1 , g l, 2 , . . . , g l, deg( l ) ) T for l = 1 , 2 are drawn from a uniform measure on the deg ( l )-sphere of radius 1 / √ 2. W e generate several toy datasets D N consisting of N data p oints ( x n ) uniformly distributed on the hyper- sphere S d − 1 and their corresponding targets ( g ( x n )). W e consider the GP equiv alent to training a fully-connected DNN consisting of 4 la yer with ReLU activ ations and width W which w e initialize with v ariance ( σ 2 w = σ 2 b = 1 /d ) for the input lay er and ( σ 2 w = σ 2 b = 1 /W ) for the hidden lay ers (see for instance [38] App. C and App. E for ho w to compute the k ernel. Notice there is a factor of 1 /W b et w een our conv en tion for σ 2 w and [38]). T o b e in the NTK corresp ondence regime w e consider training suc h a netw ork at v anishing learning-rate, MSE loss, and with W N . One then has that the predictions of the DNN are given by GPR with σ 2 = 0 and the K giv en b y the NTK kernel [8] (T o b e more precise, [8] predict corresp ondence with GPR up to a random initialization factor, so to get exact match with GPR one would also need to av erage ov er initialization seeds. Recent researc h [38] suggests this ca veat can b e av oided under some con- ditions). F or each such DNN we obtained the expected MSE loss k g ∗ ∞ − g k 2 of GPR with the NTK kernel by n umerical in- tegration ov er x ∗ . Repeating this pro cess multiple times w e obtained the DAEE for N = 1 , 2 , . . . , N max with a relativ e standard error of less then 5% (this typically re- quired a veraging ov er 10 datasets). F or direct comparison with our prediction of the learning curv e, we computed the P oisson av eraged learning curve hk g ∗ ∞ − g k 2 i η in ac - cordance with Eq. (13), neglecting the terms n > N max . W e restricted ourselves to η max ≤ N max − 5 √ N max to mak e tail effects negligible. Notably the P oisson av er- aging mak es the final statistical error negligible relative to the discrepancies coming from our large η approxima- tions (see A). T o make it easier to appreciate the p ow er of GPs o ver simpler regression mo dels we also provide the P oisson av eraged DAEE for ordinary least square method (OLS) as a yardstic k. 10 T o pick the renormalization scale r we must consider t wo factors, on the one hand we wan t the discrepancy b et w een the renormalized and regular NTK to b e small, this scales as O ( √ N d − ( r +1) / 2 /K x,x ). On the other hand w e wan t the effectiv e noise σ 2 r to b e as large as p ossible to assure the accuracy of the prediction. W e found that r = 3 strikes a go o d balance for the range of N v alues used in the experiment, but r = 4 , 5 , 6 also produced adequate predictions since σ 2 r shrinks slowly with r for the architecture used. Our analytical expressions following Eq. (23) com- bined with kno wn results [8, 44] ab out the T aylor co- efficien ts ( b n ) yield λ 0 , ..., λ 3 = { 3 . 19 , 7 . 27 · 10 − 3 , 5 . 98 · 10 − 6 , 1 . 62 · 10 − 7 } and σ 2 r = 0 . 018. Since λ 0 , λ 1 σ 2 /η λ 2 , λ 3 for 50 < η < 3500, C K r ,σ 2 /η σ − 2 < [deg(0) + deg(1)] σ 2 /η + O (deg(2)10 − 6 ), th us C K r ,σ 2 /η σ − 2 ≈ 51 /η . Th us w e expect p erturbation theory to be v alid for η 50. A t η = 1000 the l = 1 features are learned w ell since σ 2 /η = 1 . 8 · 10 − 4 λ 1 and the l = 2 fea- tures neglected, at η = 1000 they are learned but sup- pressed by a factor of ab out 3. Had the target contained l = 3 features, they would hav e b een en tirely neglected at these η scale. Experimental learning curv es along with our leading and sub-leading estimates are sho wn in Fig. 2 left panel sho wing an excellent agreemen t b etw een the- ory and exp erimen t. While no actual DNNs w ere trained in the ab ov e exper- imen ts, the NTK corresp ondence means that this would b e the exact behavior of a DNN trained in the NTK regime [8, 22, 38]. F urthermore, since our aim was to estimate what the DNNs would predict rather than reac h SOT A predictions, w e fo cus on reasonable h yp er- parameters but did not p erform any hyper-parameter optimization. The complemen tary case of noisy GPR, whic h one encounters in the NNSP correspondence, is studied in App. C. T o demonstrate that our results work with more com- plex functions we rep eated the exp eriment with a differ- en t target function which cannot b e expressed as a finite order p olynomial. W e drew a uniformly distributed vec- tor w on the ( d − 1)-sphere of radius √ d and set the target as g ( x ) = | w · x | . Fig. 2 (right) sho ws go od agreemen t b et w een theory and exp erimen t here as well. Lastly w e argue that the asymptotic b ehavior of learning-curv e we predict is more accurate than the re- cen t P AC based bounds [9–11]. In App. D we show a log-log plot of the learning-curv es con trasted with a 1 / √ η whic h is the most rapidly decaying bound app earing in those works. It can b e seen that such an asymptotic can- not b e made to fit the experimental learning-curve with an y precision close to ours. VI II. APPLICA TION OF RESUL TS TO HYPER-P ARAMETER OPTIMIZA TION As with most machine learning algorithms, when train- ing a neural netw ork for a particular task one needs to c ho ose a n um b er of h yp er-parameters such as the net- w ork’s w idth at each level W l , depth L , v ariance of w eights at initialization σ 2 b , σ 2 w , activ ation function, and optimizer related parameters such as batc h size, learn- ing rate etc. There are many considerations for hyper- parameter selection such as training time, memory fo ot- prin t and optimizer conv ergence, but here w e will fo cus on the exp ected loss of the net work. While there are some accepted heuristics, there is no a priori wa y to predict the b est preforming arc hitecture other than an exp ensive pro cess of trial and error. In this section we introduce a sc heme for picking theoretically adv an tageous param- eters, given minimal information on the target function and dataset distribution. As recen t researc h suggests [47] W should b e increased as muc h as p ossible to put the net work in the interpolation regime, we will assume that c hoice was made. W e also note that σ 2 b , σ 2 w are t ypi- cally thought to b e related more to conv ergence issues, for example via the explo ding/v anishing gradient prob- lem, than to the p erformance of the netw ork. How ever as this work as well as [48] suggest, these parameters ha ve an imp ortan t effect on the netw ork p erformance by c hanging the NTK sp ectrum. W e suggest the following scenario: w e hav e N = 1000 data p oints uniformly distributed on S 9 . W e are also giv en the sp ectral w eight of the target in each eigenspace, that is w 2 ` = k Π ` ( g ) k 2 where Π ` is the pro jection op era- tor on the ` subspace. F or the case of uniform measure on the hyper-sphere the pro jection op erator is simply Π ` = P ` ( h x · y i ) deg( ` ) where P ` is the Legendre p olynomial of degree ` and deg( ` ) is the dimension of the eigenspace, so finding w 2 ` is a muc h simpler task then finding the deg( ` ) co efficien ts of the target (whic h scale as d ` ) and can b e accomplished with a few numeric integrals. In this case w e focus on a target with w ` 2 = 1 3 ( δ 1 ,` + δ 2 ,` + δ 3 ,` ). Giv en this setting, we would lik e to find a net work arc hi- tecture with minimal exp ected error. F or computational efficiency reasons we decide to focus on ReLU netw orks with one hidden lay er, so we need to choose four hyper- parameters σ = ( σ w 1 , σ w 2 , σ b 1 , σ b 2 ). W e present tw o typical wa ys used to choose σ , then prop ose a better wa y to do so based our theory . The naiv e and most prev alent w ay to c ho ose h yp er-parameters is to simply tak e σ Typical = ( √ 2 , √ 2 , 0 . 05 , 0 . 05) whic h roughly corresp ond to He initialization [49], a common heuristic for av oiding gradien t propagation issues. A more dili- gen t approach would b e to draw some random v alues in the vicinity of σ Typical , train the net work, ev aluate the test loss and pic k the b est preforming h yp er-parameters σ Best . Next we suggest a differen t approach whic h utilizes our analytical results. W e construct a sym b olic expres- sion for the exp ected loss using the formalism outlined in the paper. By taking η = N and applying the renor- malization sc heme with appropriate r w e get an estima- tor for the exp ected loss ˆ L ( σ ) = R dx D ( f ( x ) − g ( x )) 2 E whic h we can use to predict the p erformance of dif- feren t hyper-parameters without training the net w ork. 11 T est Prediction GPR W orst 0.413 0.406 0.382 Median 0.313 0.316 0.319 Best 0.175 0.198 0.214 T ypical 0.307 0.307 0.317 Optimized 0.078 0.110 0.141 T ABLE I. Comparison of the p erformance of net w orks trained in the NTK regime using different hyper-parameters ( σ ). The T est column shows an estimate of the DNN test loss, the Prediction column the loss as predicted by our learning- curv e, and the GPR column an estimate of the dataset av er- aged exp ected loss of the corresp onding GP . W orst, Median and Best refer to one of 21 netw orks with random hyper- parameters rank ed by test loss. T ypical and Optimized refer to netw orks with σ Typical (defined in the text) and the opti- mal hyper-parameters follo wing our optimization scheme. F or more exp eriment results see App. L Moreo ver, w e can use standard numerical optimization algorithms to minimize the predicted loss and obtain σ Optimized = argmin σ ˆ L ( σ ). T o test the scheme experimentally , we drew 21 random h yp er-parameter prop osals { σ i } uniformly distributed in the hyper-rectangle defined by 1 2 σ Typical , 3 2 σ Typical . W e constrained the optimization algorithm to this hyper- rectangle as well to a v oid conv ergence issues in the train- ing pro cedure, as unconstrained optimization leads to v ery small v alues of σ w ( √ 2) which in turn lead to v anishing gradients and long training times. W e defined net works corresp onding to σ Optimized , σ Typical , { σ i } and trained eac h net work on the same dataset with full-batc h gradien t descent and learning rate 1 . 0 un til the train loss w as smaller then 0 . 1 · σ 2 r . A summary of the exp eriment is outlined in T able I. The results clearly demonstrate the effectiveness of our sc heme which reduces the test loss by a factor of 4 rel- ativ e to the typical hyper-parameter choice and a factor of 2 o ver the b est p erforming random h yp er-parameters. In terms of computational complexit y , it to ok approxi- mately 2.5 hours to train each netw ork using Google’s neural tangent pack age [50] on a 20 core CPU [51] with W = 2 14 . In comparison, the time it takes to build and optimize ˆ L is completely negligible at ab out 30 seconds. The b est random hyper-parameters w ere found on the fif- teen th attempt, so had we stopp ed then we would hav e w asted 35 computer hours relativ e to our sc heme and got- ten inferior test loss. Note also that w e fo cused on L = 2 in order to sp eed up training, whic h scales exp onen tial with depth, but the optimization pro cedure is not nearly as sensitiv e to depth and could hav e b een done for any reasonable L . Moreov er, increasing the depth w ould ha ve also enlarged the h yp er-parameter space, making random searc h even less effective. F or each netw ork we also ex- p erimen tally obtained the dataset a v eraged expected loss using GPR with the associated NTK. The fair agreemen t b et w een the test loss and dataset av eraged exp ected loss (GPR in T able I) further solidifies previous results and demonstrates our claim of self-av eraging. As exp ected, the abov e results required some knowl- edge of the target function, in particular its sp ectral w eight within each angular momentum space. Alter- nativ ely one can capitalize on the fact that our learn- ing curves predictions are quadratic in the target, av- erage them ov er a target function ensemble, and opti- mize with resp ect to this a verage case. Another option is to consider a min-max optimization sc heme in whic h h yp er-parameters are optimized for the w orse case target within some domain. The scheme can also be extended to non-uniform datasets and different activ ation functions as long as some wa y of computing the eigenv alues is pro- vided. IX. DISCUSSION AND OUTLOOK In this work w e laid out a formalism based on field the- ory to ols for predicting learning-curv es in the NTK and NNSP correspondence regimes. Despite DNNs’ black- b o x reputation, well within the v alidly range of our p er- turbativ e analysis, we obtained very lo w relativ e mis- matc h b etw een our b est estimate and the exp erimental curv es, with go o d agreement extending w ell in to regions with low amounts of data compared to that needed to learn the target. A p oten tial use of such learning curves in hyper-parameter optimization was also demonstrated. Cen tral to our analysis w as a renormalization-group transformation leading to effective observ ation noise on the target and to a simpler renormalized quadratic- action/k ernel. Notably this RG transformation implied that wide F ully-Connected netw orks, even ones w orking on real-world datasets such as CIF AR10, could b e effec- tiv ely described b y v ery few parameters b eing the noise lev el and the O (1)-first T aylor expansion parameters of the kernel. Our analysis pro vides a lab setting in whic h deep learn- ing can b e understo od. In its training phase, DNNs a void lo cal-minima issues and glassy b ehavior due to their high o ver parameterization which mak es the op- timization problem highly under-constrain t [13, 52, 53]. As a result, many different solutions or w eights which fit p erfectly the training data are p ossible. While each such solution will b eha ve differently on a test p oint, this arbi- trariness does not entail an erratic b ehavior. The reason is the implicit bias DNNs hav e tow ards simple functions. In the case of the NNSP correspondence, a simple func- tion is, by definition, a function that can b e generated, up to some small noise, by a large phase-space of w eights. Simplicit y is therefore strongly arc hitecture and dataset dep enden t. F or fully connected DNNs trained in the regime of the NTK or the NNSP corresp ondences, as well as data uniformly sampled from the h yp ersphere, simplicit y amounts to low order polynomials ov er that h yp ersphere. These are the h yp er-spherical Harmonics with low l , whic h are the leading eigenfunctions w.r.t. suc h a uniform measure of a generic k ernel asso ciated 12 with a fully connected DNN. As long as the DNN has at least one non-linear la y er and biases, depth has only a quantitativ e effect as it mo difies the eigenv alues ( λ l ) but do es not change their scale. Generally , the eigenv al- ues and eigenfunctions v ary with architecture and data distribution. Con volutional neural net works (CNNs) re- quire further study , ho wev er one can argue on a quali- tativ e level that simple functions w ould b e p olynomials with certain spatial hierarc hy . Moreov er, one exp ects that qualitativ e details of this hierarch y w ould depend on depth as it con trols the input-fan-in of the hidden activ ation in the last CNN la yer. It seems unrealistic that a purely analytical approach suc h as ours would describ e well the predictions of state- of-the-art DNNs such as VGG-19 trained on a real-w orld datasets such as ImageNet. Similarly unrealistic is to ex- p ect an analytical computation based on thermo dynam- ics to capture the efficiency of a modern car engine or one based on Naiv er-Stoke’s equations to output a better shap e of a wing. Still, scien tific experience shows that un- derstanding to y-mo dels, especially rich enough ones, has v alue. Indeed to y-mo dels pro vide an analytical lab where theories could b e refined or refuted, algorithms could b e b enc hmark ed and impro ved, and wider ranging conjec- tures and intuitions could b e formed. Such mo dels are useful whenever domain kno wledge p ossesses some degree of universalit y or indep endence from detail. In conv erse, when all details matter knowledge is nothing more than a log of all experiences. The fact that DNNs w ork well in v ariety of different architecture and data-set settings, suggests that some degree of universalit y w orth exploring is present. F urther research would th us tell if the to ols and metho dologies that ha ve enabled us to comprehend our physical w orld can help us comprehend the artificial w orld of deep learning. Man y extensions of the current w ork, aimed at ap- proac hing real-world settings, can b e considered. First and most, m uch of the recen t excitement ab out DNNs comes from either CNNs or Long Short T erm Memory net works (LSTMs). Considering CNNs, while m uc h of our formalism applies, the sp ectrum of CNN Kernels is more challenging to obtain as their Kernels are less sym- metric compared to F ully-Connected DNNs. F rom sim- ilar reasons the RG approac h presen ted here requires a more elaborate trimming of the CNN k ernel since the latter would not consist of only pow ers of dot-pro ducts. F urthermore, CNNs trained with SGD show rather large gaps in p erformance compared to their NNGP or NTK. The culprit here might very well b e the finite-width or finite-n umber-of-channels corrections to the NNGP or NTK priors. Leading finite-width corrections, consid- ered in Ref. [13], amount to adding quartic terms to P 0 [ f ]. Those could b e dealt with straightforw ardly us- ing our perturbation theory formalism. Interestingly , at least for CNNs without p o oling, these corrections in tro- duce a qualitativ e change to the prior, making it reflect the weigh t-sharing prop erty of CNNs which is lost at the lev el of the NNGP or NTK [13, 54]. Other viable direc- tions are handling richer datasets distributions, extend- ing EK results to the more common cross-entrop y loss, applying RG reasoning on finite-width DNNs, and us- ing the ab ov e insights for developing DNN-arc hitecture design principals. A cknow le dgements. Z.R and O.M ac knowledge sup- p ort from ISF grant 2250/19. Both O.M. and O.C. con- tributed equally to this work. [1] Qizhe Xie, Eduard H. Ho vy, Minh Thang Luong, and Quo c V. Le, Self-training with noisy student improv es im- agenet classification, arXiv e-prints (2019), 1911.04252. [2] George Saon, Gakuto Kurata, T om Sercu, Kartik Au- dhkhasi, Samuel Thomas, Dimitrios Dimitriadis, Xi- ao dong Cui, Bh uv ana Ramabhadran, Mic hael Pic heny, Lynn Li Lim, Bergul Roomi, and Phil Hall, English con- v ersational telephone sp eech recognition b y hu mans and mac hines, in INTERSPEECH (2017). [3] David Silv er, Thomas Hub ert, Julian Sc hrittwieser, Ioan- nis Antonoglou, Matthew Lai, Arthur Guez, Marc Lanc- tot, Laurent Sifre, Dharshan Kumaran, Thore Grae- p el, Timothy P . Lillicrap, Karen Simony an, and Demis Hassabis, Mastering chess and shogi by self-play with a general reinforcement learning algorithm, arXiv e-prin ts (2017), 1712.01815. [4] Nal Kalch brenner, Lasse Espeholt, Karen Simon yan, A¨ aron v an den Oord, Alex Gra ves, and Koray Ka vukcuoglu, Neural machine translation in linear time, arXiv e-prints (2016), 1610.10099. [5] Ravid Shw artz-Ziv and Naftali Tishb y, Op ening the blac k b o x of deep neural net works via information, arXiv e- prin ts (2017), 1703.00810. [6] Daniel Hexner, Andrea J. Liu, and Sidney R. Nagel, Pe- rio dic training of creeping solids, arXiv e-prints (2019), arXiv:1909.03528 [cond-mat.soft]. [7] Amit Daniely, Roy F rostig, and Y oram Singer, T ow ard Deep er Understanding of Neural Netw orks: The P ow er of Initialization and a Dual View on Expressivit y, arXiv e-prin ts (2016), arXiv:1602.05897 [cs.LG]. [8] Arthur Jacot, F ranck Gabriel, and Cl´ ement Hongler, Neural T angent Kernel: Conv ergence and General- ization in Neural Netw orks, arXiv e-prints (2018), [9] Zeyuan Allen-Zh u, Y uanzhi Li, and Yingyu Liang, Learn- ing and Generalization in Overparameterized Neural Net- w orks, Going Bey ond Tw o La yers, arXiv e-prin ts (2018), arXiv:1811.04918 [cs.LG]. [10] Y uan Cao and Quanquan Gu, Generalization Er- ror Bounds of Gradient Descen t for Learning Ov er- parameterized Deep ReLU Net works, arXiv e-prints (2019), arXiv:1902.01384 [cs.LG]. [11] Y uan Cao and Quanquan Gu, Generalization Bounds of Sto c hastic Gradient Descen t for Wide and Deep Neu- ral Netw orks, arXiv e-prin ts (2019), [cs.LG]. 13 [12] Carl Edward Rasm ussen and Christopher K. I. Williams, Gaussian Pr o cesses for Machine L e arning (A daptive Computation and Machine L e arning) (The MIT Press, 2005). [13] Gadi Nav eh, Oded Ben-David, Haim Somp olinsky , and Zohar Ringel, Predicting the outputs of finite netw orks trained with noisy gradien ts, arXiv e-prints (2020), [14] Behro oz Ghorbani, Song Mei, Theodor Misiakiewicz, and Andrea Montanari, When Do Neural Netw orks Outp er- form Kernel Methods?, arXiv e-prin ts , (2020), arXiv:2006.13409 [stat.ML]. [15] Sanjeev Arora, Simon S. Du, Zhiyuan Li, Ruslan Salakh utdinov, Ruosong W ang, and Dingli Y u, Harness- ing the p o w er of infinitely wide deep nets on small-data tasks, arXiv e-prints (2019), [16] Zhiyuan Li, W ang Ruosong, Dingli Y u, Simon Du, W ei Hu, Ruslan Salakhutdino v, and Sanjeev Arora, En- hanced con v olutional neural tangen t k ernels, arXiv a- prin ts (2019), 1911.00809. [17] Jaeho on Lee, Jasc ha Sohl-Dickstein, Jeffrey P ennington, Roman No v ak, Sam Schoenholz, and Y asaman Bahri, Deep neural netw orks as gaussian pro cesses, in Interna- tional Confer enc e on L e arning R epr esentations (2018). [18] Jaeho on Lee, Samuel S. Schoenholz, Jeffrey Pennington, Ben Adlam, Lechao Xiao, Roman Nov ak, and Jasc ha Sohl-Dic kstein, Finite versus infinite neural net works: an empirical study (2020), arXiv:2007.15801 [cs.LG]. [19] Liefeng Bo, Xiaofeng Ren, and Dieter F ox, A dvanc es in Neur al Information Pr o cessing Systems 23 , edited by J. D. Lafferty , C. K. I. Williams, J. Shaw e-T aylor, R. S. Zemel, and A. Culotta (Curran Asso ciates, Inc., 2010) pp. 244–252. [20] Aitor Lewko wycz, Y asaman Bahri, Ethan Dyer, Jascha Sohl-Dic kstein, and Guy Gur-Ari, The large learning rate phase of deep learning: the catapult mec hanism, arXiv e-prin ts (2020), arXiv:2003.02218 [stat.ML]. [21] Rob ert F. W arming and B.J Hyett, The mo dified equa- tion approach to the stability and accuracy analysis of finite-difference metho ds, Journal of Computational Ph ysics 14 , 159 (1974). [22] Sanjeev Arora, Simon S. Du, W ei Hu, Zhiyuan Li, Ruslan Salakh utdinov, and Ruosong W ang, On Exact Computa- tion with an Infinitely Wide Neural Net, arXiv e-prints (2019), arXiv:1904.11955 [cs.LG]. [23] Lenk a Zdeborov´ a, Understanding deep learning is also a job for physicists, Nature Ph ysics 16 , 602 (2020). [24] Y oav Levine, Or Sharir, Nadav Cohen, and Amnon Shash ua, Quan tum entanglemen t in deep learning archi- tectures, Phys. Rev. Lett. 122 , 065301 (2019). [25] Bo Li and David Saad, Exploring the function space of deep-learning machines, Ph ys. Rev. Lett. 120 , 248301 (2018). [26] Simon Beck er, Y ao Zhang, and Alpha A. Lee, Geome- try of energy landscap es and the optimizabilit y of deep neural netw orks, Ph ys. Rev. Lett. 124 , 108301 (2020). [27] Eric W. T ramel, Marylou Gabri´ e, Andre Manoel, F rancesco Caltagirone, and Florent Krzak ala, Determin- istic and generalized framew ork for unsup ervised learn- ing with restricted b oltzmann machines, Ph ys. Rev. X 8 , 041006 (2018). [28] D¨ orthe Malzahn and Manfred Opper, A v ariational ap- proac h to learning curves, in Pr o c e e dings of the 14th In- ternational Confer enc e on Neur al Information Pr o c essing Systems: Natural and Synthetic , NIPS’01 (MIT Press, Cam bridge, MA, USA, 2001) pp. 463–469. [29] Christopher K. I. Williams and F rancesco Viv arelli, Up- p er and lo wer b ounds on the learning curve for gaussian pro cesses, Mach. Learn. 40 , 77 (2000). [30] Klaus Ritter, Aver age-Case Analysis of Numeric al Pr ob- lems , Lecture Notes in Mathematics (Springer Berlin Heidelb erg, 2007). [31] Klaus Ritter, Asymptotic optimalit y of regular sequence designs, Ann. Statist. 24 , 2081 (1996). [32] Charles A. Micchelli and Grace W ahba, Design problems for optimal surface interpolation. (1979). [33] Peter Sollich, Gaussian Pro cess Regression with Mis- matc hed Mo dels, arXiv e-prints (2001), arXiv:cond- mat/0106475 [cond-mat.dis-nn]. [34] Douglas Azevedo and V aldir A. Menegatto, Eigenv alues of dot-pro duct kernels on the sphere, (2015). [35] Giancarlo F errari-T recate, Christopher K. I. Williams, and Manfred Opper, Finite-dimensional approximation of gaussian pro cesses, in NIPS (1998). [36] Michael A. Nielsen, Neur al Networks and De ep L earning (Determination Press, 2015). [37] Radford M. Neal, Bayesian le arning for neur al networks , V ol. 118 (Springer Science & Business Media, 2012). [38] Jaeho on Lee, Lechao Xiao, Samuel S. Schoenholz, Y asaman Bahri, Jasc ha Sohl-Dickstein, and Jeffrey Pen- nington, Wide Neural Netw orks of Any Depth Evolv e as Linear Mo dels Under Gradient Descent, arXiv e-prints (2019), arXiv:1902.06720 [stat.ML]. [39] Jonathan C. Mattingly , Andrew M. Stuart, and Desmond J. Higham, Ergo dicity for sdes and approximations: lo- cally lipsc hitz v ector fields and degenerate noise, Sto chas- tic Pro cesses and their Applications 101 , 185 (2002). [40] Hannes Risken and Till F rank, The F okker-Planck Equa- tion: Metho ds of Solution and Applic ations , Springer Se- ries in Synergetics (Springer Berlin Heidelb erg, 1996). [41] Stephan Mandt, Matthew D. Hoffman, and David M. Blei, Sto chastic Gradient Descent as Appro x- imate Bay esian Inference, arXiv e-prints (2017), arXiv:1704.04289 [stat.ML]. [42] Max W elling and Y ee Wh ye T eh, Bay esian learning via sto c hastic gradient langevin dynamics, in Pr oc e e dings of the 28th International Confer enc e on International Confer enc e on Machine L e arning , ICML’11 (Omnipress, USA, 2011) pp. 681–688. [43] T orsten A. Ensslin, Mona F rommert, and F rancisco S. Kitaura, Information field the ory for c osmolo gic al p er- turb ation r e cons truction and non-line ar signal analysis , T ech. Rep. arXiv:0806.3474 (2008). [44] Y oungmin Cho and Lawrence K. Saul, Kernel methods for deep learning, in Pr o c e e dings of the 22Nd Interna- tional Confer enc e on Neur al Information Pr o c essing Sys- tems , NIPS’09 (Curran Asso ciates Inc., USA, 2009) pp. 342–350. [45] Christopher F rye and Costas J. Efthimiou, Spherical Harmonics in p Dimensions, arXiv e-prin ts (2012), [46] Samuel S. Sc ho enholz, Justin Gilmer, Surya Ganguli, and Jasc ha Sohl-Dickstein, Deep Information Propaga- tion, arXiv e-prints (2016), arXiv:1611.01232 [stat.ML]. [47] Mikhail Belkin, Daniel Hsu, Siyuan Ma, and Soumik Mandal, Reconciling mo dern machine learning and the bias-v ariance trade-off, arXiv (2018), [48] Nasim Rahaman, Dev ansh Arpit, Aristide Baratin, F elix 14 Dr¨ axler, Min Lin, F red A. Hamprech t, Y osh ua Bengio, and Aaron C. Courville, On the sp ectral bias of deep neu- ral netw orks, arXiv e-prints (2018), [49] Kaiming He, Xiangyu Zhang, Shao qing Ren, and Jian Sun, Delving deep in to rectifiers: Surpassing h uman-level p erformance on imagenet classification, in 2015 IEEE International Confer ence on Computer Vision (ICCV) (2015) pp. 1026–1034. [50] Roman Nov ak, Lechao Xiao, Jiri Hron, Jaeho on Lee, Alexander A. Alemi, Jascha Sohl-Dickstein, and Samuel S. Schoenholz, Neural tangents: F ast and easy infinite neural net works in python, in International Confer enc e on L e arning R epresentations (2020). [51] While GPUs are generally faster, fully connected DNNs do not gain the full benefit of GPU parallelism and we exp ect the computation time would only improv e by a factor of O (1). [52] Y ann Dauphin, Razv an Pascan u, Caglar Gulcehre, Kyungh yun Cho, Surya Ganguli, and Y oshua Bengio, Iden tifying and attacking the saddle p oint problem in high-dimensional non-conv ex optimization, arXiv e- prin ts (2014), [53] F elix Draxler, Kam bis V eschgini, Manfred Salmhofer, and F red A. Hamprech t, Essentially No Barriers in Neu- ral Netw ork Energy Landscap e, arXiv e-prints (2018), arXiv:1803.00885 [stat.ML]. [54] Roman Nov ak, Lec hao Xiao, Jaeho on Lee, Y asaman Bahri, Greg Y ang, Daniel A. Abolafia, Jeffrey P enning- ton, and Jasc ha Sohl-Dic kstein, Bay esian Deep Con- v olutional Net works with Man y Channels are Gaus- sian Pro cesses, arXiv e-prints (2018), [stat.ML]. 15 App endix A: Poisson Averaging Demonstration Here we demonstrate that Poisson a veraging has no substantial effect on the learning curv e. T o this end the figure b elo w shows the exp erimental learning curve from the main text pre- and p ost-av eraging. It is evident that other than the unintended consequence of eliminating the experimental noise, the av eraged learning curve is equiv alent to the original for all practical inten ts. 16 App endix B: Comparison of NTK and Renormalized NTK Predictions on Synthetic and Real W orld Datasets In section VI I w e used the renormalized NTK as a pro xy for the regular NTK, the purpose of this section is to affirm the v alidity of this appro ximation. Moreo ver, while our lack of knowledge of the NTK eigen v alues and eigenfunctions with resp ect to a non-uniform measure preven ts us from predicting learning curves, we would lik e to show that the renormalized NTK is a v alid appro ximation in this setting as well. T o this end we used the following pro cedure. W e to ok the NTK kernel defined in the paper and its associated renormalized kernels at different scales and trained them ov er the s ame training set D N . In the figure b elow (top) the training set and target function were the ones defined in the main text. In the figure b elow (b ottom) D N consisted of uniform draws without replacements from the cifar-10 training set, standardized and normalized to unit vectors, and the target function was the one-hot enco ding of the lab els standardized to hav e zero mean and K x,x v ariance. F or each training set w e logged the a verage squared deviation of each renormalized k ernel estimation g ? r from the estimation of the non-renormalized kernel g ? ∞ . This is the quan tity k g ? r − g ? ∞ k 2 (where in the cifar-10 case k · k implies b oth the Euclidean norm in R 10 and integration ov er the input measure, which we appro ximated b y a veraging o ver the cifar-10 test set). W e av eraged this quan tity ov er differen t draws of training sets to obtain D k g ? r − g ? ∞ k 2 E D N . The results show go od agreement betw een g ? ∞ and g ? r as r is increased. 17 App endix C: Learning Curves in the NNSP Protocol W e rep ort here the results of a similar experiment to the one presented in the main text, but with the NTK k ernel replaced with the NNGP kernel as appropriate for the NNSP corresp ondence. In this case we used a k ernel simulating a net w ork with a single hidden la yer and σ 2 w = 1 /W, σ 2 b = 0, and a target function equiv alent to the one in the main text. In the NNSP protocol the renormalization group approach is not necessary to introduce noise to the observ ations, as it comes into pla y naturally via the temp erature dep endent fluctuations, so we can choose arbitrary σ 2 . Not withstanding, the renormalization group approach can aid in analyzing lo w temp erature b eha vior. Notice, in the figure b elow, that the sub-leading prediction significantly improv es up on the EK prediction. As the inset plot demonstrates, when the dataset size is small the exp ected error actually increases. Surprisingly , the sub-leading correction manages to capture this b eha viour even though the dataset size is small, demonstrating its sup eriorit y . 18 App endix D: Comparison with recen t bounds As mentioned in the main text, v arious recent b ounds, relev an t to the NTK regime, ha ve been deriv ed recently . Not withstanding imp ortance and rigor of these works, their bounds hav e at b est a 1 / √ N asymptotic scaling. The figure below sho ws that given a functional behavior of the experimental learning curv es such a b ound cannot b e nearly as tight as our predictions. 19 App endix E: NNGP and NTK are Rotationally Inv ariant Let us pro of that the NNGP and NTK k ernels associated with an y net work whose first lay er is fully-connected, are rotationally inv arian t. Indeed, let h w ( x ) b e the output vector of the first lay er [ h w ( x )] i = φ ( P j w ij x j + b ) where x j is the j ’th comp onent of the input v ector x . Let z w 0 ( h ) b e the output of the rest of the netw ork given h . The co v ariance function of NNGPs are defined by [44] K ( x, y ) = Z dw dw 0 P 0 ( w , w 0 ) z w 0 ( h w ( x )) z w 0 ( h w ( y )) (E1) where P 0 ( w , w 0 ) is a prior o ver the weigh ts, t ypically tak en to be i.i.d Gaussian for eac h lay er ( P 0 ( w , w 0 ) = P 0 ( w ) P 0 ( w 0 ) and P 0 ( w ) ∝ e − P ij w 2 ij / (2 σ 2 ) ). F ollo wing this one can show K ( O x, O y ) = Z dw dw 0 P 0 ( w , w 0 ) z w 0 ( h w ( O x )) z w 0 ( h w ( O y )) (E2) = Z dw dw 0 P 0 ( w , w 0 ) z w 0 ( h O T w ( x )) z w 0 ( h O T w ( y )) = Z dw dw 0 P 0 ( O w, w 0 ) z w 0 ( h w ( x )) z w 0 ( h w ( y ) = Z dw dw 0 P 0 ( w , w 0 ) z w 0 ( h w ( x )) z w 0 ( h w ( y ) = K ( x, y ) where the second equalit y uses the definition of h w ( x ), the third results from an orthogonal change of integration v ariable w → O T w , and the forth is a prop ert y of our prior ov er w . Since the NTK relates to the NNGP kernel in a recursiv e manner ([8]), it inherits that symmetry as well. 20 App endix F: Notations for the field theory deriv ation F or completeness, here w e re-state the notations used in the main-text. x, x 0 , x ∗ - Inputs. µ x - Measure on input space. K ( x, x 0 ) - Kernel function (co v ariance) of a Gaussian pro cess. Assumed to be symmetric and p ositive-semi-definite. φ i ( x ) - i ’th eigenfunction of K ( x, x 0 ). By the sp ectral theorem, the set { φ i } ∞ i =1 can b e assumed to b e orthonormal: Z dµ x φ i ( x ) φ j ( x ) = δ ij λ i - i ’th eigenv alue of K ( x, x 0 ): Z dµ x 0 K ( x, x 0 ) φ i ( x 0 ) = λ i φ i ( x ) k · k K - RKHS norm: k · k K = Z dµ x dµ x 0 f ( x ) K − 1 ( x, x 0 ) f ( x 0 ) If f ( x ) = P i f i φ i ( x ) then k f k K = P i f 2 i λ i (where φ i is an orthonormal set). Note that this norm is independent of µ x [12]. g ( x ) - The target function. σ 2 - Noise v ariance. N - Number of inputs in the data-set. D N - Data-set of size N , D N = { x 1 , ..., x N } . g ∗ - The prediction function. 21 App endix G: Phrasing the Problem as a Field Theory Problem 1. Without Data W e start by establishing the exact equiv alence b et ween a prior of a centered GP and the corresp onding partition function. F or a kernel function K , let us define the partition function Z [ α ] = Z D f exp − 1 2 k f k 2 K + Z dxα ( x ) f ( x ) (G1) Since the RKHS norm is quadratic in f , the distribution ov er the space of functions induced by Z is Gaussian (a GP). Since a GP is determined by is mean and kernel, it is sufficient to show those equalities. F or the mean w e get h f ( x ∗ ) i = δ log ( Z [ α ]) δ α ( x ∗ ) α =0 = (G2) R D f · f ( x ∗ ) exp − 1 2 k f k 2 K R D f exp − 1 2 k f k 2 K = arg min 1 2 k f k 2 K x ∗ = 0 since for Gaussian distributions it holds that the av erage case is also the most probable case. F or the cov ariance we get h f ( x ) f ( y ) i = δ 2 log( Z 0 [ α ]) δ α ( x ) δ α ( y ) α =0 = R D f · f ( x ) · f ( y ) · exp − 1 2 k f k 2 K R D f exp − 1 2 k f k 2 K = (G3) = R Q i d f i · P i f i φ i ( x ) · P j f i φ j ( x ) · exp − 1 2 P l f 2 l λ l R Q i d f i exp − 1 2 P l f 2 l λ l = = X i R d f · f 2 · exp − f 2 2 λ i R d f exp − f 2 2 λ i | {z } λ i φ i ( x ) φ i ( y ) + X i 6 = j R d f · f · exp − f 2 2 λ i R d f exp − f 2 2 λ i | {z } 0 · R d f · f · exp − f 2 2 λ j R d f exp − f 2 2 λ j | {z } 0 = = X i λ i φ i ( x ) φ i ( y ) = K ( x, y ) Indeed, Z is the partition function corresp onding to a centered GP with kernel K . 2. With Data W e contin ue by establishing the exact equiv alence b et ween Bay esian inference on a GP and the corresp onding partition function. F rom G1 we get that P [ f ] ∝ exp − 1 2 k f k 2 K (G4) F or given target function g and a sampled datap oin t ( x 1 , g ( x i )), assuming that f is our prediction it holds that g ( x i ) ∼ N f ( x i ) , σ 2 , since g distributes normally around f with v ariance σ 2 . Therefore, p ( g ( x i ) | f ) ∝ 22 exp − ( g ( x i ) − f ( x i )) 2 / 2 σ 2 , so P [ D | f ] = N Y i =1 p ( g ( x i ) | f , M ) ∝ exp − 1 2 σ 2 N X i =1 ( g ( x i ) − f ( x i )) 2 ! (G5) and using Ba yes’ theorem we get P [ f | D ] ∝ exp − 1 2 k f k 2 K − 1 2 σ 2 N X i =1 ( g ( x i ) − f ( x i )) 2 ! (G6) whic h gives rise to the p osterior partition function Z [ α ] = Z D f exp − 1 2 k f k 2 K − 1 2 σ 2 N X i =1 ( g ( x i ) − f ( x i )) 2 + Z dxα ( x ) f ( x ) ! (G7) and again, the exp onent is quadratic in f leading to a Gaussian distribution ov er the space of functions. Indeed, for the mean w e get g ∗ ( x ∗ ) = h f ( x ∗ ) i = δ log ( Z [ α ]) δ α ( x ∗ ) α =0 = (G8) = arg min " 1 2 k f k 2 K + 1 2 σ 2 N X i =1 ( f ( x i ) − g ( x i )) 2 # x ∗ in agreement with [12]. 3. Calculating Observ ables a. A ver aging g ∗ Applying the replica trick to Eq. G8 and av eraging ov er all the datasets of size N w e obtain h g ∗ ( x ∗ ) i D N = lim M → 0 1 M δ Z M [ α ] D N δ α ( x ∗ ) α =0 (G9) for integer M w e get Z M [ α ] = Z · · · Z | {z } M M Y j =1 D f j (G10) exp − 1 2 M X j =1 k f j k 2 K − M X j =1 N X i =1 ( f j ( x i ) − g ( x i )) 2 2 σ 2 + M X j =1 Z α ( x ) f j ( x ) dx and after a veraging Z M [ α ] D N = Z ... Z | {z } M M Y j =1 D f j (G11) exp − 1 2 M X j =1 k f j k 2 K + M X j =1 Z α ( x ) f j ( x ) dx * exp − M X j =1 ( f j ( x ) − g ( x )) 2 2 σ 2 + N x ∼ µ where h . . . i x ∼ µ = R . . . dµ x . 23 P erforming the Poissonic a verging w e get Z M [ α ] η = e − η ∞ X N =0 η N N ! Z M [ α ] D N = (G12) = Z · · · Z | {z } M times D f 1 . . . D f M exp − 1 2 M X j =1 k f j k 2 K + M X j =1 Z α ( x ) f j ( x ) dx + η * exp − M X j =1 ( f j ( x ) − g ( x )) 2 2 σ 2 − 1 + x ∼ µ so ov erall h g ∗ ( x ∗ ) i η = lim M → 0 1 M δ h Z M [ α ] i η δ α ( x ∗ ) α =0 (G13) b. A ver aging g ∗ 2 F rom G9 we get that h g ∗ 2 ( x ∗ ) i D N = lim M → 0 lim W → 0 1 M W δ 2 h Z M [ α ] Z W [ β ] i D N δ α ( x ∗ ) δ β ( x ∗ ) α,β =0 (G14) Therefore h g ∗ 2 ( x ∗ ) i η = lim M → 0 lim W → 0 1 M W δ 2 h Z M [ α ] Z W [ β ] i η δ α ( x ∗ ) δ β ( x ∗ ) α,β =0 (G15) App endix H: Equiv alence Kernel as F ree Theory Exp ending the nested exp onen t in Eq. G12 using (first order) T aylor series we get Z M [ α ] η = e − η Z ... Z | {z } M M Y j =1 D f j (H1) exp − 1 2 M X j =1 k f j k 2 K + M X j =1 Z α ( x ) f j ( x ) dx + η * exp − M X j =1 ( f j ( x ) − g ( x )) 2 2 σ 2 + x ∼ µ = = Z ... Z | {z } M M Y j =1 D f j exp − 1 2 M X j =1 k f j k 2 K + M X j =1 Z α ( x ) f j ( x ) dx − η * M X j =1 ( f j ( x ) − g ( x )) 2 2 σ 2 + x ∼ µ + O (1 /η 2 ) = = Z D f exp − 1 2 k f k 2 K + Z α ( x ) f ( x ) dµ x − η 2 σ 2 Z dµ x ( f ( x ) − g ( x )) 2 M + O (1 /η 2 ) = = ( Z E K [ α ]) M + O (1 /η 2 ) where we defined Z E K [ α ] def = Z D f exp − 1 2 k f k 2 K + Z α ( x ) f ( x ) dµ x − η 2 σ 2 Z dµ x ( f ( x ) − g ( x )) 2 (H2) under this appro ximation w e get lim M → 0 Z M [ α ] η − 1 M = lim M → 0 ( Z E K [ α ]) M − 1 M + O (1 /η 2 ) = log ( Z E K [ α ]) + O (1 /η 2 ) (H3) 24 Denoting the a verage w.r.t Z E K as h . . . i 0 , The mean of the distribution induced by Z E K is h f ( x ∗ ) i 0 = δ log ( Z E K [ α ]) δ α ( x ∗ ) α =0 = (H4) = R D f · f ( x ∗ ) exp − 1 2 k f k 2 K − η 2 σ 2 R dµ x ( f ( x ) − g ( x )) 2 R D f exp − 1 2 k f k 2 K − η 2 σ 2 R dµ x ( f ( x ) − g ( x )) 2 = = arg min 1 2 k f k 2 K + η 2 σ 2 Z dµ x ( f ( x ) − g ( x )) 2 x ∗ = g ∗ E K,η ( x ∗ ) where the last equality is due to [12]. The cov ariance induced b y Z E K is Co v 0 [ f ( x ) , f ( y )] = h f ( x ) f ( y ) i 0 − h f ( x ) i 0 h f ( y ) i 0 = δ 2 log ( Z E K [ α ]) δ α ( x ) δ α ( y ) α =0 (H5) ∗ = R D f · f ( x ) f ( y ) exp − 1 2 k f k 2 K − η 2 σ 2 R dµ x f 2 ( x ) R D f exp − 1 2 k f k 2 K − η 2 σ 2 R dµ x f 2 ( x ) ∗∗ = R Q i d f i · P i,j f i f j φ i ( x ) φ j ( y ) · exp − 1 2 P i 1 λ i + η σ 2 f 2 i R Q i d f i exp − 1 2 P i 1 λ i + η σ 2 f 2 i ∗∗∗ = X i R d f · f 2 · exp − 1 2 1 λ i + η σ 2 f 2 R d f exp − 1 2 1 λ i + η σ 2 f 2 φ i ( x ) φ i ( y ) = X i 1 λ i + η σ 2 − 1 φ i ( x ) φ i ( y ) where in ( ∗ ) the non-cen tered part of the distribution was deleted, in ( ∗∗ ) the eigenfunctions of K w ere chosen as a base for the path integration and in ( ∗ ∗ ∗ ) we used the fact that R d f · f · exp − 1 2 1 λ i + η σ 2 f 2 = 0, since it is the mean of a centered (unnormalized) Gaussian distribution. F or a rotationally inv ariant k ernel, the eigenfunctions are Y lm and the eigenv alues are λ l (indep enden t of m ) so Eq. H5 b ecomes Co v 0 [ f ( x ) , f ( y )] = X l 1 λ l + η σ 2 − 1 X m Y lm ( x ) Y lm ( y ) | {z } deg( l ) def = C K,σ 2 /η (H6) whic h is a constan t (indep endent of x and y ). 25 App endix I: Next Order Correction W e now wish to p erform the first order correction to the free theory . Expanding Eq. G12 to the next order (k eeping terms up to O 1 /η 2 ) we get Z M [ α ] η = Z ... Z | {z } M times D f 1 . . . D f M (I1) exp − 1 2 M X j =1 k f j k 2 K + M X j =1 Z α ( x ) f j ( x ) dx + η * − M X j =1 ( f j ( x ) − g ( x )) 2 2 σ 2 + x ∼ µ x exp η 2 * M X j =1 ( f j ( x ) − g ( x )) 2 2 σ 2 2 + x ∼ µ x + O 1 /η 3 = = Z · · · Z | {z } M times D f 1 . . . D f M exp M X i =1 − 1 2 k f i k 2 K + Z α ( x ) f i ( x ) dx − η * ( f i ( x ) − g ( x )) 2 2 σ 2 + x ∼ µ exp η 8 σ 4 M X i =1 M X j =1 ( f j ( x ) − g ( x )) 2 · ( f i ( x ) − g ( x )) 2 + O 1 /η 3 = = Z · · · Z | {z } M times D f 1 . . . D f M exp M X i =1 − 1 2 k f i k 2 K + Z α ( x ) f i ( x ) dx − η * ( f i ( x ) − g ( x )) 2 2 σ 2 + x ∼ µ 1 + η 8 σ 4 M X i =1 M X j =1 ( f j ( x ) − g ( x )) 2 · ( f i ( x ) − g ( x )) 2 + O 1 /η 3 1. Calculating h g ∗ i η W e now wish to calculate the correction to h g ∗ i η giv en by Eq. I1. F rom Eq. G13 we get h g ∗ i η = g ∗ E K,η ( x ∗ )+ (I2) lim M → 0 1 M η 8 σ 4 Z dµ x * M X j =1 M X l =1 M X i =1 ( f j ( x ) − g ( x )) 2 · ( f l ( x ) − g ( x )) 2 f i ( x ∗ ) + f 1 ,...,f M ∼ E K + O 1 /η 3 Simplifying the a verage of the m ultiple sums we get * M X j =1 M X l =1 M X i =1 ( f j ( x ) − g ( x )) 2 · ( f l ( x ) − g ( x )) 2 f i ( x ∗ ) + f 1 ,...,f M ∼ E K = (I3) = M D ( f ( x ) − g ( x )) 4 f ( x ∗ ) E 0 + M ( M − 1) h 2 D ( f ( x ) − g ( x )) 2 E 0 D ( f ( x ) − g ( x )) 2 f ( x ∗ ) E 0 + D ( f ( x ) − g ( x )) 4 E 0 h f ( x ∗ ) i 0 i + M ( M − 1) ( M − 2) D ( f ( x ) − g ( x )) 2 E 2 0 h f ( x ∗ ) i 0 26 Since f has a Gaussian distribution ( f ∼ E K ), such a verages can b e calculated using F eynman diagrams. Let us denote f ( x ) − g ( x ) by and f ( x ∗ ) by . Since our free theory is not centered ( h f i 0 = g ∗ E K,η 6 = 0), we allo w edges in the diagrams to b e connected at only one side, representing the a verage of the vertex w.r.t the EK distribution. An edge connected to vertices on b oth sides represents the cov ariance. Note that since we divide by M and take the limit M → 0, we do not care ab out diagrams which are not connecte d to f ( x ∗ ) since they scale as M 2 . Calculating the a verages w e get D ( f ( x ) − g ( x )) 4 f ( x ∗ ) E 0 = (I4) + + disconnected diagrams = = = 12 g ∗ E K,η ( x ) − g ( x ) V ar 0 [ f ( x )] Cov 0 [ f ( x ) , f ( x ∗ )] +4 g ∗ E K,η ( x ) − g ( x ) 3 Co v 0 [ f ( x ) , f ( x ∗ )] + disconnected diagrams D ( f ( x ) − g ( x )) 2 E 0 D ( f ( x ) − g ( x )) 2 f ( x ∗ ) E 0 = (I5) + ( ) ( ) + disconnected diagrams = = = 2Co v 0 [ f ( x ) , f ( x ∗ )] g ∗ E K,η ( x ) − g ( x ) 3 +2V ar 0 [ f ( x )] Cov 0 [ f ( x ) , f ( x ∗ )] g ∗ E K,η ( x ) − g ( x ) + disconnected diagrams D ( f ( x ) − g ( x )) 4 E 0 h f ( x ∗ ) i 0 = disconnected diagrams (I6) D ( f ( x ) − g ( x )) 2 E 2 0 h f ( x ∗ ) i 0 = disconnected diagrams (I7) T aking the limit M → 0 and summing everything together we get lim M → 0 1 M * M X j =1 M X l =1 M X i =1 ( f j ( x ) − g ( x )) 2 · ( f l ( x ) − g ( x )) 2 f i ( x ∗ ) + f 1 ,...,f M ∼ E K = (I8) 8 g ∗ E K,η ( x ) − g ( x ) V ar 0 [ f ( x )] Cov 0 [ f ( x ) , f ( x ∗ )] so finally h g ∗ i η = (I9) g ∗ E K,η ( x ∗ ) + η σ 4 Z dµ x g ∗ E K,η ( x ) − g ( x ) V ar 0 [ f ( x )] Cov 0 [ f ( x ) , f ( x ∗ )] + O 1 /η 3 Substituting the expressions for the free v ariance and the cov ariance (Eq. H5) we get h g ∗ i η = (I10) g ∗ E K,η ( x ∗ ) − η σ 4 X i,j,k σ 2 η λ i + σ 2 η 1 λ j + η σ 2 − 1 1 λ k + η σ 2 − 1 g i φ j ( x ∗ ) Z dµ x φ i ( x ) φ j ( x ) φ 2 k ( x ) + O 1 /η 3 F or a rotationally inv ariant k ernel, I10 b ecomes h g ∗ i η = g ∗ E K,η ( x ∗ ) − X l,m η − 1 λ l C K,σ 2 /η ( λ l + σ 2 /η ) 2 g lm Y lm ( x ∗ ) + O 1 /η 3 (I11) 27 2. Calculating g ∗ 2 η Substituting G10 in G15 we get D g ∗ 2 E η = lim M → 0 lim W → 0 1 M W · ( Z E K [ α = 0]) M + W · Z D f 1 . . . Z D f M Z D ˜ f 1 . . . Z D ˜ f W (I12) exp − η − 1 2 M X m =1 k f m k 2 K − 1 2 W X w =1 ˜ f w 2 K ! exp η * exp − M X m =1 ( f m ( x ) − g ( x )) 2 2 σ 2 − W X w =1 ˜ f w ( x ) − g ( x ) 2 2 σ 2 + x ∼ µ x M X m =1 f m ( x ∗ ) W X w =1 ˜ f w ( x ∗ ) By expanding to the same order we get (all equalities are up to O 1 /η 3 ) D g ∗ 2 ( x ∗ ) E η = lim M → 0 lim W → 0 1 M W · ( Z E K [ α = 0]) M + W · Z D f 1 . . . Z D f M Z D ˜ f 1 . . . Z D ˜ f W (I13) exp − 1 2 M X m =1 k f m k 2 K − 1 2 W X w =1 ˜ f w 2 K + η * − M X m =1 ( f m ( x ) − g ( x )) 2 2 σ 2 − W X w =1 ˜ f w ( x ) − g ( x ) 2 2 σ 2 + x ∼ µ x 1 + η 2 * M X m =1 ( f m ( x ) − g ( x )) 2 2 σ 2 + W X w =1 ˜ f w ( x ) − g ( x ) 2 2 σ 2 2 + x ∼ µ x M X m =1 f m ( x ∗ ) W X w =1 ˜ f w ( x ∗ ) = = g ∗ 2 E K,η ( x ∗ ) + lim M → 0 lim W → 0 1 M W · η 8 σ 4 Z dµ x * M X a =1 ( f a ( x ) − g ( x )) 2 + W X b =1 ˜ f b ( x ) − g ( x ) 2 ! 2 M X c =1 f c ( x ∗ ) W X d =1 ˜ f d ( x ∗ ) + 0 = g ∗ 2 E K,η ( x ∗ ) + lim M → 0 lim W → 0 1 M W · η 4 σ 4 Z dµ x "* M X a =1 ( f a ( x ) − g ( x )) 2 M X b =1 ( f b ( x ) − g ( x )) 2 M X c =1 f c ( x ∗ ) W X d =1 ˜ f d ( x ∗ ) + 0 + * M X a =1 ( f a ( x ) − g ( x )) 2 W X b =1 ˜ f b ( x ) − g ( x ) 2 M X c =1 f c ( x ∗ ) W X d =1 ˜ f d ( x ∗ ) + 0 # = = g ∗ 2 E K,η ( x ∗ ) + η 4 σ 4 Z dµ x lim M → 0 1 M * M X a =1 ( f a ( x ) − g ( x )) 2 M X b =1 ( f b ( x ) − g ( x )) 2 M X c =1 f c ( x ∗ ) + 0 g ∗ E K,η ( x ∗ ) + η 4 σ 4 Z dµ x lim M → 0 1 M * M X a =1 ( f a ( x ) − g ( x )) 2 M X b =1 f b ( x ∗ ) + 0 ! 2 The first in tegrand w as already calculated and is giv en in I8. F or the second integrand w e get lim M → 0 1 M * M X a =1 ( f a ( x ) − g ( x )) 2 M X b =1 f b ( x ∗ ) + = (I14) = lim M → 0 1 M h M D ( f ( x ) − g ( x )) 2 f ( x ∗ ) E + M ( M − 1) h f ( x ∗ ) i D ( f ( x ) − g ( x )) 2 Ei = D ( f ( x ) − g ( x )) 2 f ( x ∗ ) E − h f ( x ∗ ) i D ( f ( x ) − g ( x )) 2 E = 28 + disconnected diagrams = = = 2 g ∗ E K,η ( x ) − g ( x ) Co v 0 [ f ( x ) , f ( x ∗ )] = O 1 /η 3 so the correction for g ∗ 2 ( x ∗ ) η is D g ∗ 2 ( x ∗ ) E η = (I15) g ∗ 2 E K,η ( x ∗ ) − 2 η σ 4 g ∗ E K,η ( x ∗ ) X i,j,k σ 2 η λ i + σ 2 η 1 λ j + η σ 2 − 1 1 λ k + η σ 2 − 1 g i φ j ( x ∗ ) Z dµ x φ i ( x ) φ j ( x ) φ 2 k ( x ) | {z } O (1 /η 2 ) + O 1 /η 3 and for a rotationally inv ariant k ernel we get D g ∗ 2 ( x ∗ ) E η = g ∗ 2 E K,η ( x ∗ ) − 2 g ∗ E K,η ( x ∗ ) X l,m η − 1 λ l C K,σ 2 /η ( λ l + σ 2 /η ) 2 g lm Y lm ( x ∗ ) + O 1 /η 3 (I16) App endix J: V arious insights 1. Correction means worse generalization The correction alw ays means worse generalization than what the EK suggests. Indeed, exp ending equation (I11) we get h g ∗ i η = g ∗ E K,η ( x ∗ ) − X l,m η − 1 λ l C K,σ 2 /η ( λ l + σ 2 /η ) 2 g lm Y lm ( x ∗ ) + O 1 /η 3 = = X l,m λ l λ l + σ 2 η g l,m Y l,m ( x ∗ ) − X l,m η − 1 λ l C K,σ 2 /η ( λ l + σ 2 /η ) 2 g lm Y lm ( x ∗ ) + O 1 /η 3 = = X l,m λ l λ l + σ 2 η − η − 1 λ l C K,σ 2 /η ( λ l + σ 2 /η ) 2 | {z } positive | {z } < λ l λ l + σ 2 η < 1 g l,m Y l,m ( x ∗ ) 2. Exact eigenv alues for 2-la y er ReLU NNGP and NTK with σ 2 b = 0 F or the NNGP asso ciated with a 2-lay er ReLU NTK without bias we w ere able to fined an exact expression for the eigen v alues for all l : λ l =2 k = σ 2 w 0 σ 2 w 1 · d 16 π 2 Γ l − 1 2 Γ d 2 Γ l + d +1 2 ! 2 λ l =2 k +1 = σ 2 w 0 σ 2 w 1 · 1 4 d δ k, 0 and for NTK: 29 λ 2 k = σ 2 w 1 σ 2 w 2 2 π · d (1 + 2 k ) + (1 − 2 k ) 2 8 π Γ k − 1 2 Γ d 2 Γ k + d +1 2 ! 2 λ 2 k +1 = σ 2 w 1 σ 2 w 2 2 π · π d δ k, 0 It is in teresting to note that for all o dd l > 1 λ l = 0 so the expressive p o wer of the k ernel (and hence the neural net work) is greatly reduced. 30 App endix K: Accuracy of the renormalized NTK Let us consider the random v ariable t = x · x 0 , for t wo normalized datap oints x and x 0 dra wn uniformly from the unit hypersphere S d − 1 . Without loss of generality , x can b e assumed to b e a unit vector in the direction of the last axis, and therefore t is the last comp onent of x 0 . The density at t ∈ [ − 1 , 1] is therefore prop ortional to the surface area lying at a height b etw een t and t + dt on the unit sphere. That prop ortion occurs within a b elt of height dt and radius √ 1 − t 2 , which is a conical frustum constructed out of a d − 2 dimensional hypersphere of radius √ 1 − t 2 , of heigh t dt , and slop e 1 / √ 1 − t 2 . Hence the probability is prop ortional to p ( t ) dt ∝ (1 − t 2 ) ( d − 3) / 2 dt . Defining u = ( t + 1) / 2 it holds that p ( u ) du ∝ u ( d − 3) / 2 (1 − u ) ( d − 3) / 2 , meaning that u ∼ Beta d − 1 2 , d − 1 2 , and for large d it holds that V ar[ t ] = O ( d − 1 ). Since t is b ounded to [ − 1 , 1], the random v ariable t r m ust hav e a standard deviation whic h is a deca ying function of r . Indeed, for n d and large d , approximating the integral R t n (1 − t 2 ) ( d − 3) / 2 dt using saddle p oin t approximation we get that f ( t ) = n ln( t ) + d − 3 2 ln(1 − t 2 ) is maximal for t 0 = [ n/ ( n + d − 3)] 1 / 2 , and f 00 ( t 0 ) = 2[ n 2 − ( d − 3) 2 ] / ( d − 3) so ov erall t 2 r = R t 2 r (1 − t 2 ) ( d − 3) / 2 R t 0 (1 − t 2 ) ( d − 3) / 2 ≈ " 1 − 2 r d − 3 2 # − 1 / 2 2 r 2 r + d − 3 r d − 3 2 r + d − 3 ( d − 3) / 2 (K1) This implies that for r d , the standard deviation of t r is O ( d − r/ 2 ). Considering next the tail of the T aylor expansion P q >r b q ( x · x 0 ) q , pro jected on the dataset ( P q >r b q ( x n · x m ) q ). The resulting N by N matrix is P q >r b q on the diagonal but O ( d − ( r +1) / 2 ) in all other entries. As we justified in the main text, our renormalization transformation amounts to keeping only the diagonal piece of this matrix and interpreting it as noise. Consider then (2) for g ∗ in tw o scenarios: (I) g ∗ ∞ with the full NTK ( K ( x, x 0 )) and no noise and (I I) g ∗ r with the NTK trimmed after the r ’th p o wer ( K r ( x, x 0 )) but with σ 2 r = P q >r b q . The first K ( x ∗ , x n ) piece, for x ∗ dra wn from the dataset distribution, ob eys K ( x ∗ , x n ) − K r ( x ∗ , x n ) = O ( d − ( r +1) / 2 ). Next we compare K r ( x n , x m ) + I nm σ 2 r and K ( x n , x n ). On their diagonal they agree exactly but their off-diagonal terms agree only up to a O ( d − ( r +1) / 2 ) discrepancy . Denoting by δ K the difference b et w een these tw o matrices, we may expand K − 1 = [ K r + σ 2 m I + δ K ] − 1 = [ K r + σ 2 r I] − 1 [1 − δ K [ K r + σ 2 r I] − 1 + δ K [ K r + σ 2 r I] − 1 δ K [ K r + σ 2 r I] − 1 + ... ]. W e next argue that δ K [ K r + σ 2 r I] − 1 m ultiplied by target v ector ( g ( x n )) is negligible compared to the identit y for large enough r thereby establishing the equiv alence of the tw o scenarios. Indeed consider the eigenv alues of δ K [ K r + σ 2 r I] − 1 . As δ K nm is O ( d − ( r +1) / 2 ) its t ypical eigen v alues are O ( √ N d − ( r +1) / 2 ) and b ounded by O ( N d − ( r +1) / 2 ). The typical eigen v alues of [ K r + σ 2 m I] − 1 are of the same order as K ( x n , x n ) = K and b ounded from b elo w by σ 2 r . Th us typical eigenv alues of δ K [ K r + σ 2 r I] − 1 are O ( √ N d − ( r +1) / 2 /K ) and b ounded from ab ov e by O ( N d − ( r +1) / 2 /σ 2 r ). The NTK has the desirable prop erty that σ 2 r deca ys very slowly . Thus certainly in the typical case but ev en in the w orse case scenario w e exp ect go od agreement at large r . In Fig. 1, right panel, we provide supp orting numerical e vidence. W e refer to K r ( x, x 0 ) as the renormalized NTKs at the scale r . As follows from (23), λ l ’s with l ≥ r are zero. Therefore, as adv ertised, the high-energy-sector has b een remov ed and comp ensated by noise on the target and a c hange of the remaining l < r (lo w-energy) eigenv alues. A prop er choice of r in v olve t wo considerations. Requiring p erturbation theory to hold well ( C K r ,σ 2 r /η < σ 2 r ) which puts an η -dep ended upp er b ound on r and requiring small discrepancy in predictions puts another η dep enden t low er b ound on r (typically √ N d − ( r +1) / 2 1). Lastly we commen t that our renormalization NTK approach is not limited to uniform datasets. The en tire logic relies on ha ving a rapidly deca ying ratio of off-diagonal moments (( x n · x m ) 2 r ) and diagonal moments ( x n · x n ) 2 r as one increases r . W e exp ect this to hold in real-w orld distributions. F or instance for a m ulti-dimension Gaussian data distribution the input dimension ( d ) traded by an effective dimension ( d ef f ) defined b y the v ariance of ( x m · x n ). 31 App endix L: Hyp er-parameter optimization exp eriment results T ABLE I I. Hyp er-parameter performance comparison T est Prediction GPR σ 2 r T rain σ w 1 σ b 1 σ w 2 σ b 2 Random 1 0.389 0.400 0.364 0.068 1.29e-04 1.555 0.032 2.028 0.026 Random 2 0.316 0.287 0.331 0.004 4.17e-04 0.914 0.029 0.880 0.062 Random 3 0.191 0.219 0.250 0.003 3.36e-04 0.922 0.049 0.760 0.046 Random 4 0.300 0.324 0.306 0.045 1.39e-04 1.552 0.058 1.644 0.054 Random 5 0.268 0.338 0.273 0.070 1.24e-04 1.585 0.072 2.020 0.029 Random 6 0.413 0.406 0.382 0.065 1.28e-04 2.037 0.032 1.512 0.053 Random 7 0.332 0.297 0.335 0.010 8.76e-04 0.994 0.030 1.190 0.071 Random 8 0.228 0.245 0.262 0.015 6.41e-04 1.165 0.059 1.271 0.068 Random 9 0.337 0.308 0.332 0.018 1.37e-03 0.909 0.027 1.758 0.030 Random 10 0.371 0.392 0.355 0.069 1.19e-04 1.658 0.041 1.908 0.057 Random 11 0.313 0.316 0.319 0.032 1.31e-04 1.440 0.050 1.502 0.045 Random 12 0.335 0.340 0.329 0.042 1.33e-04 2.106 0.065 1.175 0.040 Random 13 0.397 0.336 0.373 0.018 1.71e-03 1.546 0.029 1.037 0.044 Random 14 0.236 0.253 0.271 0.017 4.18e-04 1.388 0.067 1.133 0.050 Random 15 0.293 0.288 0.306 0.018 6.37e-04 1.534 0.058 1.068 0.065 Random 16 0.175 0.198 0.214 0.011 1.04e-03 1.132 0.074 1.117 0.053 Random 17 0.206 0.226 0.246 0.013 7.66e-04 1.095 0.061 1.275 0.072 Random 18 0.264 0.264 0.292 0.011 1.00e-03 1.035 0.043 1.230 0.066 Random 19 0.239 0.248 0.282 0.006 5.34e-04 0.835 0.037 1.107 0.050 Random 20 0.385 0.378 0.364 0.054 1.43e-04 1.810 0.039 1.540 0.046 Random 21 0.318 0.300 0.323 0.018 9.58e-04 1.282 0.042 1.266 0.055 W orst 0.413 0.406 0.382 0.065 1.28e-04 2.037 0.032 1.512 0.053 Median 0.313 0.316 0.319 0.032 1.31e-04 1.440 0.050 1.502 0.045 Best 0.175 0.198 0.214 0.011 1.04e-03 1.132 0.074 1.117 0.053 T ypical 0.307 0.307 0.317 0.028 1.41e-04 1.414 0.050 1.414 0.050 Optimized 0.078 0.110 0.141 0.002 1.66e-04 0.707 0.075 0.707 0.027
Original Paper
Loading high-quality paper...
Comments & Academic Discussion
Loading comments...
Leave a Comment