Optimizing Loss Functions Through Multivariate Taylor Polynomial Parameterization
Metalearning of deep neural network (DNN) architectures and hyperparameters has become an increasingly important area of research. Loss functions are a type of metaknowledge that is crucial to effective training of DNNs, however, their potential role…
Authors: Santiago Gonzalez, Risto Miikkulainen
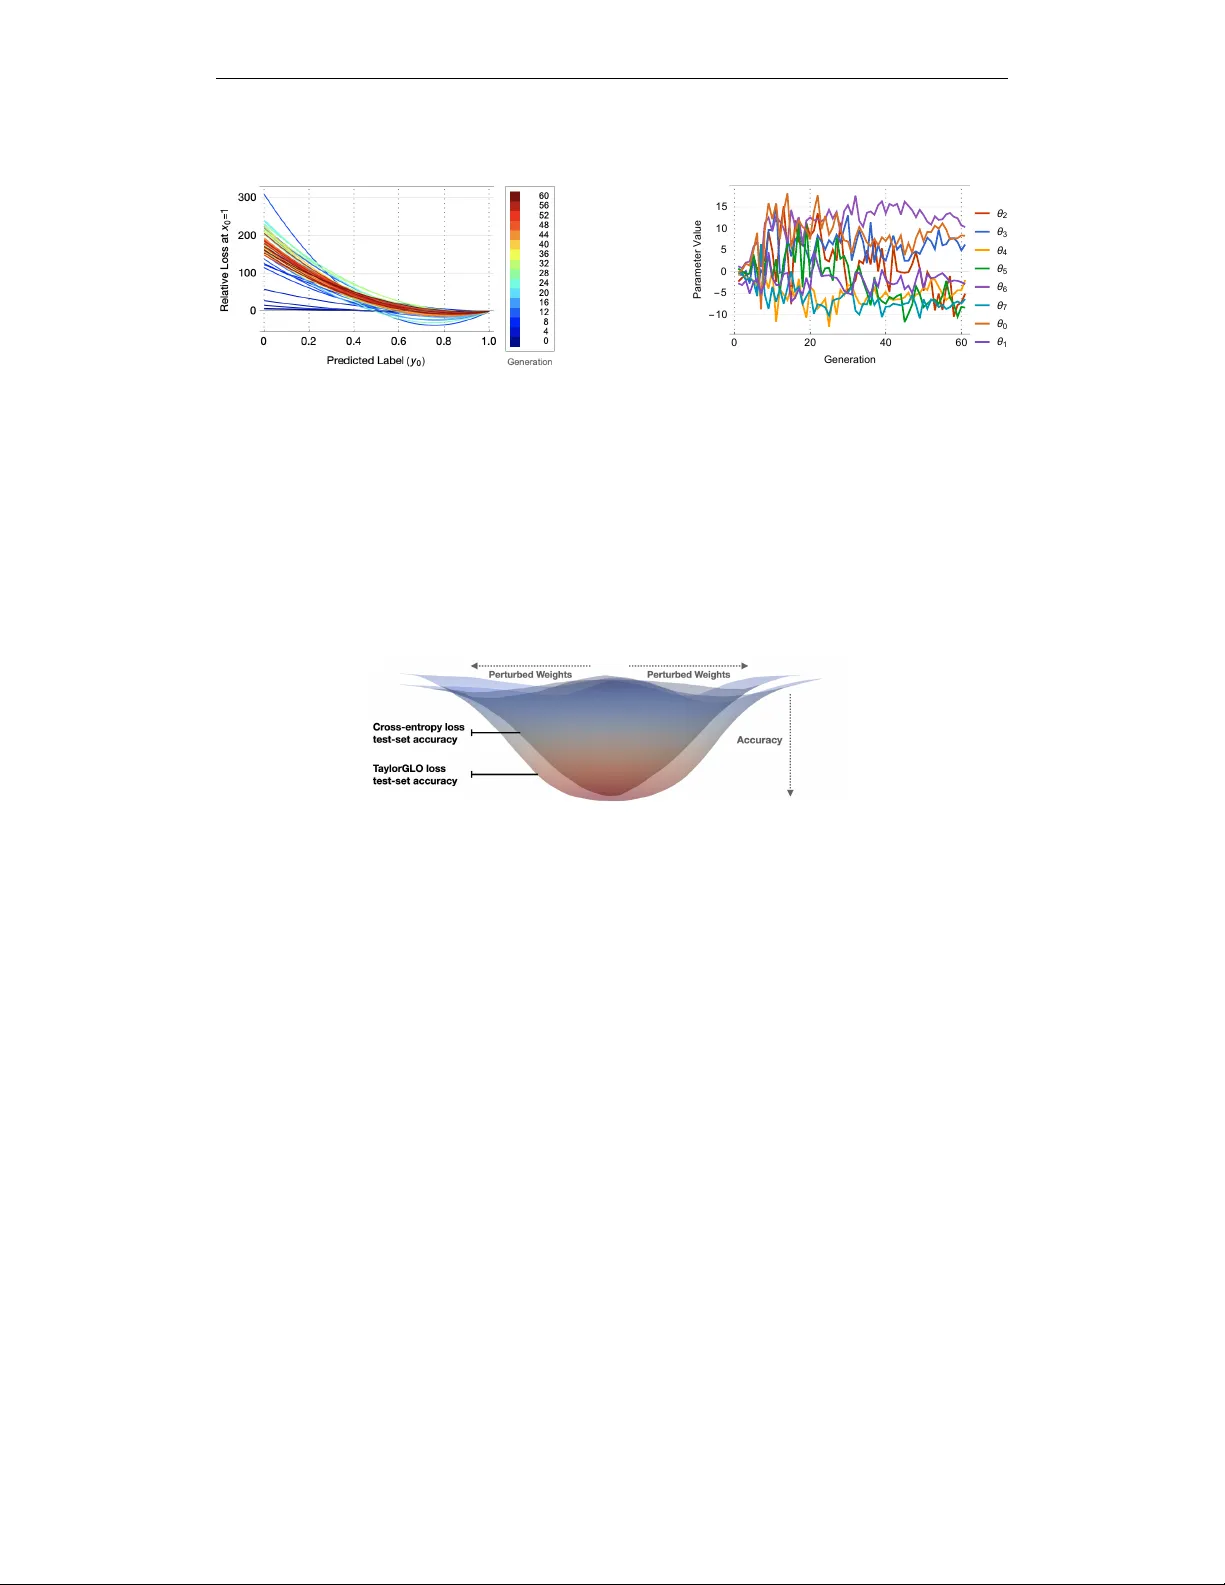
Under revie w as a conference paper at ICLR 2021 O P T I M I Z I N G L O S S F U N C T I O N S T H R O U G H M U L T I - V A R I A T E T A Y L O R P O L Y N O M I A L P A R A M E T E R I Z A T I O N Santiago Gonzalez and Risto Miikkulainen Cognizant T echnology Solutions, San F r ancisco, California, USA Department of Computer Science, Univ ersity of T exas at Austin, Austin, T exas, USA slgonzalez@utexas.edu , risto@cs.utexas.edu A B S T R A C T Metalearning of deep neural network (DNN) architectures and hyperparameters has become an increasingly important area of research. Loss functions are a type of metaknowledge that is crucial to ef fective training of DNNs, howe ver , their potential role in metalearning has not yet been fully explored. Whereas early work focused on genetic programming (GP) on tree representations, this paper proposes continuous CMA-ES optimization of multivariate T aylor polynomial parameterizations. This approach, T aylorGLO, mak es it possible to represent and search useful loss functions more ef fectively . In MNIST , CIF AR-10, and SVHN benchmark tasks, T aylorGLO finds new loss functions that outperform the standard cross-entropy loss as well as nov el loss functions pre viously discovered through GP , in fewer generations. These functions serve to regularize the learning task by discouraging ov erfitting to the labels, which is particularly useful in tasks where limited training data is a vailable. The results thus demonstrate that loss function optimization is a productiv e new a venue for metalearning. 1 I N T R O D U C T I O N As deep learning systems hav e become more complex, their architectures and hyperparameters hav e become increasingly dif ficult and time-consuming to optimize by hand. In fact, many good designs may be overlook ed by humans with prior biases. Therefore, automating this process, known as metalearning, has become an essential part of the modern machine learning toolbox. Metalearning aims to solve this problem through a variety of approaches, including optimizing different aspects of the architecture from hyperparameters to topologies, and by using different methods from Bayesian optimization to evolutionary computation (Schmidhuber, 1987; Elsken et al., 2019; Miikkulainen et al., 2019; Lemke et al., 2015). Recently , loss-function discovery and optimization has emer ged as a new type of metalearning. Focusing on neural netw ork’ s root training goal it aims to discov er better ways to define what is being optimized. Howe ver , loss functions can be challenging to optimize because the y ha ve a discrete nested structure as well as continuous coefficients. The first system to do so, Genetic Loss Optimization (GLO; Gonzalez & Miikkulainen, 2020) tackled this problem by discov ering and optimizing loss functions in two separate steps: (1) representing the structure as trees, and e volving them with Genetic Programming (GP; Banzhaf et al., 1998); and (2) optimizing the coefficients using Cov ariance-Matrix Adaptation Evolutionary Strategy (CMA-ES; Hansen & Ostermeier, 1996). While the approach was successful, such separate processes make it challenging to find a mutually optimal structure and coef ficients. Furthermore, small changes in the tree-based search space do not alw ays result in small changes in the phenotype, and can easily mak e a function in valid, making the search process ineffecti ve. In an ideal case, loss functions would be mapped into arbitrarily long, fixed-length vectors in a Hilbert space. This mapping should be smooth, well-behav ed, well-defined, incorporate both a function’ s structure and coefficients, and should by its very nature exclude large classes of infeasible loss functions. This paper introduces such an approach: Multivariate T aylor expansion-based genetic loss-function optimization (T aylorGLO). W ith a nov el parameterization for loss functions, the ke y pieces of information that af fect a loss function’ s behavior are compactly represented in a vector . Such 1 Under revie w as a conference paper at ICLR 2021 vectors are then optimized for a specific task using CMA-ES. Special techniques can be developed to narrow do wn the search space and speed up ev olution. Loss functions discovered by T aylorGLO outperform the standard cross-entropy loss (or log loss) on the MNIST , CIF AR-10, and SVHN datasets with se veral different netw ork architectures. They also outperform the Baikal loss, disco vered by the original GLO technique, and do it with significantly fewer function ev aluations. The reason for the improved performance is that ev olved functions discourage overfitting to the class labels, thereby resulting in automatic regularization. These improv ements are particularly pronounced with reduced datasets where such regularization matters the most. T aylorGLO thus further establishes loss-function optimization as a promising ne w direction for metalearning. 2 R E L AT E D W O R K Applying deep neural networks to new tasks often in v olves significant manual tuning of the network design. The field of metalearning has recently emerged to tackle this issue algorithmically (Schmid- huber, 1987; Lemke et al., 2015; Elsken et al., 2019; Miikkulainen et al., 2019). While much of the work has focused on hyperparameter optimization and architecture search, recently other aspects, such acti vation functions and learning algorithms, ha ve been found useful tar gets for optimization (Bingham et al., 2020; Real et al., 2020). Since loss functions are at the core of machine learning, it is compelling to apply metalearning to their design as well. Deep neural networks are trained iterati vely , by updating model parameters (i.e., weights and biases) using gradients propagated backward through the network (Rumelhart et al., 1985). The process starts from an error gi ven by a loss function, which represents the primary training objecti ve of the network. In many tasks, such as classification and language modeling, the cross-entropy loss (also known as the log loss) has been used almost exclusi vely . While in some approaches a regularization term (e.g. L 2 weight regularization; T ikhonov, 1963) is added to the the loss function definition, the core component is still the cross-entropy loss. This loss function is motiv ated by information theory: It aims to minimize the number of bits needed to identify a message from the true distribution, using a code from the predicted distribution. In other types of tasks that do not fit neatly into a single-label classification framework different loss functions hav e been used successfully (Gonzalez et al., 2019; Gao & Grauman, 2019; Kingma & W elling, 2014; Zhou et al., 2016; Dong et al., 2017). Indeed, different functions hav e different properties; for instance the Huber Loss (Huber, 1964) is more resilient to outliers than other loss functions. Still, most of the time one of the standard loss functions is used without a justification; therefore, there is an opportunity to improv e through metalearning. Genetic Loss Optimization (GLO; Gonzalez & Miikkulainen, 2020) provided an initial approach into metalearning of loss functions. As described above, GLO is based on tree-based representations with coefficients. Such representations hav e been dominant in genetic programming because they are flexible and can be applied to a variety of function evolution domains. GLO was able to discover Baikal, a new loss function that outperformed the cross-entropy loss in image classification tasks. Howe ver , because the structure and coefficients are optimized separately in GLO, it cannot easily optimize their interactions. Many of the functions created through tree-based search are not useful because they ha ve discontinuities, and mutations can ha ve disproportionate ef fects on the functions. GLO’ s search is thus inef ficient, requiring large populations that are ev olved for many generations. The technique presented in this paper , T aylorGLO, aims to solve these problems through a novel loss function parameterization based on multiv ariate T aylor expansions. Furthermore, since such representations are continuous, the approach can take advantage of CMA-ES (Hansen & Ostermeier, 1996) as the search method, resulting in faster search. 3 L O S S F U N C T I O N S A S M U LT I V A R I A T E T A Y L O R E X PA N S I O N S T aylor expansions (T aylor, 1715) are a well-known function approximator that can represent dif- ferentiable functions within the neighborhood of a point using a polynomial series. Below , the common univ ariate T aylor expansion formulation is presented, followed by a natural extension to arbitrarily-multiv ariate functions. 2 Under revie w as a conference paper at ICLR 2021 Giv en a C k max smooth (i.e., first through k max deriv ativ es are continuous), real-valued function, f ( x ) : R → R , a k th-order T aylor approximation at point a ∈ R , ˆ f k ( x, a ) , where 0 ≤ k ≤ k max , can be constructed as ˆ f k ( x, a ) = k X n =0 1 n ! f ( n ) ( a )( x − a ) n . (1) Con ventional, uni variate T aylor expansions ha ve a natural extension to arbitrarily high-dimensional inputs of f . Given a C k max +1 smooth, real-valued function, f ( x ) : R n → R , a k th-order T aylor approximation at point a ∈ R n , ˆ f k ( x , a ) , where 0 ≤ k ≤ k max , can be constructed. The stricter smoothness constraint compared to the univ ariate case allows for the application of Schwarz’ s theorem on equality of mixed partials, ob viating the need to take the order of partial dif ferentiation into account. Let us define an n th-degree multi-index, α = ( α 1 , α 2 , . . . , α n ) , where α i ∈ N 0 , | α | = P n i =1 α i , α ! = Q n i =1 α i ! . x α = Q n i =1 x α i i , and x ∈ R n . Multiv ariate partial deriv atives can be concisely written using a multi-index ∂ α f = ∂ α 1 1 ∂ α 2 2 · · · ∂ α n n f = ∂ | α | ∂ x α 1 1 ∂ x α 2 2 · · · ∂ x α n n . (2) Thus, discounting the remainder term, the multiv ariate T aylor expansion for f ( x ) at a is ˆ f k ( x , a ) = X ∀ α, | α |≤ k 1 α ! ∂ α f ( a )( x − a ) α . (3) The unique partial deri vati ves in ˆ f k and a are parameters for a k th order T aylor expansion. Thus, a k th order T aylor expansion of a function in n variables requires n parameters to define the center, a , and one parameter for each unique multi-index α , where | α | ≤ k . That is: # parameters ( n, k ) = n + n + k k = n + ( n + k )! n ! k ! . The multi variate T aylor expansion can be lev eraged for a nov el loss-function parameterization. Let an n -class classification loss function be defined as L Log = − 1 n P n i =1 f ( x i , y i ) . The function f ( x i , y i ) can be replaced by its k th-order , biv ariate T aylor expansion, ˆ f k ( x, y , a x , a y ) . More sophisticated loss functions can be supported by having more input variables be yond x i and y i , such as a time variable or unscaled logits. This approach can be useful, for example, to e volve loss functions that change as training progresses. For example, a loss function in x and y has the following third-order parameterization with parameters θ (where a = h θ 0 , θ 1 i ): L ( x , y ) = − 1 n n X i =1 h θ 2 + θ 3 ( y i − θ 1 ) + 1 2 θ 4 ( y i − θ 1 ) 2 + 1 6 θ 5 ( y i − θ 1 ) 3 + θ 6 ( x i − θ 0 ) + θ 7 ( x i − θ 0 )( y i − θ 1 ) + 1 2 θ 8 ( x i − θ 0 )( y i − θ 1 ) 2 + 1 2 θ 9 ( x i − θ 0 ) 2 + 1 2 θ 10 ( x i − θ 0 ) 2 ( y i − θ 1 ) + 1 6 θ 11 ( x i − θ 0 ) 3 i (4) Notably , the reciprocal-factorial coefficients can be integrated to be a part of the parameter set by direct multiplication if desired. As will be shown in this paper , the technique makes it possible to train neural networks that are more accurate and learn faster than those with tree-based loss function representations. Representing loss functions in this manner confers sev eral useful properties: • It guarantees smooth functions; • Functions do not ha ve poles (i.e., discontinuities going to infinity or negati ve infinity) within their relev ant domain; • They can be implemented purely as compositions of addition and multiplication operations; • They can be tri vially differentiated; • Nearby points in the search space yield similar results (i.e., the search space is locally smooth), making the fitness landscape easier to search; • V alid loss functions can be found in fewer generations and with higher frequency; • Loss function discovery is consistent and not dependent on a specific initial population; and • The search space has a tunable complexity parameter (i.e., the order of the expansion). 3 Under revie w as a conference paper at ICLR 2021 These properties are not necessarily held by alternativ e function approximators. For instance: Fourier series are well suited for approximating periodic functions (Fourier, 1829). Consequently , they are not as well suited for loss functions, whose local behavior within a narro w domain is important. Being a composition of wav es, Fourier series tend to have many critical points within the domain of interest. Gradients fluctuate around such points, making gradient descent infeasible. Additionally , close approximations require a large number of terms, which in itself can be injurious, causing large, high-frequency fluctuations kno wn as “ringing”, due to Gibb’ s phenomenon (W ilbraham, 1848). Padé approximants can be more accurate approximations than T aylor expansions; indeed, T aylor expansions are a special c ase of Padé approximants where M = 0 (Grav es-Morris, 1979). Howe ver , unfortunately Padé approximants can model functions with one or more poles, which valid loss functions typically should not have. These problems still exist, and are exacerbated, for Chisholm approximants (a bi variate e xtension; Chisholm, 1973) and Canterbury approximants (a multi variate generalization; Gra ves-Morris & Roberts, 1975). Laurent polynomials can represent functions with discontinuities, the simplest being x − 1 . While Laurent polynomials provide a generalization of T aylor expansions into neg ative e xponents, the extension is not useful because it results in the same issues as P adé approximants. Polyharmonic splines can represent continuous functions within a finite domain, ho wever , the number of parameters is prohibitiv e in multiv ariate cases. The multiv ariate T aylor expansion is therefore a better choice than the alternati ves. It makes it possible to optimize loss functions efficiently in T aylorGLO, as will be described next. 4 T H E T AY L O R G L O M E T H O D Candidate Evaluation 0 0 0 0 0 0 [ ] 0 0 Build T aylorGLO Loss Function CMA-ES Mean V ector Covariance Matrix Sampler Partial Model T raining (Few Epochs) ℒ = − 1 n n ∑ i =1 f ( x i , y i ) 1.1 0.8 1.4 1.2 1 1.2 [ ] 1.4 0.8 Build T aylorGLO Loss Function Initial Solution Mean V ector Best Solution V alidation Set Evaluation Figure 1: The T aylorGLO method. Start- ing with a popoulation of initially unbiased loss functions, CMA-ES optimizes their T ay- lor expansion parameters in order to maxi- mize validation accuracy after partial train- ing. The candidate with the highest accurac y is chosen as the final, best solution. T aylorGLO (Figure 1) aims to find the optimal param- eters for a loss function represented as a multivariate T aylor expansion. The parameters for a T aylor ap- proximation (i.e., the center point and partial deriv a- tiv es) are referred to as θ ˆ f : θ ˆ f ∈ Θ , Θ = R # parameters . T aylorGLO stri ves to find the vector θ ∗ ˆ f that parameter - izes the optimal loss function for a task. Because the values are continuous, as opposed to discrete graphs of the original GLO, it is possible to use continuous optimization methods. In particular , Co variance Matrix Adaptation Ev olution- ary Strategy (CMA-ES Hansen & Ostermeier, 1996) is a popular population-based, black-box optimization technique for rugged, continuous spaces. CMA-ES functions by maintaining a cov ariance matrix around a mean point that represents a distrib ution of solutions. At each generation, CMA-ES adapts the distrib ution to better fit e valuated objecti ve values from sampled individuals. In this manner , the area in the search space that is being sampled at each step grows, shrinks, and mov es dynamically as needed to maximize sampled candidates’ fitnesses. T aylorGLO uses the ( µ/µ, λ ) v ariant of CMA-ES (Hansen & Ostermeier, 2001), which incorporates weighted rank- µ updates (Hansen & K ern, 2004) to reduce the number of objective function e valuations needed. In order to find θ ∗ ˆ f , at each generation CMA-ES samples points in Θ . Their fitness is determined by training a model with the corresponding loss function and ev aluating the model on a v alidation dataset. Fitness ev aluations may be distributed across multiple machines in parallel and retried a limited number of times upon failure. An initial vector of θ ˆ f = 0 is chosen as a starting point in the search space to av oid bias. Fully training a model can be prohibitiv ely expensiv e in many problems. Howe ver , performance near the beginning of training is usually correlated with performance at the end of training, and therefore it is enough to train the models only partially to identify the most promising candidates. This type of 4 Under revie w as a conference paper at ICLR 2021 approximate ev aluation is common in metalearning (Grefenstette & Fitzpatrick, 1985; Jin, 2011). An additional positiv e effect is that e valuation then fa vors loss functions that learn more quickly . For a loss function to be useful, it must ha ve a deri vativ e that depends on the prediction. Therefore, internal terms that do not contribute to ∂ ∂ y L f ( x , y ) can be trimmed away . This step implies that any term t within f ( x i , y i ) with ∂ ∂ y i t = 0 can be replaced with 0 . For example, this refinement simplifies Equation 4, providing a reduction in the number of parameters from twelv e to eight: L ( x , y ) = − 1 n n X i =1 h θ 2 ( y i − θ 1 ) + 1 2 θ 3 ( y i − θ 1 ) 2 + 1 6 θ 4 ( y i − θ 1 ) 3 + θ 5 ( x i − θ 0 )( y i − θ 1 ) + 1 2 θ 6 ( x i − θ 0 )( y i − θ 1 ) 2 + 1 2 θ 7 ( x i − θ 0 ) 2 ( y i − θ 1 ) i . (5) 5 E X P E R I M E N TA L S E T U P This section presents the experimental setup that was used to e valuate the T aylorGLO technique. Domains: MNIST (LeCun et al., 1998) was included as simple domain to illustrate the method and to provide a backw ard comparison with GLO; CIF AR-10 (Krizhevsky & Hinton, 2009) and SVHN (Netzer et al., 2011) were included as more modern benchmarks. Improvements were measured in comparison to the standard cross-entropy loss function L Log = − 1 n P n i =1 x i log( y i ) , where x is sampled from the true distribution, y is from the predicted distribution, and n is the number of classes. Evaluated architectures: A v ariety of architectures were used to e valuate T aylorGLO: the basic CNN architecture ev aluated in the GLO study (Gonzalez & Miikkulainen, 2020), AlexNet (Krizhevsk y et al., 2012), AllCNN-C (Springenberg et al., 2015), Preacti vation ResNet-20 (He et al., 2016a), which is an improved v ariant of the ubiquitous ResNet architecture (He et al., 2016b), and W ide ResNets of different morphologies (Zagoruyk o & K omodakis, 2016). Networks with Cutout (DeVries & T aylor, 2017) were also ev aluated, to show that T aylorGLO provides a different approach to re gularization. T aylorGLO setup: CMA-ES was instantiated with population size λ = 28 on MNIST and λ = 20 on CIF AR-10, and an initial step size σ = 1 . 2 . These values were found to work well in preliminary experiments. The candidates were third-order (i.e., k = 3 ) T aylorGLO loss functions (Equation 5). Such functions were found experimentally to hav e a better trade-off between e volution time and performance compared to second- and fourth-order T aylorGLO loss functions, although the differences were relati vely small. Further experimental setup and implementation details are pro vided in Appendix A. 6 R E S U LT S New Best All - Time Best Generation Best Generation Average 0 10 20 30 40 50 60 0.2 0.4 0.6 0.8 0.99 0.995 1 Generation 2 k - step Validation Accuracy Figure 2: The process of discovering loss functions in MNIST . Red dots mark gener - ations where ne w improved loss functions were found. T aylorGLO discovers good functions in very few generations. The best had a 2000-step validation accuracy of 0.9948, compared to 0.9903 with the cross- entropy loss, av eraged over ten runs. This difference translates to a similar improve- ment on the test set, as shown in T able 1. This section illustrates the T aylorGLO process and demonstrates how the evolv ed loss functions can im- prov e performance ov er the standard cross-entropy loss function, especially on reduced datasets. A summary of results on three datasets across a variety of models are shown in T able 1. 6 . 1 T H E T AY L O R G L O D I S C OV E RY P R O C E S S Figure 2 illustrates the e volution process ov er 60 gen- erations, which is sufficient to reach con vergence on the MNIST dataset. T aylorGLO is able to discover highly-performing loss functions quickly , i.e. within 20 generations. Generations’ average v alidation accu- racy approaches generations’ best accurac y as e volution progresses, indicating that population as a whole is im- proving. Whereas GLO’ s unbounded search space of- ten results in pathological functions, ev ery T aylorGLO training session completed successfully without any instabilities. 5 Under revie w as a conference paper at ICLR 2021 T able 1: T est-set accuracy of loss functions discovered by T aylorGLO compared with that of the cross-entropy loss. The T aylorGLO results are based on the loss function with the highest validation accuracy during e volution. All av erages are from ten separately trained models and p -v alues are from one-tailed W elch’ s t -T ests. Standard deviations are sho wn in parentheses. T aylorGLO discovers loss functions that perform significantly better than the cross-entrop y loss in almost all cases, including those that include Cutout, suggesting that it provides a dif ferent form of regularization. T ask and Model A vg. T aylorGLO Acc. A vg. Baseline Acc. p -value MNIST on Basic CNN 1 0.9951 (0.0005) 0.9899 (0.0003) 2.95 × 10 − 15 CIF AR-10 on AlexNet 2 0.7901 (0.0026) 0.7638 (0.0046) 1.76 × 10 − 10 CIF AR-10 on PreResNet-20 4 0.9169 (0.0014) 0.9153 (0.0021) 0.0400 CIF AR-10 on AllCNN-C 3 0.9271 (0.0013) 0.8965 (0.0021) 0.42 × 10 − 17 CIF AR-10 on AllCNN-C 3 + Cutout 6 0.9329 (0.0022) 0.8911 (0.0037) 1.60 × 10 − 14 CIF AR-10 on Wide ResNet 16-8 5 0.9558 (0.0011) 0.9528 (0.0012) 1.77 × 10 − 5 CIF AR-10 on Wide ResNet 16-8 5 + Cutout 6 0.9618 (0.0010) 0.9582 (0.0011) 2.55 × 10 − 7 CIF AR-10 on Wide ResNet 28-5 5 0.9548 (0.0015) 0.9556 (0.0011) 0.0984 CIF AR-10 on Wide ResNet 28-5 5 + Cutout 6 0.9621 (0.0013) 0.9616 (0.0011) 0.1882 SVHN on W ide ResNet 16-8 5 0.9658 (0.0007) 0.9597 (0.0006) 1.94 × 10 − 13 SVHN on W ide ResNet 16-8 5 + Cutout 6 0.9714 (0.0010) 0.9673 (0.0008) 9.10 × 10 − 9 SVHN on W ide ResNet 28-5 5 0.9657 (0.0009) 0.9634 (0.0006) 6.62 × 10 − 6 SVHN on W ide ResNet 28-5 5 + Cutout 6 0.9727 (0.0006) 0.9709 (0.0006) 2.96 × 10 − 6 Network architecture references: 1 Gonzalez & Miikkulainen (2020) 2 Krizhevsk y et al. (2012) 3 Springenberg et al. (2015) 4 He et al. (2016a) 5 Zagoruyko & K omodakis (2016) 6 DeVries & T aylor (2017) Figure 3 shows the shapes and parameters of each gen- eration’ s highest-scoring loss function. In Figure 3 a the functions are plotted as if they were being used for binary classification, i.e. the loss for an incorrect label on the left and for a correct one on the right (Gonzalez & Miikkulainen, 2020). The functions have a distinct pattern through the ev olution process. Early generations include a wider variety of shapes, b ut they later con ver ge towards curv es with a shallow minimum around y 0 = 0 . 8 . In other words, the loss increases near the correct output—which is counterintuitive. This shape is also strikingly dif ferent from the cross-entropy loss, which decreases monotonically from left to right, as one might expect all loss functions to do. The ev olved shape is effecti ve most likely because can provide an implicit regularization ef fect: it discourages the model from outputting unnecessarily extreme v alues for the correct class, and therefore makes overfitting less lik ely (Gonzalez & Miikku- lainen, 2020). This is a surprising finding, and demonstrates the power of machine learning to create innov ations beyond human design. 6 . 2 P E R F O R M A N C E C O M PA R I S O N S Over 10 fully-trained models, the best T aylorGLO loss function achiev ed a mean testing accuracy of 0.9951 (stdde v 0.0005) in MNIST . In comparison, the cross-entropy loss only reached 0.9899 (stdde v 0.0003), and the "BaikalCMA" loss function discov ered by GLO, 0.9947 (stddev 0.0003) (Gonzalez & Miikkulainen, 2020); both differences are statistically significant (Figure 5). Notably , T aylorGLO achiev ed this result with significantly fe wer generations. GLO required 11,120 partial e valuations (i.e., 100 individuals ov er 100 GP generations plus 32 individuals ov er 35 CMA-ES generations), while the top T aylorGLO loss function only required 448 partial ev aluations, i.e. 4 . 03% as many . Thus, T aylorGLO achiev es improved results with significantly fe wer ev aluations than GLO. Such a large reduction in e valuations during e volution allo ws T aylorGLO to tackle harder problems, including models that hav e millions of parameters. On the CIF AR-10 and SVHN datasets, T aylorGLO was able to outperform cross-entropy baselines consistently on a variety models, as shown in T able 1. It also provides further improvement on architectures that use Cutout (DeVries & T aylor, 2017), suggesting that its mechanism of av oiding ov erfitting is different from other regularization techniques. In addition, T aylorGLO loss functions result in more rob ust trained models. In Figure 4, accuracy basins for two AllCNN-C models, one trained with the T aylorGLO loss function and another with the cross-entropy loss, are plotted along a two-dimensional slice [ − 1 , 1] of the weight space (a technique due to Li et al., 2018). The T aylorGLO loss function results in a flatter, lower basin. This result 6 Under revie w as a conference paper at ICLR 2021 ( a ) Best discov ered functions over time 0 20 40 60 - 10 - 5 0 5 10 15 Generation Parameter Value θ 2 θ 3 θ 4 θ 5 θ 6 θ 7 θ 0 θ 1 ( a ) Best function parameters ov er time Figure 3: The best loss functions ( a ) and their respective parameters ( b ) from each generation of T aylorGLO on MNIST . The functions are plotted in a binary classification modality , showing loss for different values of the network output ( y 0 in the horizontal axis) when the correct label is 1.0. The functions are colored according to their generation from blue to red, and vertically shifted such that their loss at y 0 = 1 is zero (the raw v alue of a loss function is not relev ant; the deriv ativ e, howe ver , is). T aylorGLO explores varying shapes of solutions before narrowing down on functions in the red band; this process can also be seen in ( b ) , where parameters become more consistent ov er time, and in the population plot of Appendix B. The final functions decrease from left to right, b ut have a significant increase in the end. This shape is likely to prevent o verfitting during learning, which leads to the observed impro ved accuracy . Figure 4: Accuracy basins for AllCNN-C models trained with both cross-entropy and T aylorGLO loss functions. The T aylorGLO basins are both flatter and lower , indicating that they are more robust and generalize better (Keskar et al., 2017), which results in higher accurac y . suggests that the model is more robust, i.e. its performance is less sensiti ve to small perturbations in the weight space, and it also generalizes better (Keskar et al., 2017). 6 . 3 P E R F O R M A N C E O N R E D U C E D D A TA S E T S The performance improv ements that T aylorGLO provides are especially pronounced with reduced datasets. For example, Figure 6 compares accuracies of models trained for 20,000 steps on different portions of the MNIST dataset (similar results were obtained with other datasets and architectures). Overall, T aylorGLO significantly outperforms the cross-entropy loss. When evolving a T aylorGLO loss function and training against 10% of the training dataset, with 225 epoch e valuations, T aylorGLO reached an av erage accuracy across ten models of 0.7595 (stddev 0 . 0062 ). In contrast, only four out of ten cross-entropy loss models trained successfully , with those reaching a lo wer a verage accuracy of 0 . 6521 . Thus, customized loss functions can be especially useful in applications where only limited data is a vailable to train the models, presumably because the y are less likely to o verfit to the small number of examples. 7 D I S C U S S I O N A N D F U T U R E W O R K T aylorGLO was applied to the benchmark tasks using v arious standard architectures with standard hyperparameters. These setups have been heavily engineered and manually tuned by the research community , yet T aylorGLO was able to impro ve them. Interestingly , the impro vements were more substantial with wide architectures and smaller with narrow and deep architectures such as the Preactiv ation ResNet. While it may be possible to further improve upon this result, it is also possible that loss function optimization is more ef fective with architectures where the gradient information 7 Under revie w as a conference paper at ICLR 2021 ( a ) Accuracy ( b ) Evaluations Figure 5: ( a ) Mean test accuracy across ten runs on MNIST . The T aylorGLO loss func- tion with the highest validation score signifi- cantly outperforms the cross-entropy loss ( p = 2 . 95 × 10 − 15 in a one-tailed W elch’ s t -test) and the BaikalCMA loss (Gonzalez & Miikkulainen, 2020) ( p = 0 . 0313 ). ( b ) Required partial train- ing ev aluations for GLO and T aylorGLO on MNIST . The T aylorGLO loss function was dis- cov ered with 4% of the ev aluations that GLO required to discov er BaikalCMA. 1.0 0.5 0.2 0.1 0.02 0.005 0.88 0.90 0.92 0.94 0.96 0.98 1.00 Training Dataset Portion Testing Accuracy Cross - Entropy TaylorGLO Figure 6: Accuracy with reduced portions of the MNIST dataset. Progressiv ely smaller portions of the dataset were used to train the models (av erag- ing ov er ten runs). The T aylorGLO loss function provides significantly better performance than the cross-entropy loss on all training dataset sizes, and particularly on the smaller datasets. Thus, its abil- ity to discourage overfitting is particularly useful in applications where only limited data is av ailable. trav els through fewer connections, or is otherwise better preserved throughout the network. An important direction of future work is therefore to ev olve both loss functions and architectures together , taking advantage of possible syner gies between them. As illustrated in Figure 3 a , the most significant effect of e volved loss functions is to discourage extreme output v alues, thereby av oiding overfitting. It is interesting that this mechanism is apparently dif ferent from other regularization techniques such as dropout (as shown by Gonzalez & Miikkulainen, 2020) and data augmentation with Cutout (as seen in T able 1). Dropout and Cutout improve performance o ver the baseline, and loss function optimization improves it further . This result suggests that regularization is a multifaceted process, and further work is necessary to understand ho w to best take adv antage of it. Another important direction is to incorporate state information into T aylorGLO loss functions, such as the percentage of training steps completed. T aylorGLO may then find loss functions that are best suited for different points in training, where, for example, dif ferent kinds of regularization work best (Golatkar et al., 2019). Unintuitiv e changes to the training process, such as cycling learning rates (Smith, 2017), hav e been found to improve performance; e volution could be used to find other such opportunities automatically . Batch statistics could help e volve loss functions that are more well-tuned to each batch; intermediate network activ ations could expose information that may help tune the function for deeper networks like ResNet. Deeper information about the characteristics of a model’ s weights and gradients, such as that from spectral decomposition of the Hessian matrix (Sagun et al., 2017), could assist the evolution of loss functions that adapt to the current fitness landscape. The technique could also be adapted to models with auxiliary classifiers (Szegedy et al., 2015) as a means to touch deeper parts of the network. 8 C O N C L U S I O N This paper proposes T aylorGLO as a promising new technique for loss-function metalearning. T aylorGLO lev erages a novel parameterization for loss functions, allowing the use of continuous optimization rather than genetic programming for the search, thus making it more efficient and more reliable. T aylorGLO loss functions serve to regularize the learning task, outperforming the standard cross-entropy loss significantly on MNIST , CIF AR-10, and SVHN benchmark tasks with a v ariety of network architectures. They also outperform pre viously loss functions discovered in prior w ork, while requiring man y fewer candidates to be evaluated during search. Thus, T aylorGLO results in higher testing accuracies, better data utilization, and more robust models, and is a promising new av enue for metalearning. 8 Under revie w as a conference paper at ICLR 2021 R E F E R E N C E S M. Abadi, P . Barham, J. Chen, Z. Chen, A. Davis, J. Dean, M. Devin, S. Ghemaw at, G. Irv- ing, M. Isard, M. Kudlur , J. Lev enberg, R. Monga, S. Moore, D. G. Murray , B. Steiner , P . T ucker , V . V asude van, P . W arden, M. Wick e, Y . Y u, and X. Zheng. T ensorFlow: A sys- tem for large-scale machine learning. In 12th USENIX Symposium on Operating Systems De- sign and Implementation (OSDI 16) , pp. 265–283, Sav annah, GA, 2016. USENIX Association. ISBN 978-1-931971-33-1. URL https://www.usenix.org/conference/osdi16/ technical- sessions/presentation/abadi . W . Banzhaf, P . Nordin, R. E. Keller , and F . D. Francone. Genetic pr ogramming: An intr oduction , volume 1. Morgan Kaufmann San Francisco, 1998. G. Bingham, W . Macke, and R. Miikkulainen. Evolutionary optimization of deep learning activ ation functions. In Pr oceedings of the Genetic and Evolutionary Computation Confer ence , 2020. J. Chisholm. Rational approximants defined from double power series. Mathematics of Computation , 27(124):841–848, 1973. T . DeVries and G. W . T aylor . Improv ed regularization of con volutional neural networks with cutout. arXiv pr eprint arXiv:1708.04552 , 2017. H. Dong, S. Y u, C. W u, and Y . Guo. Semantic image synthesis via adversarial learning. In Pr oceedings of the IEEE International Confer ence on Computer V ision (ICCV) , pp. 5706–5714, 2017. T . Elsken, J. H. Metzen, and F . Hutter . Neural architecture search: A survey . J ournal of Machine Learning Resear ch , 20(55):1–21, 2019. J. B. Fourier . La théorie analytique de la chaleur . Mémoires de l’Académie Royale des Sciences de l’Institut de F rance , 8:581–622, 1829. R. Gao and K. Grauman. 2.5D visual sound. In Pr oceedings of the IEEE Confer ence on Computer V ision and P attern Recognition (CVPR) , pp. 324–333, 2019. A. S. Golatkar , A. Achille, and S. Soatto. T ime matters in regularizing deep networks: W eight decay and data augmentation affect early learning dynamics, matter little near conv ergence. In Advances in Neural Information Pr ocessing Systems 32 , pp. 10677–10687, 2019. S. Gonzalez and R. Miikkulainen. Improv ed training speed, accuracy , and data utilization through loss function optimization. In Pr oceedings of the IEEE Congr ess on Evolutionary Computation (CEC) , 2020. S. Gonzalez, J. Landgraf, and R. Miikkulainen. Faster training by selecting samples using embeddings. In 2019 International Joint Confer ence on Neural Networks (IJCNN) , 2019. P . Graves-Morris. The numerical calculation of Padé approximants. In Padé appr oximation and its applications , pp. 231–245. Springer , 1979. P . Graves-Morris and D. Roberts. Calculation of Canterbury approximants. Computer Physics Communications , 10(4):234–244, 1975. J. J. Grefenstette and J. M. Fitzpatrick. Genetic search with approximate function ev aluations. In Pr oceedings of an International Confer ence on Genetic Algorithms and Their Applications , pp. 112–120, 1985. N. Hansen and S. Kern. Evaluating the CMA evolution strategy on multimodal test functions. In International Confer ence on P arallel Pr oblem Solving fr om Natur e , pp. 282–291. Springer, 2004. N. Hansen and A. Ostermeier . Adapting arbitrary normal mutation distrib utions in ev olution strate gies: The cov ariance matrix adaptation. In Pr oceedings of IEEE international conference on evolutionary computation , pp. 312–317. IEEE, 1996. N. Hansen and A. Ostermeier . Completely derandomized self-adaptation in evolution strategies. Evolutionary computation , 9(2):159–195, 2001. 9 Under revie w as a conference paper at ICLR 2021 K. He, X. Zhang, S. Ren, and J. Sun. Identity mappings in deep residual networks. In European confer ence on computer vision , pp. 630–645. Springer , 2016a. K. He, X. Zhang, S. Ren, and J. Sun. Deep residual learning for image recognition. Pr oceedings of the IEEE Confer ence on Computer V ision and P attern Recognition (CVPR) , pp. 770–778, 2016b. G. E. Hinton, N. Sriv astav a, A. Krizhevsky , I. Sutske ver , and R. R. Salakhutdinov . Impro ving neural networks by pre venting co-adaptation of feature detectors. arXiv pr eprint arXiv:1207.0580 , 2012. P . J. Huber . Robust estimation of a location parameter . The Annals of Mathematical Statistics , pp. 73–101, 1964. Y . Jin. Surrogate-assisted e volutionary computation: Recent advances and future challenges. Swarm and Evolutionary Computation , 1:61–70, 06 2011. doi: 10.1016/j.swevo.2011.05.001. N. S. K eskar, D. Mudigere, J. Nocedal, M. Smelyanskiy , and P . T . P . T ang. On lar ge-batch training for deep learning: Generalization gap and sharp minima. In Pr oceedings of the F ifth International Confer ence on Learning Representations (ICLR) , 2017. D. Kingma and M. W elling. Auto-encoding variational Bayes. In Pr oceedings of the Second International Confer ence on Learning Representations (ICLR) , 12 2014. A. Krizhevsk y and G. Hinton. Learning multiple layers of features from tiny images. 2009. A. Krizhe vsky , I. Sutske ver , and G. E. Hinton. ImageNet classification with deep con- volutional neural networks. In F . Pereira, C. J. C. Burges, L. Bottou, and K. Q. W einberger (eds.), Advances in Neural Information Pr ocessing Systems 25 , pp. 1097– 1105. Curran Associates, Inc., 2012. URL http://papers.nips.cc/paper/ 4824- imagenet- classification- with- deep- convolutional- neural- networks. pdf . Y . LeCun, C. Cortes, and C. Burges. The MNIST dataset of handwritten digits, 1998. C. Lemke, M. Budka, and B. Gabrys. Metalearning: a survey of trends and technologies. Artificial Intelligence Revie w , 44(1):117–130, 2015. H. Li, Z. Xu, G. T aylor, C. Studer , and T . Goldstein. V isualizing the loss landscape of neural nets. In S. Bengio, H. W allach, H. Larochelle, K. Grauman, N. Cesa- Bianchi, and R. Garnett (eds.), Advances in Neural Information Processing Systems 31 , pp. 6389–6399. Curran Associates, Inc., 2018. URL http://papers.nips.cc/paper/ 7875- visualizing- the- loss- landscape- of- neural- nets.pdf . L. v . d. Maaten and G. Hinton. V isualizing data using t-SNE. Journal of Mac hine Learning Researc h , 9(Nov):2579–2605, 2008. R. Miikkulainen, J. Liang, E. Meyerson, A. Rawal, D. Fink, O. Francon, B. Raju, H. Shahrzad, A. Navruzyan, N. Duf fy , et al. Evolving deep neural networks. In Artificial Intelligence in the Age of Neural Networks and Br ain Computing , pp. 293–312. Elsevier , 2019. Y . Netzer , T . W ang, A. Coates, A. Bissacco, B. W u, and A. Y . Ng. Reading digits in natural images with unsupervised feature learning. Neural Information Pr ocessing Systems, W orkshop on Deep Learning and Unsupervised F eatur e Learning , 2011. E. Real, C. Liang, D. R. So, and Q. V . Le. Automl-zero: Evolving machine learning algorithms from scratch. , 2020. D. E. Rumelhart, G. E. Hinton, and R. J. Williams. Learning internal representations by error propagation. T echnical report, California Univ San Diego La Jolla Inst for Cognitiv e Science, 1985. L. Sagun, U. Evci, V . U. Guney , Y . Dauphin, and L. Bottou. Empirical analysis of the Hessian of ov er-parametrized neural networks. arXiv preprint , 2017. J. Schmidhuber . Evolutionary principles in self-refer ential learning, or on learning how to learn: the meta-meta-... hook . PhD thesis, T echnische Univ ersität München, 1987. 10 Under revie w as a conference paper at ICLR 2021 L. N. Smith. Cyclical learning rates for training neural networks. In 2017 IEEE W inter Conference on Applications of Computer V ision (W A CV) , pp. 464–472. IEEE, 2017. J. T . Springenberg, A. Doso vitskiy , T . Brox, and M. A. Riedmiller . Striving for simplicity: The all con volutional net. CoRR , abs/1412.6806, 2015. C. Szegedy , W . Liu, Y . Jia, P . Sermanet, S. Reed, D. Anguelov , D. Erhan, V . V anhoucke, and A. Rabinovich. Going deeper with con volutions. In Pr oceedings of the IEEE confer ence on computer vision and pattern r ecognition , pp. 1–9, 2015. B. T aylor . Methodus incr ementorum directa & in versa. Auctor e Br ook T aylor , LL. D. & Re giae Societatis Secr etario . typis Pearsonianis: prostant apud Gul. Innys ad Insignia Principis, 1715. A. N. Tikhono v . Solution of incorrectly formulated problems and the regularization method. In Pr oceedings of the USSR Academy of Sciences , volume 4, pp. 1035–1038, 1963. H. W ilbraham. On a certain periodic function. The Cambridge and Dublin Mathematical Journal , 3: 198–201, 1848. S. Zagoruyko and N. K omodakis. W ide residual networks. arXiv preprint , 2016. Y . Zhou, C. Liu, and Y . Pan. Modelling sentence pairs with tree-structured attentive encoder . In Pr oceedings of the 26th International Confer ence on Computational Linguistics (COLING), T ec hnical P apers , pp. 2912–2922, 2016. A E X P E R I M E N TA L S E T U P The following subsections co ver specific experimental setup details. The three ev aluated datasets are detailed in how the y were used, along with implementation details. A . 1 M N I S T The first domain was MNIST Handwritten Digits, a widely used dataset where the goal is to classify 28 × 28 pixel images as one of ten digits. MNIST has 55,000 training samples, 5,000 validation samples, and 10,000 testing samples. The dataset is well understood and relativ ely quick to train, and forms a good foundation for understanding how T aylorGLO ev olves loss functions. The basic CNN architecture ev aluated in the GLO study (Gonzalez & Miikkulainen, 2020) can also be used to provide a direct point of comparison with prior work on MNIST . Importantly , this architecture includes a dropout layer (Hinton et al., 2012) for explicit regularization. As in GLO, training is based on stochastic gradient descent (SGD) with a batch size of 100, a learning rate of 0.01, and, unless otherwise specified, occurred ov er 20,000 steps. A . 2 C I FA R - 1 0 T o validate T aylorGLO in a more challenging context, the CIF AR-10 (Krizhevsk y & Hinton, 2009) dataset was used. It consists of small 32 × 32 pixel color photographs of objects in ten classes. CIF AR-10 traditionally consists of 50,000 training samples, and 10,000 testing samples; ho wever 5,000 samples from the training dataset were used for v alidation of candidates, resulting in 45,000 training samples. Models were trained with their respecti ve hyperparameters from the literature. Inputs were normalized by subtracting their mean pix el value and di viding by their pixel standard de viation. Standard data augmentation techniques consisting of random, horizontal flips and croppings with two pixel padding were applied during training. A . 3 S V H N The Street V ie w House Numbers (SVHN) (Netzer et al., 2011) dataset is another image classification domain that was used to ev aluate T aylorGLO, consisting of 32 × 32 pixel images of numerical 11 Under revie w as a conference paper at ICLR 2021 - 20 - 10 10 20 PC1 - 30 - 20 - 10 10 20 30 PC2 0 4 8 12 16 20 24 28 32 36 40 44 48 52 56 60 Generation Figure 7: A visualization of all T aylorGLO loss function candidates using t-SNE (Maaten & Hinton, 2008) on MNIST . Colors map to each candidate’ s generation. Loss function populations show an ev olutionary path and focus over time tow ards functions that perform well, consistent with the con vergence and settling in Figure 3. digits from Google Street V iew . SVHN consists of 73,257 training samples, 26,032 testing samples, and 531,131 supplementary , easier training samples. T o reduce computation costs, supplementary examples were not used during training; this fact explains why presented baselines may be lower than other SVHN baselines in the literature. Since a validation set is not in the standard splits, 26,032 samples from the training dataset were used for validation of candidates, resulting in 47,225 training samples. As with CIF AR-10, models were trained with their respectiv e hyperparameters from the literature and with the same data augmentation pipeline. A . 4 C A N D I D A T E E V A L U A T I O N D E TA I L S During candidate ev aluation, models were trained for 10% of a full training run on MNIST , equal to 2,000 steps (i.e., four epochs). An in-depth analysis on the technique’ s sensiti vity to training steps during candidate e valuation is provided in Appendix D—ov erall, the technique is robust e ven with few training steps. Howe ver , on more complex models with abrupt learning rate decay schedules, greater numbers of steps provide better fitness estimates. A . 5 I M P L E M E N TA T I O N D E TA I L S Due to the number of partial training sessions that are needed to e valuate T aylorGLO loss function candidates, training was distributed across the network to a cluster , composed of dedicated machines with NVIDIA GeForce GTX 1080T i GPUs. T raining itself w as implemented with T ensorFlow (Abadi et al., 2016) in Python. The primary components of T aylorGLO (i.e., the genetic algorithm and CMA- ES) were implemented in the Swift programming language which allows for easy parallelization. These components run centrally on one machine and asynchronously dispatch work to the cluster . T raining for each candidate was aborted and retried up to two additional times if validation accuracy was belo w 0.15 at the tenth epoch. This method helped reduce computation costs. B I L L U S T R A T I N G T H E E V O L U T I O N A RY P RO C E S S The T aylorGLO search process can be illustrated with t-SNE dimensionality reduction (Maaten & Hinton, 2008) on e very candidate loss function within a run (Figure 7). The initial points (i.e. loss functions) are initially widespread on the left side, but quickly migrate and spread to the right as CMA-ES explores the parameter space, and ev entually concentrate in a smaller region of dark red points. This pattern is consistent with the con vergence and settling in Figure 3. C T O P M N I S T L O S S F U N C T I O N The best loss function obtained from running T aylorGLO on MNIST was found in generation 74. This function, with parameters θ = h 11 . 9039 , − 4 . 0240 , 6 . 9796 , 8 . 5834 , − 1 . 6677 , 11 . 6064 , 12 . 6684 , 12 Under revie w as a conference paper at ICLR 2021 − 3 . 4674 i (rounded to four decimal-places), achiev ed a 2k-step validation accuracy of 0.9950 on its single ev aluation, higher than 0.9903 for the cross entropy loss. This loss function was a modest improv ement ov er the previous best loss function from generation 16, which had a validation accuracy of 0.9958. D M N I S T E V A L U A T I O N L E N G T H S E N S I T I V I T Y 200-step T aylorGLO is surprisingly resilient when e valuations during e volution are shortened to 200 steps (i.e., 0.4 epochs) of training. With so little training, returned accuracies are noisy and dependent on each individual network’ s particular random initialization. On a 60-generation run with 200-step ev aluations, the best ev olved loss function had a mean testing accuracy of 0.9946 across ten samples, with a standard de viation of 0.0016. While slightly lower , and significantly more variable, than the accuracy for the best loss function that w as found on the main 2,000-step run, the accuracy is still significantly higher than that of the cross-entropy baseline, with a p -value of 6 . 3 × 10 − 6 . This loss function was disco vered in generation 31, requiring 1,388.8 2,000-step-equi valent partial ev aluations. That is, e volution with 200-step partial ev aluations is over three-times less sample efficient than e volution with 2,000-step partial e valuations. 20,000-step On the other extreme, where e valuations consist of the same number of steps as a full training session, one would expect better loss functions to be disco vered, and more reliably , because the fitness estimates are less noisy . Surprisingly , that is not the case: The best loss function had a mean testing accuracy of 0.9945 across ten samples, with a standard deviation of 0.0015. While also slightly lo wer, and also significantly more v ariable, than the accuracy for the best loss function that was found on the main 2,000-step run, the accuracy is significantly higher than the cross-entropy baseline, with a p -v alue of 5 . 1 × 10 − 6 . This loss function was discov ered in generation 45, requiring 12,600 2,000-step-equiv alent partial ev aluations. That is, ev olution with 20,000-step full ev aluations is ov er 28-times less sample efficient than e volution with 2,000-step partial ev aluations. These results thus suggest that there is an optimal way to e valuate candidates during ev olution, resulting in lower computational cost and better loss functions. Notably , the best e volved loss functions from all three runs (i.e., 200-, 2,000-, and 20,000-step) have similar shapes, reinforcing the idea that partial-ev aluations can provide useful performance estimates. 13
Original Paper
Loading high-quality paper...
Comments & Academic Discussion
Loading comments...
Leave a Comment