Stacking Models for Nearly Optimal Link Prediction in Complex Networks
Most real-world networks are incompletely observed. Algorithms that can accurately predict which links are missing can dramatically speedup the collection of network data and improve the validity of network models. Many algorithms now exist for predi…
Authors: Amir Ghasemian, Homa Hosseinmardi, Aram Galstyan
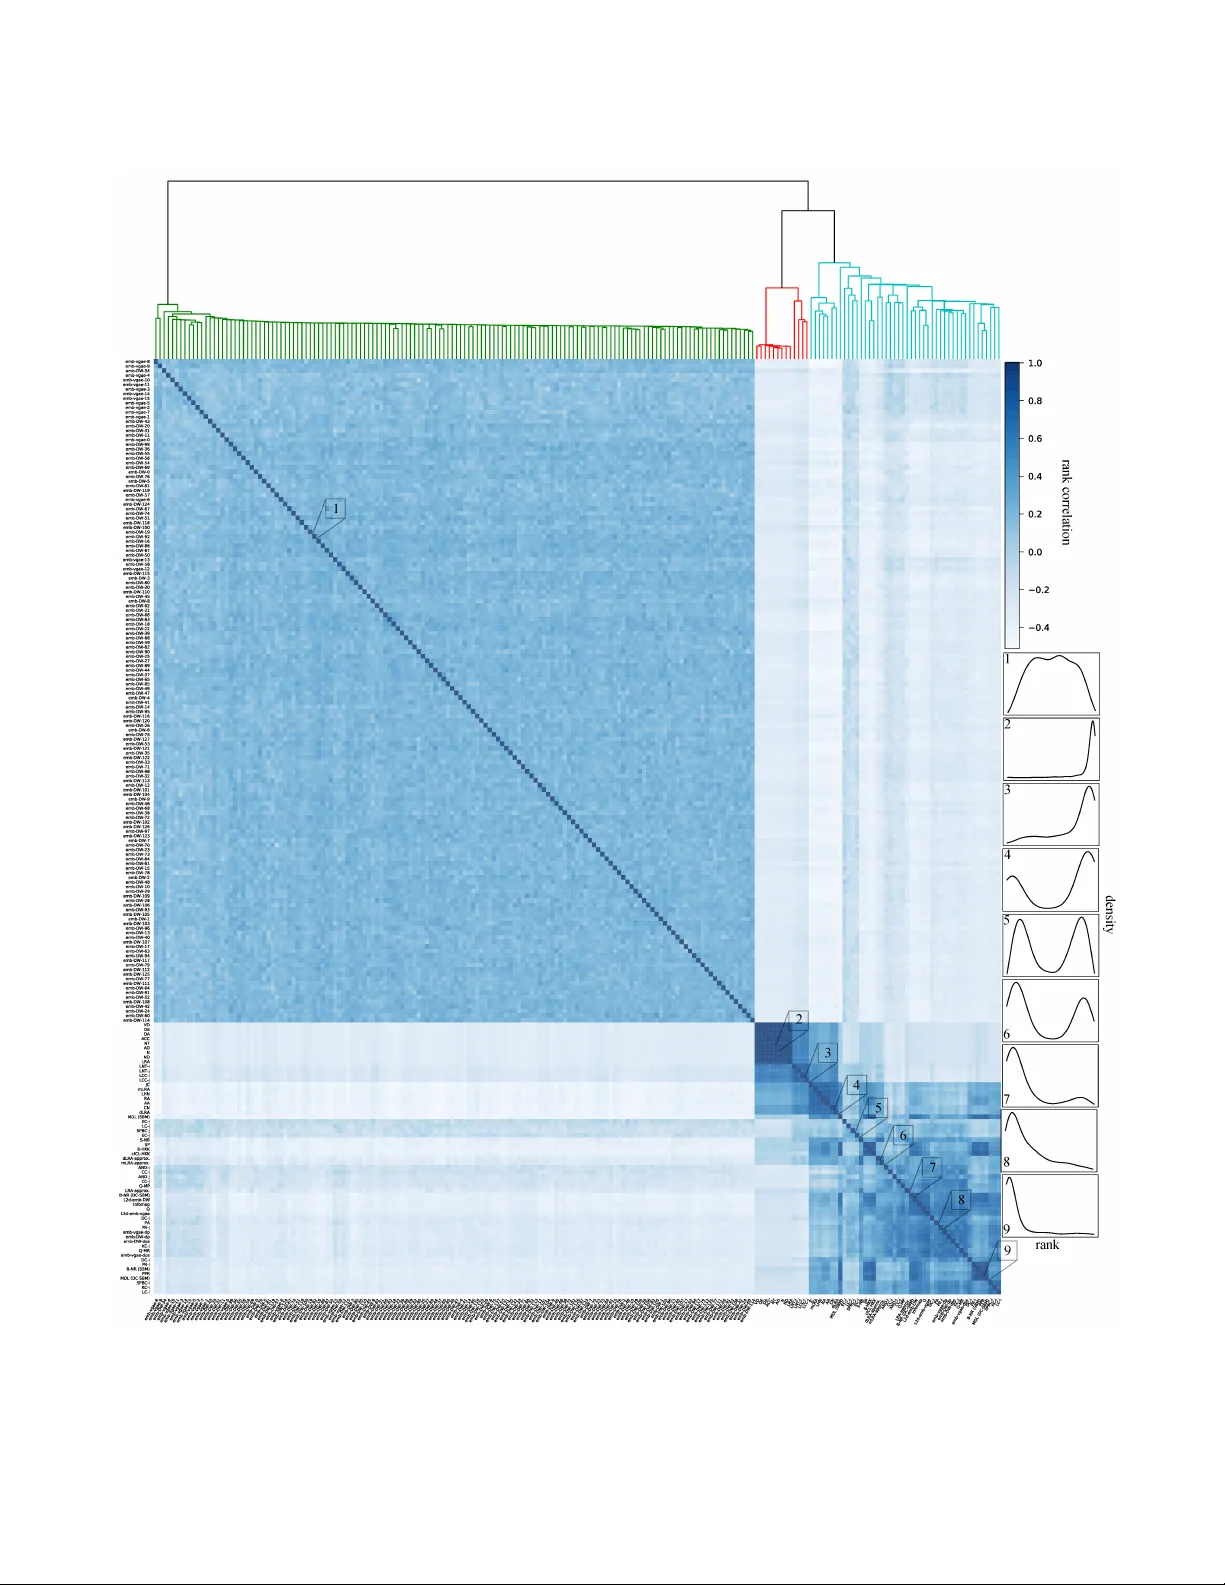
Stacking Mo dels fo r Nea rly Optimal Link Prediction in Complex Net w o rks Amir Ghasemian a,b,c , Homa Hosseinmardi b , Aram Galsty an b , Edoardo M. Air oldi c,d , and Aaron Clauset a,e,f a Depar tment of Computer Science, Univ ersity of Colorado , Boulder , CO 80309, USA; b Information Sciences Institute, Univ ersity of Southern California, Marina del Rey , CA 90292, USA; c Depar tment of Statistics, Harvard University , Cambridge, MA 02138, USA; d Depar tment of Statistical Science, F ox School of Business , T emple Univ ersity , Philadelphia, P A 19122, USA; e BioF rontiers Institute, Univ ersity of Colorado , Boulder , CO 80309, USA; f Santa Fe Institute , Santa Fe , NM 87501, USA Most real-world netw orks are incompletely observed. Algorithms that can accurately predict which links are missing can dramatically speedup the collection of network data and impr ove the v alidity of network models. Many algorithms no w exist f or predicting missing links, given a partially observed network, but it has remained un- known whether a single best predictor exists, how link predictabil- ity varies acr oss methods and netw orks fr om different domains, and how c lose to optimality current methods are. We answer these ques- tions by systematically evaluating 203 individual link predictor algo- rithms, representing three popular families of methods, applied to a large corpus of 548 structurally diverse networks from six scientific domains. W e first sho w that individual algorithms exhibit a broad diversity of prediction errors, such that no one predictor or family is best, or worst, across all realistic inputs. We then exploit this diver- sity via meta-learning to construct a series of “stacked” models that combine predictor s into a single algorithm. Applied to a br oad range of synthetic netw orks, for which we ma y analyticall y calculate opti- mal perf ormance, these stacked models achieve optimal or nearly optimal levels of accuracy . Applied to real-world networks, stacked models are also superior , but their accuracy v aries str ongly b y do- main, suggesting that link prediction ma y be fundamentally easier in social networks than in biological or technological networks. These results indicate that the state-of-the-art for link prediction comes from combining individual algorithms, which achieves nearly opti- mal predictions. We close with a brief discussion of limitations and opportunities for further improvement of these results. netw orks | link prediction | meta-learning | stacking | near optimalit y N et w orks provide a pow erful abstraction for representing the structure of complex social, biological, and tec hno- logical systems. Ho w ev er, data on most real-world net w orks is incomplete. F or instance, so cial connections among p eople ma y b e sampled, inten tionally hidden, or simply unobserv- able ( 1 , 2 ); in teractions among genes, or cells, or sp ecies m ust b e observed or inferred by exp ensive exp eriments ( 3 , 4 ); and, connections mediated b y a particular technology omit all off- platform interactions ( 2 , 5 ). The presence of such “missing links” can, dep ending on the research question, dramatically al- ter scientific conclusions when analyzing a net w ork’s structure or mo deling its dynamics. Metho ds that accurately predict whic h observ ed pairs of unconnected no des should, in fact, be connected hav e broad utilit y . F or instance, they can improv e the accuracy of pre- dictions of future netw ork structure and minimize the use of scarce exp erimental or net w ork measurement resources ( 6 , 7 ). Moreo v er, the task of link prediction itself has become a stan- dard for ev aluating and comparing models of netw ork struc- ture ( 8 , 9 ), playing a role in netw orks that is similar to that of cross-v alidation in traditional statistical learning ( 10 , 11 ). Hence, by helping to select more accurate net w ork mo dels ( 8 ), metho ds for link prediction can shed light on the organizing principles of complex systems of all kinds. But, predicting missing links is a statistically hard problem. Most real-world netw orks are relatively sparse, and the num b er of unconnected pairs in an observed netw ork—each a p otential missing link—grows quadratically , like O ( n 2 ) for a netw ork with n no des when the n um ber of connected pairs or edges m gro ws linearly , lik e O ( n ) . The probabilit y of correctly c hoosing b y chance a missing link is th us only O (1 /n ) —an impractically small c hance even for moderate-sized systems ( 12 ). Despite this baseline difficult y , a plethora of link prediction metho ds exist ( 3 , 13 , 14 ), em b o died b y the three main families w e study here: (i) topological methods ( 15 , 16 ), which utilize netw ork measures like no de degrees, the n um ber of common neigh bors, and the length of a shortest path; (ii) model-based methods ( 8 , 12 ), such as the stochastic block mo del, its v ariants, and other mo dels of comm unit y structure; and (iii) embedding metho ds ( 17 , 18 ), whic h pro ject a netw ork into a latent space and predict links based on the induced pro ximit y of its no des. A striking feature of this arra y of metho ds is that all ap- p ear to w ork relatively well ( 8 , 15 , 17 ). How ev er, systematic comparisons are lacking, particularly of methods drawn from differen t families, and most empirical ev aluations are based on relativ ely small num b ers of net w orks. As a result, the general accuracy of different metho ds remains unclear, and we do not kno w whether different metho ds, or families, are capturing the same underlying signatures of “missingness. ” F or instance, is there a single best method or family for all circumstances? If not, then how does missing link predictability v ary across metho ds and scien tific domains, e.g., in so cial versus biolog- ical netw orks, or across netw ork scales? And, how close to optimalit y are curren t metho ds? Here, we answ er these questions using a large corpus of 548 structurally and scientifically diverse real-world netw orks and 203 missing link predictors drawn from three large methodolog- ical families. First, we show that individual methods exploit differen t underlying signals of missingness, and, affirming the practical relev ance of the No F ree Lunch theorem ( 19 , 20 ), no metho d performs b est or w orst on all realistic inputs. W e then show that a meta-learning approac h ( 21 – 23 ) can exploit this diversit y of errors by “stacking” individual methods in to a single algorithm ( 24 ), whic h we argue mak es nearly optimal predictions of missing links. W e supp ort this claim with three lines of evidence: (i) ev aluations on syn thetic data with kno wn structure and optimal performance, (ii) tests using real-world net works across scientific domains and netw ork scales, and (iii) tests of sufficiency and saturation using subsets of metho ds. A cross these tests, mo del stacking is nearly alwa ys the b est metho d on held-out links, and nearly-optimal p erformance can be constructed using mo del-based methods, top ological metho ds, or a mixture of the t w o. F urthermore, w e find that 1 missing links are generally easiest to predict in so cial net w orks, where most methods p erform w ell, and hardest in biological and tec hnological netw orks. W e conclude by discussing lim- itations and opportunities for further improv emen t of these results. Methods and Materials As a general setting, w e imagine an unobserved simple net w ork G with a set of E pairwise connections among a set of V no des, with sizes m and n , resp ectively . Of these, a subset E 0 ⊂ E of connections is observ ed, chosen b y some function f . Our task is to accurately guess, based only on the pattern of observ ed edges E 0 , which unconnected pairs X = V × V − E 0 are in fact among the missing links Y = E − E 0 . A link prediction metho d defines a scor e function o v er these unconnected pairs i, j ∈ X so that b etter-scoring pairs are more likely to be missing links ( 15 ). In a supervised setting, the particular function that combines input predictors to pro duce a score is learned from the data.W e ev aluate the accuracy of such predictions using the standard A UC statistic, whic h provides a con text-agnostic measure of a metho d’s abilit y to distinguish a missing link i, j ∈ Y (a true positive) from a non-edge X − Y (a true negative) ( 12 ). Other accuracy measures may pro vide insigh t ab out a predictor’s p erformance in sp ecific settings, e.g., precision and recall at certain thresholds. W e leav e their in v estigation for future work. The most common approach to predict missing links con- structs a score function from net w ork statistics of eac h un- connected node pair ( 15 ). W e study 42 of these top ological predictors, which include predictions based on node degrees, common neighbors, random walks, no de and edge centrali- ties, among others (see SI App endix, T able S1 ). Models of large-scale netw ork structure are also commonly used for link prediction. W e study 11 of these mo del-based metho ds ( 8 ), whic h either estimate a parametric probability Pr ( i → j | θ ) that a node pair is connected ( 12 ), given a decomposition of a netw ork into communities, or predict a link as missing if it w ould impro ve a measure of communit y structure ( 15 ) (see SI App endix, T able S2 ). Close pro ximit y of an unconnected pair, after embedding a net w ork’s no des into a latent space, is a third common approac h to link prediction. W e study 150 of these embedding-based predictors, derived from tw o p opular graph embedding algorithms and six notions of distance or similarit y in the laten t space. In total, we consider 203 fea- tures of node pairs, some of which are the output of existing link prediction algorithms, while others are numerical features deriv ed from the net w ork structure. F or our purp oses, eac h is considered a missing link “predictor. ” A lengthier description of these 203 metho ds, and the three metho dological families they represent, is giv en in SI App endix, section A. Meta-learning techniques are a pow erful class of mac hine learning algorithms that can learn from data how to com- bine individual predictors in to a single, more accurate algo- rithm ( 22 , 25 ). Stack ed generalization ( 24 ) com bines predictors b y learning a sup ervised model of input query characteristics and the errors that individual predictors make. In this wa y , mo del “stac king” treats a set of predictors as a panel of ex- p erts, and learns the kinds of questions each is most expert at answ ering correctly . Stack ed models can thus b e strictly more accurate than their comp onent predictors ( 24 ), making them attractiv e for hard problems like link prediction ( 26 ), but only if those predictors make distinct errors and are sufficiently div erse in the signals they exploit. W e ev aluate individual prediction metho ds, and their stac k ed generalizations, using t w o types of net w ork data. The first is a set of synthetic netw orks with kno wn structure that v aries along three dimensions: (i) the degree distribution’s v ariability , b eing lo w (Poisson), medium (W eibull), or high (p o w er law); (ii) the num b er of “communities” or mo dules k ∈ { 1 , 2 , 4 , 16 , 32 } ; and (iii) the fuzziness of the corresponding comm unit y b oundaries , b eing lo w, medium, or high. These syn thetic netw orks thus range from homogeneous to heteroge- neous random graphs, from no modules to man y modules, and from weakly to strongly mo dular structure (see SI App endix, section B and T able S3 ). Moreo v er, b ecause the data generat- ing pro cess for these net w orks is kno wn, we exactly calculate the optimal accuracy that any link prediction method could ac hiev e, as a reference point (see SI App endix, section B). The second is a large corpus of 548 real-w orld netw orks. This structurally diverse corpus includes so cial (23%), biologi- cal (33%), economic (22%), tec hnological (12%), information (3%), and transportation (7%) netw orks ( 8 ), and spans three orders of magnitude in size (see SI Appendix, section C and Fig. S1 ). It is by far the largest and most div erse empirical b enc hmark of link prediction methods to date, and enables an assessmen t of ho w metho ds p erform across scien tific domains. Finally , our ev aluations assume a missingness function f that samples edges uniformly at random from E so that each edge ( i, j ) ∈ E is observed with probability α . This choice presen ts a hard test, as f is indep endent of b oth observed edges and metadata. Other mo dels of f , e.g., in which missingness correlates with edge or no de characteristics, may b etter capture particular scientific settings and are left for future w ork. Our results thus pro vide a general, application-agnostic assessment of link predictability and metho d p erformance. In cases of sup ervised learning, we train a method using 5-fold cross v alidation b y choosing as p ositive examples a subset of edges E 00 ⊂ E 0 according to the same missingness model f , along with all observed non-edges V × V − E 0 as negativ e examples (see SI App endix, section D). Unless other sp ecified, results reflect a c hoice of α = 0 . 8 , i.e., 20% of edges are unobserved (holdout set); other v alues pro duce qualitatively similar results. Results Prediction Error Diver sity . If all link predictors exploit a com- mon underlying signal of missingness, then one or a few pre- dictors will consistently p erform b est across realistic inputs. Optimal link prediction could then b e obtained by further lev eraging this universal signal. In contrast, if differen t pre- dictors exploit distinct signals, they will exhibit a diversit y of errors in the form of heterogenous p erformance across inputs, In this case, there will be no best or w orst metho d o v erall, and optimal link predictions can only be obtained by com bining m ultiple metho ds. This dichotom y also holds at the level of predictor families, one of which could b e b est ov erall, e.g., top ological metho ds, ev en if no one family member is b est. T o distinguish these p ossibilities, w e characterize the empir- ical distribution of errors b y training a random forest classifier o ver the 203 link predictors applied to each of the 548 real- w orld netw orks and separately to all net w orks in each of the six scientific domains within our corpus (see SI Appendix sec- tion E). In this setting, the character of a predictor’s errors 2 Ghasemian et al. Fig. 1. The Gini importances for predicting missing links in networks within each of six scientific domains, f or the 29 most important predictors, grouped by f amily , under a random f orest classifier trained o ver all 203 predictors . Across domains, predictors e xhibit widely diff erent lev els of importance, indicating a diversity of errors, such that no predictor is best ov erall. Here, topological predictors include shortest-path betweenness centrality (SPBC), common neighbors (CN), Leicht-Holme-Newman inde x (LHN), personalized page rank (PPR), shortest path (SP), the mean neighbor entries within a low rank appro ximation (mLRA), J accard coefficient (JC), and the Adamic-Adar inde x (AA); embedding predictors include the L2 distance between embedded vectors under emb-D W ( L2d-emb-D W ), and the dot product ( emb-vgae-dp ) of embedded vectors under emb-vgae ; and, model-based predictors include Inf omap (Inf omap), stochastic b lock models with ( MDL (DC-SBM), B-NR (DC-SBM) ) and without degree corrections (MDL (SBM), B-NR (SBM)), and modularity (Q). (A complete list of abbreviations is giv en in SI Appendix, Section A.) is captured by its learned Gini imp ortance (mean decrease in impurity) ( 11 ) within the random forest: the higher the Gini imp ortance, the more generally useful the predictor is for correctly identifying missing links on that netw ork or that domain. If all metho ds exploit a common missingness signal (one method to rule them all), the same few predictors or pre- dictor family will be assigned consistently greater imp ortance across netw orks and domains. How ev er, if there are multiple distinct signals (a div ersit y of errors), the learned importances will b e highly heterogeneous across inputs, and no predictor or family will b e best. A cross netw orks and domains, we find wide v ariation in b oth individual and family-wise predictor imp ortances, such that no individual metho d and no family of metho ds is best, or worst, on all net w orks. On individual netw orks, predictor imp ortances tend to b e highly skew ed, suc h that a relatively small subset of predictors accoun t for the ma jority of predic- tion accuracy (SI App endix, T able S4 and Fig. S2 ). How ev er, the precise comp osition of this subset v aries widely across b oth netw orks and families (SI Appendix, T ables S4 – S5 , and Figs. S3 – S4 ), implying a broad diversit y of errors and multi- ple distinct signals of missingness. At the same time, not all predictors p erform well on realistic inputs, e.g., a subset of top ological methods generally receiv e lo w imp ortances, and most embedding-based predictors are typically mediocre. Nev- ertheless, eac h family con tains some mem b ers that are rank ed among the most important predictors for many , but not all, net w orks. A cross domains, predictor imp ortances cluster in in terest- ing wa ys, such that some individual and some families of predictors p erform better on specific domains. F or instance, examining the 10 most-important predictors by domain (29 unique predictors; Fig. 1 ), w e find that topological methods, suc h as those based on common neigh b ors or localized random w alks, p erform well on social net w orks but less well on net- w orks from other domains. In con trast, mo del-based metho ds p erform relativ ely well across domains, but often p erform less w ell on so cial net w orks than do top ological measures and some em b edding-based methods. T ogether, these results indicate that predictor metho ds exhibit a broad div ersit y of errors, whic h tend correlate somewhat with scientific domain. This p erformance heterogeneit y highlights the practical relev ance to link prediction of the general No F ree Lunc h the- orem ( 19 ), which prov es that across all possible inputs, every mac hine learning method has the same av erage p erformance, and hence accuracy m ust b e assessed on a per dataset basis. The observed dive rsity of errors indicates that none of the 203 individual predictors is a universally-best method for the subset of all inputs that are realistic. How ev er, that div ersit y also implies that a nearly-optimal link prediction metho d for realistic inputs could be constructed by combining individual metho ds so that the b est individual method is applied for eac h giv en input. Suc h a meta-learning algorithm cannot circum- v en t the No F ree Lunch theorem, but it can ac hiev e optimal p erformance on realistic inputs by effectiv ely redistributing its worse-than-a verage p erformance onto unrealistic inputs, whic h are unlikely to be encountered in practice. In the fol- lo wing sections, w e develop and inv estigate the near-optimal p erformance of suc h an algorithm. Stacking on Networks with Known Structure. Mo del “stack- ing” is a meta-learning approach that learns to apply the b est individual predictor according to the input’s characteris- tics ( 24 ). Here, w e assess the accuracy of mo del stacking b oth within and across families of prediction methods, whic h adds sev en more prediction algorithms to our ev aluation set. Because the optimality of an algorithm’s predictions can only be assessed when the underlying data generating pro cess is kno wn, we first c haracterize the accuracy of mo del stac king using synthetic netw orks with kno wn structure, for which we calculate an exact upp er b ound on link prediction accuracy (see SI App endix, section B). T o provide a broad range of realistic v ariation in these tests, we use a structured random graph mo del, in which w e systematically v ary its degree distribution’s Ghasemian et al. 3 t h e or e t i c al u p p e r b ou n d on A U C Fig. 2. (A) On synthetic networks, the mean link prediction performance (A UC) of selected individual predictors and all stacked algorithms across three forms of structural variability: (left to right, by subpanel) degree distribution v ariability , from low (P oisson) to high (power la w); (top to bottom, by subpanel) fuzziness of community boundaries, ranging from low to high ( = m out /m in , the fraction of a node’ s edges that connect outside its community); and (left to right, within subpanel) the number of communities k . Across settings, the dashed line represents the theoretical maximum performance achievab le by any link prediction algor ithm (SI Appendix, section B). In each instance, stack ed models perform optimally or nearly optimally , and generally perform better when networks exhibit heavier-tailed degree distributions and more communities with distinct boundaries. T able S11 lists the top five topological predictors f or each synthetic network setting, which vary considerably . (B) On real-world networks, the mean link prediction performance for the same predictors across all domains , and by individual domain. Both overall and within each domain, stack ed models, particularly the across-family versions , exhibit superior performance, and they achie v e nearly perfect accuracy on social networks. The performance, howe ver , varies considerably across domains, with biological and technological networks exhibiting the lo west link predictability . Due to space limitations here, more complete results for individual topological and model-based predictors are shown in SI Appendix, Figs. S8 and S9, respectiv ely . v ariance, the num b er of communities k , and the fuzziness of those communit y b oundaries . A cross these structural v ariables, the upp er limit on link predictabilit y v aries considerably (Fig. 2 A), from no b etter than chance in a simple random graph ( k = 1 ; Poisson) to nearly p erfect in net w orks with many distinct communities and a pow er-la w degree distribution. Predictability is gener- ally low er (no metho ds can do w ell) with fewer communities (lo w k ) or with more fuzzy b oundaries (high ), but higher with increasing v ariance in the degree distribution (W eibull or p o w er law). Most methods, whether stac k ed or not, p erform relativ ely w ell when predictabilit y is lo w. Ho wev er, as p o- ten tial predictability increases, methods exhibit considerable disp ersion in their accuracy , particularly among top ological and embedding-based methods. Regardless of the synthetic netw ork’s structure, ho w ev er, w e find that stacking metho ds are t ypically among the most accurate prediction algorithms, and they often achiev e optimal or nearly-optimal prediction accuracy (Fig. 2 A). F or instance, the b est mo del stacking metho d exhibits a substantially smaller gap b etw een practical and optimal p erformance (all top ol., mo del & embed., ∆ A UC = 0 . 04 ; SI App endix, T able S8 ) than the b est individual predictor (MDL (DC-SBM), ∆ A UC = 0 . 07 ; SI App endix, T able S9 ), and is far b etter than the av erage non- stac ked topological and mo del-based methods ( h ∆ A UC i = 0 . 23 ; SI App endix, T able S8 ). Moreov er, in all structural settings, stacking across families tends to pro duce slightly more accurate predictions ( h A UC i = 0 . 83 ; SI App endix, T able S10 ) than stacking within families ( h A UC i = 0 . 80 ), and only one stac ked mo del (all embed.) is less accurate than the best individual predictor (marginally , with ∆ A UC = 0 . 01 , and T able S10 ). Stacking on Real-world Networks. T o c haracterize the real- w orld accuracy of mo del stacking, we apply these methods, along with the individual predictors, to our corpus of 548 struc- turally diverse real-w orld netw orks. W e analyze the results b oth within and across scientific domains, and as a function of netw ork size. Both across all netw orks, and within individual domains, mo del stacking metho ds pro duce the most accurate predictions of missing links (Fig. 2 B and T able 1 ), and some individual predictors perform relatively w ell, particularly model-based ones. Applied to all net works, the b est model-stacking metho d ac hieves sligh tly b etter a v erage p erformance (all topol. & mo del, h A UC i = 0 . 87 ± 0 . 10 ) than the b est individual metho d (MDL (DC-SBM), h A UC i = 0 . 84 ± 0 . 10 ), and far b etter perfor- mance than the av erage individual top ological or model-based predictor ( h A UC i = 0 . 63 ; and see T ables 1 and S6 ). How ev er, mo del stacking also ac hiev es substantially b etter precision in its predictions (T able 1 ), which can be a desirable property in practice. W e note that these stacking results were obtained b y optimizing the standard F measure to choose the random forest’s parameters. Alternatively , w e may optimize the AUC 4 Ghasemian et al. T able 1. Link prediction performance (mean ± std. err .), measured by A UC, precision, and recall, f or link prediction algorithms applied to the 548 structurally diverse netw orks in our corpus. algorithm A UC precision recall Q 0 . 7 ± 0 . 14 0 . 14 ± 0 . 17 0 . 67 ± 0 . 15 Q-MR 0 . 67 ± 0 . 15 0 . 12 ± 0 . 17 0 . 63 ± 0 . 13 Q-MP 0 . 64 ± 0 . 15 0 . 09 ± 0 . 11 0 . 59 ± 0 . 17 B-NR (SBM) 0 . 81 ± 0 . 13 0 . 13 ± 0 . 12 0 . 65 ± 0 . 22 B-NR (DC-SBM) 0 . 7 ± 0 . 2 0 . 12 ± 0 . 12 0 . 61 ± 0 . 24 cICL-HKK 0 . 79 ± 0 . 13 0 . 14 ± 0 . 14 0 . 58 ± 0 . 25 B-HKK 0 . 77 ± 0 . 13 0 . 11 ± 0 . 1 0 . 51 ± 0 . 26 Infomap 0 . 73 ± 0 . 14 0 . 12 ± 0 . 12 0 . 68 ± 0 . 13 MDL (SBM) 0 . 79 ± 0 . 15 0 . 14 ± 0 . 13 0 . 57 ± 0 . 3 MDL (DC-SBM) 0 . 84 ± 0 . 1 0 . 13 ± 0 . 11 0 . 78 ± 0 . 12 S-NB 0 . 71 ± 0 . 19 0 . 12 ± 0 . 13 0 . 66 ± 0 . 17 mean model-based 0 . 74 ± 0 . 16 0 . 12 ± 0 . 13 0 . 63 ± 0 . 21 mean indiv . topol. 0 . 6 ± 0 . 13 0 . 09 ± 0 . 16 0 . 53 ± 0 . 35 mean indiv . topol. & model 0 . 63 ± 0 . 15 0 . 09 ± 0 . 16 0 . 55 ± 0 . 33 emb-D W 0 . 63 ± 0 . 23 0 . 17 ± 0 . 19 0 . 42 ± 0 . 35 emb-vgae 0 . 69 ± 0 . 19 0 . 05 ± 0 . 05 0 . 69 ± 0 . 21 all topol. 0 . 86 ± 0 . 11 0 . 42 ± 0 . 33 0 . 44 ± 0 . 32 all model-based 0 . 83 ± 0 . 12 0 . 39 ± 0 . 34 0 . 3 ± 0 . 29 all embed. 0 . 77 ± 0 . 16 0 . 32 ± 0 . 32 0 . 32 ± 0 . 31 all topol. & model 0 . 87 ± 0 . 1 0 . 48 ± 0 . 36 0 . 35 ± 0 . 35 all topol. & embed. 0 . 84 ± 0 . 13 0 . 4 ± 0 . 34 0 . 39 ± 0 . 33 all model & embed. 0 . 84 ± 0 . 13 0 . 36 ± 0 . 32 0 . 36 ± 0 . 31 all topol., model & embed. 0 . 85 ± 0 . 14 0 . 42 ± 0 . 34 0 . 39 ± 0 . 33 itself, which pro duces similar results, but with slightly low er precisions in exchange for slightly higher AUC scores (see T able S18 ). Among the stac k ed mo dels, the highest accuracy on real- w orld net works is achiev ed by stacking mo del-based and top o- logical predictor families. Adding embedding-based predictors do es not significantly improv e accuracy , suggesting that the net w ork embeddings do not capture more structural informa- tion than is represented b y the model-based and topological families. This b ehavior aligns with our results on synthetic net w orks ab o v e, where the p erformances of stacking all predic- tors and stac king only model-based and top ological predictors w ere nearly iden tical (SI Appendix, T ables S8 and S9 ). Applied to individual scientific domains, w e find consider- able v ariation in missing link predictability , which we take to b e approximated by the most-accurate stack ed mo del (Fig. 2 B). In particular, most predictors, b oth stack ed and individual (SI App endix, Figs. S8 and S9 ), p erform well on so cial net- w orks, and on these netw orks, mo del stacking achiev es nearly p erfect link prediction (up to A UC = 0 . 98 ± 0 . 06 ; T able S12 ). In contrast, this upp er limit is substantially low er in non- so cial domains, being lo w est for biological and technological net works ( A UC = 0 . 83 ± 0 . 10 ; T ables S13 and S15 ), while marginally higher for economic and information net w orks (A UC = 0 . 88 ± 0 . 10 ; SI App endix, T ables S14 and S16 ). Stac ked models also exhibit superior performance on link prediction across real-world netw orks of different scales (n um- b er of edges m ; Fig. 3 ), and generally exhibit more accurate predictions as netw ork size increases, where link prediction is inherently harder. W e note, ho w ev er, that on small net- w orks ( m < 200 ), an alternativ e algorithm based on a simple ma jorit y-v ote among model-based predictors slightly outper- Fig. 3. Mean link prediction performance (A UC) as a function of network size (n umber of edges m ) for stac ked models and select individual predictors , applied to 548 real- world networks. Generally , stacking topological predictors , model-based predictors , or both yields super ior performance, but especially on larger networks where link prediction is inherently more difficult. forms all stac king metho ds, but p erforms substan tially worse than the best stac k ed model on larger net w orks ( m > 1000 ). And, em b edding-based methods perform po orly at most scales, suggesting a tendency to ov erfit, although stacking within that family pro duces higher accuracies on larger net w orks, but still lo w er than other stack ed mo dels. Sufficiency and Optimality . In practice, the optimality of a meta-learning method can only be established indirectly , o v er a set of considered predictors applied to a sufficien tly diverse range of empirical tests cases ( 19 ). W e assess this indirect evidence for stac k ed link-prediction models through tw o nu- merical exp eriments. In the first, we consider ho w p erformance v aries as a func- tion of the num b er of predictors stac k ed, either within or across families. Evidence for optimality here appears as an early saturation, in whic h p erformance ac hiev es its maximum prior to the inclusion of all a v ailable individual predictors. This behavior w ould indicate that a subset of predictors is sufficien t to capture the same information as the total set. T o test for this early-saturation signature, w e first train a random forest classifier on all predictors in each of our stac k ed mo dels and calculate eac h predictor’s within-model Gini imp ortance. F or each stack ed mo del, w e then build a new sequence of sub- mo dels in whic h w e stack only the k most imp ortant predictors at a time and assess its performance on the test corpus. In eac h of the stack ed mo dels, performance exhibits a clas- sic saturation pattern: it increases quickly as the 10 most- imp ortan t predictors are included, and then stabilizes b y around 30 predictors (Fig. 4 and SI App endix, Fig. S5 ). Perfor- mance then degrades slightly b eyond 30–50 included predictors, Ghasemian et al. 5 Fig. 4. Mean link prediction perf ormance (A UC) as a function of the n umber of stack ed features , f or within- and across-f amily stack ed models, applied to 548 real- world networks. The shaded regions show the standard error , and the early saturation behavior (at between 10 and 50 predictors) indicates that a small subset of predictors is sufficient to capture the same information as the total set. suggesting a slight degree of ov erfitting in the full models. No- tably , eac h within and across family mo del exhibits a similar saturation curve, except for the em bedding-only model, whic h saturates early and at a low er lev el than other stac k ed models. This similar behavior suggests that these families of predictors are capturing similar missingness signals, despite their differ- en t underlying represen tations of the netw ork structure. As in other exp eriments, the best saturation behavior is ac hiev ed b y stacking mo del-based and top ological predictors. In the second, we ev aluate whether individual predictors represen t “weak” learners in the sense that their link-prediction p erformance is better than random. In general, we find that nearly all of the predictors satisfy this condition (SI App endix, Figs. S6 and S7 ), implying that they can b e combined ac- cording to the Adabo ost theorem to construct an optimal algorithm ( 27 ). Replacing the random forest algorithm within our stacking approach with a standard bo osting algorithm also pro duces nearly identical p erformance on our test corpus (see T ables S19 – S22 ). The similar p erformance betw een the t w o metho ds suggests that relativ ely little additional p erformance is lik ely p ossible using other meta-learning approac hes o v er the same set of predictors. Discussion Dev eloping more accurate metho ds for predicting missing links in net works w ould help reduce the use of scarce resources in collecting net w ork data, and would provide more pow erful to ols for ev aluating and comparing net w ork models of complex systems. The literature on such metho ds gives an unmistakable impression that most published algorithms pro duce reasonably accurate predictions. How ev er, relatively few of these studies presen t systematic comparisons across differen t families of metho ds and they typically draw their test cases from a narrow set of empirical netw orks, e.g., social netw orks. As a result, it has remained unkno wn whether a single b est predictor or family of predictors exists, how link predictability itself v aries across different metho ds and scientific domains, or how close to optimality current metho ds ma y b e. Our broad analysis of individual link prediction algorithms, represen ting three large and p opular families of such meth- o ds, applied to a large corpus of structurally diverse net w orks, sho ws definitively that common predictors in fact exhibit a broad diversit y of errors across realistic inputs (Fig. 1 and SI App endix, Fig. S2 ). Moreov er, this diversit y is such that no one predictor, and no family of predictors is ov erall b est, or w orst, in practice (SI App endix, T able S4 and Fig. S3 ). The common practice of ev aluating link prediction algorithms us- ing a relatively narrow range of test cases is thus problematic. The far broader range of empirical net w orks and algorithms considered here sho ws that, generally sp eaking, go o d perfor- mance on a few test cases does not generalize across inputs. The div ersit y of errors we find serv es to highlight the practical relev ance of the No F ree Lunc h theorem ( 19 ) for predicting missing links in complex netw orks, and suggests that opti- mal p erformance on realistic inputs may only b e ac hiev ed b y combining metho ds, e.g., via meta-learning, to construct an ensemble whose domain of b est performance matc hes the particular structural div ersit y of real-w orld netw orks. Mo del stacking is a popular meta-learning approach, and our results indicate that it can pro duce highly accurate pre- dictions of missing links b y com bining either topological pre- dictors alone, mo del-based predictors alone, or b oth. Applied to structurally div erse synthetic netw orks, for which we ma y calculate optimal performance, stac king achiev es optimal or near-optimal accuracy , and accuracy is generally closer to p er- fect when netw orks exhibit a highly v ariable degree distribution and/or many , structurally distinct comm unities (Fig. 2 A). Similarly , applied to empirical netw orks, stac king pro- duces more accurate predictions than any individual predictor (Fig. 2 B and T able 1 ), and these predictions app ear to b e nearly optimal, i.e., we find little evidence that further accu- racy can be achiev ed using this set of predictors (Fig. 4 ), even under alternativ e meta-learning approac hes. Of course, we cannot rule out the p ossibility that more accurate predictions o v erall could b e obtained b y incorp orating, within the stac k ed mo dels, specific new predictors or new families, if they pro vide b etter prediction co v erage of some subset of input net w orks than do the curren tly considered predictors. Given the div erse set of predictors and families considered here, this possibility seems unlikely without fundamen tally new ideas about how to represen t the structure of netw orks, and therefore also signals of missingness. A cross netw orks drawn from different scien tific domains, e.g., so cial vs. biological netw orks, w e find substantial v ariation in link predictor p erformance, both for individual predictors and for stac k ed mo dels. This heterogeneit y suggests that the basic task of link prediction may b e fundamen tally harder in some domains of net w orks than others. Most algorithms pro duce highly accurate predictions in social netw orks, which are stereotypically rich in triangles (lo cal clustering), exhibit broad degree distributions, and are comp osed of assortativ e comm unities, suggesting that link prediction in social netw orks ma y simply b e easier ( 28 ) than in non-social netw ork settings. In fact, stac ked mo dels achiev e nearly p erfect accuracy at distinguishing true p ositives (missing links) from true negatives (non-edges) in social net w orks (Fig. 2 B and SI Appendix, T able S12 ). An alternativ e interpretation of this difference is that the existing families of predictors exhibit some degree 6 Ghasemian et al. of selective inference, i.e., they work w ell on so cial net w orks b ecause so cial net w ork data is the most common inspiration and application for link prediction metho ds. Our results make it clear that dev eloping more accurate individual predictors for non-social netw orks, e.g., biological and informational net w orks, is an imp ortant direction of future work. Progress along these lines will help clarify whether link prediction is fundamen tally harder in non-so cial domains, and wh y . A cross our analyses, em bedding-based methods, whic h are instances of representation learning on netw orks, generally p erform more po orly than do either top ological or model- based predictors. This behavior is similar to recen t results in statistical forecasting, whic h found that neural netw ork and other machine learning methods p erform less well by them- selv es than when combined with other, conv entional statistical metho ds ( 29 , 30 ). A useful direction of future work on link pre- diction would sp ecifically inv estigate tuning embedding-based metho ds to perform better on the task of link prediction. Only strong theoretical guarantees, whic h currently seem out of reach, would allow us to say for certain whether the stac ked models presen ted here actually ac hieve the upper b ound on link prediction performance in complex net w orks. Ho w ev er, the evidence suggests that stacking achiev es nearly optimal p erformance across a wide v ariety of realistic inputs. It is lik ely that efforts to develop new individual link pre- diction algorithms will contin ue, and these efforts will b e esp ecially b eneficial in sp ecific application domains, e.g., pre- dicting missing links in genetic regulatory net w orks or in fo o d w ebs. Ev aluations of new predictors, how ev er, should be car- ried out in the con text of meta-learning, in order to assess whether they improv e the ov erall prediction co v erage embo d- ied by the state-of-the-art stack ed mo dels applied to realistic inputs. Similarly , these ev aluations should be conducted on a large and structurally div erse corpus of empirical net w orks, lik e the one considered here. More narro w ev aluations are un- lik ely to pro duce reliable estimates of predictor generalization. F ortunately , stac k ed mo dels can easily b e extended to incor- p orate any new predictors, as they are developed, providing an incremental path to w ard fully optimal predictions. A CKNO WLEDGMENTS. The authors thank Da vid W olp ert, Brendan T racey , and Cristopher Mo ore for helpful conv ersations, ackno wledge the BioF rontiers Computing Core at the Universit y of Colorado Boulder for providing High Performance Computing resources (NIH 1S10OD012300) supported by BioF rontiers IT, and thank the Information Sciences Institute at the Universit y of Southern California for hosting AGh during this pro ject. Fi- nancial support for this research was provided in part by Grant No. IIS-1452718 (AGh, A C) from the National Science F oun- dation. Data and co de for replication purposes are provided at [https://gith ub.com/Aghasemian/OptimalLinkPrediction]. 1. K ossinets G (2006) Effects of missing data in social networks. Social Networ ks 28(3):247– 268. 2. Fire M, et al. (2013) Computationally efficient link prediction in a variety of social networks. ACM T ransactions on Intelligent Systems and T echnology (TIST) 5(1):10. 3. Lü L, Zhou T (2011) Link prediction in complex networks: A survey . Physica A: statistical mechanics and its applications 390(6):1150–1170. 4. Nagarajan M, et al. (2015) Predicting future scientific discoveries based on a networked anal- ysis of the past literature in Proceedings of the 21th ACM SIGKDD International Conference on Knowledge Discov ery and Data Mining . (ACM), pp. 2019–2028. 5. Kane GC, Alavi M, Labianca GJ, Borgatti S (2014) What’s different about social media net- works? a framework and research agenda. MIS Quar terly 38(1):274–304. 6. Burgess M, Adar E, Cafarella M (2016) Link-prediction enhanced consensus cluster ing for complex networks. PLoS ONE 11(5):e0153384. 7. Mirshahvalad A, Lindholm J, Der len M, Rosvall M (2012) Significant communities in large sparse networks. PloS one 7(3):e33721. 8. Ghasemian A, Hosseinmardi H, Clauset A (2019) Evaluating o verfit and underfit in models of network community structure. IEEE T rans. Knowledge and Data Engineering (TKDE) . 9. V allès-Català T , P eixoto TP , Sales-Pardo M, Guimerà R (2018) Consistencies and incon- sistencies between model selection and link prediction in networks. Physical Review E 97(6):062316. 10. Arlot S, Celisse A, , et al. (2010) A survey of cross-v alidation procedures for model selection. Statistics Surveys 4:40–79. 11. Hastie T , Tibshirani R, Friedman J (2009) The elements of statistical lear ning: data mining, inference , and prediction . (New Y or k, NY : Springer). 12. Clauset A, Moore C , Newman MEJ (2008) Hierarchical structure and the prediction of missing links in networks. Nature 453(7191):98. 13. Martínez V , Berzal F , Cubero JC (2017) A survey of link prediction in complex networks. ACM Computing Surveys (CSUR) 49(4):69. 14. Al Hasan M, Zaki MJ (2011) A survey of link prediction in social networks in Social Network Data Analytics . (Springer), pp. 243–275. 15. Liben-Nowell D , Kleinberg J (2007) The link-prediction problem for social networks. Journal of the Association for Inf ormation Science and T echnology 58(7):1019–1031. 16. Zhou T , Lü L, Zhang YC (2009) Predicting missing links via local information. The European Physical Journal B 71(4):623–630. 17. Grov er A, Leskovec J (2016) node2vec: Scalab le feature lear ning for networks in Proceed- ings of the 22nd ACM SIGKDD International Conference on Knowledge Discovery and Data Mining . (ACM), pp . 855–864. 18. Cai H, Zheng VW , Chang KCC (2018) A comprehensive sur vey of graph embedding: Prob- lems, techniques, and applications. IEEE T ransactions on Knowledge and Data Engineering 30(9):1616–1637. 19. Wolpert DH, Macready WG (1997) No free lunch theorems for optimization. IEEE T ransac- tions on Evolutionary Computation 1(1):67–82. 20. P eel L, Larremore DB, Clauset A (2017) The ground truth about metadata and community detection in networks. Science Advances 3(5):e1602548. 21. Schapire RE (1990) The strength of weak learnability . Machine Lear ning 5(2):197–227. 22. Breiman L (1996) Bagging predictors. Machine Lear ning 24(2):123–140. 23. Srivastav a N, Hinton G, Krizhevsky A, Sutskev er I, Salakhutdinov R (2014) Dropout: a sim- ple way to prevent neural networks from overfitting. Journal of Machine Lear ning Research 15(1):1929–1958. 24. Wolpert DH (1992) Stacked gener alization. Neural Networks 5(2):241–259. 25. Schapire RE (1999) A brief introduction to boosting in Proceedings of the 16th Inter national Joint Conference on Ar tificial intelligence, V olume 2 . (Morgan Kaufmann Publishers Inc.), pp. 1401–1406. 26. K oren Y (2009) The BellKor solution to the Netflix Grand Prize. Netflix prize documentation 81 pp. 1–10. 27. F reund Y , Schapire RE (1997) A decision-theoretic generalization of on-line learning and an application to boosting. Journal of Computer and System Sciences 55:119–139. 28. Epasto A, Perozzi B (2019) Is a single embedding enough? Learning node representations that capture multiple social contexts in The World Wide Web Conference . (ACM), pp. 394– 404. 29. Makridakis S, Spiliotis E, Assimakopoulos V (2018) The M4 competition: Results, findings, conclusion and wa y forw ard. International Jour nal of Forecasting 34(4):802–808. 30. Makridakis S, Spiliotis E, Assimakopoulos V (2018) Statistical and machine learning forecast- ing methods: Concerns and ways forw ard. PLoS ONE 13(3):e0194889. 31. Newman M (2019) Networks . (Oxford University Press). 32. Cukierski W , Hamner B, Y ang B (2011) Graph-based features for supervised link prediction in Neural Networks (IJCNN), The 2011 International Joint Conference on . (IEEE), pp. 1237– 1244. 33. Hagberg A, Sw art P , S Chult D (2008) Exploring network structure, dynamics, and function us- ing networkx, (Los Alamos National Lab .(LANL), Los Alamos, NM (United States)), T echnical report. 34. Leicht EA, Holme P , Newman MEJ (2006) V ertex similarity in networks. Ph ysical Revie w E 73(2):026120. 35. Newman MEJ, Gir van M (2004) Finding and e v aluating community structure in networ ks. Phys . Rev . E 69(2):026113. 36. Newman MEJ (2016) Community detection in networks: Modular ity optimization and maxi- mum likelihood are equiv alent. . 37. Zhang P , Moore C (2014) Scalable detection of statistically significant communities and hier- archies, using message passing for modular ity . Proc. Natl. Acad. Sci. USA 111(51):18144– 18149. 38. Newman MEJ, Reiner t G (2016) Estimating the number of communities in a network. Phys. Rev . Lett. 117(7):078301. 39. Hay ashi K, K onishi T , Ka wamoto T (2016) A tractable fully Ba yesian method f or the stochastic block model. . 40. Rosvall M, Bergstrom CT (2008) Maps of random walks on complex networks rev eal commu- nity structure. Proc. Natl. Acad. Sci. USA 105(4):1118–1123. 41. P eixoto TP (2013) P arsimonious module inference in large networks. Phys . Rev . Lett. 110(14):148701. 42. Krzakala F , et al. (2013) Spectral Redemption in Clustering Sparse Networks. Proc. Natl. Acad. Sci. 110(52):20935–20940. 43. P erozzi B, Al-Rfou R, Skiena S (2014) Deepwalk: Online learning of social representations in Proceedings of the 20th ACM SIGKDD International Conference on Knowledge Disco very and Data Mining . (ACM), pp . 701–710. 44. Kipf TN, Welling M (2016) V ariational graph auto-encoders. preprint . 45. Hamilton WL, Ying R, Leskov ec J (2017) Representation lear ning on graphs: Methods and applications. preprint . 46. Dietterich T (2000) Ensemble methods in machine learning. Multiple Classifier Systems pp. 1–15. 47. Sewell M (2008) Ensemb le learning. RN 11(02). 48. Chen T , Guestr in C (2016) Xgboost: A scalable tree boosting system in Proceedings of the 22nd ACM SIGKDD International Conference on Knowledge Disco very and Data Mining . pp. Ghasemian et al. 7 785–794. 49. F reund Y , Schapire RE (1997) A decision-theoretic generalization of on-line learning and an application to boosting. Journal of computer and system sciences 55(1):119–139. 50. Karrer B , Ne wman MEJ (2011) Stochastic b lockmodels and community structure in networks. Physical re view E 83(1):016107. 51. Decelle A, Krzakala F , Moore C, Zdeborová L (2011) Asymptotic Analysis of the Stochas- tic Block Model for Modular Networks and Its Algorithmic Applications. Ph ys. Rev . E 84(6):066106. 52. Clauset A, T ucker E, Sainz M (2016) The Colorado Inde x of Complex Networks. (https://icon. colorado .edu/). 53. Al Hasan M, Chaoji V , Salem S, Zaki M (2006) Link prediction using supervised learning in SDM06: workshop on link analysis, counter-terrorism and security . 54. Ahmed C, ElK orany A, Bahgat R (2016) A super vised learning approach to link prediction in twitter . Social Network Analysis and Mining 6(1):24. 55. Lichtenwalter RN, Lussier JT , Chawla NV (2010) New perspectives and methods in link pre- diction in Proceedings of the 16th A CM SIGKDD inter national conference on Knowledge discovery and data mining . (ACM), pp . 243–252. 56. Cov er TM, Thomas JA (2012) Elements of inf ormation theor y . (John Wiley & Sons). Supporting Information 1. Methods for predicting missing links Here, w e describe in detail the three families of link predictors and their specific mem bers used in the analysis, including the abbreviations used in the main text. In addition, w e describ e in more detail the setup of the sup ervised stack ed generalization algorithm we use to combine individual predictors into a single algorithm. T opological predictors. T opological predictors are simple functions of the observ ed net w ork topology , e.g., coun ts of edges, measures of ov erlapping sets of neighbors, and measures derived from simple summarizations of the netw ork’s structure. W e consider 42 top o- logical predictors, whic h come in three t ypes: global, pairwise, and node-based. Within these groups, the “pairwise” predictors include a num ber of top ological features that are often used in the literature to directly predict missing links ( 15 ), e.g., the num ber of shared neighbors of i, j . A listing of all topological predictors is giv en in T able S1 , along with corresponding literature references. Glob al pr edictors. These predictors quantify v arious net w ork-lev el statistics and are inherited by each pair of no des i, j that is a candidate missing link. Their primary utilit y is to provide global context to other predictors under sup ervised learning. F or example, a predictor that performs well on small netw orks, but p o orly on larger netw orks, can b e employ ed appropriately under a supervised model when the global measure of the net w ork’s size is av ailable. Or, a large v ariance in the degree distribution would imply that a predictor based on degree product may be useful. Or, a large clustering coefficient would imply that an assortativ e community detection algorithm lik e modularity is likely to be useful. F or this reason, global predictors are not exp ected by themselv es to be accurate predictors of missing links (see Figs. S3 and S4 and T ables S6 and S7 ). These global predictors are generally useful in capturing missingness in unseen netw orks and not on the same netw ork link prediction experiments. These features help to learn from existing configurations in training netw orks and generalize them to unseen net w orks in experiments lik e Fig. 1 in the main text. The 8 global predictors are the n um ber of no des (N), num b er of observed edges (OE), av erage degree (AD), v ariance of the degree distribution (VD), net w ork diameter (ND), degree assortativity of graph (D A), netw ork transitivit y or clustering coefficient (NT), and av erage (lo cal) clustering co efficient (ACC) ( 14 , 15 , 31 , 32 ). Pairwise pr e dictors. These predictors are functions of the joint topological prop erties of the pair of nodes i, j being considered. The 14 pairwise predictors are the num ber of common neigh bors of i, j (CN), shortest path b etw een i, j (SP), Leich t-Holme-Newman index of neighbor sets of i, j (LHN), p ersonalized page rank (PPR), ∗ preferential attachmen t or degree pro duct of i, j (P A), Jaccard coefficient of the neighbor sets of i, j (JC), A damic-A dar index of ∗ By using a biased random walk we can find the personalized PageRank algorithm. This centrality could reflect the impor tance of nodes with respect to a biased set of specific nodes or a single spe- cific node. In this paper using personalized page rank we consider j -th entr y of the personalized page rank for node i as one of the edge-based features. i, j (AA), resource allocation index of i, j (RA), the en try i, j in a low rank approximation (LRA) via a singular v alue decomposition (SVD) (LRA), the dot product of the i, j columns in the LRA via SVD (dLRA), the mean of entries i and j ’s neigh bors in the LRA (mLRA), and simple appro ximations of the latter three predictors (LRA-approx, dLRA-approx, mLRA-appro x) ( 14 , 15 , 31 , 32 ). W e omit from consideration sev eral pairwise predictors found in the literature, e.g. edge b etw eenness cen trality , due to their large computational complexit y for an ev aluation as large as ours. No de-base d pr e dictors. These predictors are functions of the in- dependent top ological prop erties of the individual nodes i and j , and thus pro duce a pair of predictor v alues. Unlik e many of the pairwise predictors, which can b e used as standalone algorithms to predict missing links, these no de-based predictors do not directly score the likelihoo d that i, j is a missing link. Instead, the particular function that con v erts the pair of node-based predictors in to a score is learned within the supervised framework. The 20 node-based predictors are tw o instance each of the lo- cal clustering coefficient (LCC), av erage neighbor degree (AND), shortest-path betw eenness cen tralit y (SPBC), closeness centralit y (CC), degree centralit y (DC), eigenv ector cen trality (EC), Katz centralit y (KC), local num ber of triangles (LNT), P age rank (PR), and load cen tralit y (LC) ( 14 , 15 , 31 , 32 ). Model-based predictors. Model-based predictors are a broad class of prediction algorithms that rely on models of large-scale netw ork structure to score pairs i, j that are more or less likely to be missing. T o make link predictions, mo del-based algorithms employ one of tw o strategies: likelihood or optimization. In the first case, a method estimates a parametric probability Pr ( i → j | θ ) that a no de pair should be connected, given a decomp osition of a net w ork in to communities, as in the sto chastic block mo del and its v ariants. In the second it predicts a link as missing if it would improv e its measure of comm unit y structure, as in Infomap and mo dularity . W e consider 11 model-based predictors for missing links, whic h include many state-of-the-art in communit y detection algorithms ( 8 ), are sufficien tly scalable to be applied in an ev aluation as large as ours, and eac h of which has previously b een used as a standalone link prediction algorithm. A listing of all mo del-based predictors is given in T able S2 , along with the corresp onding literature references. F or the model-based predictors that mak e predictions b y likeli- hoo d, w e follow Ref. ( 8 ) to emplo y a “model-sp ecific” score function for each method. Under this approach, a particular method first decomposes the netw ork in to a set of comm unities using its cor- responding parametric mo del, and then extracts from that same parametric model a score Pr ( i → j | θ ) for eac h candidate pair i, j . See Ref. ( 8 ) for additional details. Embedding-based predictors. Embedding-based predictors are de- rived from graph embedding techniques, which attempt to automate the feature engineering phase of learning with graphs by pro jecting a netw ork’s no des into a relatively lo w-dimensional latent space, with the goal of locally preserving the no de neighborho o ds. Embedding- based predictors are th us either no de coordinates in suc h an em bed- ding, or measure of distance b etw een embedded pairs. W e consider a total of 150 em b edding-based predictors, all deriv ed from 2 p opular graph em bedding algorithms, DeepW alk (emb-DeepW alk) ( 43 )—a special case of no de2vec (em b-node2vec) ( 17 )—and the v ariational graph auto encoder (emb-vgae) ( 44 ). Using emb-DeepW alk and emb-vgae, we embed each netw ork into a 128-dimensional and 16-dimensional space, resp ectively . F or each pair of no des i, j , w e then apply a Hadamard product function to the corresp onding pair of co ordinates to obtain 144 link predictors as features for sup ervised learning ( 45 ). T o these, w e add 6 more predictors by applying, for each of the 2 em bedding metho ds, a different distance or similarity function to the corresponding pair of co ordinate vectors: an inner product, an inner pro duct with a sigmoid function, and Euclidean distance. Stacked generalization and meta-learning for link prediction. Meta- learning or ensem ble tec hniques are a p ow erful class of supervised machine learning algorithms that can learn from data ho w to combine individual predictors in to a single, more accurate algo- rithm ( 22 , 25 , 46 , 47 ). By treating the output of individual pre- diction algorithms as features of the input instances themselves, 8 Ghasemian et al. a supervised meta-learning algorithm can construct a correlation function that relates which individual algorithm is most accurate on which subset of inputs. Of the several approaches to meta- learning, w e fo cus on the approach of stacked generalization or model “stac king” ( 24 ), and we consider tw o b oosting approac hes (see below) as a robustness chec k. W e leav e further in v estigation of other meta-learning algorithms for future w ork. Stacking aims to minimize the generalization error of a set of component learners. In the classic setting, the t wo training levels can be summarized as follows. Given a dataset D = { ( y ` , x ` ) , ` ∈ { 1 , ..., L }} , where x ` is the feature vector of the ` -th example and y ` is its lab el, randomly split D into J “folds” appropriate for J -fold cross v alidation. Each fold j contributes once as a test set D j and the rest con tributes once as a training set D − j = D r D j . F or each base classifier r , where r ∈ { 1 , ..., R } , called a lev el- 0 generalizer, we fit it to the j th fold in the training set D − j to build a model M − j r , called a level- 0 mo del. Now for eac h data p oint x ` in the j th test set, we emplo y these lev el- 0 mo dels M − j r to predict the output z r` . The new data set D C V = { ( y ` , z 1 ` , ..., z R` ) , ` ∈ { 1 , ..., L }} , is now prepared for the next training level, called a level- 1 generalizer. In the second training phase, an algorithm learns a new model from this data, denoted as ˜ M . Now, w e again train the base classifiers using the whole data D , noted as M r , w e complete the training phase and the models are ready to classify a new data point x . The new data p oin t will first b e fed into the trained base classifiers M r and then the output of these lev el- 0 models will construct the input for the next lev el model ˜ M . In the net w ork setting of link prediction, the classifiers (predic- tors) in the first lev el are all unsup ervised, and therefore, w e alter the stac k ed generalization algorithm as follows to accoun t for this difference and to adapt it to a net w ork setting. F or a given net- work G = ( V , E ) , we sample the edges uniformly and construct the observed net work G 0 = ( V , E 0 ) , where | E | = α | E | ( α = 0 . 8 in our experiments). Here, we use only the uniform edge-remo v al model and lea v e the analysis of any non-uniform edge remo val mo del for future w ork. The remov ed edges E \ E 0 are considered as held-out data in the link prediction task. Then, in order to train a model, we remo ve 1 − α 0 ( α 0 = 0 . 8 in our experiments) of the edges as our positive examples and take all non-edges in the observed netw ork G 0 as negativ e examples. Although this pro cedure makes the negativ e samples noisy , since the net w orks are sparse, it in troduces a negligi- ble error in the learned mo del, and should not significantly effect the mo del’s p erformance. In our setting, the unsup ervised classifiers in the first lev el are our level- 0 predictors, and w e use the scores coming from these link prediction tec hniques as our meta features. The second training phase is conducted through sup ervised learning with 5 -fold cross v alidation on the training set. W e use a standard supervised random forest algorithm for the meta-learning step, and assess the learning process on 3 within-family models (topol. only , model-based only , and embed. only) and on 4 across-family mo dels (all families, and each of top ol. & mo del, top ol. & embed, and mo del & em bed.), for a total of 7 stac k ed models. Mo del sele ction. In order to choose the best parameters of the model using 5-fold cross v alidation, we can choose the parameters of the mo del through optimizing the A UC performance or the F measure. In the main text all figures and tables show results for a standard random forest with the parameters c hosen through F measure optimization and the results are rep orted on the test T able S1. Abbreviations and descriptions of 42 topological predictors, across three types: global predictors (7), which are functions of the entire network and whose utility is in providing context to other predictors; pairwise predictors (15), which are functions of the joint topological properties of the pair i, j ; and node-based predictors (20), whic h are functions of the independent topological properties of the nodes i and j , producing one value f or each node in the pair i, j . Abbre viation Description Global P airwise Node-based Ref. N number of nodes • ( 31 ) OE number of observed edges • ( 31 ) AD av erage degree • ( 31 ) VD variance of degree distribution • ( 31 ) ND network diameter • ( 31 ) D A degree assortativity of graph • ( 33 ) NT network transitivity (clustering coefficient) • ( 31 ) ACC av erage (local) clustering coefficient • ( 31 ) CN common neighbors of i, j • ( 15 ) SP shor test path between i, j • ( 15 ) LHN Leicht-Holme-Ne wman index of neighbor sets of i, j • ( 34 ) PPR j -th entr y of the personalized page rank of node i • ( 33 ) P A preferential attachment (deg ree product) of i, j • ( 15 ) JC J accard’ s coefficient of neighbor sets of i, j • ( 15 ) AA Adamic/Adar index of i, j • ( 15 ) RA resource allocation index of i, j • ( 33 ) LRA entry i, j in low rank appro ximation (LRA) via singular v alue decomposition (SVD) • ( 32 ) dLRA dot product of columns i and j in LRA via SVD for each pair of nodes i, j • ( 32 ) mLRA av erage of entries i and j ’ s neighbors in low rank approximation • ( 32 ) LRA-approx an approximation of LRA • ( 32 ) dLRA-approx an approximation of dLRA • ( 32 ) mLRA-approx an approximation of mLRA • ( 32 ) LCC i , LCC j local clustering coefficients for i and j • ( 33 ) AND i , AND j av erage neighbor degrees f or i and j • ( 33 ) SPBC i , SPBC j shor test-path betweenness centralities f or i and j • ( 33 ) CC i , CC j closeness centralities f or i and j • ( 33 ) DC i , DC j degree centralities f or i and j • ( 33 ) EC i , EC j eigenv ector centralities f or i and j • ( 33 ) KC i , KC j Katz centralities f or i and j • ( 33 ) LNT i , LNT j local number of triangles for i and j • ( 33 ) PR i , PR j P age rank v alues for i and j • ( 33 ) LC i , LC j load centralities f or i and j • ( 33 ) Ghasemian et al. 9 T able S2. Abbreviations and descriptions of 11 model-based predictors, across two types: likelihood predictors (7), which score eac h pair i, j according to a parametric model Pr ( i → j | θ ) learned by decomposing the network under a pr obabilistic generative model of netw ork structure such as the stochastic block model or its variants; and, optimization predictors (4), whic h score each pair i, j according to whether adding them would increase a corresponding (non-pr obabilistic) comm unity structure objective function, as in the Map Equation or the modularity function. Abbre viation Description Likelihood Optimization Ref . Q modularity , Newman-Girvan • ( 35 ) Q-MR modularity , Newman’ s multiresolution • ( 36 ) Q-MP modularity , message passing • ( 37 ) B-NR (SBM) Ba yesian stochastic block model, Ne wman and Reinert • ( 38 ) B-NR (DC-SBM) Bay esian degree-corrected stochastic b lock model, Ne wman and Reinert • ( 38 ) B-HKK (SBM) Bay esian stochastic bloc k model, Ha yashi, K onishi and Kawamoto • ( 39 ) cICL-HKK (SBM) Corrected integrated classification lik elihood, stochastic bloc k model • ( 39 ) Infomap Map equation • ( 40 ) MDL (SBM) Minimum description length, stochastic block model • ( 41 ) MDL (DC-SBM) Minimum description length, degree-corrected stochastic bloc k model • ( 41 ) S-NB Spectral with non-backtr acking matrix • ( 42 ) set. Results for, instead, optimizing using the AUC are giv en in T able S18 whic h can be compared with T able 1 in the main text. A lternative meta-learning algorithms. In addition to a standard ran- dom forest, w e also ev aluate tw o metho ds of b o osting, XGBoost ( 48 ) and A daBoost ( 49 ), for learning a single algorithm ov er the individ- ual predictors. The results from these meta-learning algorithms are provided in T ables S19 - S22 for differen t c hoices of model selection through A UC or F measure. 2. T ests on synthetic data W e evaluate individual predictors and their stack ed general- ization on a set of synthetic net w orks with known structure that v aries along three dimensions: (i) the degree distribution’s v ariabil- ity , being low (Poisson), medium (W eibull), or high (p ow er law); (ii) the num b er of “communities” or modules k ∈ { 1 , 2 , 4 , 16 , 32 } ; and (iii) the fuzziness of the corresponding communit y b oundaries = m out /m in , the fraction of a no de’s edges that connect out- side its comm unit y , being low, medium, or high. These synthetic netw orks thus range from homogeneous to heterogeneous random graphs (degree distribution), from no modules to many modules ( k ), and from weakly to strongly mo dular structure ( ). W e generate these net w orks using the degree-corrected stochas- tic block model (DC-SBM) ( 50 ), whic h allo ws us to systematically control each of these parameters to generate a synthetic net w ork. Moreov er, because b oth the data generating pro cess and the missing function f (here, uniform at random) are known, we ma y exactly calculate the theoretical upper limit that an y link prediction algo- rithm could ac hiev e for a giv en parameterization of the generative process. This upp er b ound provides an unambiguous reference p oint for ho w optimal an y particular link prediction algorithm is, and the three structural dimensions of the synthetic net w orks allo w us to extract some general insights as to what prop erties increase or decrease the predictabilit y of missing links. In this section, we first describe the generative processes, and then detail the calculations for optimal predictions. F or complete- ness, we first specify the mathematical forms of the W eibull and power-la w degree distributions used in some settings. The Pois- son distribution is fully specified by the choice of the mean degree parameter c . The W eibull distribution can b e written as f ( r ) = cr β − 1 e − λr β , [1] where the constan t c is the corresponding normalization constan t when r is the degree of a no de, and the parameters λ, β specify the shape of the distribution. When β < 1 , this distribution deca ys more slo wly than simple exponential, meaning it exhibits greater v ariance, but not as muc h v ariance as can a p ow er-la w distribution. See T able S3 for the particular v alues used in our synthetic data. The pow er-la w distribution can be written as f ( r ) = cr − γ , [2] where, again, c is the corresp onding normalization constant when r is the degree of a node, and γ is the “scaling” exponent that go v erns the shape of the distribution. When γ ∈ (2 , 3) , the mean is finite but the v ariance is infinite. See T able S3 for the particular v alues used in our syn thetic data. Generating synthetic networks. Although each type of synthetic net- work can be generated under the DC-SBM mo del, for some choices of the num b er of communities k and degree distribution, the gener- ative pro cess simplifies greatly . Below, w e describe the generation procedures for the synthetic netw orks according to the simplest generative mo del av ailable for a giv en c hoice of parameters, whic h is noted in the subsection heading. Gener ating ER networks ( k = 1 , Poisson) • choose n um ber of no des n , and a v erage degree c , or the in ter- action probabilit y p = c/ ( n − 1) , • connect eac h pair of nodes independently with probabilit y p . Gener ating DC-ER networks ( k = 1 , W eibul l or p ower law) • c hoose num ber of no des n , and a v erage degree c , • compute the parameters of degree distribution for the av erage degree c , • generate a degree sequence with length n with the computed parameters in the previous step, • compute the n um ber of edges for the net w ork as m = 1 2 P i d i , • make a multi-edge betw een each pair of no des i, j indepen- dently with the P oisson probability with rate λ = d i d g i d j d g j ω , where ω = 2 m . W e then conv ert this multigraph in to a simple (unweigh ted) netw ork by collapsing m ulti-edges. Because these netw orks are parameterized to be sparse, this operation does not substan- tially alter the net work’s structure, as only a small fraction of all edges are m ulti-edges. Gener ating SBM networks ( k > 1 , Poisson) • choose num ber of no des n , num b er of clusters k , av erage degree c , and ˜ , the ratio of n umber of edges connected to a no de outside and inside its cluster, i.e., ˜ = p out ( n/k ) p in ( n/k ) = p out p in ; by choosing c and ˜ , the mixing probabilities can then be computed as p in = c ( n/k )(1 + ˜ ( k − 1)) and p out = ˜ p in , • generate the t ype of the no des indep endently with prior prob- abilities q r for r = { 1 , ..., k } , • connect eac h pair of nodes i, j independently with probabilit y p g i g j , where p g i ,g j = p in if g i = g j p out if g i 6 = g j . 10 Ghasemian et al. T able S3. Parameter s used to generate the synthetic networks, via the DC-SBM structured random graph model, used to ev aluate the link prediction methods studied here. Redundant information (deriv able from the other parameters) is listed parenthetically , f or con venience. See Section 2 . Region Model Number of modules k P arameters low P oisson 1 n = 505 , p = 0 . 008 low P oisson 2 n = 512 , p in = 0 . 03 , p out = 0 . 0003 ( = 0 . 009) low P oisson 4 n = 512 , p in = 0 . 06 , p out = 0 . 0003 ( = 0 . 015) low P oisson 16 n = 512 , p in = 0 . 25 , p out = 0 . 0003 ( = 0 . 015) low P oisson 32 n = 512 , p in = 0 . 49 , p out = 0 . 0003 ( = 0 . 019) low W eib ull 1 n = 497 , λ = 1 , β = 0 . 5 , ω = 2350 low W eib ull 2 n = 520 , λ = 1 , β = 0 . 4 , = 0 . 002 low W eib ull 4 n = 604 , λ = 1 , β = 0 . 4 , = 0 . 002 low W eib ull 16 n = 773 , λ = 1 , β = 0 . 4 , = 0 . 04 low W eib ull 32 n = 939 , λ = 1 , β = 0 . 15 , = 0 . 0005 low po wer law 1 n = 507 , β = 1 . 6 , ω = 5436 low po wer law 2 n = 511 , β = 1 . 7 , = 0 . 0003 low po wer law 4 n = 511 , β = 1 . 8 , = 0 . 002 low po wer law 16 n = 983 , β = 1 . 6 , = 0 . 0015 low po wer law 32 n = 1029 , β = 1 . 41 , = 0 . 0015 moderate Poisson 1 n = 511 , p = 0 . 016 moderate Poisson 2 n = 512 , p in = 0 . 03 , p out = 0 . 005 ( = 0 . 20) moderate Poisson 4 n = 512 , p in = 0 . 04 , p out = 0 . 006 ( = 0 . 39) moderate Poisson 16 n = 512 , p in = 0 . 16 , p out = 0 . 006 ( = 0 . 6) moderate Poisson 32 n = 511 , p in = 0 . 31 , p out = 0 . 006 ( = 0 . 62) moderate Weibull 1 n = 510 , λ = 1 , β = 0 . 7 , ω = 1424 moderate Weibull 2 n = 501 , λ = 1 , β = 0 . 4 , = 0 . 06 moderate Weibull 4 n = 593 , λ = 1 , β = 0 . 4 , = 0 . 08 moderate Weibull 16 n = 589 , λ = 1 , β = 0 . 4 , = 0 . 2 moderate Weibull 32 n = 640 , λ = 1 , β = 0 . 22 , = 0 . 05 moderate power law 1 n = 545 , β = 1 . 9 , ω = 1428 moderate power law 2 n = 506 , β = 1 . 7 , = 0 . 05 moderate power law 4 n = 540 , β = 1 . 8 , = 0 . 05 moderate power law 16 n = 655 , β = 1 . 7 , = 0 . 01 moderate power law 32 n = 702 , β = 1 . 41 , = 0 . 01 high Poisson 1 n = 512 , p = 0 . 03 high Poisson 2 n = 512 , p in = 0 . 025 , p out = 0 . 006 ( = 0 . 25) high Poisson 4 n = 512 , p in = 0 . 04 , p out = 0 . 007 ( = 0 . 48) high Poisson 16 n = 512 , p in = 0 . 14 , p out = 0 . 007 ( = 0 . 75) high Poisson 32 n = 512 , p in = 0 . 27 , p out = 0 . 007 ( = 0 . 93) high Weibull 1 n = 489 , λ = 1 , β = 0 . 9 , ω = 1216 high Weibull 2 n = 506 , λ = 1 , β = 0 . 4 , = 0 . 2 high Weibull 4 n = 590 , λ = 1 , β = 0 . 4 , = 0 . 32 high Weibull 16 n = 600 , λ = 1 , β = 0 . 4 , = 0 . 5 high Weibull 32 n = 631 , λ = 1 , β = 0 . 22 , = 0 . 13 high power law 1 n = 514 , β = 2 . 2 , ω = 1722 high power law 2 n = 536 , β = 1 . 7 , = 0 . 08 high power law 4 n = 526 , β = 1 . 8 , = 0 . 14 high power law 16 n = 626 , β = 1 . 7 , = 0 . 1 high power law 32 n = 673 , β = 1 . 5 , = 0 . 05 Gener ating DC-SBM networks ( k > 1 , W eibul l or p ower law) • choose num ber of no des n , a verage degree c , and , the ratio of num b er of edges betw een the clusters and inside the clusters, i.e., = m out /m in , where m in is the num ber of edges inside the clusters, and m out is the num b er of edges b etw een the clusters, • generate the type of nodes indep endently with prior probabili- ties q r for r = { 1 , ..., k } , • compute the parameters of degree distribution for average degree c , • generate a degree sequence with length n with the computed parameters in previous step, and compute the aggregate degrees for eac h cluster noted as d r = P i : g i = r d i , • compute the total n um ber of edges for the netw ork as m = 1 2 P i d i , • using , compute the number of edges inside and outside the clusters, denoted as m in , and m out , as m in = m/ (1 + ) and m out = m in , • because we do not assume heterogeneity for the size and volume of clusters in the generating pro cess (no de types are randomized uniformly and edges are created uniformly inside and b etw een clusters), then w e may approximate the num ber of edges inside each cluster r as m ( r ) in = m in /k , the n um ber of edges b etw een cluster r and any other cluster as m ( r ) out = m out k/ 2 , and the num b er of edges betw een eac h pair of clusters r and s as m ( rs ) out = m out k 2 , Ghasemian et al. 11 • make a multi-edge betw een eac h pair of no des i, j with t ypes r, s , independently with the P oisson probabilit y with rate λ r,s ( d i , d j ) = d i d r d j d s ω r,s , where ω r,s = 2 m ( r ) in if r = s m ( rs ) out if r 6 = s . W e then conv ert this multigraph in to a simple (unweigh ted) netw ork by collapsing m ulti-edges. Because these netw orks are parameterized to be sparse, this operation does not substan- tially alter the net work’s structure, as only a small fraction of all edges are m ulti-edges. It is w orth while to men tion that in DC-SBM is related to ˜ in SBM as = m out /m in = ( k − 1) p out /p in = ( k − 1) ˜ . Therefore, for the results, w e used = m out /m in for both SBM and DC-SBM. Optimal link prediction accuracy on a synthetic netw ork. T o calculate an upp er b ound on link prediction accuracy that any algorithm could achiev e in one of our syn thetic netw orks, w e exploit the mathematical equiv alence of the Area Under the ROC Curve (AUC) and the binary classification probability that a prediction algorithm A assigns a higher score to a missing link (true positive) than to a non-edge (true negativ e): AUC = Pr(tes > tnes) , [3] where tes and tnes denote the scores assigned to a missing edge (te; true p ositive) and to a non-edge (tne; true negativ e). T o derive the optimal A UC for an y possible link prediction algorithm, it suffices to calculate this probabilit y under a giv en parametric generative model M ( θ ) and missingness function f . A ssumptions and definitions. In the calculations that follow, we treat separately the three generative process subcases of the DC-SBM described ab ov e, and we define n = | V | , m = | E | . If tw o edges assigned the same score b y the generativ e model, we assume that suc h ties are brok en uniformly at random. F or these calculations, we also assume that algorithm A has access to the plan ted partition assignmen t P of the k clusters used to generate the edges. In practice, this assumption implies that our upper b ound may be unachiev able in cases where the detectabilit y of P is either computational hard or information-theoretically im- possible (see Ref. ( 51 )), e.g., when comm unity boundaries are fuzzy (high ). Given this partition, we define n i , m i , and ˜ m i to be the num ber of nodes, num ber of edges, and n um ber of non-edges, respectively , within comm unity i . And, we define m ij and ˜ m ij to be the num ber of edges and non-edges, respectively , that span comm unities i and j . Finally , when we estimate Eq. ( 3 ) via Monte Carlo sampling, w e select 100,000 uniformly random te (true p ositive) and tne (true negative) pairs. Optimal AU C for ER. The A UC for an Erdős-Rén yi random graph is AUC = Pr(tes > tnes) = 1 / 2 . [4] In words: b ecause the generative model assigns the same score p = c/ ( n − 1) to ev ery edge and every non-edge, and b ecause ties are brok en at random, the maximum AUC can be no better than chance. Optimal AU C for DC-ER. As in the ER case, this random graph has k = 1 communities, but unlik e the ER case, the degree distribution here is heterogeneous (W eibull or p ower law). W e calculate the maximum AUC for an y algorithm A on this syn thetic net w ork via Eq. ( 5 ) (below), which w e estimate numerically via Monte Carlo sampling on Eq. ( 3 ). AUC = Pr(tes > tnes) = X u 1 .v 1 ,u 2 ,v 2 p ( u 1 v 1 > u 2 v 2 , d i 1 = u 1 , d j 1 = v 1 , d i 2 = u 2 , d j 2 = v 2 | ( i 1 , j 1 ) ∈ E , ( i 2 , j 2 ) / ∈ E ) = X u 1 ,v 1 ,u 2 ,v 2 1 ( u 1 v 1 > u 2 v 2 ) p ( d i 1 = u 1 , d j 1 = v 1 , d i 2 = u 2 , d j 2 = v 2 | ( i 1 , j 1 ) ∈ E , ( i 2 , j 2 ) / ∈ E ) ( Bay es Thm. ) = X u 1 ,v 1 ,u 2 ,v 2 1 ( u 1 v 1 > u 2 v 2 ) p (( i 1 , j 1 ) ∈ E , ( i 2 , j 2 ) / ∈ E | d i 1 = u 1 , d j 1 = v 1 , d i 2 = u 2 , d j 2 = v 2 ) p (( i 1 , j 1 ) ∈ E , ( i 2 , j 2 ) / ∈ E ) × p ( d i 1 = u 1 ) p ( d j 1 = v 1 ) p ( d i 2 = u 2 ) p ( d j 2 = v 2 ) . [5] Optimal A UC for SBM. In the general case ( k > 1 ) of the sto chastic block mo del (SBM), the te and tne probabilities under the generative model dep end on the mixing matrix of edge densities be tw een and within comm unities. When these densities are set such that the planted partition P is easily reco v erable b y a comm unity detection algorithm (a range of parameters called the “deep detectable regime” (DDR) ( 51 ), where → 0 ), Eq. ( 3 ) can be rewritten as Eq. ( 6 ): AUC = Pr(tes > tnes) = Pr(tes > tnes | b oth inside ) Pr( both inside ) × number of possibilities + Pr(tes > tnes | b oth outside ) Pr( b oth outside ) × num ber of p ossibilities + Pr(tes > tnes | te inside , tne outside ) Pr( te inside , tne outside ) × num ber of p ossibilities + Pr(tes > tnes | te outside , tne inside ) Pr( te outside , tne inside ) × num ber of p ossibilities . [6] 12 Ghasemian et al. The four terms of Eq. ( 6 ) can then be computed as follo ws, where α is the sampling rate of observed edges: • First term: Pr(tes > tnes | b oth inside ) Pr( b oth inside ) = m i α P i m i α + P i 6 = j m ij α × ˜ m i P i ˜ m i + P i 6 = j ˜ m ij = n i 2 p in P i n i 2 p in + P i 6 = j n i n j p out × n i 2 (1 − p in ) n i 2 (1 − p in ) + n i n j (1 − p out ) = 1 2 p in k 3 ( p in + ( k − 1) p out ) = c in 2 k 4 c , † [7] Finally , because the num ber of possibilities is k 2 , the first term simplifies as 1 2 p in k 3 ( p in +( k − 1) p out ) × k 2 ≈ 1 / 2 k . • Second term: Pr(tes > tnes | b oth outside ) Pr( b oth outside ) = m ij α P i m i α + P i 6 = j m ij α × ˜ m ij P i ˜ m i + P i 6 = j ˜ m ij = n i n j p out P i n i 2 p in + P i 6 = j n i n j p out × n i n j (1 − p out ) n i 2 (1 − p in ) + n i n j (1 − p out ) = 2 p out k 3 ( p in + ( k − 1) p out ) = 2 c out k 4 c . [8] Finally , b ecause the num b er of p ossibilities is k 2 2 ≈ k 4 4 the second term simplifies as 2 p out k 3 ( pin +( k − 1) p out ) × k 4 4 = kp out ( p in +( k − 1) p out ) ≈ 0 . • Third term: Pr(tes > tnes | tes inside , tnes outside ) Pr( tes inside , tnes outside ) = m i α P i m i α + P i 6 = j m ij α × ˜ m ij P i ˜ m i + P i 6 = j ˜ m ij = n i 2 p in P i n i 2 p in + P i 6 = j n i n j p out × n i n j (1 − p out ) n i 2 (1 − p in ) + n i n j (1 − p out ) = 2 p in k 3 ( p in + ( k − 1) p out ) = 2 c in k 4 c . [9] Finally , b ecause the num b er of p ossibilities is k k 2 = k 2 ( k − 1) / 2 the third term simplifies as 2 p in k 3 ( p in +( k − 1) p out ) × k 2 ( k − 1) 2 = ( k − 1) /k . • Last term: Pr(tes > tnes | tes outside , tnes inside ) Pr( tes outside , tnes inside ) = 0 [10] Finally , when the SBM parameters are suc h that the model is in the deep detectable regime (DDR), the fourth term is zero, b ecause the assigned scores to the outer edges are smaller than the assigned scores to inner edges, under the assumption that the algorithm A can reco v er the plan ted partition (whic h occurs with probabilit y 1 in DDR). Ghasemian et al. 13 Given the abov e simplifications, we arrive at the final expression to compute the optimal A UC for the SBM in the DDR: AUC = Pr(tes > tnes) = 1 2 k + k − 1 k = 2 k − 1 2 k . [11] F or example, the upper bounds on link predictability un- der this mo del for k = { 2 , 4 , 8 , 16 , 32 } are AUC = { 0 . 75 , 0 . 875 , 0 . 94 , 0 . 97 , 0 . 98 } , resp ectively . Because these v alues are computed in the deep detectable regime, they are accurate only when is low (sharp communit y b oundaries, or P is known or recov erable). F or any v alue of , w e ma y n umerically calculate the upp er bound on AUC using Monte Carlo sampling via the Eq. ( 3 ), applied to the generated netw orks. The corresp onding v alues represent conserv ativ e upper bounds on the maximum A UC because under Monte Carlo because we assume that P is kno wn. In practice, a communit y detection algorithm would need to infer that from the observed data, and this ev en t is not guaran teed when is higher ( 51 ), due to a phase transition in the detectability (recov erability) of the planted partition structure that maximizes the predictability of missing links. W e suggest that the gap observed in Fig. 2 between this conserv ativ e upper b ound and accuracy of the best stack ed models in the high- settings can be attributed to this difference. That is, the stack ed mo dels are closer to the true upper b ound than our calculations suggest. Optimal A U C for DC-SBM. In the general case ( k > 1 ) of the degree- corrected SBM, the te and tne probabilities under the generativ e model depend on the sp ecified degree distribution (W eibull or p ow er law) and the mixing matrix of edge densities betw een and within communities. In this setting, Eq. ( 3 ) can b e rewritten as Eq. ( 6 ) when → 0 ; how ever to compute each term we must also condition on the degrees of the nodes. F ollo wing the same logic as in the SBM analysis, w e compute eac h term separately as follo ws. • First term: Pr(tes > tnes | b oth inside ) = X u 1 ,v 1 ,u 2 ,v 2 1 ( u 1 v 1 > u 2 v 2 ) p (( i 1 , j 1 ) ∈ E , ( i 2 , j 2 ) / ∈ E | d i 1 , 2 = u 1 , 2 , d j 1 , 2 = v 1 , 2 ) p (( i 1 , j 1 ) ∈ E , ( i 2 , j 2 ) / ∈ E ) × p ( d i 1 = u 1 ) p ( d j 1 = v 1 ) p ( d i 2 = u 2 ) p ( d j 2 = v 2 ) , [12] where d i 1 , 2 = u 1 , 2 means d i 1 = u 1 and d i 2 = u 2 . • Second term: Pr(tes > tnes | b oth outside ) = X u 1 ,v 1 ,u 2 ,v 2 1 ( u 1 v 1 > u 2 v 2 ) p (( i 1 , j 1 ) ∈ E , ( i 2 , j 2 ) / ∈ E | d i 1 , 2 = u 1 , 2 , d j 1 , 2 = v 1 , 2 ) p (( i 1 , j 1 ) ∈ E , ( i 2 , j 2 ) / ∈ E ) × p ( d i 1 = u 1 ) p ( d j 1 = v 1 ) p ( d i 2 = u 2 ) p ( d j 2 = v 2 ) . [13] • Third term: Pr(tes > tnes | te inside , tne outside ) = X u 1 ,v 1 ,u 2 ,v 2 1 ( u 1 v 1 m rr > u 2 v 2 m rs ) p (( i 1 , j 1 ) ∈ E , ( i 2 , j 2 ) / ∈ E | d i 1 , 2 = u 1 , 2 , d j 1 , 2 = v 1 , 2 ) p (( i 1 , j 1 ) ∈ E , ( i 2 , j 2 ) / ∈ E ) × p ( d i 1 = u 1 ) p ( d j 1 = v 1 ) p ( d i 2 = u 2 ) p ( d j 2 = v 2 ) . [14] • F ourth term: Pr(tes > tnes | te outside , tne inside ) = X u 1 ,v 1 ,u 2 ,v 2 1 ( u 1 v 1 m rs > u 2 v 2 m rr ) p (( i 1 , j 1 ) ∈ E , ( i 2 , j 2 ) / ∈ E | d i 1 , 2 = u 1 , 2 , d j 1 , 2 = v 1 , 2 ) p (( i 1 , j 1 ) ∈ E , ( i 2 , j 2 ) / ∈ E ) × p ( d i 1 = u 1 ) p ( d j 1 = v 1 ) p ( d i 2 = u 2 ) p ( d j 2 = v 2 ) . [15] W e compute these terms numerically using Mon te Carlo samples of the generated net w orks to calculate Eq. ( 3 ). 3. Empirical corpus for link prediction e valuations T o ev aluate and compare the differen t link prediction algorithms in a practical setting, we hav e selected 548 netw orks ‡ from the “Com- munit yFitNet corpus,” a nov el data set § containing 572 real-world ‡ Av ailable at https://github .com/Aghasemian/OptimalLinkPrediction § Av ailable at https://github .com/AGhasemian/CommunityFitNet netw orks drawn from the Index of Complex Netw orks (ICON) ( 52 ). This corpus spans a v ariety of network sizes and structures, with 22% social, 21% economic, 34% biological, 12% technological, 4% information, and 7% transportation graphs (Fig. S1 ). 4. Evaluation of the link prediction algorithms In practical settings, the true missingness function f may not be kno wn, and f is likely to v ary with the scientific domain, the manner in which the net work data is collected, and the scientific 14 Ghasemian et al. 1 0 2 1 0 3 number of nodes 1 0 1 average degree social biological economic technological information transportation 0 50 number of networks 0 100 number of networks Fig. S1. A ver age degree versus number of nodes f or a subset of CommunityFitNet cor pus ( 8 ) consisting of 548 real-world networks drawn from the Inde x of Complex Networks (ICON) ( 52 ), including social, biological, economic, technological, inf ormation, and transpor tation graphs. question of interest. Here, we do not consider all possible functions f , and instead analyze an f that samples edges uniformly at random from E so that each edge ( i, j ) ∈ E is observ ed with probability α . ¶ This choice presents a hard test for link prediction algorithms, as f is independent of both observ ed edges and metadata. Other models of f , e.g., in whic h missingness correlates with edge or node characteristics, may better capture particular scien tific settings and are left for future application-sp ecific work. Our results thus provide a general, application-agnostic assessmen t of link predictability and method p erformance. Most of the predictors we consider are predictiv e only under a supervised learning approac h, in which w e learn a model of how these node-pair features correlate with edge missingness. This su- pervised approach to link prediction p oses one specific technical challenge. Under sup ervised learning, we train a metho d using 5-fold cross v alidation by c hoosing as p ositive examples a subset of edges E 00 ⊂ E 0 according to the same (uniformly random) missingness model f . But applying this missingness function can only create positive training examples (missing links), while sup ervised learning also needs negativ e examples (non-links). Other approac hes to su- pervised link prediction ha v e made sp ecific assumptions to mitigate this issue. F or example, in a temp oral net w ork, an algorithm can be trained using the links and non-links observed during an earlier training time frame ( 53 , 54 ), or if some missing links are known a priori , they ma y be used as training examples ( 55 ). How ever, suc h approaches require information, e.g., the evolution of a netw ork ov er time, that are not commonly a v ailable, and th us they do not generalize w ell to the broad ev aluation setting of this study . Here, we use a different, more general approac h to ev aluate and compare supervised link prediction methods on a large set of static net w orks. Specifically , we exploit tw o features of our empirical netw orks (Fig. S1 ) to construct reasonably reliable training sets. First, all observed non-edges V × V − E 0 in observed graph G 0 = ( V , E 0 ) are taken as negativ e examples (non-links). If G is a snapshot of an evolving net w ork, then links that form in the future of G will form b etw een pairs that are not currently connected. Therefore, the non-links of G can reasonably be considered as negativ e examples up to the time of observ ation. Second, most real-world netw orks, for which link prediction is relev an t, are sparse. In this case, considering the non-links as negative examples includes only a small num ber of negativ e examples in the training set, which are in fact p ositive examples in the test set. Although these mislabeled edges are not true negativ e examples, their sparsity in the training set (b ecause the size of the non-links set is O ( n 2 ) compared to the O ( n ) size of the missing links set, this approach can only induce a O (1 /n ) bias in the learning) is likely comp ensated for by the improv ed generalizability of taking a supervised learning approach compared to an unsupervised approach. ¶ Unless otherwise specified, results reflect a choice of α = 0 . 8 , i.e., 20% of edges are unobserved (holdout set); other values produce qualitativ ely similar results. 5. Diversity in prediction err or A Lorenz curv e is a standard metho d to visualize the sk ewness of predictor imp ortances on individual netw orks. Fig. S2 shows the set of 548 curv es for the learned importances for each of the netw orks in our empirical corpus, along with the a verage curve across the ensem ble (red solid line). This ensemble exhibits a mean Gini coefficient of 0 . 64 ± 0 . 14 (mean ± stddev), and illustrates that the imp ortances tend to b e highly sk ew ed, such that a relativ ely small subset of predictors accoun t for the majority of prediction accuracy . The entrop y of a distribution is a standard summary statistic of such v ariation, and provides a compact measure for compar- ing different distributions. Given a discrete random v ariable X drawn from a probability distribution p , the en trop y is defined as H ( X ) = E p ( X ) [ − log ( p ( X ))] , and can b e in terpreted as the amoun t of uncertain t y in X , the av erage n um ber of bits we need to store X , or the minimum num ber of binary questions on a v erage to guess a dra w from X ( 56 ). The maximum en trop y of discrete random v ariable o ccurs for a uniform distribution, and is simply log 2 ( L ) where L is the n um ber of possible outcomes for X . W e b egin by computing the learned feature imp ortance entropies for eac h domain in each family (T able S4 ). T o calculate these, w e first c hoose all the netw orks in a domain j , as either so cial, biological, economic, tec hnological, information, or transp ortation netw orks) and a set of predictors ` , as either (i) all 203 predictors, (ii) the 42 topological predictors, (iii) the 11 mo del-based predictors, or (iv) the 150 em bedding predictors. W e then learn the feature imp ortances of this set for eac h domain via sup ervised learning, as describ ed above. ‖ W e denote the feature importances of all predictors in a family ` and for netw orks in domain j by a v ector X ( ` ) j . The “probability” asso ciated with the i -th predictor in family ` and for netw orks in domain j is then computed as p ( ` ) ij = X ( ` ) ij . P i X ( ` ) ij . F or eac h setting, the en trop y of the corresponding distribution is reported in T able S4 . Comparing the entrop y of the learned imp ortances with the simple upp er-limit entrop y given b y a uniform distribution illustrates the diversit y of learned importances among the predictors. T o provide a more in tuitiv e sense of how sk ew ed the distribution is, we compare the empirical entrop y v alue with that of a simple piece-wise artificial distribution. Specifically , we consider a distribution in which at least 90% of the density is allocated uniformly across the best x % of the predictors, with the remaining densit y allo cated uniformly across the rest. W e then c hoose the x that minimizes the difference betw een this model entrop y and the empirical entrop y . A l l pr e dictors. Applied to the imp ortances of all predictors, only 9 % of predictors accoun t for 90% of the importance in so cial netw orks. Other domains require far more predictors, e.g., 37 % for biological ‖ Unless otherwise noted, the repor ted results are based on a training a random forest. We also used AdaBoost and XGBoost and similar results hav e been observed (see T ables S19 - S22 ). Ghasemian et al. 15 T able S4. Predictor importance entrop y for each domain in each famil y . For each famil y , the “entropy” column measures the uncertainty in predictor impor tance of each domain. Also we consider an ar tificial distribution on predictors that explain (uniformly) the 90% of the probability by the best x % of the predictors, and (uniformly) 10% of the probability by the rest. W e choose x such that the ar tificial entropy be as close as possible to the empirical entropy . The column “top x %”, sho ws the percenta ge of best predictor s with 90% probability . The ( n ) value sho ws the corresponding n umber for the top x %. The “uniform” column reports the entrop y if predictor importance were unif orm. The “feature-wise” row within each family reports the entropy held by each predictor , summing across domains. Entropies are reported in units of bits. F amily Domain Entropy T op x % (n) Uniform all topol., model, and embed. predictors (203) social 5 . 03 9 . 36(19) 7 . 66 biology 6 . 79 37 . 44(76) economy 6 . 57 31 . 03(63) technology 7 44 . 83(91) information 6 . 41 27 . 59(56) transportation 6 . 67 33 . 99(69) feature-wise 6 . 71 34 . 98(71) F amily Domain Entropy T op x % (n) Uniform all topol. predictors (42) social 3 . 85 21 . 43(9) 5 . 39 biology 5 . 09 61 . 9(26) economy 4 . 65 42 . 86(18) technology 5 . 01 57 . 14(24) information 4 . 81 47 . 62(20) transportation 4 . 9 52 . 38(22) feature-wise 5 . 08 61 . 9(26) F amily Domain Entropy T op x % (n) Uniform all model-based predictors (11) social 3 . 14 63 . 64(7) 3 . 46 biology 3 . 35 72 . 73(8) economy 3 . 36 72 . 73(8) technology 3 . 37 72 . 73(8) information 2 . 94 54 . 55(6) transportation 3 . 24 63 . 64(7) feature-wise 3 . 31 72 . 73(8) F amily Domain Entropy T op x % (n) Uniform all embed. predictors (150) social 4 . 65 9 . 33(14) 7 . 23 biology 6 . 51 42 . 67(64) economy 6 . 38 38 . 67(58) technology 6 . 74 52(78) information 5 . 19 14 . 67(22) transportation 6 . 62 46 . 67(70) feature-wise 6 . 23 34(51) and 45 % for technological net w orks. Notably , the top x % in eac h family of predictors are different across domains. The v alues in T able S4 show that most of the v ariation in imp ortances can be explained by at most 91 of 203 total predictors for technological netw orks, 26 out of 42 topol. predictors for biological netw orks, 8 of 11 mo del-based predictors for biological, economic, and technological netw orks, and 78 of 150 embed. predictors for technological netw orks. Also we see that across these predictor sets most of the uncertain t y can be explained by at least 19 out of 203, 9 out of 42, 7 out of 11, and 14 out of 150 predictors for social netw orks, whic h illustrates the simplicit y of link prediction in so cial netw orks. F e ature-wise entr opy. W e also compute the feature-wise en tropy for each family ` , whic h captures the distribution of learned predictor importances, summing across domains. W e denote the predictor importance of all predictors in a family ` by a vector X ` . The imp or- tance “probabilit y” in the i -th en try of this v ector for family ` can be computed as p ( ` ) i = P j X ( ` ) ij . P ij X ( ` ) ij , whic h quan tifies the proportion of total imp ortance of predictor i in all domains v ersus the total importance of all predictors. F or each family , the entrop y of the corresp onding probability distribution is rep orted in T able S4 . And, as before, comparing the entrop y of the learned imp ortances with the simple upper-limit entrop y given b y a uniform distribution illustrates that regardless of the domain, the imp ortances are spread widely across predictors. F amily-wise entropy. Finally , w e compute the family-wise en tropies for eac h domain j , under an alternativ e form ulation. Denoting the importance of predictor i in domain j as X ij , and the set of all predictors in family ` as P ` , we compute the importance “probabil- ity” of the predictor i in domain j as p ij = P i ∈P ` X ij P i X ij . Then, the family-wise en tropy can be defined using this distribution (see T able S5 ). As b efore, comparing the entrop y of eac h domain j with the simple upper-limit entrop y given b y a uniform distribution illustrates the v ariance of predictor imp ortances among different families. Moreover, these entropies also illustrate that the v ariation of imp ortances in so cial netw orks is smaller (the most imp ortant predictors are in topological and embedding families [see Fig. 2 in the main text]), compared to that of non-so cial netw orks. T able S5. Family wise entropy . Impor tance entropy of all features in a family for each domain. The “unif orm” column reports the entrop y if predictor impor tance were uniform. Entropies are repor ted in units of bits. Domain Entropy Uniform family wise social 1 . 27 1 . 58 biology 1 . 57 economy 1 . 58 technology 1 . 55 information 1 . 58 transportation 1 . 56 T aking the learned importances for all predictors, Fig. S3 plots the distributions of the imp ortance-ranks (how often predictor i was 16 Ghasemian et al. the j th most important predictor) for all 203 predictors, applied to all 548 net w orks. This visualization reveals that among the most important predictors (high imp ortance-rank across netw orks) are those in the mo del-based family , along with a subset of topolog- ical predictors, and the six notions of distance or similarity for embedding-based predictors. The least important predictors (low importance-rank across networks) fall primarily in the top ologi- cal family and a few model-based predictors. None of em bedding predictors ranked among the least important, and instead nearly all of them rank in the broad middle of ov erall importance. Most embedding-based predictors do rank highly for a few individual netw orks, but it is a differen t subset of embedding predictors for each net w ork. Th us, across netw orks, embedding predictors are uniformly middling in their importance, and none are dominan t in a net w ork domain. Cate gorizing pr edictors by their imp ortance-r ank distributions. T o analyze and iden tify the most imp ortant predictors in comparison with the least imp ortan t predictors on av erage, we extract a hierar- chical clustering of the rank similarities of Fig. S3 , whic h is shown in Fig. S4 . The large group of predictors (green cluster) on the left of the hierarc h y correspond to the embedding-based predictors, whose distribution of imp ortances is concentrated in the middle range (Fig. S4 , inset panel 1). A second group (red cluster) corresp onds to the predictors that are nearly alw ays the least important across netw orks, such as VD, OE, DA, and A CC (Fig. S4 , inset panel 2). And a third group (cy an cluster) includes to predictors that receiv e high imp ortance across nearly all 548 netw orks (Fig. S4 , inset panels 7–9), as well as some with more bimo dal imp ortance (Fig. S4 , inset panels 4–6). Minimal numb er of fe atur es for stacking. Fig. S5 sho ws the dis- tribution of the minim um n um ber of predictors k ∗ , that is needed to ac hiev e at least 95% of final AUC for each family of stacking methods. These curves highlight that in a large p ortion of netw orks, we can achiev e high predictabilit y using roughly 10 predictors. Performanc e as we ak le arners. Considering eac h predictor as a “w eak learner” from the persp ective of the Adaboost theorem, Figs. S6 and S7 show the histogram of A UC p erformances of all model-based and topological individual predictors across the 548 netw orks in our empirical corpus. The large ma jority of these predic- tors hav e AUC larger than 0 . 5 , while a modest portion of individual topological predictors fall b elow this threshold, meaning that they are not useful in link prediction for a given netw ork. (These top olog- ical predictors are of the “global” t yp e (see SI App endix, section 1 and T able S1 ) and are not exp ected to be individually predictiv e. W e note, ho w ev er, that these predictors are likely to b e useful in any transfer learning setting, in which w e train on a subset of netw orks and apply the mo del to unseen netw orks. T ransfer learning for link prediction is out of scope of the presen t work and w e leav e it for future study . A UC, pre cision, and r e c al l acr oss tests. T ables S6 and S7 present the link prediction performance measured b y A UC, precision, and recall, for all individual topological predictors applied to the 548 real-world netw orks in our empirical corpus and the 45 generated synthetic data. Ghasemian et al. 17 0.0 0.2 0.4 0.6 0.8 1.0 richest fraction of features 0.0 0.2 0.4 0.6 0.8 1.0 fraction of total importance Fig. S2. Lorenz curves of the importance of the features . These cur ves illustr ate that in a large portion of empirical networks, a v ery large fraction of learned “impor tance” belongs to a small fraction of predictors. The red solid line shows the av erage Lorenz curve o ver the 548 netw orks. Fig. S3. Distribution of the importance ranks of each predictor across 548 networks. The most impor tant features typically belong to model-based and topological predictor families . Among embedding predictor, the most impor tant correspond to the distance measures among the embedded vectors . Almost all vector embedding predictors ha ve middling lev els of importance, although they are rarely the worst predictors . The distribution of the ranks is logarithmic (base 10). 18 Ghasemian et al. Fig. S4. A clustering of features based on the similarities of their rank in Gini importance. Clusters show similar importance distribution among 548 networks. Embedding predictors appear in middle ranks uniformly for different networks (inset 1). The red cluster shows the worst impor tance among different networks (insets 2–3). The cyan cluster shows better importance and the most impor tant features are located to the right of this group (insets 4–9). Ghasemian et al. 19 1 0 0 1 0 1 1 0 2 k * 0.00 0.05 0.10 d i s t r i b u t i o n o f k * all topol. predictors all model-based all embed. predictors all topol. & model predictors all topol. & embed. predictors all model & embed. predictors all topol., model, & embed. predictors Fig. S5. Distr ibution of the minimum n umber of features k ∗ that is needed to achiev e at least 95% of final A UC for each family of stac king methods. 0.1 0.2 0.3 0.4 0.5 0.6 0.7 0.8 0.9 1.0 AUC 0 2 4 6 8 10 12 density Q Q-MR Q-MP B-NR (SBM) B-NR (DC-SBM) B-HKK (SBM) cICL-HKK (SBM) Infomap MDL (SBM) MDL (DC-SBM) S-NB emb-DW emb-vgae Fig. S6. Histogram of A UC performances on 548 empirical networks for all 11 model-based “weak learners” and two embedding link predictors used in model stackin g. 20 Ghasemian et al. 0.1 0.2 0.3 0.4 0.5 0.6 0.7 0.8 0.9 1.0 AUC 0 10 20 30 40 50 density ACC AD A N D i A N D j S P B C i S P B C j C C i C C j L C C i L C C j CN LHN DA D C i D C j ND E C i E C j K C i K C j L C i L C j L N T i L N T j P R i P R j PPR PA SP LRA LRA-approx dLRA dLRA-approx mLRA mLRA-approx NT VD JC RA AA N OE Fig. S7. Histogram of A UC performances on 548 empirical networks for all 42 individual topological “weak learners” used in model stacking. t h e or e t i c al u p p e r b ou n d on A U C Fig. S8. (A) On synthetic networks, the mean link prediction performance (A UC) of topological individual predictors and all stacked algorithms across three forms of structural variability: (left to right, by subpanel) degree distribution v ariability , from low (P oisson) to high (power la w); (top to bottom, by subpanel) fuzziness of community boundaries, ranging from low to high ( = m out /m in , the fraction of a node’ s edges that connect outside its community); and (left to right, within subpanel) the number of communities k . Across settings, the dashed line represents the theoretical maximum performance achievab le by any link prediction algor ithm (SI Appendix, section B). In each instance, stack ed models perform optimally or near ly optimally , and generally perform better when networks exhibit heavier-tailed degree distributions and more communities with distinct boundaries. (B) On real-world networks, the mean link prediction performance for the same predictors across all domains, and b y individual domain. Both over all and within each domain, stack ed models, particularly the across-family versions , exhibit superior perf ormance, and they achie v e nearly perfect accuracy on social netw orks. The performance, how ev er , varies considerably across domains, with biological, technological, transportation, and information networks exhibiting the lo west link predictability . Ghasemian et al. 21 T able S6. Link prediction perf ormance (mean ± std. err.), measured b y A UC, precision, and recall, for individual topological predictors applied to the 548 structurally diverse netw orks in our corpus. algorithm A UC precision recall ACC 0 . 5 ± 0 . 0 0 . 01 ± 0 . 02 0 . 48 ± 0 . 5 AD 0 . 5 ± 0 . 0 0 . 02 ± 0 . 02 0 . 51 ± 0 . 5 AND i 0 . 6 ± 0 . 12 0 . 05 ± 0 . 04 0 . 46 ± 0 . 21 AND j 0 . 61 ± 0 . 12 0 . 05 ± 0 . 05 0 . 48 ± 0 . 2 SPBC i 0 . 58 ± 0 . 09 0 . 06 ± 0 . 06 0 . 44 ± 0 . 16 SPBC j 0 . 55 ± 0 . 08 0 . 05 ± 0 . 06 0 . 41 ± 0 . 24 CC i 0 . 56 ± 0 . 08 0 . 04 ± 0 . 03 0 . 5 ± 0 . 23 CC j 0 . 6 ± 0 . 1 0 . 05 ± 0 . 03 0 . 54 ± 0 . 21 LCC i 0 . 55 ± 0 . 07 0 . 05 ± 0 . 07 0 . 44 ± 0 . 36 LCC j 0 . 53 ± 0 . 05 0 . 04 ± 0 . 06 0 . 45 ± 0 . 37 CN 0 . 68 ± 0 . 19 0 . 21 ± 0 . 27 0 . 7 ± 0 . 37 LHN 0 . 66 ± 0 . 18 0 . 25 ± 0 . 3 0 . 68 ± 0 . 37 D A 0 . 5 ± 0 . 0 0 . 01 ± 0 . 02 0 . 49 ± 0 . 5 DC i 0 . 68 ± 0 . 11 0 . 06 ± 0 . 05 0 . 61 ± 0 . 2 DC j 0 . 68 ± 0 . 1 0 . 06 ± 0 . 04 0 . 58 ± 0 . 18 ND 0 . 5 ± 0 . 0 0 . 02 ± 0 . 02 0 . 52 ± 0 . 5 EC i 0 . 56 ± 0 . 09 0 . 05 ± 0 . 06 0 . 37 ± 0 . 17 EC j 0 . 6 ± 0 . 08 0 . 05 ± 0 . 05 0 . 5 ± 0 . 21 KC i 0 . 56 ± 0 . 09 0 . 05 ± 0 . 06 0 . 47 ± 0 . 19 KC j 0 . 59 ± 0 . 1 0 . 05 ± 0 . 06 0 . 54 ± 0 . 22 LC i 0 . 58 ± 0 . 09 0 . 06 ± 0 . 06 0 . 44 ± 0 . 16 LC j 0 . 55 ± 0 . 07 0 . 05 ± 0 . 06 0 . 41 ± 0 . 24 LNT i 0 . 55 ± 0 . 07 0 . 04 ± 0 . 05 0 . 51 ± 0 . 35 LNT j 0 . 54 ± 0 . 07 0 . 04 ± 0 . 05 0 . 51 ± 0 . 36 PR i 0 . 64 ± 0 . 1 0 . 06 ± 0 . 05 0 . 48 ± 0 . 18 PR j 0 . 63 ± 0 . 11 0 . 06 ± 0 . 04 0 . 51 ± 0 . 18 PPR 0 . 75 ± 0 . 15 0 . 21 ± 0 . 26 0 . 57 ± 0 . 28 P A 0 . 69 ± 0 . 1 0 . 06 ± 0 . 05 0 . 61 ± 0 . 19 SP 0 . 76 ± 0 . 15 0 . 15 ± 0 . 18 0 . 73 ± 0 . 3 LRA 0 . 5 ± 0 . 0 0 . 01 ± 0 . 02 0 . 51 ± 0 . 5 LRA-approx 0 . 67 ± 0 . 15 0 . 17 ± 0 . 19 0 . 42 ± 0 . 3 dLRA 0 . 68 ± 0 . 19 0 . 2 ± 0 . 27 0 . 71 ± 0 . 36 dLRA-approx 0 . 69 ± 0 . 14 0 . 15 ± 0 . 19 0 . 56 ± 0 . 31 mLRA 0 . 67 ± 0 . 19 0 . 21 ± 0 . 28 0 . 68 ± 0 . 38 mLRA-approx 0 . 68 ± 0 . 14 0 . 14 ± 0 . 18 0 . 56 ± 0 . 3 NT 0 . 5 ± 0 . 0 0 . 01 ± 0 . 02 0 . 48 ± 0 . 5 VD 0 . 5 ± 0 . 0 0 . 01 ± 0 . 02 0 . 46 ± 0 . 5 JC 0 . 67 ± 0 . 19 0 . 23 ± 0 . 29 0 . 68 ± 0 . 38 RA 0 . 67 ± 0 . 19 0 . 24 ± 0 . 31 0 . 68 ± 0 . 38 AA 0 . 67 ± 0 . 19 0 . 24 ± 0 . 31 0 . 68 ± 0 . 38 N 0 . 5 ± 0 . 0 0 . 02 ± 0 . 02 0 . 52 ± 0 . 5 OE 0 . 5 ± 0 . 0 0 . 01 ± 0 . 02 0 . 45 ± 0 . 5 22 Ghasemian et al. T able S7. Link prediction perf ormance (mean ± std. err.), measured b y A UC, precision, and recall, for individual topological predictors applied to the 45 synthetic networks. algorithm A UC precision recall ACC 0 . 5 ± 0 . 0 0 . 02 ± 0 . 02 0 . 44 ± 0 . 5 AD 0 . 5 ± 0 . 0 0 . 02 ± 0 . 02 0 . 49 ± 0 . 5 AND i 0 . 57 ± 0 . 07 0 . 06 ± 0 . 03 0 . 41 ± 0 . 16 AND j 0 . 56 ± 0 . 07 0 . 06 ± 0 . 03 0 . 4 ± 0 . 12 SPBC i 0 . 61 ± 0 . 1 0 . 09 ± 0 . 06 0 . 44 ± 0 . 13 SPBC j 0 . 61 ± 0 . 1 0 . 08 ± 0 . 06 0 . 46 ± 0 . 17 CC i 0 . 61 ± 0 . 11 0 . 05 ± 0 . 03 0 . 59 ± 0 . 22 CC j 0 . 6 ± 0 . 11 0 . 05 ± 0 . 03 0 . 63 ± 0 . 23 LCC i 0 . 6 ± 0 . 1 0 . 09 ± 0 . 07 0 . 51 ± 0 . 2 LCC j 0 . 62 ± 0 . 1 0 . 08 ± 0 . 05 0 . 48 ± 0 . 21 CN 0 . 71 ± 0 . 14 0 . 19 ± 0 . 15 0 . 54 ± 0 . 28 LHN 0 . 7 ± 0 . 14 0 . 22 ± 0 . 16 0 . 55 ± 0 . 29 D A 0 . 5 ± 0 . 0 0 . 02 ± 0 . 02 0 . 49 ± 0 . 5 DC i 0 . 67 ± 0 . 13 0 . 08 ± 0 . 05 0 . 55 ± 0 . 16 DC j 0 . 67 ± 0 . 12 0 . 08 ± 0 . 05 0 . 57 ± 0 . 16 ND 0 . 5 ± 0 . 0 0 . 02 ± 0 . 02 0 . 47 ± 0 . 5 EC i 0 . 62 ± 0 . 11 0 . 08 ± 0 . 05 0 . 46 ± 0 . 14 EC j 0 . 62 ± 0 . 12 0 . 08 ± 0 . 05 0 . 46 ± 0 . 16 KC i 0 . 57 ± 0 . 08 0 . 07 ± 0 . 08 0 . 42 ± 0 . 11 KC j 0 . 57 ± 0 . 09 0 . 06 ± 0 . 03 0 . 44 ± 0 . 16 LC i 0 . 61 ± 0 . 1 0 . 09 ± 0 . 06 0 . 45 ± 0 . 13 LC j 0 . 61 ± 0 . 1 0 . 08 ± 0 . 05 0 . 46 ± 0 . 14 LNT i 0 . 63 ± 0 . 11 0 . 08 ± 0 . 07 0 . 57 ± 0 . 21 LNT j 0 . 63 ± 0 . 11 0 . 07 ± 0 . 04 0 . 57 ± 0 . 2 PR i 0 . 65 ± 0 . 12 0 . 09 ± 0 . 06 0 . 51 ± 0 . 14 PR j 0 . 65 ± 0 . 12 0 . 09 ± 0 . 06 0 . 5 ± 0 . 15 PPR 0 . 74 ± 0 . 14 0 . 16 ± 0 . 14 0 . 54 ± 0 . 23 P A 0 . 72 ± 0 . 16 0 . 1 ± 0 . 07 0 . 62 ± 0 . 18 SP 0 . 75 ± 0 . 14 0 . 13 ± 0 . 13 0 . 72 ± 0 . 18 LRA 0 . 5 ± 0 . 0 0 . 01 ± 0 . 02 0 . 38 ± 0 . 48 LRA-approx 0 . 69 ± 0 . 14 0 . 15 ± 0 . 16 0 . 51 ± 0 . 21 dLRA 0 . 71 ± 0 . 14 0 . 18 ± 0 . 14 0 . 54 ± 0 . 27 dLRA-approx 0 . 73 ± 0 . 13 0 . 17 ± 0 . 12 0 . 51 ± 0 . 19 mLRA 0 . 68 ± 0 . 13 0 . 18 ± 0 . 15 0 . 51 ± 0 . 28 mLRA-approx 0 . 7 ± 0 . 12 0 . 12 ± 0 . 11 0 . 49 ± 0 . 19 NT 0 . 5 ± 0 . 0 0 . 02 ± 0 . 02 0 . 49 ± 0 . 5 VD 0 . 5 ± 0 . 0 0 . 02 ± 0 . 02 0 . 6 ± 0 . 49 JC 0 . 69 ± 0 . 14 0 . 21 ± 0 . 16 0 . 5 ± 0 . 29 RA 0 . 7 ± 0 . 14 0 . 21 ± 0 . 16 0 . 52 ± 0 . 28 AA 0 . 71 ± 0 . 14 0 . 21 ± 0 . 16 0 . 51 ± 0 . 28 N 0 . 5 ± 0 . 0 0 . 02 ± 0 . 02 0 . 62 ± 0 . 48 OE 0 . 5 ± 0 . 0 0 . 02 ± 0 . 02 0 . 49 ± 0 . 5 Ghasemian et al. 23 t h e or e t i c al u p p e r b ou n d on A U C Fig. S9. (A) On synthetic networks, the mean link prediction performance (A UC) of model-based individual predictors and all stack ed algorithms across three forms of structural variability: (left to right, by subpanel) degree distribution v ariability , from low (P oisson) to high (power la w); (top to bottom, by subpanel) fuzziness of community boundaries, ranging from low to high ( = m out /m in , the fraction of a node’ s edges that connect outside its community); and (left to right, within subpanel) the number of communities k . Across settings, the dashed line represents the theoretical maximum performance achievab le by any link prediction algor ithm (SI Appendix, section B). In each instance, stack ed models perform optimally or near ly optimally , and generally perform better when networks exhibit heavier-tailed degree distributions and more communities with distinct boundaries. (B) On real-world networks, the mean link prediction performance for the same predictors across all domains, and b y individual domain. Both over all and within each domain, stack ed models, particularly the across-family versions , exhibit superior perf ormance, and they achie v e nearly perfect accuracy on social netw orks. The performance, how ev er , varies considerably across domains, with technological networks e xhibiting the lowest link predictability . T able S8. Mean performance gap for each method in synthetic data. Algorithm A ver age gap h ∆ A UC i Q 0 . 187 Q-MR 0 . 198 Q-MP 0 . 191 B-NR (SBM) 0 . 085 B-NR (DC-SBM) 0 . 123 cICL-HKK 0 . 09 B-HKK 0 . 12 Infomap 0 . 083 MDL (SBM) 0 . 075 MDL (DC-SBM) 0 . 071 S-NB 0 . 138 mean indiv . model. 0 . 124 mean indiv . topol. 0 . 257 mean indiv . topol. & model 0 . 229 emb-D W 0 . 2 emb-vgae 0 . 172 all topol. 0 . 066 all model-based 0 . 069 all embed. 0 . 09 all topol. & model 0 . 049 all topol. & embed. 0 . 057 all model & embed. 0 . 05 all topol., model & embed. 0 . 044 24 Ghasemian et al. T able S9. The AUC gap of the best 10 predictor s with the upper-bound A UC for synthetic data. Rank Algor ithm A ver age gap ( h ∆ A UC i ) 1 MDL (DC-SBM) 0 . 071 2 MDL (SBM) 0 . 075 3 Infomap 0 . 083 4 B-NR (SBM) 0 . 085 5 cICL-HKK 0 . 09 6 B-HKK 0 . 12 7 SP 0 . 121 8 B-NR (DC-SBM) 0 . 123 9 S-NB 0 . 138 10 PPR 0 . 139 T able S10. Link prediction performance (mean ± std. err .), measured by A UC, precision, and recall, for link prediction algorithms applied to the 45 synthetic networks. Algorithm AUC Precision Recall Q 0 . 69 ± 0 . 16 0 . 11 ± 0 . 14 0 . 66 ± 0 . 15 Q-MR 0 . 68 ± 0 . 17 0 . 11 ± 0 . 14 0 . 66 ± 0 . 15 Q-MP 0 . 69 ± 0 . 13 0 . 11 ± 0 . 1 0 . 65 ± 0 . 15 B-NR (SBM) 0 . 79 ± 0 . 14 0 . 16 ± 0 . 12 0 . 67 ± 0 . 24 B-NR (DC-SBM) 0 . 75 ± 0 . 15 0 . 17 ± 0 . 12 0 . 7 ± 0 . 16 cICL-HKK 0 . 79 ± 0 . 15 0 . 17 ± 0 . 14 0 . 61 ± 0 . 27 B-HKK 0 . 76 ± 0 . 15 0 . 13 ± 0 . 1 0 . 56 ± 0 . 26 Infomap 0 . 79 ± 0 . 17 0 . 18 ± 0 . 17 0 . 75 ± 0 . 16 MDL (SBM) 0 . 8 ± 0 . 16 0 . 17 ± 0 . 13 0 . 65 ± 0 . 3 MDL (DC-SBM) 0 . 8 ± 0 . 16 0 . 15 ± 0 . 11 0 . 76 ± 0 . 16 S-NB 0 . 74 ± 0 . 15 0 . 14 ± 0 . 13 0 . 67 ± 0 . 15 mean model-based 0 . 75 ± 0 . 16 0 . 15 ± 0 . 13 0 . 67 ± 0 . 21 mean indiv . topol. 0 . 62 ± 0 . 13 0 . 09 ± 0 . 11 0 . 51 ± 0 . 3 mean indiv . topol. & model 0 . 65 ± 0 . 15 0 . 1 ± 0 . 11 0 . 54 ± 0 . 29 emb-D W 0 . 68 ± 0 . 14 0 . 15 ± 0 . 14 0 . 36 ± 0 . 28 emb-vgae 0 . 7 ± 0 . 16 0 . 06 ± 0 . 03 0 . 72 ± 0 . 17 all topol. 0 . 81 ± 0 . 16 0 . 4 ± 0 . 26 0 . 46 ± 0 . 21 all model-based 0 . 81 ± 0 . 15 0 . 51 ± 0 . 33 0 . 38 ± 0 . 28 all embed. 0 . 79 ± 0 . 15 0 . 35 ± 0 . 27 0 . 29 ± 0 . 26 all topol. & model 0 . 83 ± 0 . 14 0 . 49 ± 0 . 33 0 . 42 ± 0 . 25 all topol. & embed. 0 . 82 ± 0 . 15 0 . 41 ± 0 . 28 0 . 42 ± 0 . 23 all model & embed. 0 . 83 ± 0 . 15 0 . 47 ± 0 . 31 0 . 36 ± 0 . 26 all topol., model & embed. 0 . 83 ± 0 . 15 0 . 48 ± 0 . 3 0 . 4 ± 0 . 24 Ghasemian et al. 25 T able S11. The detailed information of the top 5 topological predictors for synthetic data as presented in Fig. 2 in the manuscript. Region Model Number of clusters k Predictors low Poisson 1 [mLRA-appro x., PPR, P A, dLRA-approx., PR-j] low Poisson 2 [PPR, SP , dLRA-appro x., LRA-appro x., mLRA-approx.] low Poisson 4 [PPR, SP , LRA-appro x., mLRA-appro x., dLRA-approx.] low Poisson 16 [PPR, SP , dLRA-approx., mLRA-appro x., LRA-approx.] low Poisson 32 [PPR, SP , RA, LHN, mLRA] low Weibull 1 [PR-i, P A, DC-j, EC-i, KC-j] low Weibull 2 [SP , P A, PPR, LRA-approx., DC-i] low Weibull 4 [SP , dLRA-approx., LRA-appro x., mLRA-approx., P A] low Weibull 16 [SP , dLRA-appro x., mLRA-appro x., PPR, LRA-approx.] low Weibull 32 [PPR, SP , dLRA-appro x., AA, LRA-appro x.] low power law 1 [P A, LHN, CN, dLRA, dLRA-approx.] low power law 2 [P A, DC-i, PR-j, LHN, AND-i] low power law 4 [P A, PR-i, SP , DC-i, AA] low power law 16 [SP , LRA-appro x., dLRA-appro x., PPR, P A] low power law 32 [dLRA-approx., SP , PPR, LRA-approx., P A] moderate Poisson 1 [EC-i, SPBC-i, LNT -j, EC-j, AA] moderate Poisson 2 [LRA-approx., SP , AND-i, PPR, KC-i] moderate Poisson 4 [dLRA-approx., SP , mLRA-approx., LRA-appro x., PPR] moderate Poisson 16 [mLRA-approx., dLRA-appro x., LRA-appro x., SP , PPR] moderate Poisson 32 [PPR, SP , LRA-approx., dLRA, CN] moderate Weibull 1 [P A, DC-i, dLRA-approx., SPBC-j, mLRA-approx.] moderate Weibull 2 [P A, SP , PPR, CN, dLRA] moderate Weibull 4 [SP , P A, mLRA-approx., dLRA-appro x., PPR] moderate Weibull 16 [PPR, SP , dLRA-appro x., LRA-approx., P A] moderate Weibull 32 [dLRA-approx., AA, dLRA, CN, PPR] moderate power law 1 [P A, EC-i, CC-i, JC, DC-j] moderate power law 2 [P A, AA, RA, LHN, CN] moderate power law 4 [P A, LHN, SP , AA, RA] moderate power law 16 [PPR, dLRA-approx., SP , mLRA-approx., LRA-appro x.] moderate power law 32 [PPR, SP , CN, LHN, JC] high Poisson 1 [EC-i, DC-j, KC-j, LCC-j, RA] high Poisson 2 [P A, EC-i, DC-j, dLRA, KC-j] high Poisson 4 [LRA-approx., SP , PPR, DC-j, LNT -j] high Poisson 16 [SP , PPR, dLRA-approx., LRA-approx., mLRA-appro x.] high Poisson 32 [PPR, SP , mLRA-approx., dLRA-approx., AA] high Weibull 1 [SP , dLRA-approx., mLRA-approx., PPR, DC-i] high Weibull 2 [P A, dLRA-approx., SP , DC-j, PR-i] high Weibull 4 [P A, dLRA-approx., SP , DC-i, DC-j] high Weibull 16 [SP , PPR, dLRA-appro x., P A, AA] high Weibull 32 [RA, AA, P A, CN, dLRA] high power law 1 [P A, DC-i, PR-i, LCC-i, LNT -i] high power law 2 [P A, LHN, AA, dLRA, CN] high power law 4 [P A, SP , LHN, AA, RA] high power law 16 [PPR, P A, SP , AA, CN] high power law 32 [P A, SP , CN, dLRA, JC] 26 Ghasemian et al. T able S12. Average A UC, precision, and recall performances of the link prediction algorithms over 124 social networks as a subset of CommunityFitNet corpus. A random forest is used f or supervised stacking of methods. Here, the predictor s are adjusted for maximum F measure using a model selection through a cr oss validation on training set. The results are reported on 20% holdout test set. Algorithm AUC Precision Recall Q 0 . 89 ± 0 . 07 0 . 42 ± 0 . 13 0 . 85 ± 0 . 08 Q-MR 0 . 87 ± 0 . 07 0 . 38 ± 0 . 16 0 . 78 ± 0 . 07 Q-MP 0 . 86 ± 0 . 08 0 . 25 ± 0 . 07 0 . 83 ± 0 . 09 B-NR (SBM) 0 . 93 ± 0 . 06 0 . 3 ± 0 . 08 0 . 85 ± 0 . 12 B-NR (DC-SBM) 0 . 93 ± 0 . 07 0 . 28 ± 0 . 08 0 . 88 ± 0 . 08 cICL-HKK 0 . 93 ± 0 . 08 0 . 34 ± 0 . 1 0 . 85 ± 0 . 14 B-HKK 0 . 88 ± 0 . 07 0 . 17 ± 0 . 05 0 . 79 ± 0 . 17 Infomap 0 . 91 ± 0 . 04 0 . 29 ± 0 . 08 0 . 83 ± 0 . 05 MDL (SBM) 0 . 94 ± 0 . 07 0 . 31 ± 0 . 09 0 . 87 ± 0 . 16 MDL (DC-SBM) 0 . 93 ± 0 . 09 0 . 26 ± 0 . 09 0 . 89 ± 0 . 11 S-NB 0 . 94 ± 0 . 07 0 . 3 ± 0 . 1 0 . 87 ± 0 . 08 mean model-based 0 . 91 ± 0 . 08 0 . 3 ± 0 . 12 0 . 84 ± 0 . 12 mean indiv . topol. 0 . 64 ± 0 . 19 0 . 2 ± 0 . 27 0 . 56 ± 0 . 33 mean indiv . topol. & model 0 . 7 ± 0 . 21 0 . 22 ± 0 . 25 0 . 62 ± 0 . 32 emd-D W 0 . 95 ± 0 . 1 0 . 45 ± 0 . 16 0 . 92 ± 0 . 13 emb-vgae 0 . 95 ± 0 . 08 0 . 09 ± 0 . 02 0 . 96 ± 0 . 09 all topol. 0 . 97 ± 0 . 08 0 . 89 ± 0 . 21 0 . 88 ± 0 . 2 all model-based 0 . 95 ± 0 . 07 0 . 76 ± 0 . 2 0 . 68 ± 0 . 17 all embed. 0 . 95 ± 0 . 11 0 . 75 ± 0 . 23 0 . 74 ± 0 . 23 all topol. & model 0 . 98 ± 0 . 06 0 . 89 ± 0 . 22 0 . 88 ± 0 . 19 all topol. & embed. 0 . 96 ± 0 . 1 0 . 86 ± 0 . 22 0 . 83 ± 0 . 25 all model & embed. 0 . 96 ± 0 . 09 0 . 78 ± 0 . 21 0 . 74 ± 0 . 22 all topol., model & embed. 0 . 97 ± 0 . 09 0 . 86 ± 0 . 23 0 . 84 ± 0 . 23 T able S13. Average A UC, precision, and recall perf ormances of the link prediction algorithms over 179 biological netw orks as a subset of CommunityFitNet corpus. A random forest is used f or supervised stacking of methods. Here, the predictor s are adjusted for maximum F measure using a model selection through a cr oss validation on training set. The results are reported on 20% holdout test set. Algorithm AUC Precision Recall Q 0 . 61 ± 0 . 12 0 . 06 ± 0 . 09 0 . 58 ± 0 . 13 Q-MR 0 . 57 ± 0 . 11 0 . 05 ± 0 . 09 0 . 56 ± 0 . 12 Q-MP 0 . 59 ± 0 . 09 0 . 06 ± 0 . 07 0 . 52 ± 0 . 13 B-NR (SBM) 0 . 78 ± 0 . 13 0 . 09 ± 0 . 09 0 . 6 ± 0 . 21 B-NR (DC-SBM) 0 . 72 ± 0 . 17 0 . 1 ± 0 . 09 0 . 63 ± 0 . 21 cICL-HKK 0 . 74 ± 0 . 13 0 . 09 ± 0 . 09 0 . 47 ± 0 . 24 B-HKK 0 . 72 ± 0 . 14 0 . 11 ± 0 . 12 0 . 39 ± 0 . 26 Infomap 0 . 7 ± 0 . 12 0 . 07 ± 0 . 09 0 . 68 ± 0 . 11 MDL (SBM) 0 . 77 ± 0 . 14 0 . 11 ± 0 . 1 0 . 51 ± 0 . 29 MDL (DC-SBM) 0 . 82 ± 0 . 09 0 . 09 ± 0 . 07 0 . 75 ± 0 . 11 S-NB 0 . 72 ± 0 . 14 0 . 09 ± 0 . 1 0 . 64 ± 0 . 16 mean model-based 0 . 7 ± 0 . 15 0 . 08 ± 0 . 09 0 . 58 ± 0 . 21 mean indiv . topol. 0 . 59 ± 0 . 11 0 . 06 ± 0 . 08 0 . 51 ± 0 . 35 mean indiv . topol. & model 0 . 62 ± 0 . 13 0 . 06 ± 0 . 08 0 . 52 ± 0 . 32 emd-D W 0 . 59 ± 0 . 15 0 . 07 ± 0 . 08 0 . 39 ± 0 . 25 emb-vgae 0 . 63 ± 0 . 16 0 . 04 ± 0 . 06 0 . 62 ± 0 . 2 all topol. 0 . 83 ± 0 . 1 0 . 27 ± 0 . 23 0 . 34 ± 0 . 24 all model-based 0 . 79 ± 0 . 12 0 . 29 ± 0 . 29 0 . 24 ± 0 . 25 all embed. 0 . 68 ± 0 . 16 0 . 17 ± 0 . 25 0 . 12 ± 0 . 17 all topol. & model 0 . 83 ± 0 . 1 0 . 35 ± 0 . 31 0 . 23 ± 0 . 23 all topol. & embed. 0 . 79 ± 0 . 13 0 . 23 ± 0 . 27 0 . 18 ± 0 . 2 all model & embed. 0 . 79 ± 0 . 14 0 . 23 ± 0 . 26 0 . 18 ± 0 . 2 all topol., model & embed. 0 . 79 ± 0 . 15 0 . 25 ± 0 . 27 0 . 18 ± 0 . 2 Ghasemian et al. 27 T able S14. Average A UC, precision, and recall perf ormances of the link prediction algorithms over 122 economic netw orks as a subset of CommunityFitNet corpus. A random forest is used f or supervised stacking of methods. Here, the predictor s are adjusted for maximum F measure using a model selection through a cr oss validation on training set. The results are reported on 20% holdout test set. Algorithm AUC Precision Recall Q 0 . 69 ± 0 . 06 0 . 04 ± 0 . 02 0 . 69 ± 0 . 08 Q-MR 0 . 7 ± 0 . 06 0 . 05 ± 0 . 02 0 . 67 ± 0 . 06 Q-MP 0 . 53 ± 0 . 06 0 . 03 ± 0 . 02 0 . 51 ± 0 . 11 B-NR (SBM) 0 . 8 ± 0 . 05 0 . 07 ± 0 . 05 0 . 6 ± 0 . 16 B-NR (DC-SBM) 0 . 51 ± 0 . 1 0 . 04 ± 0 . 05 0 . 35 ± 0 . 13 cICL-HKK 0 . 79 ± 0 . 06 0 . 06 ± 0 . 04 0 . 45 ± 0 . 12 B-HKK 0 . 79 ± 0 . 06 0 . 06 ± 0 . 03 0 . 44 ± 0 . 11 Infomap 0 . 66 ± 0 . 05 0 . 05 ± 0 . 04 0 . 62 ± 0 . 06 MDL (SBM) 0 . 78 ± 0 . 05 0 . 07 ± 0 . 05 0 . 49 ± 0 . 14 MDL (DC-SBM) 0 . 85 ± 0 . 06 0 . 09 ± 0 . 04 0 . 79 ± 0 . 06 S-NB 0 . 49 ± 0 . 11 0 . 03 ± 0 . 05 0 . 55 ± 0 . 07 mean model-based 0 . 69 ± 0 . 14 0 . 05 ± 0 . 04 0 . 56 ± 0 . 16 mean indiv . topol. 0 . 58 ± 0 . 12 0 . 04 ± 0 . 06 0 . 6 ± 0 . 39 mean indiv . topol. & model 0 . 6 ± 0 . 13 0 . 04 ± 0 . 05 0 . 59 ± 0 . 35 emd-D W 0 . 37 ± 0 . 11 0 . 09 ± 0 . 06 0 . 12 ± 0 . 16 emb-vgae 0 . 56 ± 0 . 07 0 . 03 ± 0 . 02 0 . 55 ± 0 . 1 all topol. 0 . 83 ± 0 . 05 0 . 31 ± 0 . 08 0 . 28 ± 0 . 14 all model-based 0 . 84 ± 0 . 07 0 . 27 ± 0 . 26 0 . 14 ± 0 . 17 all embed. 0 . 78 ± 0 . 07 0 . 17 ± 0 . 1 0 . 34 ± 0 . 18 all topol. & model 0 . 87 ± 0 . 05 0 . 38 ± 0 . 25 0 . 12 ± 0 . 15 all topol. & embed. 0 . 86 ± 0 . 07 0 . 3 ± 0 . 1 0 . 41 ± 0 . 15 all model & embed. 0 . 87 ± 0 . 09 0 . 21 ± 0 . 12 0 . 42 ± 0 . 23 all topol., model & embed. 0 . 88 ± 0 . 1 0 . 31 ± 0 . 11 0 . 41 ± 0 . 18 T able S15. A verage A UC, precision, and recall performances of the link prediction algorithms over 67 technological networks as a subset of CommunityFitNet corpus. A random forest is used f or supervised stacking of methods. Here, the predictor s are adjusted for maximum F measure using a model selection through a cr oss validation on training set. The results are reported on 20% holdout test set. Algorithm AUC Precision Recall Q 0 . 63 ± 0 . 11 0 . 04 ± 0 . 03 0 . 58 ± 0 . 12 Q-MR 0 . 56 ± 0 . 11 0 . 03 ± 0 . 02 0 . 54 ± 0 . 09 Q-MP 0 . 62 ± 0 . 08 0 . 04 ± 0 . 03 0 . 57 ± 0 . 08 B-NR (SBM) 0 . 74 ± 0 . 11 0 . 06 ± 0 . 05 0 . 62 ± 0 . 2 B-NR (DC-SBM) 0 . 67 ± 0 . 12 0 . 06 ± 0 . 06 0 . 63 ± 0 . 13 cICL-HKK 0 . 75 ± 0 . 1 0 . 08 ± 0 . 08 0 . 59 ± 0 . 18 B-HKK 0 . 71 ± 0 . 11 0 . 08 ± 0 . 08 0 . 5 ± 0 . 2 Infomap 0 . 67 ± 0 . 13 0 . 05 ± 0 . 04 0 . 6 ± 0 . 12 MDL (SBM) 0 . 7 ± 0 . 15 0 . 07 ± 0 . 07 0 . 45 ± 0 . 32 MDL (DC-SBM) 0 . 77 ± 0 . 1 0 . 07 ± 0 . 07 0 . 68 ± 0 . 12 S-NB 0 . 65 ± 0 . 09 0 . 04 ± 0 . 04 0 . 56 ± 0 . 1 mean model-based 0 . 68 ± 0 . 13 0 . 06 ± 0 . 06 0 . 58 ± 0 . 17 mean indiv . topol. 0 . 58 ± 0 . 09 0 . 05 ± 0 . 07 0 . 48 ± 0 . 34 mean indiv . topol. & model 0 . 6 ± 0 . 11 0 . 05 ± 0 . 07 0 . 5 ± 0 . 31 emd-D W 0 . 65 ± 0 . 1 0 . 07 ± 0 . 1 0 . 26 ± 0 . 17 emb-vgae 0 . 64 ± 0 . 1 0 . 03 ± 0 . 02 0 . 63 ± 0 . 12 all topol. 0 . 79 ± 0 . 1 0 . 24 ± 0 . 19 0 . 27 ± 0 . 22 all model-based 0 . 72 ± 0 . 13 0 . 28 ± 0 . 33 0 . 13 ± 0 . 15 all embed. 0 . 71 ± 0 . 11 0 . 2 ± 0 . 21 0 . 13 ± 0 . 13 all topol. & model 0 . 79 ± 0 . 09 0 . 32 ± 0 . 31 0 . 18 ± 0 . 17 all topol. & embed. 0 . 77 ± 0 . 11 0 . 24 ± 0 . 23 0 . 17 ± 0 . 15 all model & embed. 0 . 77 ± 0 . 11 0 . 24 ± 0 . 23 0 . 16 ± 0 . 16 all topol., model & embed. 0 . 78 ± 0 . 1 0 . 27 ± 0 . 23 0 . 17 ± 0 . 15 28 Ghasemian et al. T able S16. A verage A UC, precision, and recall perf ormances of the link prediction algorithms over 18 information networks as a subset of CommunityFitNet corpus. A random forest is used f or supervised stacking of methods. Here, the predictor s are adjusted for maximum F measure using a model selection through a cr oss validation on training set. The results are reported on 20% holdout test set. Algorithm AUC Precision Recall Q 0 . 61 ± 0 . 1 0 . 06 ± 0 . 08 0 . 58 ± 0 . 13 Q-MR 0 . 59 ± 0 . 1 0 . 04 ± 0 . 05 0 . 57 ± 0 . 15 Q-MP 0 . 59 ± 0 . 1 0 . 06 ± 0 . 07 0 . 54 ± 0 . 11 B-NR (SBM) 0 . 79 ± 0 . 14 0 . 13 ± 0 . 2 0 . 58 ± 0 . 2 B-NR (DC-SBM) 0 . 72 ± 0 . 14 0 . 12 ± 0 . 19 0 . 61 ± 0 . 17 cICL-HKK 0 . 8 ± 0 . 12 0 . 15 ± 0 . 2 0 . 59 ± 0 . 24 B-HKK 0 . 76 ± 0 . 13 0 . 18 ± 0 . 19 0 . 46 ± 0 . 24 Infomap 0 . 79 ± 0 . 08 0 . 09 ± 0 . 1 0 . 74 ± 0 . 11 MDL (SBM) 0 . 8 ± 0 . 13 0 . 16 ± 0 . 2 0 . 57 ± 0 . 25 MDL (DC-SBM) 0 . 81 ± 0 . 12 0 . 13 ± 0 . 2 0 . 75 ± 0 . 13 S-NB 0 . 7 ± 0 . 12 0 . 08 ± 0 . 08 0 . 6 ± 0 . 14 mean model-based 0 . 72 ± 0 . 15 0 . 11 ± 0 . 16 0 . 6 ± 0 . 2 mean indiv . topol. 0 . 61 ± 0 . 12 0 . 07 ± 0 . 13 0 . 48 ± 0 . 31 mean indiv . topol. & model 0 . 63 ± 0 . 13 0 . 08 ± 0 . 14 0 . 51 ± 0 . 29 emd-D W 0 . 61 ± 0 . 15 0 . 08 ± 0 . 13 0 . 33 ± 0 . 21 emb-vgae 0 . 65 ± 0 . 15 0 . 04 ± 0 . 04 0 . 65 ± 0 . 19 all topol. 0 . 83 ± 0 . 12 0 . 32 ± 0 . 25 0 . 39 ± 0 . 25 all model-based 0 . 8 ± 0 . 11 0 . 38 ± 0 . 33 0 . 18 ± 0 . 18 all embed. 0 . 77 ± 0 . 12 0 . 3 ± 0 . 28 0 . 17 ± 0 . 27 all topol. & model 0 . 84 ± 0 . 11 0 . 39 ± 0 . 3 0 . 23 ± 0 . 23 all topol. & embed. 0 . 81 ± 0 . 15 0 . 32 ± 0 . 27 0 . 27 ± 0 . 26 all model & embed. 0 . 83 ± 0 . 12 0 . 34 ± 0 . 32 0 . 2 ± 0 . 22 all topol., model & embed. 0 . 83 ± 0 . 12 0 . 36 ± 0 . 28 0 . 26 ± 0 . 27 T able S17. Average A UC, precision, and recall perf ormances of the link prediction algorithms over 38 transportation networks as a subset of CommunityFitNet corpus. A random forest is used for supervised stacking of methods. Here, the predictors are adjusted for maximum F measure using a model selection through a cr oss validation on training set. The results are reported on 20% holdout test set. Algorithm AUC Precision Recall Q 0 . 68 ± 0 . 09 0 . 07 ± 0 . 07 0 . 6 ± 0 . 09 Q-MR 0 . 63 ± 0 . 08 0 . 05 ± 0 . 04 0 . 54 ± 0 . 08 Q-MP 0 . 63 ± 0 . 1 0 . 07 ± 0 . 07 0 . 56 ± 0 . 11 B-NR (SBM) 0 . 68 ± 0 . 14 0 . 09 ± 0 . 11 0 . 44 ± 0 . 31 B-NR (DC-SBM) 0 . 55 ± 0 . 23 0 . 09 ± 0 . 1 0 . 48 ± 0 . 25 cICL-HKK 0 . 69 ± 0 . 13 0 . 1 ± 0 . 14 0 . 52 ± 0 . 26 B-HKK 0 . 65 ± 0 . 13 0 . 09 ± 0 . 15 0 . 36 ± 0 . 28 Infomap 0 . 6 ± 0 . 13 0 . 08 ± 0 . 1 0 . 53 ± 0 . 12 MDL (SBM) 0 . 64 ± 0 . 15 0 . 08 ± 0 . 11 0 . 33 ± 0 . 35 MDL (DC-SBM) 0 . 81 ± 0 . 07 0 . 09 ± 0 . 1 0 . 72 ± 0 . 1 S-NB 0 . 66 ± 0 . 12 0 . 07 ± 0 . 08 0 . 61 ± 0 . 1 mean model-based 0 . 66 ± 0 . 15 0 . 08 ± 0 . 1 0 . 52 ± 0 . 24 mean indiv . topol. 0 . 58 ± 0 . 1 0 . 09 ± 0 . 15 0 . 48 ± 0 . 35 mean indiv . topol. & model 0 . 6 ± 0 . 12 0 . 09 ± 0 . 14 0 . 49 ± 0 . 33 emd-D W 0 . 62 ± 0 . 15 0 . 2 ± 0 . 21 0 . 29 ± 0 . 2 emb-vgae 0 . 66 ± 0 . 11 0 . 04 ± 0 . 04 0 . 67 ± 0 . 14 all topol. 0 . 82 ± 0 . 09 0 . 29 ± 0 . 28 0 . 34 ± 0 . 25 all model-based 0 . 76 ± 0 . 11 0 . 29 ± 0 . 28 0 . 22 ± 0 . 23 all embed. 0 . 73 ± 0 . 1 0 . 33 ± 0 . 28 0 . 18 ± 0 . 16 all topol. & model 0 . 83 ± 0 . 09 0 . 34 ± 0 . 33 0 . 25 ± 0 . 24 all topol. & embed. 0 . 79 ± 0 . 12 0 . 33 ± 0 . 28 0 . 24 ± 0 . 22 all model & embed. 0 . 78 ± 0 . 11 0 . 35 ± 0 . 27 0 . 22 ± 0 . 21 all topol., model & embed. 0 . 81 ± 0 . 11 0 . 35 ± 0 . 28 0 . 24 ± 0 . 21 Ghasemian et al. 29 T able S18. Avera ge A UC perf ormance of the link prediction supervised stac king methods over 548 networks as a subset of Comm unityFitNet corpus. A random forest is used f or supervised stacking of methods. Here, the predictors are adjusted for maxim um A UC using a model selection through a cr oss validation on training set. The results are reported on 20% holdout test set. Algorithm A UC Precision Recall all topol. 0 . 88 ± 0 . 1 0 . 32 ± 0 . 31 0 . 65 ± 0 . 27 all model-based 0 . 87 ± 0 . 11 0 . 25 ± 0 . 26 0 . 64 ± 0 . 28 all embed. 0 . 78 ± 0 . 17 0 . 27 ± 0 . 33 0 . 25 ± 0 . 35 all topol. & model 0 . 89 ± 0 . 09 0 . 33 ± 0 . 32 0 . 64 ± 0 . 28 all topol. & embed. 0 . 85 ± 0 . 15 0 . 35 ± 0 . 33 0 . 47 ± 0 . 35 all model & embed. 0 . 85 ± 0 . 14 0 . 31 ± 0 . 31 0 . 46 ± 0 . 34 all topol., model & embed. 0 . 87 ± 0 . 13 0 . 36 ± 0 . 32 0 . 51 ± 0 . 34 T able S19. Average A UC, precision, and recall performances of the link prediction algorithms over 548 networks as a subset of Community- FitNet corpus. A XGBoost is used for super vised stacking of methods. Here, the predictors are adjusted for maximum F measure using a model selection through a cr oss validation on training set. The results are reported on 20% holdout test set. Algorithm A UC Precision Recall all topol. 0 . 85 ± 0 . 11 0 . 45 ± 0 . 32 0 . 39 ± 0 . 33 all model-based 0 . 82 ± 0 . 13 0 . 31 ± 0 . 27 0 . 37 ± 0 . 31 all embed. 0 . 77 ± 0 . 16 0 . 32 ± 0 . 3 0 . 35 ± 0 . 33 all topol. & model 0 . 85 ± 0 . 12 0 . 45 ± 0 . 33 0 . 38 ± 0 . 34 all topol. & embed. 0 . 83 ± 0 . 14 0 . 41 ± 0 . 34 0 . 38 ± 0 . 34 all model & embed. 0 . 82 ± 0 . 14 0 . 34 ± 0 . 3 0 . 39 ± 0 . 33 all topol., model & embed. 0 . 84 ± 0 . 13 0 . 41 ± 0 . 34 0 . 38 ± 0 . 35 T able S20. Average A UC, precision, and recall performances of the link prediction algorithms over 548 networks as a subset of Community- FitNet corpus. A XGBoost is used f or super vised stacking of methods. Here , the predictor s are adjusted for maximum A UC using a model selection through a cr oss validation on training set. The results are reported on 20% holdout test set. Algorithm A UC Precision Recall all topol. 0 . 86 ± 0 . 11 0 . 38 ± 0 . 32 0 . 5 ± 0 . 35 all model-based 0 . 84 ± 0 . 12 0 . 24 ± 0 . 25 0 . 55 ± 0 . 34 all embed. 0 . 77 ± 0 . 16 0 . 31 ± 0 . 31 0 . 32 ± 0 . 36 all topol. & model 0 . 87 ± 0 . 11 0 . 38 ± 0 . 33 0 . 49 ± 0 . 36 all topol. & embed. 0 . 84 ± 0 . 14 0 . 43 ± 0 . 34 0 . 36 ± 0 . 37 all model & embed. 0 . 83 ± 0 . 13 0 . 31 ± 0 . 3 0 . 44 ± 0 . 36 all topol., model & embed. 0 . 84 ± 0 . 13 0 . 43 ± 0 . 35 0 . 36 ± 0 . 37 T able S21. Average A UC, precision, and recall performances of the link prediction algorithms over 548 networks as a subset of Community- FitNet corpus. An AdaBoost is used for supervised stacking of methods. Here, the predictors are adjusted for maximum F measure using a model selection through a cr oss validation on training set. The results are reported on 20% holdout test set. Algorithm A UC Precision Recall all topol. 0 . 82 ± 0 . 13 0 . 4 ± 0 . 34 0 . 42 ± 0 . 33 all model-based 0 . 79 ± 0 . 14 0 . 31 ± 0 . 31 0 . 4 ± 0 . 31 all embed. 0 . 74 ± 0 . 16 0 . 27 ± 0 . 32 0 . 36 ± 0 . 3 all topol. & model 0 . 81 ± 0 . 13 0 . 38 ± 0 . 36 0 . 43 ± 0 . 34 all topol. & embed. 0 . 8 ± 0 . 14 0 . 33 ± 0 . 35 0 . 45 ± 0 . 32 all model & embed. 0 . 79 ± 0 . 14 0 . 29 ± 0 . 33 0 . 46 ± 0 . 32 all topol., model & embed. 0 . 81 ± 0 . 14 0 . 33 ± 0 . 35 0 . 44 ± 0 . 33 T able S22. Average A UC, precision, and recall performances of the link prediction algorithms over 548 networks as a subset of Community- FitNet corpus. An AdaBoost is used for supervised stacking of methods. Here, the predictors are adjusted for maxim um A UC using a model selection through a cr oss validation on training set. The results are reported on 20% holdout test set. Algorithm A UC Precision Recall all topol. 0 . 86 ± 0 . 12 0 . 3 ± 0 . 3 0 . 62 ± 0 . 3 all model-based 0 . 83 ± 0 . 13 0 . 25 ± 0 . 29 0 . 57 ± 0 . 32 all embed. 0 . 76 ± 0 . 16 0 . 25 ± 0 . 33 0 . 41 ± 0 . 32 all topol. & model 0 . 85 ± 0 . 12 0 . 32 ± 0 . 35 0 . 58 ± 0 . 34 all topol. & embed. 0 . 82 ± 0 . 14 0 . 31 ± 0 . 36 0 . 51 ± 0 . 35 all model & embed. 0 . 8 ± 0 . 14 0 . 26 ± 0 . 31 0 . 5 ± 0 . 33 all topol., model & embed. 0 . 82 ± 0 . 13 0 . 29 ± 0 . 35 0 . 51 ± 0 . 36 30 Ghasemian et al.
Original Paper
Loading high-quality paper...
Comments & Academic Discussion
Loading comments...
Leave a Comment