Teaching deep neural networks to localize single molecules for super-resolution microscopy
Single-molecule localization fluorescence microscopy constructs super-resolution images by sequential imaging and computational localization of sparsely activated fluorophores. Accurate and efficient fluorophore localization algorithms are key to the…
Authors: Artur Speiser, Lucas-Raphael M"uller, Ulf Matti
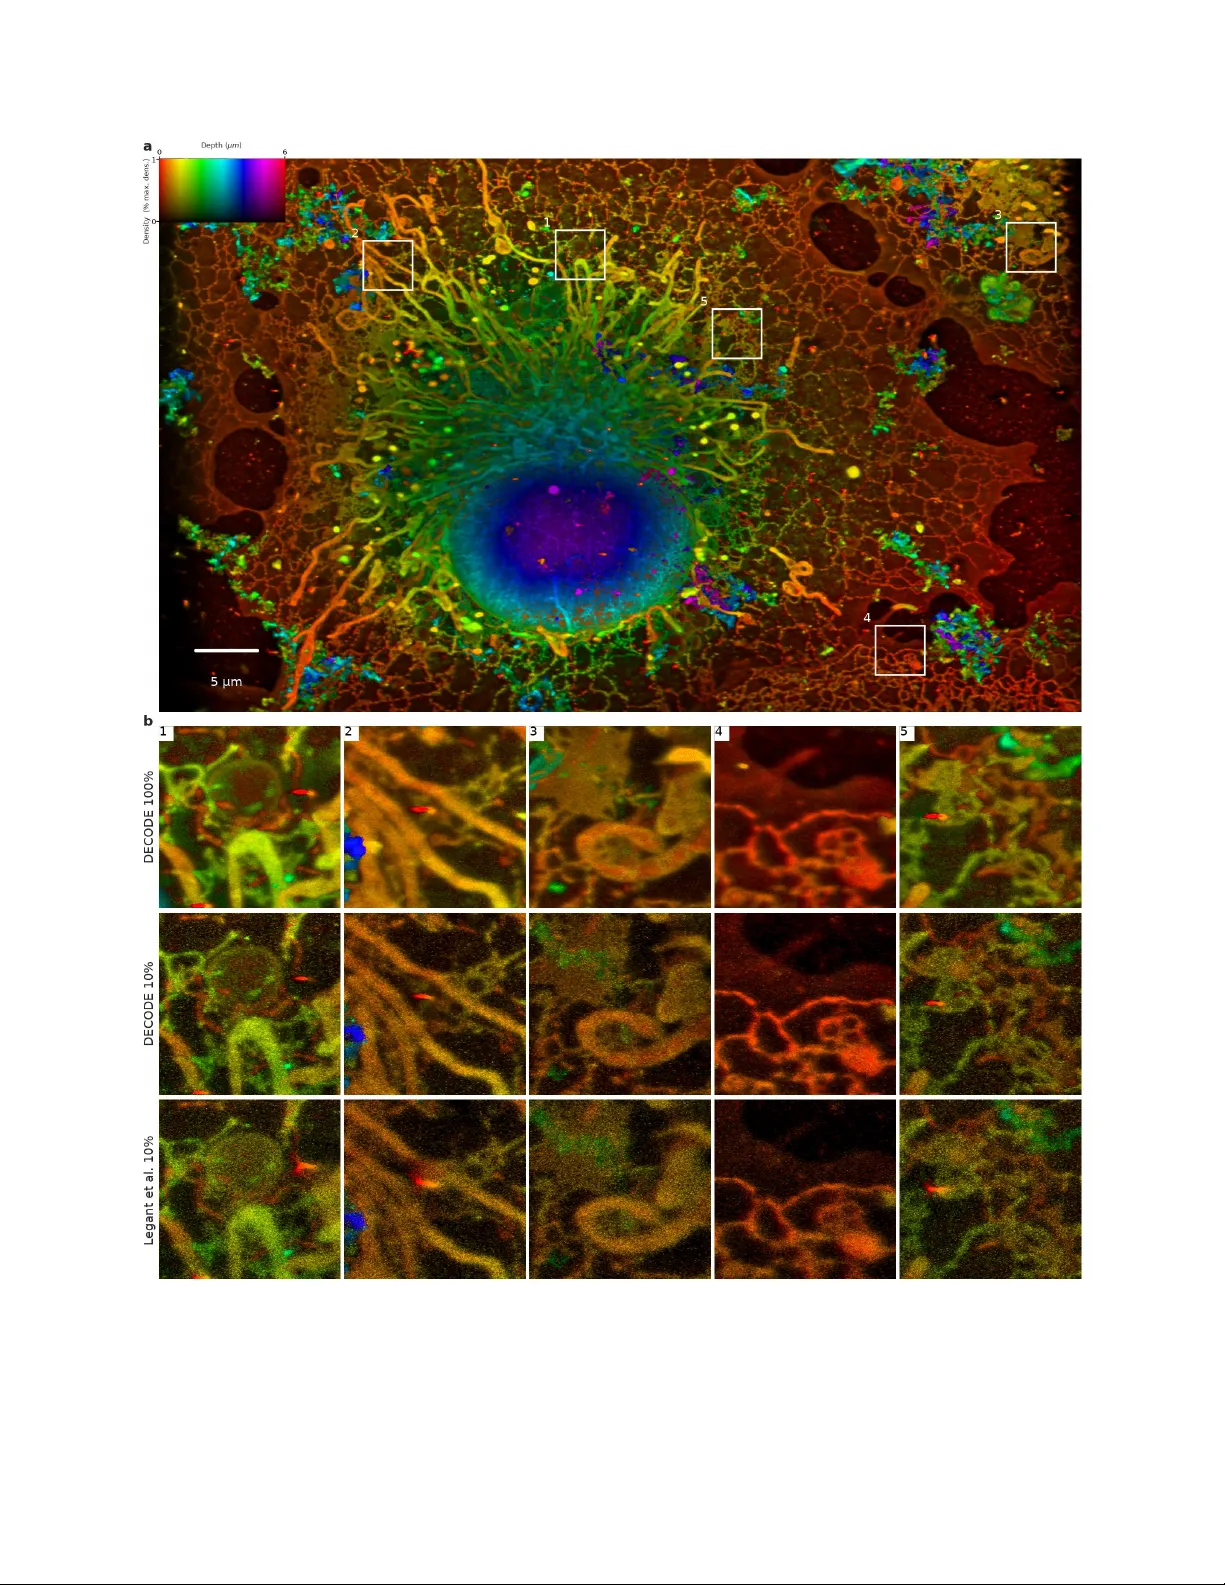
T eaching deep neur al networks to localize single molecules for super-r esolution micr oscop y Artur Speiser 1,2,3 , Lucas-Raphael Müller 4,5 , Ulf Matti 4 , Christopher J. Obara 8 , Wesle y R. Legant 9,10 , Jonas Ries 4 , Jakob H. Mack e 1,2,6,7,* , Srinivas C. T ur aga 8,* 1 Computational Neuroengineering, Department of Electrical and Computer Engineering, T echnical University of Munich, Munich, Germany; 2 resear ch center caesar, an associate of the Max Planck Society , Bonn, Germany; 3 I nternational Max Planck Research School ‘ Brain and Behavior ’ , Bonn/Florida; 4 European Molecular Biology Laboratory , Heidelber g, Germany; 5 Ruprecht Karl University of Heidelber g, Heidelberg, Germany; 6 Excellence Cluster Machine Learning, T übingen University, Germany; 7 Max Planck I nstitute for I ntelligent Systems, T übingen, Germany; 8 HHM I Janelia Research Campus, Ashburn V A, USA; 9 Department of Pharmacology , University of North Carolina, Chapel Hill, USA; 10 Department of Biomedical Engineering, University of North Carolina, Chapel Hill, USA Abstract Single-molecule localization fl uorescence micr oscopy constructs super-r esolution images by sequential imaging and computational localization of sparsely activated fl uorophor es. Accurate and e ffi cient fl uor ophore localization algorithms are k ey to the success of this computational micr oscopy method. We pr esent a novel localization algorithm based on deep learning which signi fi cantly impro ves upon the state of the art. Our contributions are a novel network architectur e for simultaneous detection and localization, and new loss function which phrases detection and localization as a Bayesian inference problem, and thus allows the network to pro vide uncertainty-estimates. I n contrast to standard methods which independently process imaging frames, our network architectur e uses temporal context from multiple sequentially imaged frames to detect and localize molecules. We demonstrate the po wer of our method across a variety of datasets, imaging modalities, signal to noise ratios, and fl uorophore densities. While existing localization algorithms can achieve optimal localization accuracy at low fl uorophore densities, they are confounded by high densities. Our method is the fi rst deep-learning based approach which achieves state-of-the-art on the SMLM2016 challenge. I t achieves the best scores on 12 out of 12 data-sets when comparing both detection accuracy and precision, and ex cels at high densities. Finally , we investigate how unsupervised learning can be used to make the network robust against mismatch between simulated and real data. The lessons learned here are more generally relevant for the training of deep networks to solve challenging Bayesian inverse problems on spatially extended domains in biology and physics. * These authors contributed equally to this work For correspondence: Artur.Speiser@tum.de 1 of 23 I ntroduction Super-resolution microscopy techniques such as stochastic optical reconstruction microscop y (STORM) [ 1 ] and photo- activated localization microscopy (P ALM) [ 2 ] have made it possible to observe biological structures and processes that where not accessible through optical microscopy due to the Abbe di ff raction limit. These techniques, commonly referr ed to as Single Molecule Localization Microscopy (SMLM), critically rely on computational methods for accurately localizing sparsely activated fl uorophores [ 3 ] (Fig. 1a). State-of-the-art localization algorithms typically operate in two steps: fi rst, single fl uorophor e candidates are detected and extr acted from the images, and second, fl uorophores are localized by fi tting a high resolution “ generative ” model of the point-spread function (PSF) to the image. T o deal with overlapping fl uorophores, peaks are either rejected based on a statistical test for the pr esence of multiple fl uorophor es (single emitter fi tting [ 4 – 6 ]), or emitters are added throughout the fi tting procedure until a predetermined threshold for the goodness of fi t is met (multi-emitter fi tting [ 7 – 9 ]). Mor e recently , deep learning approaches have been used to perform the localization step [10, 11]. This general approach can be highly e ff ective under favourable conditions of high SNR and low fl uorophore density [ 12 ]. Ho wever, even multi-emitter approaches pr oduce sub-par results in datasets with high fl uorophore densities. As was noted in a systematic comparison of multiple algorithms on public benchmark data-sets (SMLM2016) [ 13 ], they perform even worse than single-emitter algorithms for 3D data. These limitations imply that current fi tting-based approaches to SMLM can not be applied to experiments with high emitter densities, which would be critical for the investigation of living or moving structures. Furthermor e, most previous algorithms base their predictions on a single observed image. Thus, they ignore potentially useful information in the sequence of imaging frames which can enable detecting and separating fl uorophor es in cro wded high density data by taking into account their temporal dynamics. Nevertheless, attempts at using information from multiple images during inference ar e rare [ 14 , 15 ], and have not yet yielded state-of-the-art performance. Deep learning methods have revolutionized computer vision, and biological image analysis is no di ff erent [ 16 – 19 ]. Many of these advances are the result of the supervised training of deep neural networks using large training datasets of pairs of example input images and desired output predictions. While the analysis of SMLM data is not a standard supervised learning problem, ground truth localization data for training a deep network can be gener ated by simulating the imaging of fl uorophores. The two fi rst applications of deep learning to SMLM, DeepSTORM3D [ 20 ] and DeepLoco [ 21 ] took this approach and used simulated synthetic SMLM to train deep networks to localize single molecules, an approach we call “ simulator learning ” (SL) [ 22 ] in this paper. These two deep learning methods di ff er in the output repr esentation used by the networks. DeepST ORM3D directly predicts a high resolution 3D volume which has the advantage of simplicity but the disadvantage that incr easing the resolution of the predictions requires increasing the computation. I n contrast, DeepLoco predicts continuous localizations for a fi xed number of particles, and has the advantage that its computational complexity scales with the maximum number of possible particles, rather than size of the volume predicted. While both approaches produce detection uncertainty, neither pr edicts localization uncertainty . We pr esent a new method for fast, e ffi cient, and accurate single-molecule localization based on a new deep neural network architectur e we call DECODE (DEep COntext DEpendent) which achieves state of the art performance. DECODE also uses simulator learning, but is based on three main innovations: First, we introduce a novel network architectur e which uses temporal conte xt for inferring fl uorophore locations. This single DECODE network is trained to pr oduce accurate pr edictions at both low and high densities, alle viating the need for analysis methods which deal with these ‘ single emitter ’ and ‘ multi emitter ’ cases separ ately . Second, we phrase localization as a Bayesian inference pr oblem, and pro vide a novel cost-function which makes it possible for the DECODE network to also predict uncertainty-estimates for each localized fl uorophor e. These uncertainty-estimators can, for example, be used for post-processing algorithms. Thir d, simulator learning depends on the faithfulness of the generative model, and might show reduced performance when there is a mismatch between the simulated and experimental data. W e provide an alternative training approach, Combined Learning (CL) which combines Simulator Learning and Variational Auto Encoder learning (AEL) [23, 24], and evaluate its performance on simulated data. We apply DECODE to data-sets fr om the public SMLM 2016 challenge [ 13 ], and show that it outperforms all existing methods which have been evaluated on this challenge so far, on 12 out of 12 data-sets for which DECODE is applicable [ 13 ]. Our DECODE method leads to a improvement in performance which is 7 × as big as the improvement of the 2 of 23 Biological sample Reconstruction Activated fluorophores Localized fluorophores Image sequence Stochastic activation Rendering Imaging Localization Detection and localization network Point spread function Simultaneous detection and localization Detect particles Localize particles DECODE CSpline Frame analysis module Temporal context module a b c X-Y X-Z False negative True positive I t + 1 I t I t − 1 h t + 1 h t h t − 1 σ z t σ y t σ x t Δ z t Δ y t Δ x t σ α t α t p t σ z σ y Δ y Δ x Δ z σ x Figure 1. Source reconstruction for Single-Molecule Localization Microscop y (SMLM): a) Fluorophores are stochastically activated and recor ded using fl uorescence microscop y. A localization algorithm infers the underlying sources from noisy and blurred imaging measurements. Rendering methods turn inferred sources into an estimate of the underlying structure. b) Classical image-processing algorithms for SMLM source localization (such as CSpline [7]) are based on a two-step approach (detect/localize), whereas our approach (DECODE) uses a neural network for simultaneous detection and localization. c) DECODE network for simultaneous detection and localization of fl uorophores. Hidden features are extr acted from each consecutive imaging frame by the fi rst stage of the network by the frame analysis module . These frame speci fi c features are integrated by a tempor al context module leading to a prediction of 8 output maps: a binary map of fl uorophor e detections p t , a map predicting the brightness of the corresponding detected fl uorophore α t , three maps of the three spatial coordinates of the detected fl uorophore , relative to the to the center of the detected pixel, ∆ x t , ∆ y t , ∆ z t , and three maps of the associated uncertainties (standar d de viations) σ x t , σ y t , σ z t . second best algorithm over the third best algorithm. Performance bene fi ts are particular pronounced on high-density data-sets, on where the advantage from using DECODE increases to 10 × over the next best method . We also apply DECODE to four datasets where the same sample of labeled T ubulin-A647 protein was imaged with di ff erent densities of fl uorophor e activation, and demonstrate that we achieve high quality reconstructions with 10x less imaging time by accurately localizing fl uorophores at high densities. T o demonstrate the fl exibility of our approach, we adapted it to r econstructing a large 3D volume of an entir e COS7 cell with intracellular membranes densely labeled using P A I NT , and imaged by lattice light sheet microscopy , imaged over se veral days. Our method signi fi cantly improved the reconstructions, but also enabled high quality reconstructions with only a fraction of the imaging time. Finally, we explor e the performance bene fi ts brought about by the use of local context, and the di ff erent training approaches. Results DECODE network for simultaneous detection and localization of fl uorophor es We designed and trained a deep neural network to simultaneously detect and localize fl uorophores in SMLM measure- ments. The input to the deep network is a sequence of image frames containing sparsely activated fl uorophores, and the desired outputs ar e locations of an unknown number of active fl uorophor es in each frame. 3 of 23 Deep network design for predicting detection, localization, and uncertainty using spatial and tempor al context Pre vious deep learning approaches to SMLM have processed each frame independently , using one of two approaches, which we combine in our work. DeepSTORM3D [ 20 ] produces predictions on a super-r esolved 3D vo xel grid. For each super-resolution vox el, a detection probability is predicted for the presence of a fl uorophore. DeepLoco [ 21 ] combines classi fi cation and regr ession by pr edicting a fi xed sized 256 × 4 matrix for each imaging frame, with each ro w r epresenting the presence or absence of a fl uorophor e, followed by the 3D vector containing the x , y and z coordinate of the molecule. This has the advantage that the computational comple xity of the output scales only with the maximum number of possible active fl uorophores in any frame, but not the volume of imaged fi eld of view . Howe ver, it requir es the network to learn a highly non-local and non-linear transformation from images into 3D coordinates in an undetermined ordering. The DECODE network architectur e is a hybrid of these two approaches: for each image frame it predicts eight channels for each imaged pixel (Fig. 1c). The fi rst two channels indicate the detection probability of a fl uorophore near that pixel in an imaging frame p and its brightness α . The next three channels describe the continuous valued localization of the fl uorophore with r espect to the center of the pix el, ∆ x , ∆ y , ∆ z . This hybrid approach allows DECODE to scale only with the number of imaged pixels (not super-resolution-pixels), and avoids a highly nonlinear and non-local mapping of pixels to coordinates. DECODE is the fi rst approach to pro vide fully probabilistic prediction of both fl uorophore detection and localization. I n addition to the fi rst 5 output channels, three further channels estimate the uncertainty of the localization along each coordinate given by σ x , σ y , σ z . A fi nal channel repr esents the uncertainty in the DECODE prediction of the brightness σ α . Thus DECODE directly predicts and independently represents uncertainty about detection, localization, and particle brightness. Using temporal context We intr oduce a new mechanism to integrate information across frames, and show that it leads to improved detection and localization. The temporal dynamics of the fl uorophores are such that a fl uorophor e can be active across multiple adjacent frames, inducing correlations which ar e local in time. W e designed the DECODE network architecture (Fig. 1c) to infer the hidden states from three consecutive images and then use the combined information for the fi nal localization. Using conte xt has a substantial positive impact on performance. T r aining the DECODE network using simulator learning We want to train the parameters of the DECODE network to simultaneously detect and localize fl uorophore particles from images of sparsely activated fl uorophor es. As ground truth particle localizations are not easily available for real data, we can not directly use supervised learning. Howe ver, the forward image formation model of how a given set of fl uorophor es gives rise to the detected image is well understood. T o detect and localize active fl uor ophores, we need to train a neural network to invert this forward model. W e investigate two di ff erent approaches for training the DECODE network to do this: The fi rst method simulates data from our forward model and uses the simulated data to train the deep network using supervised learning [ 22 , 25 , 26 ]. We call this method “ simulator learning ” (SL, Fig. 5a). The advantage of the method is its simplicity . Ho wever, its accuracy depends crucially on the quality of the simulation and how well it matches the dataset being analyzed. W e will describe a second method (called “ auto encoder learning ” , AEL, Fig. 5a) belo w. Simulator learning has been used by pre vious deep learning approaches to SMLM [ 20 , 21 ]. Since the physics describing how the camera image is generated by the imaging of a biological sample is well understood [27], we can use a simulation of biological samples consisting of point source emitters repr esenting active fl uorophores distributed randomly across a small image patch. We then model the forward generative process of image formation as follows: We simulate the noise- and background-free image of the fl uorophores by convolving the point emitters with a model of the point spread function. A random homogeneous background intensity is added to generate a mean intensity image, and fi nally the noisy measured camera image is then simulated by sampling from a gamma distribution. The density , brightness, activation and inactivation times of the simulated fl uorophor es, and the background intensity values are chosen r andomly to generate a large diversity of simulated images. We developed a specialized loss function for our r epresentation of the fi nal localizations by the discr ete pix el 4 of 23 positions and the in-pixel o ff set variables. W e interpret the binary values p as the probability that an activation exists in that pixel while the outputs α , ∆ x , ∆ y , ∆ z , σ α , σ x , σ y , σ z parametrize Gaussians which ar e components of a Gaussian mixture model (GMM) which describes the spatial distribution of emitter activations. We then maximize the likelihood of the simulated continuous ground truth positions under this GMM. This allows us to optimize all the output variables jointly and to obtain uncertainty estimates which can be used to fi lter out localizations or to convolve the localizations with a Gaussian parametrized by the uncertainty for impro ved rendering [ 28 ]. T o determine the correctness of our uncertainty estimates we compared them to parametric estimates of the Cramér – Rao bound obtained with the equation fr om [ 29 ]. Such estimates generally only take the brightness, the background and the PSF shape into account but not other important factors that increase uncertainty like other close-by PSFs or inhomogeneous background. We observe that under optimal conditions, with a single emitter per frame and a Gaussian PSF , our uncertainty estimates agree well with the parametric estimates. For denser data our method generally pr oduces higher uncertainties, ex cept when temporal conte xt is used (see Fig. S4). Quantitative evaluation on simulated datasets fr om the SMLM challenge show DECODE outper- forming all algorithms across a variety of conditions The 2016 SMLM challenge 1 is the second generation comprehensive benchmark e valuation de veloped for the objective, quantitative evaluations of the plethora of available localization algorithms [ 13 , 30 ]. The benchmark o ff ers synthetic datasets for training and evaluation that were cr eated to emulate various experimental conditions. A direct comparison of DECODE with other contenders (Fig. 2) in the SMLM 2016 challenge shows DECODE outperforming other approaches across datasets 2 . DEC ODE outperforms all 39 currently rank ed algorithms on 12 out of 12 datasets, and often by a substantial margin. The datasets include high (N1) and low (N2) signal to noise ratios (SNR), with low (LD) or high (HD) emitter densities, with 2D , Astigmatism (AS) and Double Helix (DH) point spr ead function based imaging modalities Fig. 2. We quanti fi ed performance using RMSE lateral or volume localization error, as applicable for 2D and 3D data respectively , and the Jaccard index JI which measures single molecule detection accuracy . The SMLM 2016 benchmark also reports a single score which combines particle localization and detection accuracy into a measure called e ffi ciency . DECODE achieves an average e ffi ciency score of 66.61 out of the best possible score of 100 (achievable only by a hypothetical algorithm that accurately detects 100% particles with 0 nm localization error). This is compared to an average scor e 48.3 , and 45.6 for all non-DECODE second and third place algorithms respectively . The impro vement in performance by using DECODE is substantial, leading to 7 × the accuracy improvement gained by using the second best algorithm over the third best algorithm. The di ff erence is particularly large under di ffi cult imaging conditions, when high emitter densities and low SNR can conspire to make detection and localization challenging, particularly so for the double helix point spread function. For example, in the Low SNR/high density/Double Helix condition, DECODE achieves an e ffi ciency score of 44.23, whereas no other algorithms achieves a non-negative e ffi ciency score. DECODE achieves an average e ffi ciency of 57.29 on the six challenging high density datasets, while the average second best and third best algorithms achieve only scores of 30.76 and 27.16 respectively . This represents an average 10 × impro vement relative to the impro vement by the second best algorithm over the third best algorithm on these challenging datasets. DECODE is the best algorithm on all 12 datasets, across a variety of imaging modalities, SNR and density conditions. I n contrast no other algorithm pre viously achieved such universal superiority , instead specializing on a limited range of imaging conditions. Qualitatively, DECODE improves super-resolution reconstructions by impr oving both the detection and the localization of single molecules. An example of this can be seen in Fig. 2a, wher e we compar e the reconstructions obtained with DECODE to the multi-emitter fi tting approach CSpline [ 7 ] on two 3D double-helix datasets with high fl uorophor e densities 3 . DEC ODE detects more fl uorophor es, and localizes them more accurately than CSpline for this dataset. 1 http://bigwww .ep fl .ch/smlm/challenge2016/index.html?p=datasets 2 Note that currently not all of our results are displayed in the plots on website, but all results can be downloaded from http://bigwww .ep fl .ch/smlm/challenge2016/leaderboard.csv . Our results uploaded January 16 2020, results are current as of July 06 2020. 3 We used settings provided by the authors: https://github.com/ZhuangLab/storm-analysis 5 of 23 DECODE 1 μ m Double helix Low SNR / high density -700 nm 700 nm CSpline -700 nm 700 nm Double helix High SNR / high density -700 nm 700 nm -700 nm 700 nm 0 25 50 75 100 Localization error (nm) MT1.N1.LD Low density Widefield 2D Astigmatism 3D Double helix 3D MT2.N1.HD High SNR High density 20 40 60 80 100 Detection accuracy (JI) 0 25 50 75 100 Localization error (nm) MT3.N2.LD 20 40 60 80 100 Detection accuracy (JI) MT4.N2.HD Low SNR Low SNR / high density High SNR / high density Low SNR / low density High SNR / low density −25 0 25 50 75 Efficiency a b c All other algorithms Widefield 2D Astigmatism 3D Double helix 3D DECODE Simulator learning DECODE Combined learning (AI) DECODE Combined learning (VI) Figure 2. Performance comparison on the SMLM 2016 challenge. a) Reconstructions by DECODE and the CSpline algorithm on high density double helix challenge data. Upper panelsc olor coded x - y view , lower panels x - z cross section. b) Performance evaluation on the twelve test datasets with low/high density , low/high SNR and di ff erent modalities using the Jaccard index (higher is better) and lateral localization error (lo wer is better) as metrics. Each marker indicates a benchmarked algorithm, large solid markers indicate DECODE, red circles indicate CSpline results for the conditions in Panel a. c) Performance scores for three DECODE variants (see section on combined learning) across all twelve data-sets, quanti fi ed with e ffi ciency scores. Colored dots indicate performance numbers for other methods taken from challenge website. 6 of 23 1 μ m -400 nm 400 nm DECODE 0.14 D e n s i t y ( N f l u o r ⋅ μ m − 2 ⋅ N − 1 i m g ) 0.36 0.66 1.69 CSpline 0.01 0.02 0.03 S p a t i a l f r e q u e n c y ( n m − 1 ) 0.0 0.2 0.4 0.6 0.8 1.0 FRC CSpline DECODE 0.1 0.5 1.5 D e n s i t y ( N f l u o r ⋅ μ m − 2 ⋅ N − 1 i m g ) 40 50 60 70 80 Resolution estimate (nm) a b c d Figure 3. DECODE produces superior reconstructions at higher densities with fewer frames of data. a) Reconstruction of one section of the low density dataset with DECODE. b) Magni fi ed reconstructions (corresponding to boxed section in panel a), for di ff erent densities obtained with DEC ODE and CSpline. c) Resolution estimates obtained using the Fourier Ring Correlation and 0.143 criterion across densities for both methods. DECODE enables accurate reconstructions with shorter imaging times at high emitter densities I n SMLM, there is a trade-o ff between the imaging time and the activated fl uorophor e density. Sparsely activating fl uorophor es leads to the best localization accuracy , but requir es long imaging times in order to localize su ffi cient numbers of particles to r econstruct the sample faithfully. By enabling accur ate particle localizations at higher densities, DECODE can yield accurate super-resolution reconstructions with signi fi cantly shorter imaging times. W e demonstrate this by imaging and reconstructing the same sample of labeled microtubules at four di ff erent emitter densities using dSTORM (direct stochastic optical reconstruction microscop y) [ 31 ]. For the fi rst dataset the experimental conditions roughly correspond to high SNR and low density settings modelled in the challenge, with an average upper limit of emitter density of 0.14 fl uorophor es µ m − 2 per image 1 . The other three datasets consisted of 2.5 × , 4.5 × and 12 × fewer imaging frames, while the total number of active fl uorophores is roughly constant across datasets. We tr ained and applied one common DECODE model to all four datasets (Fig. 3 a: reconstruction on subsection of low density dataset). W e compared DECODE reconstructions with those of CSpline across all four data sets (Fig. 3 b) to investigate how the quality of reconstruction deteriorates for denser datasets. Similarly to the simulated challenge datasets we observe a sharper image and less spurious localizations for the original low density dataset. As the density increases, DECODE consistently yields reconstructions with similar accuracy , while the reconstructions produced by CSpline degrade for high densities. T o quantify the reconstruction performance acr oss the di ff erent conditions, we calculated the resolution of the reconstructed image using Fourier Ring Correlation (FRC) [ 32 ]. The FRC estimates resolution by measuring the correlation of two di ff erent reconstructions of the same image across spatial frequencies. W e split the localizations order ed in time into blocks of 10000 and created two di ff erent reconstructions of the same sample coming from even and odd blocks. W e then used the spatial frequency at which the correlation drops below a threshold value of 0.143 [ 33 ] to estimate the resolution of the reconstruction. DEC ODE consistently improves r esolution by 10 nm - 25 nm over CSpline across all imaging densities (Fig. 3c and d), and requir es 10 × fewer imaging frames for the same quality of reconstruction. 1 Measured by dividing the DECODE predictions into 1 /µ m − 2 bins and calculating the 99 percentile of densities. 7 of 23 DECODE enables high fi delity reconstructions of 3D lattice light sheet P A I NT imaging with reduced imaging time T o illustrate the general applicability of DECODE, we applied it to 3D lattice light sheet (LLS) microscopy combined with the P A I NT (point accumulation for imaging of nanoscale topography labeling) technique [ 34 , 35 ]. I n P A I NT microscop y , the fl uorophore labeling a sample stochastically binds and unbinds from the sample, providing dense labeling. I n lattice light sheet microscop y , thick volumes can be imaged at high resolution by scanning a thin ( 1.1um ) light sheet, with axial localization within the sheet enabled by astigmatism. W e reconstructed a pre viously reported dataset of a chemically fi xed COS-7 cell with intracellular membr anes preferentially labeled by azepanyl-rhodamine (AzepRh) [ 36 ] consisting of 147, 500 3D volumes comprising more than 20 million 2D images acquired in 270nm steps. For this dataset, one complete scan of the volume involved moving the probe 141 times by 500nm . The detection axis was oblique to the coverslip, resulting in emitters that are active in successive frames, and thus appear to move in the x- and z-direction by a fi xed distance. We adjusted our algorithm to account for this movement, so that we could still employ local context. Furthermor e, we used a modi fi ed noise model, as the images were made with a sCMOS camera (see methods for details). We compare our r econstructions to the original reconstructions described in [ 36 ] which used a custom-made iterative MLE fi tter with a parametric PSF model [ 36 ]. DEC ODE detects 1.25 billion particles, compared to 400 million particles detected by the original algorithm. While LLS-PA I NT microscopy yields high resolution reconstructions o ver large 3D volumes, its usability is limited by the long imaging times requir ed to localize a su ffi cient numbers of particles for reconstruction. For example, the dataset we analyzed was obtained in over 3 days of imaging time. W e show that DECODE provides sharper images using a smaller number of frames, and could thus be used to obtain the same quality of reconstructions using only a fraction of recor ded frames which is con fi rmed by FRC resolution estimates (Fig. 4, S5). W e note that one challenge of long imaging times is that performance can be limited by nonlinear swelling of the sample over the time course of the imaging, which can only be partially corrected b y non-rigid registration. Thus, reducing imaging time by impro ved reconstruction algorithms could also lead to better reconstructions with fewer artifacts. Combining simulator learning with auto encoder learning to learn to simulate better The e ff ectiveness of simulator learning depends on the availability of an accurate forward generative model at training time, as deviations of the true forward model from the simulated forward model can degrade performance. This problem can be solved by simultaneously estimating the par ameters of the true forward model, and tr aining the DECODE network using the real measur ements, rather than a fi ctitious simulation. This is possible using the recently developed framework of variational autoencoders (VAEs) [ 23 , 24 ]. I n the V AE framework, the stochastic forwar d generative model and the DECODE network are stacked to form a stochastic autoencoder. This autoencoder is then used to simultaneously optimize the parameters of the deep network and the forward model, with the goal of achieving image-reconstructions which are similar to the original measurement. Formally , this can be achieved by maximizing a so-called ‘ evidence-lo wer bound ’ via stochastic gradient optimization (see methods for details). V AEs have, e.g., previously been used on the related problem of inferring action potentials from calcium imaging data [ 37 ]. A drawback of V AE-based approaches are that gradients for training the DECODE network need to be approximated using Monte Carlo sampling, which can make optimization more challenging. Simulator learning and autoencoder learning are two sides of the same autoencoder coin, as can seen by comparing Fig 4a to Fig 4b: I n simulator learning, a known PSF is used to transform (encode) simulated emitter locations into a microscope image, and the DECODE network is used to reco ver (decode) the original simulated emitter locations. The network is optimized to minimze the discr epancy-measure computed b y comparing simulated and inferred localizations. I n what we call autoencoder learning (due to the relationship to VAEs) the image measured by the microscope is stochastically transformed (encoded) by the DECODE network into pr edicted emitter locations, and these predicted emitters are then transformed (decoded) by the estimated PSF back into a reconstruction of the measured image. The objective function used to train the DECODE network is the di ff erence between the measured and reconstructed images. Because AEL r elies on autoencoding the real measured data, it enables learning of both the encoder (DECODE network) and the decoder (PSF). I n contrast, SL only allows training of the decoder (DECODE network). Empirically , we found that combining SL and AEL in a manner we call combined learning (CL) often leads to the best performance. 8 of 23 Figure 4. DECODE resolves structural details with only 10 % of frames in LLS-P A I NT dataset. a) COS-7 cell imaged with LLS-P A I NT microscopy . Viewing angle lies perpendicular to the specimen. b) Magni fi ed reconstructions of box ed sections in panel a. First row: DECODE renderings on all 147,500 recorded volumes. Below: Renderings of DECODE and those pro vided by Legant et al. [36] from 10 % of the available volumes. 1: DECODE resolves the hollo w structur e of endosomes more clearly. 2: DECODE avoids distortions of structures around fi ducials. 3: Mitochondrial substructures (like the cristae in yello w) ar e better resolved. 4: DECODE can help to distinguish whether ER tubules are continuous or br oken. 9 of 23 T o highlight the di ff erence between simulator and autoencoder learning we show how the two approaches behave for di ff erent degr ees of mismatch in the assumed point spread function. T o simulate PSF mismatch we generated datasets using a 2D elliptical Gaussian PSF with increasing ellipticity and then trained DECODE models that use a non-elliptical cir cular Gaussian (Left panel Fig. 5e, solid lines show performance of models with fi x ed generative parameters). For an ellipticity of zero the models have access to the true underlying generative model. I n this case SL training sets an upper bound to the achievable performance with a given network as it is able to generate an in fi nite amount of labelled data with the correct simulation parameters, and so outperforms AEL. Howe ver, pure simulator learning is brittle and more sensitive to parameter mismatch as the DECODE network never ‘ sees ’ elliptical PSFs during training. Autoencoder learning can still try to infer the correct positions as placing the circular PSF into the middle of the elliptic one achieves the best reconstruction. Alternating between the two methods retains the advantages of both: Performance is virtually the same as simulator learning when there is no mismatch and performance degrades more gr acefully when the mismatch is increased. When we add training of the generative model parameters (dashed lines), our PSF model learns to account for some of the PSF-mismatch, which further improves performance. T o test these fi ndings in a more realistic setting, we tr ained DEC ODE methods using simulator and combined learning and submitted them to the SMLM 2016 challenge (see Fig. 2). We also evaluated them on the training datasets to more pr ecisely evaluate di ff erences in performance (Fig. 5d). For astigmatism and double helix data we fi t the PSF model to the pro vided bead-data. For 2D we instead used a mor e heuristic estimate, choosing sigma values and a z-dependent scaling that covers the PSF observed in the dataset. Furthermore we used combined learning in two di ff erent settings: one for variational inference (V I ) where autoencoder learning is performed on the same dataset on which performance is evaluated and one for amortized inference (A I ) wher e training and testing takes place on di ff erent datasets. These two models where tr ained using both local and global temporal context, while for simulator learning we only used local conte xt. Overall performance of the three submissions is very similar, which is to be expected given that we are able to appro ximate the generative model of the data very accurately . Adding autoencoder learning is especially helpful for 2D data where we did not fi t the PSF model to beads-data and instead adjusted it during training of the model. As can be seen in Fig. S2 the algorithm learned to add di ff raction rings to the PSF model without any access to bead-data. Additionally we observe the combined learning (V I ) performs better on the high density / low SNR datasets. As described below , this can be attributed to the fact that global context is especially helpful in these di ffi cult conditions. 10 of 23 Simulator learning Simulated locations h ∼ p ( h ) Inferred probabilities q ϕ ( h | d ) Simulated image d ∼ p θ ( d | h ) Loss S L U p d a t e ϕ Autoencoder learning Camera image d ∼ Reconstruction p θ ( d | h ) Inferred point sources h ∼ q ϕ ( h | d ) Loss k I W U p d a t e ϕ , θ θ ϕ ϕ θ X-Y X-Z X-Y X-Z 1.0 1.1 1.2 1.3 1.4 1.5 E l l i p t i c i t y ( w y / w x ) 20 30 40 50 60 Lateral Efficiency a b c d e Simulator learning Autoencoder learning Combined learning Learned PSF Fixed PSF Widefield 2D Astigmatism 3D Double helix 3D 0 10 20 30 40 50 60 70 Lateral / 3D Efficiency Low SNR Simulator learning Combined learning (VI) Combined learning (AI) Widefield 2D Astigmatism 3D Double helix 3D High SNR Widefield 2D Astigmatism 3D Double helix 3D 0 10 20 30 40 50 60 70 Lateral / 3D Efficiency No context Global context Local context Local+global context Widefield 2D Astigmatism 3D Double helix 3D Figure 5. DECODE performance for tr aining approaches and settings. a) Simulator learning (SL). Synthetic images are constructed by the simulated imaging of randomly located fl uorophore point sources using a generative model, and a network is trained to detect and localize the fl uorophor es using supervised learning. b) Auto-encoder learning (AEL). A neural network used to infer putative locations from a measur ed camer a image, and subsequently the generative model is used to reconstruct the original camera image. Both the parameters of the generative model and of the DECODE network are optimized. Loss is computed between measured end reconstructed images. c) Performance of di ff erent training methods for di ff erent degrees of PSF mismatch. Models using a circular PSF are fi t to 5 datasets simulated from PSFs with varying ellipticity . PSF parameters for AEL / AEL+SL learning could be either fi xed (solid line) or learned (dashed line). d) Performance of DECODE trained with di ff erent methods on the 6 high density challenge test datasets. e) DECODE evaluated on the 6 high density challenge training datasets. Models were trained using combined learning either without context, local, global and both forms of conte xt. Local temporal context is more informative than global context I maging fr ames fr om SMLM contain correlations in time acr oss short and long time-scales. Once activated, fl uo- rophor es are usually active for more than one imaging frame and are therefor e visible in multiple consecutive frames at the same position, leading to short time-scale correlations in the images. The spatial distribution of fl uorophor es in a sample is non-uniform and is concentrated around the biological structures labeled by the fl uorophores. This spatial distribution of fl uorophores leads to temporally global correlations. Our DEC ODE network is designed to exploit both kinds of temporal correlations via local and global context windows across imaging frames to impro ve the detection and localization of single molecules. We studied the contributions of local and global context to the performance of the DECODE network. We tr ained DECODE models using CL on the 6 high density datasets of the challenge, using either no context, local context, global context or both forms of context. Local and global context have di ff erent e ff ects on the performance (Fig. 5e). While we fi nd that both local and global context individually impro ve performance, local context is generally more helpful than global context. T ogether, global and local context give the best possible performance but at a minor impro vement over local context alone. 11 of 23 I t should be noted that a straight forward way of using local context called “ gr ouping ” is commonly used to improve localizations as a post-processing step in SMLM [ 38 ]. Localizations occurring in consecutive images that are closer to each other than a fi xed threshold are assumed to belong to the same emitter and their localization is averaged, potentially weighted by the uncertainty of each localization. We applied grouping to the DECODE models trained with and without local context as well as CSpline (Fig. S3) . We observe that grouping is almost as e ff ective as our method in reducing the localization error for the easiest condition (high SNR / low density) but performs worse for any of the more di ffi cult datasets. Furthermor e, our method for using context also impro ves detection accuracy while grouping only in fl uences the localization error. Lastly, using gr ouping on top of DECODE with local context r esults in a small impro vement which would further increase performance on the challenge if one used it. Discussion We here described DECODE, a ne w deep-learning based method for single molecule localization for reconstructing super-resolution images. DEC ODE di ff ers from existing localization algorithms by simultaneously performing detection and localization of particles. DECODE yields substantial improvements in performance over previously evaluated algorithms in a publicly available benchmark challenge: I t achieves best performance in e very condition, and often impro ves prediction performance by a large margin. When applied to high density dSTORM imaging of microtubules, and LLS-P A I NT imaging of whole cells, it leads to r econstructions which have markedly impr oved resolution due to substantial impro vements in particle detection. The performance bene fi ts of DECDOE are especially pronounced in high-density imaging conditions, thereby opening up new opportunities for faster imaging of fi xed samples, and even live imaging. DECODE le verages the fl exibility of deep learning – for its predictions, the network can bene fi t both from temporal context (e.g. from fl uorophores being active across multiple imaging frames), as well as spatial context (e.g. from clustering of fl uorophores in space). DECODE can be used in a very fl exible and general manner and can easily be applied to arbitrary PSFs and noise models – in this paper, we applied it to 4 di ff erent imaging modalities ranging from engineering point spread functions to 3D lattice light sheet microscopy . The DECODE network is trained to produce probabilistic point process pr edictions – it predicts both the probability of detection and the uncertainty of localization for each detected particle. We showed that the localization uncertainties predicted by our network are superior to conventionally used CRLB uncertainties and are particularly useful for fi ltering particles to produce high resolution reconstructions. We presented and evaluated two ways to train the DECODE network, using simulator learning and autoencoder learning. Simulator learning allo ws for fast an easy tr aining of a DECODE network when the optical pr operties of the microscope are precisely known. Autoencoder learning uniquely enables the in situ estimation and re fi nement of imaging parameters such as the empirical point spread function and noise model directly from the experimental measurements, in principle enabling the tracking of drift in the optical system over the course of long imaging experiments, or the estimation local point spread functions across large fi elds of view in the pr esence of sample dependent optical aberrations. One weakness of DECODE is that it currently requires the training of a new neur al network whenever the optical properties of the microscope change. This training can currently take over 10 hours on a single GPU. Howe ver, it may be possible to train a single network to predict robustly across minor variations in the point spread function or noise distribution, i.e. to amortize simulator-learning across setups [ 26 , 37 ]. This can enable real-time reconstruction on a single GPU without the need for re-training, even under the most challenging conditions, since the computational complexity of the predictions depend only on the size of the image and not the number of particles in each imaging frame. Acknowledgments This work was supported by the German Research Foundation (DFG) through SFB 1089 and Germany ’ s Excellence Strategy – EXC-Number 2064/1 – Project number 390727645, the German Federal Ministry of Education and Research (BMBF , project ‘ ADM I MEM ’ , FKZ 01 I S18052 A-D), the Howar d Hughes Medical I nstitute and the European Research Council (CoG-724489 to J.R.). W e thank Daniel Sage for useful discussions, David Greenberg and Poornima Ramesh for comments on the manuscript, and Eric Betzig and Jennifer Lippincott Schwartz for kindly sharing data with us. 12 of 23 Methods Software availability All methods were implemented in Python and PyT orch [ 39 ]. Code and hyper-parameter settings for the challenge results are available at https://github.com/mackelab/DECODE/ Appro ximate Bayesian inference with DECODE DECODE is a Bayesian inference method which requires a formal probabilistic description of the entire SMLM measurement process. This description amounts to a stochastic simulator (known as a generative model) which can generate synthetic SMLM data, but which can also be optimized to fi t the data. I n our framework, at each time point, each active fl uorophor e i has a location in 3D at x i , y i , z i , and a brightness α i . The set of N t single molecule locations and their brightness at each time point are the unknown hidden causes or latent variables h = {{ x i } t , { y i } t , { z i } t , { α i } t } that give rise to the noisy low resolution images which constitute the measured data d = { I t } . A complete description of the generative model in Bayesian frame work includes the prior distribution p ( h ) which describes the spatial distribution and temporal dynamics of fl uorophor es, and the likelihood distribution p ( d | h ) which describes the stochastic process describing the distribution of images generated by the microscope for a given con fi guration of fl uorophores. The likelihood is formalized in terms of the point spread function describing the transfer function of the microscope, and the measurement noise at the camera. The DECODE network is trained to perform approximate Bayesian inference, using simulator learning and autoen- coder learning to approximate the true posterior distribution p ( h | d ) and predicts the hidden single molecule locations and brightness from the measured images. Spatial distribution and temporal dynamics of fl uorophor es. We assume that on each imaging frame, a fl uorophor e can be activated in any given pixel with a constant probability of p on . An active fl uorophor e on any given frame has a probability of p off of turning o ff in the next fr ame. The location of an active fl uorophor es within a pixel is drawn from a uniform distribution in x and y . For z we chose a Gaussian distribution with a mean centered at the focal plane and a variance chosen to cover the range of the point spread function of the microscope instead, as the bulk of the recorded structure is usually located around the focal plane. The brightness of an active fl uorophor e is sampled from a uniform distribution U (0.1, 1) times the maximum possible expected brightness of a single fl uorophore. This describes the prior distribution over particle locations and brightness p ( h ) . Point spread functions We used the sum of a parametric function PSF parametric and a non-parametric interpolated pixel map PSF pixmap to model arbitrarily complex point spread functions PSF ( x , y , z ) = PSF parametric ( x , y , z ) + PSF pixmap ( x , y , z ) . I n principle, the non-parametric interpolated pix el map is su ffi cient to repr esent any possible PSF within the support of the pixel map, we found that the parametric component helps with the learning when using AE training. I n this paper, we analyzed data imaged or simulated using three PSF models – one for 2D localization, and two for 3D localization. For 3D localization, we used the astigmatism (AS, [ 40 ]) and the double helix (DH, [ 41 ]) PSFs. The parametric components of these parametric PSFs as a function of the spatial coordinates x , y , and z is given below , along with the parameters of the PSF after the semi-colon. PSF 2 D ( x , y , z ; a 1 , a 2 , b 1 , b 2 ) = X n =1,2 ( a n · e − b n ( x 2 + y 2 ) / (1+ | z | ) 2 ) (1) PSF AS ( x , y , z ; a , b x , b y , c ) = e − ax 2 / (( z − b x ) 2 + c ) e − ay 2 / (( z − b y ) 2 + c ) (2) PSF DH ( x , y , z ; a , b , c , d ) = e − a ( x − s x ( z )) 2 + a ( y − s y ( z )) 2 + e − a ( x + s x ( z )) 2 + a ( y + s y ( z )) 2 (3) s x ( z ) = d · cos( b · z + c ) s y ( z ) = d · sin( b · z + c ). (4) PSF 2 D is a weighted sum of two circular Gaussians whose variance increases as a function of the distance of the point source away from the focal plane. PSF AS is described by an elliptical PSF whose eccentricity is a function of the defocus z [ 8 ]. PSF DH is a double helical PSF modelled as two circular Gaussians that rotate around the fl uorophor e at a distance d as a function of z . 13 of 23 PSF pixmap enables the approximation of arbitrarily complex PSFs and is a 3D image volume with the same pixel size as camera and with a z-spacing of 100 nm . This pixel map is interpolated by trilinear interpolation to evaluate the point spread function at any location within the support of the pixel map. I maging fl uorophor es and camera noise The number of photons emitted from a fl uor ophore follo ws a Poisson distribution. T o model the noisy imaging by an EMCCD camera, the distribution of photon counts can be convolved with a gamma distribution that models the electron-multiplying (EM) gain and with a Gaussian distribution that accounts for r ead-out noise. The resulting distribution can not be expressed analytically . This is irrele vant for simulator learning, howe ver autoencoder learning requir es a di ff erentiable expr ession for the probability distribution of the measured image I ( x , y ) as a function of the mean intensity image ¯ I ( x , y ) . Therefor e, we approximate the noise model using a single Gamma distribution with parameters that are given by the camera baseline BL , its electron-multiplying gain EM and electron conversion factor EC . Given N activated fl uorophor es, each located at x n , y n , z n and with a brightness of α n , and a constant background fl uorescence of β , the intensity of a pixel I ( x , y ) located at x , y of the resulting imaging frame is simulated as: ¯ I ( x , y ) = N X i =1 α i PSF ( x − x i , y − y i , − z i ) + β (5) I ( x , y ) ∼ Gamma (( ¯ I ( x , y ) − BL ) /η , η ) + BL (6) η = 2 · EM / EC . (7) This describes the likelihood function p ( d | h ) . Fitting of 3D PSFs from bead stacks For 3D inference, it is common to calibrate the PSF model on data with known axial o ff set as the exact relationship between its shape and the position cannot be estimated from unlabeled data. We estimated the AS and DH PSF ’ s using calibration bead stacks, i.e. images of single fl uorophor es at di ff erent o ff sets with high signal to noise ratios. W e fi rst obtain a rough estimate of the bead locations using a basic peak- fi nding routine. We then maximize the likelihood p θ ( d | h ) by performing stochastic gr adient descent on the exact x − and y − coordinates of each bead (which ar e constant across images), the shape parameters of the PSF model (1) and the the pixel maps δ xy . This simple method achieves localization errors of less then 0.3 nm on the challenge calibration stacks where the ground truth locations are available. During training of the DECODE network we generally keep the PSF model fi x ed (see example fi ts in Fig. S1). For 2D datasets the PSF model can be learned simultaneously with the network parameters in a completely unsupervised way , i.e. without requiring access to bead stacks (See pixel maps δ xy in Fig. S2). We emphasize that neither the training algorithm, nor the network architecture, depends on the speci fi cs of the generative model or the PSF model, and both could well be combined with more fl e xible functional forms of PSFs. DECODE network architectur e for probabilistic single molecule detection and localization Our frame analysis module as well as our temporal context module are U-nets with two up- and downsampling stages and 48 fi lters in the fi rst stage. Each stage consists of three fully convolutional layers, where in each downsampling stage the resolution is halved, and the number of fi lters doubled, and vice versa in each upsampling stage. Upsampling is performed using nearest neighbor interpolation to avoid check erboard artifacts [ 42 ]. The fi nal output r epresentation is predicted after two additional convolutions layers. For each camera pixel, the DECODE network predicts the pr obability that a fl uorophore was detected near that pixel p , the location of the detected fl uor ophore relative to the center of the pixel, ∆ x , ∆ y , ∆ z and the predicted fl uorophor e brightness α , and the uncertainties associated with each of these predictions σ x , σ y , σ z , σ α . We used ELU nonlinear activation function [ 43 ] for all hidden units, the hyperbolic tangent nonlinearity for the coordinate outputs ∆ x , ∆ y , ∆ z and the logistic sigmoid nonlinearity for the non-negative brightness and uncertainty outputs α , σ x , σ y , σ z , σ α . The output channels of the DECODE network together repr esent a distribution of possible interpretations of a measured image q ( h | d ) and constitute an appro ximation to the true posterior distribution over possible detections and localizations p ( h | d ) . Our approximate posterior q ( h | d ) is a type of Gaussian mixture model, with one Gaussian mixture component per camera pixel. I t can repr esent at most as many particles as there are camera image pixels, 14 of 23 and for each pixel repr esents the detection probability and localization mean and variance of one particle. I n the following sections we describe how this architectur e is trained and how deterministic detections and localizations of particles can be obtained from the output of the DECODE network at test-time. Simulator learning Given a set of simulated particles and the resulting images over time, simulated as described above such that h ∼ p ( h ) and d ∼ p ( d | h ) we take samples from our generative model h ∼ p ( h ), d ∼ p θ ( d | h ) and maximize the loglikelihood log q φ ( h | d ) . This pr ocedure amounts to minimizing the Kullback-Leibler divergence ( D KL ) between the posterior of the generative model and the recognition network, averaged over the (simulated) data distribution: E p θ ( d ) [ − D KL ( p θ ( h | d ) || q φ ( h | d )] = E p θ ( d , h ) [log q φ ( h | d )] + const. (8) Given our repr esentation of the fi nal localizations by the discrete pixel positions and the in-pixel o ff set variables x = x p + ∆ x y = y p + ∆ y z = ∆ z (9) we developed a loss function that allows us to jointly optimize the di ff erent output variables. We interpret the binary values p as the probability that an activation exists in that pixel while the outputs α , ∆ x , ∆ y , ∆ z , σ α , σ x , σ y , σ z parametrize Gaussians N ( ~ µ , Σ) which ar e components of a Gaussian mixture model (GMM) which describes the distribution of emitter activations: q φ ( h | d ) ∝ Y i X k p k P k p k N ( ~ X i | ~ µ k , Σ k ) (10) where k index es all pixels, and ~ X i are the ground truth location vectors. The number of activations follows a Poisson Binomial distribution given that the binary probabilities vary strongly across pixels. As the likelihood of this distribution is hard to evaluate we instead use its mean and variance to parametrize a Gaussian appro ximation to the likelihood of counts: q φ ( h | d ) ∝ N ( X k S k | X k p k , X k p k − p 2 k ) (11) where P k S k is the true number of emitters. As the GMM term scales linearly with the number of emitters, while the count term stays constant, we multiply it by the number of emitters to balance the two terms. The resulting total log-lik elihood we use to train our inference network is: log q φ ( h | d ) = X i X k log p k P k p k N ( ~ X i | ~ µ k , Σ k ) + X k S k · log N ( X k S k | X k p k , X k p k − p 2 k ) (12) Auto encoder learning: Optimizing a lower bound on p ( d ) For auto encoder learning we only treat the discrete outputs as stochastic latent variables, and use the deterministic mean values for the continuous outputs. log q φ ( h | d ) is therefor e calculated as the binary cross-entrop y between the inferred probabilities and the discrete pix el activations. We also performed experiments using the loss described in (12) for autoencoder learning. I n this case in addition to the discrete samples we also draw samples of our continuous o ff sets from N ( ~ µ k , Σ k ) and optimize them using the reparametrization trick [ 23 ]. Ho wever this resulted in far higher gradient variance and over all reduced performance. Using Jensen ’ s inequality we can derive a lower bound (ELBO) on the marginal likelihood p ( d ) : log p ( d ) = log E q [ p θ ( d , h ) q φ ( h | d ) ] ≥ E q [log p θ ( d , h ) q φ ( h | d ) ] = L ( d ) (13) by maximizing this ELBO with respect to θ we minimize the re verse D KL averaged over the true data distribution E p ( d ) [ D KL ( q φ ( h | d ) || p θ ( h | d ))] (14) 15 of 23 Unlike simulator learning maximization with respect to φ also allows us to learn the parameters of the generative model. I f we instead use an importance weighted average over j samples from our recognition model to estimate p ( d ) , and again apply Jensen ’ s inequality we obtain a tighter lower bound (which is identical to the ELBO for j = 1 ): L j IW ( d ) = E q ( h 1: J | d ) 1 J J X j =1 log p θ ( d , h j ) q φ ( h j | d ) | {z } ω k ( d , h j ) (15) This objective is the basis for both the importance weighted autoencoder ( I WAE) [ 44 ] and the reweighted wake-sleep algorithm (RWS) [45]. Updating θ For a given value of φ , unbiased gradients for θ can be obtained by sampling the discrete variables h 1 , ..., h j ∼ q φ and calculating the gradients: ∇ θ L j IW ( d ∼ D ) = ∇ θ log( 1 J J X j =1 ω j ) = J X j =1 ˜ ω j ∇ θ log p θ ( h j | d ) (16) ˜ ω j = ω j ( d , h j ) P J j 0 =1 ω ( d , h j 0 ) (17) Updating φ Obtaining gradients for φ is more involved, especially in the case of discrete latents when the repar ametrization trick cannot be applied. The RWS algorithm includes two procedur es to obtain gradients for φ . The sleep phase update matches simulator learning which minimizes the D KL between p and q over data that is generated from the generative model p θ ( d | h ) p ( z ) . The wake phase update optimizes the same D KL , but over the true data distribution p ( d ) (i.e. using samples from the data). ∇ φ D KL ( p θ ( h | d ) || q φ ( h | d )) ' J X j =1 ˜ ω j ∇ φ log q φ ( h j | d ) (18) We also e xperimented with the V I MCO algorithm [ 46 ] and the The Thermodynamic Variational Objective [ 47 ] as alternative approaches to obtain low variance gradients for discrete latent variable models. Performance was comparable across methods, so we chose RWS for its easy implementation and low number of hyper parameters. Wak e phase updates can be very noisy , especially during the fi rst iterations when the network basically produces random samples. I f the network predicts large numbers of detections training can fail to to memory restraints. Therefor e, we start training with a warm up phase of 1000 iterations of simulator learning, where one iteration corresponds to the evaluation of the loss on one batch and a subsequent gradient update. T r aining details and hyper-parameters T raining is performed on 40 × 40 pixel sized regions that are simulated or randomly selected from recorded images at each iteration. I f the network is trained to make use of global context, we use a running average of the hidden states collected over the last 100 training batches. At test time we perform two passes over the dataset: the fi rst one to collect the average hidden state ˜ h = P T h t and the second one to obtain the inference results. When training with local context we employ di ff erent strategies for SL and AE tr aining steps. For simulator learning, when sampling data we align the spatial variables ∆ x , ∆ y , ∆ z = ~ µ (but not the intensity) to be identical when a fl uorophor e is active in consecutive frames. For AE training, for each set of variables S t , ~ µ t which are inferred from the images I t − 1 , I t , I t − 1 we also infer o ff set variables and uncertainties σ x , σ y , σ z = Σ for t + 1 and t − 1 to pro vide context. We use these variables to calculate an error term that is the sum of log-likelihoods of the o ff set variables at each pixel under the Gaussian distribution given by the activations in consecutive images: δ xyz = X x , y S t · S t − 1 ( N ( ~ µ t | ~ µ t − 1 , Σ t − 1 ) + S t · S t +1 ( N ( ~ µ t | ~ µ t +1 , Σ t +1 ) (19) 16 of 23 This term is subtracted from the objective function during training. A base value of 0.01 is added to the uncertainties to avoid instabilities. We used the AdamW optimizer [ 48 ] with a learning r ate of 6 · 10 − 4 for the network parameters which is multiplied b y 0.9 after every 1000 training iterations. When also learning the PSF we used a learning rate of 0.015 for PSF model parameters and 3 · 10 − 6 for the pixel maps δ xy . T o stabilize training and ensure that gradient steps of simulator and autoencoder learning are roughly equal in size when performing combined learning we employ gradient norm clipping with a maximum norm of 0.03. We normalized the inputs to the network by fi rst subtracting the mean of the dataset and then dividing b y the maximum of the mean over the image dimension. T o calculate the RWS objective we used 40 samples. Obtaining localizations and post-processing The DECODE network predicts the pr obabilities of a fl uorophor e being located at a speci fi c pixel. While we sample from this distribution during training, we prefer to generate deterministic detections and localizations at test time. T o get deterministic, fast and pr ecise pseudo samples we instead use a variant of non-maximum suppression to obtain fi nal localizations. T o obtain a binary mask of fl uorophore candidates for a given frame we identify probability peaks, i.e. pixels with values that are above 0.3 and higher than all values in a surrounding 3x3 patch. We then add the probability mass from the 4 directly adjacent pixels to the values at the candidate positions by convolving the probability map with a cross shaped fi lter and applying the mask. All candidates with added probability values above 0.7 are counted towar ds the localizations. The algorithm can be expressed purely in the form of pooling and convolution operations and ther efore runs e ffi ciently on a GPU. For di ffi cult imaging conditions, i.e. high densities, low SNR values and high o ff sets from the focal plane the lateral o ff set variables can be biased towards small absolute values. This e ff ect scales with the uncertainty of the predictions and can produce artifacts in the reconstructed image as localizations are concentrated at the pixel centers. T o counteract this we therefor e divide all localizations into equally sized bins according to the total variance va r tot = p σ 2 x + σ 2 y + σ 2 z . Then we calculate an empirical CDF ˆ F x , ˆ F y from the histograms of the ∆ x and ∆ y variables in each bin. The variables ∆ˆ x , ∆ ˆ y = ˆ F x (∆ x ) − 0.5, ˆ F y (∆ y ) − 0.5 have a uniform distribution as desir ed. This transformation e ff ectively remo ves image artifacts while having no impact on the performance metrics. As a fi nal post-processing step our inferred uncertainties allow us to e ff ectively fi lter bad localizations. As shown in Fig. S4c this is very e ff ective in reducing the over all localization error. For the challenge data removing between 0 and 20 % results in the best performance. For real data this threshold should be individually chosen according to the amount of data collected. Evaluating localization accuracy and reconstruction resolution T o evaluate performance on the challenge datasets, as well as our own simulations we use the lateral or volume localization err or in nm and the Jaccard index J which quanti fi es how well an algorithm does at detecting all the fl uorophor es while avoiding false positives J = 100 · TP / ( FN + FP + TP ) . Localizations ar e matched to ground truth positions when they ar e withing a circle of 250 nm radius. As a single metric that evaluates the ability to reliably infer fl uorophor es with high precision we use the e ffi ciency metric: E = 100 − q (100 − J ) 2 + α 2 RMSE 2 ) (20) Lateral and axial e ffi ciency are calculated with alpha values of α = 0.5nm − 1 and α = 1nm − 1 respectively and then averaged to obtain the over all 3D e ffi ciency. Super-resolution images were render ed by convolving inferred positions with a 2D Gaussian with a width of 5 nm . The Fourier ring correlation (FRC, [ 32 , 33 ]) in 3 was calculated by constructing two super-resolution image volumes of the same sample ( σ =8.5 nm , pixelsize=10 nm ) by dividing the localizations into two sets. We did this by alternating blocks of 50k consecutive localizations. DECODE for LLS-P A I NT microscop y The LLS dataset di ff ers from the the other datasets we analyzed in two respects. First, due to the movement of the light sheet, fl uorophores that ar e active across multiple frames change their x and z position within a frame by a fi xed amount. While usually this can be accounted for in post-processing, in order to use local context we also have to adjust our generative model. Therefore, when generating the image triplets for simulator learning, we move the 17 of 23 emitters by the correct amount when they ar e active in multiple frames. Second, the images were recor ded with a sCMOS instead of an EMCCD camera, therefor e requiring a di ff er ent noise model. W e follow the description of the image generating pr ocess in [49] for our noise model. Given the mean intensity as calculated in (5) it is given by: ¯ I ( x , y ) = N X i =1 α i PSF ( x − x i , y − y i , − z i ) + β (21) I ( x , y ) ∼ Gamma (( ¯ I ( x , y )) /η , η ) (22) η = V ar(x, y) + g · ( ¯ I ( x , y ) − BL ) ¯ I ( x , y ) . (23) Here, we assumed the camera gain g to be constant, while V ar(x, y) is the pix el speci fi c noise that can we estimated from dark images. For the results shown in Fig. 4 we trained DECODE with CL and local context. The PSF was optimized on bead stacks, and the pixel maps δ x , y where further optimized during the training of the network. The reconstructions shown in Figures 4 and S5 are rendered by convolving each localization with a 3D Gaussian parametrized b y the respective uncertainties to construct a 3D histogram of the volume with a voxel size of 10x10x20 nm . Histogr am values are then clipped at 2.5 to remove most of the contribution from fi ducials. We then plotted the color-coded maximum projection o ver the z-axis with the maximum intensity set to the 99.5 percentile of histogram values. References [1] M. J. Rust, M. Bates, and X. Zhuang. Sub-di ff raction-limit imaging by stochastic optical reconstruction microscopy (storm). Nature methods , 3(10):793, 2006. [2] E. Betzig, G. H. Patterson, R. Sougr at, O . W. Lindwasser, S. Olenych, J. S. Bonifacino, M. W . Davidson, J. Lippincott-Schwartz, and H. F . Hess. I maging intracellular fl uorescent proteins at nanometer resolution. Science , 313(5793):1642 – 1645, 2006. [3] H. Deschout, F . C. Zanacchi, M. Mlodzianoski, A. Diaspro, J. Bewersdorf, S. T . Hess, and K. Braeckmans. Pr ecisely and accurately localizing single emitters in fl uorescence microscopy . Nature methods , 11(3):253, 2014. [4] Y . Li, M. Mund, P . Hoess, J. Deschamps, U. Matti, B . Nijmeijer, V. J. Sabinina, J. Ellenberg, I . Schoen, and J. Ries. Real-time 3d single-molecule localization using experimental point spread functions. Nature methods , 15(5):367, 2018. [5] S. Wolter, A. Löschberger, T . Holm, S. Aufmkolk, M.-C. Dabauvalle, S. Van De Linde, and M. Sauer. r apidstorm: accurate, fast open-source software for localization microscop y . Nature methods , 9(11):1040, 2012. [6] P . Dedecker, S. Duwé, R. K. Neely, and J. Zhang. Localizer: fast, accurate, open-source, and modular software package for superresolution microscop y. Journal of biomedical optics , 17(12):126008, 2012. [7] H. P . Babcock and X. Zhuang. Analyzing single molecule localization microscopy data using cubic splines. Scienti fi c reports , 7(1): 552, 2017. [8] H. Babcock, Y . M. Sigal, and X. Zhuang. A high-density 3d localization algorithm for stochastic optical reconstruction micr oscopy . Optical Nanoscopy , 1(1):6, 2012. [9] M. Ovesn ` y, P . K ř í ž ek, J. Borkovec, Z. Š vindrych, and G. M. Hagen. Thunderstorm: a comprehensive imagej plug-in for palm and storm data analysis and super-resolution imaging. Bioinformatics , 30(16):2389 – 2390, 2014. [10] T . Kim, S. Moon, and K. Xu. I nformation-rich localization microscopy through machine learning. Nature communications , 10(1): 1996, 2019. [11] P . Zelger, K. Kaser, B . Rossboth, L. Velas, G. Schütz, and A. Jesacher. Three-dimensional localization microscopy using deep learning. Optics express , 26(25):33166 – 33179, 2018. [12] B . Rieger and S. Stallinga. The lateral and axial localization uncertainty in super-resolution light microscop y. ChemPhysChem , 15 (4):664 – 670, 2014. [13] D . Sage, T .-A. Pham, H. Babcock, T . Lukes, T. Pengo, R. Velmurugan, A. Herbert, A. Agarwal, S. Colabrese, A. Wheeler, et al. Super-resolution fi ght club: A broad assessment of 2d & 3d single-molecule localization microscop y software. bioRxiv , page 362517, 2018. 18 of 23 [14] S. Cox, E. Rosten, J. Monypenny, T . Jovanovic- T alisman, D. T . Burnette, J. Lippincott-Schwartz, G. E. Jones, and R. Heintzmann. Bayesian localization microscop y reveals nanoscale podosome dynamics. Natur e methods , 9(2):195, 2012. [15] R. Sun, E. Archer, and L. Paninski. Scalable variational inference for super r esolution micr oscopy . bioRxiv , page 081703, 2016. [16] A. Krizhevsky , I . Sutske ver, and G. E. Hinton. I magenet classi fi cation with deep convolutional neural networks. I n Advances in neural information processing systems , pages 1097 – 1105, 2012. [17] C. Belthangady and L. A. Royer. Applications, promises, and pitfalls of deep learning for fl uorescence image reconstruction. Nature methods , pages 1 – 11, 2019. [18] T . Ching, D. S. Himmelstein, B. K. Beaulieu-Jones, A. A. Kalinin, B. T . Do, G. P . Way, E. Ferrer o, P .-M. Agapow , M. Zietz, M. M. Ho ff man, et al. Opportunities and obstacles for deep learning in biology and medicine. Journal of The Royal Society I nterface , 15 (141):20170387, 2018. [19] M. Weigert, U. Schmidt, T . Boothe, A. Müller, A. Dibro v , A. Jain, B . Wilhelm, D. Schmidt, C. Broaddus, S. Culley , et al. Content-aware image restoration: pushing the limits of fl uorescence microscop y . Nature methods , 15(12):1090, 2018. [20] E. Nehme, D . Freedman, R. Gordon, B . Ferdman, L. E. Weiss, O. Alalouf, T . Naor, R. Orange, T . Michaeli, and Y . Shechtman. Deepstorm3d: dense 3d localization microscop y and psf design by deep learning. Nature Methods , pages 1 – 7, 2020. [21] N. Boyd, E. Jonas, H. P . Babcock, and B. Recht. Deeploco: Fast 3d localization micr oscopy using neur al networks. bioRxiv , 2018. doi:10.1101/267096. [22] T . A. Le, A. G. Baydin, R. Zinko v, and F . Wood. Using synthetic data to train neur al networks is model-based reasoning. I n Neural Networks ( I JCNN), 2017 I nternational Joint Conference on , pages 3514 – 3521. I EEE, 2017. [23] D. P . Kingma and M. Welling. Auto-encoding variational bayes. arXiv preprint , 2013. [24] D . J. Rezende, S. Mohamed, and D . Wierstr a. Stochastic backpr opagation and approximate inference in deep generative models. arXiv preprint arXiv:1401.4082 , 2014. [25] K. Cranmer, J. Brehmer, and G. Louppe. The frontier of simulation-based inference. Proceedings of the National Academy of Sciences , 2020. [26] P . J. Gonçalves, J.-M. Lueckmann, M. Deistler, M. Nonnenmacher, K. Öcal, G. Bassetto, C. Chintaluri, W . F . Podlaski, S. A. Haddad, T . P . Vogels, et al. T raining deep neural density estimators to identify mechanistic models of neural dynamics. bioRxiv , page 838383, 2020. [27] S. Stallinga and B. Rieger. Accuracy of the gaussian point spread function model in 2d localization microscopy . Optics express , 18 (24):24461 – 24476, 2010. [28] R. P . Nieuwenhuizen, S. Stallinga, and B . Rieger. 18 visualization and resolution in localization microscopy . Cell Membrane Nanodomains: From Biochemistry to Nanoscop y , page 409, 2014. [29] K. I . Mortensen, L. S. Churchman, J. A. Spudich, and H. Flyvbjerg. Optimized localization analysis for single-molecule tracking and super-resolution microscop y. Nature methods , 7(5):377, 2010. [30] A. Small and S. Stahlheber. Fluor ophore localization algorithms for super-resolution microscop y . Nature methods , 11(3):267, 2014. [31] S. Van de Linde, A. Löschberger, T . Klein, M. Heidbreder, S. Wolter, M. Heilemann, and M. Sauer. Direct stochastic optical reconstruction microscop y with standard fl uorescent probes. Nature protocols , 6(7):991, 2011. [32] N. Banterle, K. H. Bui, E. A. Lemke, and M. Beck. Fourier ring correlation as a resolution criterion for super-resolution microscopy . Journal of structural biology , 183(3):363 – 367, 2013. [33] P . B . Rosenthal and R. Henderson. Optimal determination of particle orientation, absolute hand, and contr ast loss in single- particle electron cryomicroscopy . Journal of molecular biology , 333(4):721 – 745, 2003. [34] B .-C. Chen, W . R. Legant, K. Wang, L. Shao, D . E. Milkie, M. W. Davidson, C. Janetopoulos, X. S. Wu, J. A. Hammer, Z. Liu, et al. Lattice light-sheet microscop y: imaging molecules to embryos at high spatiotemporal resolution. Science , 346(6208):1257998, 2014. [35] J. Schnitzbauer, M. T . Strauss, T . Schlichthaerle, F . Schueder, and R. Jungmann. Super-resolution microscopy with dna-paint. Nature protocols , 12(6):1198, 2017. 19 of 23 [36] W . R. Legant, L. Shao, J. B . Grimm, T . A. Bro wn, D. E. Milkie, B. B . Avants, L. D. Lavis, and E. Betzig. High-density three-dimensional localization microscopy across large volumes. Nature methods , 13(4):359 – 365, 2016. [37] A. Speiser, J. Y an, E. W . Archer, L. Buesing, S. C. T ur aga, and J. H. Mack e. Fast amortized in- ference of neural activity from calcium imaging data with variational autoencoders. Advances in Neural I nformation Processing Systems 30 , pages 4024 – 4034, 2017. URL http://papers.nips.cc/paper/ 6991- fast- amortized- inference- of- neur al- activity- from- calcium- imaging- data- with- variational- autoencoders.pdf. [38] P . Annibale, S. Vanni, M. Scarselli, U. Rothlisberger, and A. Radenovic. Quantitative photo activated localization micr oscopy: unraveling the e ff ects of photoblinking. PloS one , 6(7):e22678, 2011. [39] A. Paszke, S. Gross, F . Massa, A. Lerer, J. Bradbury , G. Chanan, T . Killeen, Z. Lin, N. Gimelshein, L. Antiga, et al. Pytorch: An imperative style, high-performance deep learning libr ary. I n Advances in Neural I nformation Processing Systems , pages 8024 – 8035, 2019. [40] B . Huang, W . Wang, M. Bates, and X. Zhuang. Three-dimensional super-resolution imaging by stochastic optical reconstruction microscop y. Science , 319(5864):810 – 813, 2008. [41] S. R. P . Pavani, M. A. Thompson, J. S. Biteen, S. J. Lord, N. Liu, R. J. Twieg, R. Piestun, and W. Moerner. Three-dimensional, single-molecule fl uorescence imaging beyond the di ff raction limit b y using a double-helix point spread function. Proceedings of the National Academy of Sciences , 106(9):2995 – 2999, 2009. [42] A. Odena, V . Dumoulin, and C. Olah. Deconvolution and checkerboard artifacts. Distill , 2016. doi:10.23915/distill.00003. URL http://distill.pub/2016/deconv- checkerboard. [43] D .-A. Cle vert, T . Unterthiner, and S. Hochr eiter. Fast and accurate deep network learning by exponential linear units (elus). arXiv preprint arXiv:1511.07289 , 2015. [44] Y . Burda, R. Grosse, and R. Salakhutdinov. I mportance weighted autoencoders. arXiv preprint , 2015. [45] J. Bornschein and Y . Bengio. Reweighted wake-sleep. CoRR , abs/1406.2751, 2014. URL http://arxiv .org/abs/1406.2751. [46] A. Mnih and D. J. Rezende. Variational inference for monte carlo objectives. I n Proceedings of the 33st I nternational Conference on Machine Learning , 2016. [47] V . Masrani, T. A. Le, and F . W ood. The thermodynamic variational objective. I n Advances in Neural I nformation Processing Systems , pages 11521 – 11530, 2019. [48] I . Loshchilo v and F . Hutter. Decoupled weight decay regularization. arXiv preprint , 2017. [49] S. Liu, M. J. Mlodzianoski, Z. Hu, Y . Ren, K. McElmurry, D. M. Suter, and F . Huang. scmos noise-correction algorithm for microscop y images. Nature methods , 14(8):760 – 761, 2017. 20 of 23 Supplementary I nformation Double helix -700 nm Astigmatism -525 nm -350 nm -175 nm 0 nm 175 nm 350 nm 525 nm 700 nm Figure S1. PSF model fi ts PSFs were fi tted on astigmatism and double helix challenge data. Contour plots show the underlying parametric model and highlight the contribution from the pixel maps δ xy . 2D Figure S2. Learned pixel maps δ xy for di ff erent absolute z-o ff sets learned when using combined learning on the high SNR wide fi eld 2D challenge dataset. The model was clearly able to identify inference rings without the use of calibration bead stacks. Low SNR / high density High SNR / high density Low SNR / low density Low SNR / high density 0.0 0.2 0.4 0.6 0.8 1.0 Detection accuracy (JI) Not Grouped Grouped DECODE no context DECODE local context CSpline High SNR / low density High SNR / high density Low SNR / low density Low SNR / high density 0 25 50 75 100 125 150 Localization error (nm) Figure S3. Comparison of the impact of local context and gr ouping Performance on the four astigmatism challenge datasets for DECODE models trained with and without local context, as well as CSpline. For each algorithm detection accuracy and RMSE are shown for raw and grouped predictions. Across all conditions DEC ODE with local context and without grouping outperforms DECODE without context as well as CSpline when using grouping. 21 of 23 0 10 20 30 40 50 60 σ x ( n m ) 0 10 20 30 40 50 60 √ C R L B ( n m ) Sparse data 0 20 40 60 80 100 σ x ( n m ) 0 20 40 60 80 100 √ C R L B ( n m ) Dense data Local context No context 0 10 20 30 40 50 Percentage of localizations filtered 20 25 30 35 40 45 50 55 60 65 Localization error (nm) a b c Intensity CRLB σ Figure S4. DECODE pro vides superior uncertainty estimates for dense data CRLB estimates were obtained using the analytical appro ximation described in [29]. a) For sparse data with a single emitter per image the uncertainty estimates of DECODE closely match the CRLB . b) For dense data DECODE without context produces strictly higher uncertainty estimates, taking into account the reduced precision resulting from overlapping PSFs. When using local context the uncertainty can be lower than the CRLB which doesn ’ t consider tempor al dynamics. c) For dense data using the σ predicted by DECODE to fi lter out the worst localizations results in lower localization error then using the predicted intensity or the CRLB . Figure S5. Comparison of r econstructions of LLS data across number of frames Magni fi ed reconstructions (box ed region 5 in Fig. 4) using 10, 25, 50 and 100 % of the available frames. 22 of 23 0.002 0.004 0.006 0.008 0.010 0.012 0.014 S p a t i a l f r e q u e n c y ( n m 1 ) 0.0 0.2 0.4 0.6 0.8 1.0 FRC Legant et al. DECODE 10 25 50 100 % of Frames used 100 110 120 130 140 Resolution estimate (nm) Figure S6. Resolution estimates for LLS reconstructions Resolution estimates obtained using the Fourier Ring Correlation and 0.143 criterion across di ff erent percentage of frames used for both methods. Evaluated on the region shown in Fig. S5 23 of 23
Original Paper
Loading high-quality paper...
Comments & Academic Discussion
Loading comments...
Leave a Comment