DRLViz: Understanding Decisions and Memory in Deep Reinforcement Learning
We present DRLViz, a visual analytics interface to interpret the internal memory of an agent (e.g. a robot) trained using deep reinforcement learning. This memory is composed of large temporal vectors updated when the agent moves in an environment an…
Authors: Theo Jaunet, Romain Vuillemot, Christian Wolf
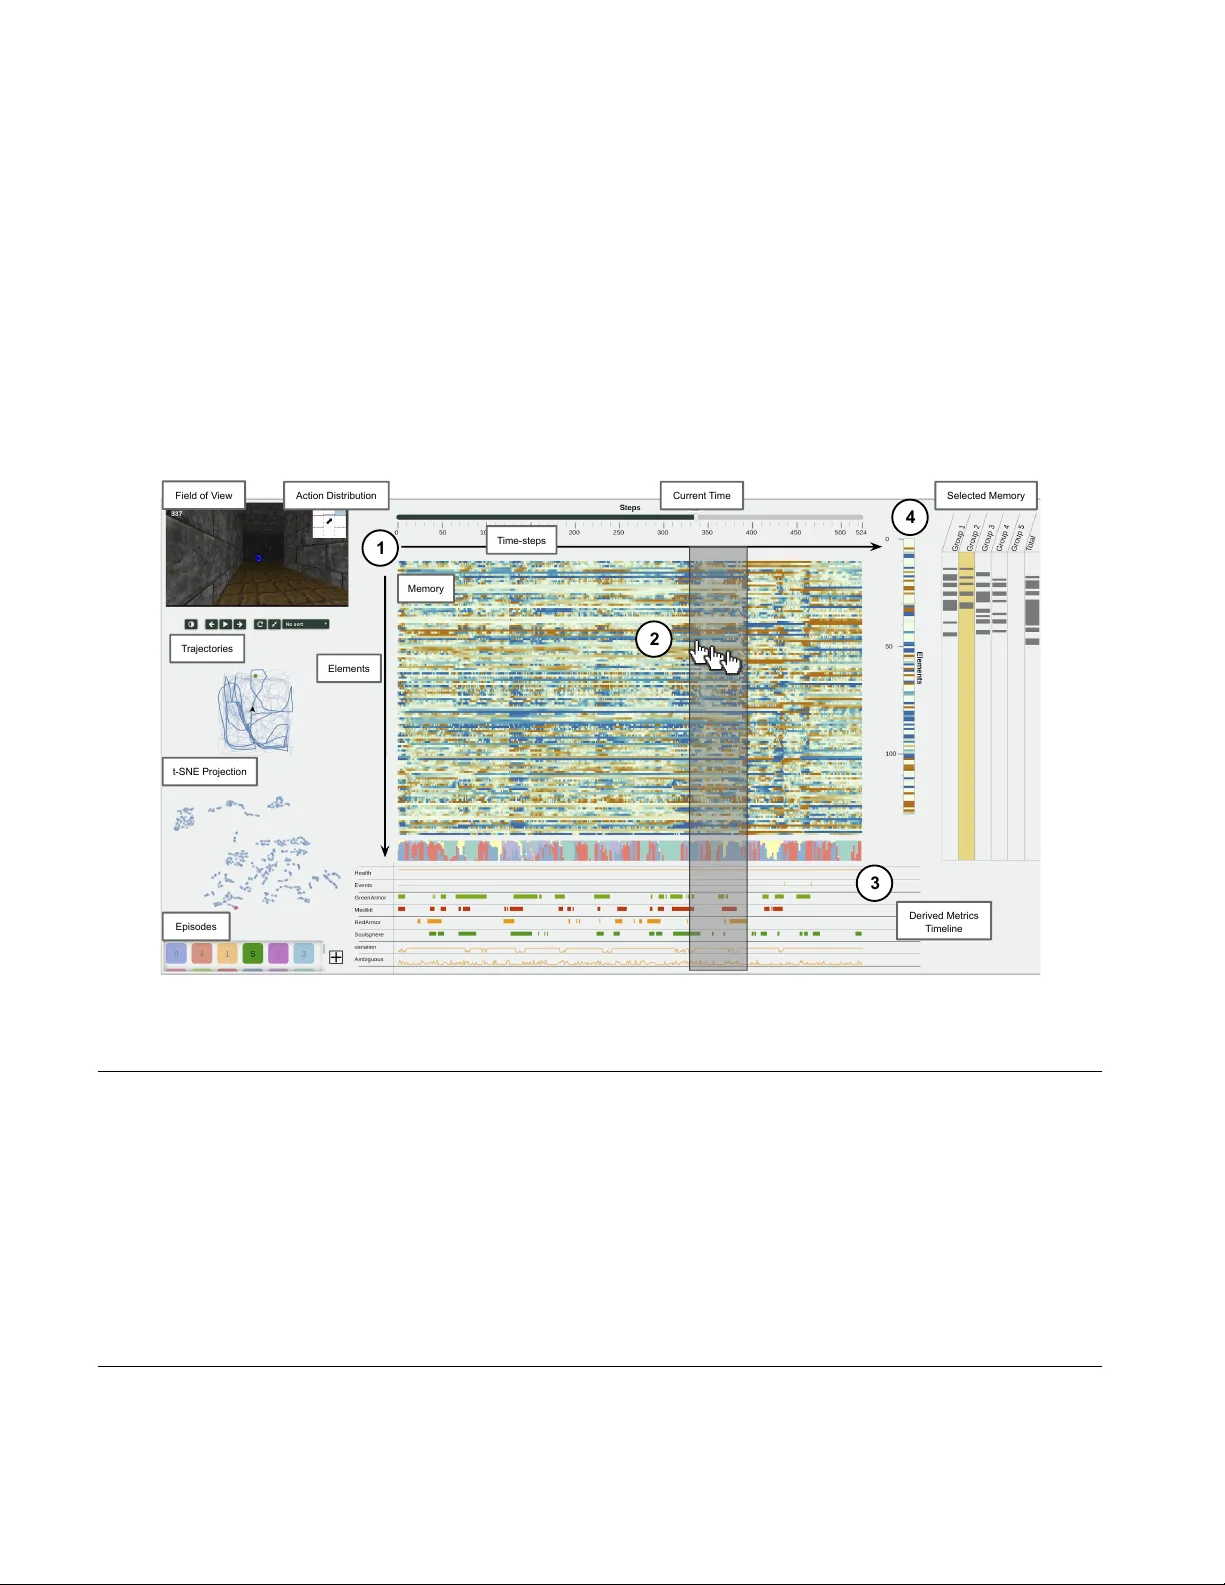
Eurographics Conference on V isualization (EuroV is) 2020 M. Gleicher , T . Landesberger v on Antburg, and I. V iola (Guest Editors) V olume 39 ( 2020 ), Number 3 DRL V iz: Understanding Decisions and Memory in Deep Reinf or cement Learning T . Jaunet 1 R. V uillemot 2 and C. W olf 1 , 3 1 LIRIS, INSA-L yon, France 2 LIRIS, ÃL ’cole Centrale-L yon, France 3 CITI, INRIA, France Field of V iew Action Distribution Current T ime Selected Memory Current T ime T rajectories t-SNE Projection Episodes Derived Metrics T imeline Memory T ime-steps Elements 1 2 3 4 Figure 1: DRL V iz displays a trained agent memory , whic h is a large tempor al vector , as a horizontal heat-map À . Analysts can browse this memory following its temporal construction; filter according to movements of the agent and derived metrics we calculated Á (e.g., when an item is in the field of view  ); and select the memory to filter elements and compare them à . Abstract W e present DRL V iz, a visual analytics interface to interpret the internal memory of an agent (e.g. a r obot) trained using deep r einforcement learning. This memory is composed of larg e temporal vectors updated when the agent moves in an en vir onment and is not trivial to understand due to the number of dimensions, dependencies to past vectors, spatial/temporal correlations, and co-correlation between dimensions. It is often referr ed to as a black box as only inputs (images) and outputs (actions) are intelligible for humans. Using DRL V iz, experts ar e assisted to interpr et decisions using memory r eduction interactions, and to in vestigate the r ole of parts of the memory when err ors have been made (e.g . wr ong direction). W e r eport on DRL V iz applied in the conte xt of video games simulators (V iZDoom) for a navigation scenario with item gathering tasks. W e also r eport on experts evaluation using DRL V iz, and applicability of DRL V iz to other scenarios and navigation pr oblems be yond simulation games, as well as its contribution to blac k box models interpretability and e xplain-ability in the field of visual analytics. CCS Concepts • Human-centered computing → V isual analytics; • Theory of computation → Reinfor cement learning; c 2020 The Author(s) Computer Graphics Forum c 2020 The Eurographics Association and John Wile y & Sons Ltd. Published by John Wiley & Sons Ltd. T . J aunet, R. V uillemot and C. W olf / Understanding Decisions and Memory in Deep Reinforcement Learning 1. Introduction Automatic navigation is among the most challenging problems in Computer Science with a wide range of applications, from find- ing shortest paths between pairs of points, to efficiently explor- ing and cov ering unknown environments, up to complex semantic visual problems (“ Where ar e my keys? ”). Addressing such prob- lems is important for modern applications such as autonomous ve- hicles to impro ve urban mobility , social robots and assisting elderly people. Historically , navigation was often solved with discrete op- timization algorithms such as Dijkstra [ Dij59 ], A-Star [ HNR68 ], Front-propagation [ Y am97 ] etc., applied in settings where spa- tial maps are constructed simultaneously with solving the nav- igation problem. These algorithms are well understood, but are restricted to simple waypoint na vigation. Recently , techniques from Machine/Deep Learning have sho wn spectacular progress on more complex tasks inv olving visual recognition, and in particu- lar in settings where the agent is required to discover the prob- lem statement itself from data. In particular , Reinforcement Learn- ing (RL) and the underlying Markov Decision Processes (MDP) provide a mathematically founded framework for a class of prob- lems focusing on interactions between an agent and its environ- ment [ SB18 ]. In combination with deep networks as function ap- proximators, this kind of models was very successful in problems like game playing [ MKS ∗ 15 , SSS ∗ 17 ], navig ation in simulated en vironments [ DDG ∗ 18 , GKR ∗ 18 , PS18 ], and work in human- computer interaction (HCI) emerging [ DDCW19 ]. The goal of Deep Reinforcement Learning (DRL) is to train agents which interact with an environment. The agent sequentially takes decisions a t , where t is a time instant, and receives a scalar rew ard R t , as well as a new observ ation o t . The re ward encodes the success of the agent’ s behavior , but a re ward R t at time t does not necessarily reflect the quality of the agent’ s action at time t . As an example, if an agent is to steer an autonomous vehicle, receiving a (very) negati ve reward at some instant because the car is crashed into a wall, this reflects a sequence of actions taking earlier then the last action right before the crash, which is known as the credit assignment pr oblem . The reinforcement learning process aims at learning an optimal policy of actions which optimizes the expected accumulated future rew ard V t = ∑ t + τ t 0 = t R t ov er a horizon τ . If agents trained with DRL were deployed to real life scenarios, failures and unexpected behaviors [ LCM ∗ 18 ] could lead to sev ere consequences. This raises new concerns in understanding on what ground models’ decisions (e.g., brake) are based [ RSG16 ]. T o as- sess the decision of a trained model, developers [ HKPC19 ] must explore its context (e.g., a pedestrian on the road, speed, pre vious decisions) and associate it with millions of deep networks param- eters which is not feasible manually . Analysing a decision after- the-fact, referred to as post-hoc interpretability [ Lip16 ], has been a common approach in visualization. It consists in collecting any relev ant information such as inputs and inner-representations pro- duced while the model outputs decision. With such an approach, DRL experts explore their models without having to modify them and face the trade-off between interpretability and performances. V isual analytics for post-hoc interpretability [ HKPC19 ] yields promising results on tasks such as image classification [ OSJ ∗ 18 ], or text prediction [ SGPR17 ]; howev er, it remains an under-explored challenge for DRL with memory . W e built DRL V iz, a novel V isual Analytics interface aimed at making Deep Reinforcement Learning models with memory more interpretable for experts. DRL V iz exposes a trained agent’ s mem- ory using a set of interacti ve visualizations the user can overvie w and filter , to identify sub-sets of the memory in volv ed in the agent’ s decision. DRL V iz targets expert users in DRL, who are used to work with such models (referred to as developers in [ HKPC19 ]). T ypically , those e xperts hav e already trained agents and w ant to in- vestigate their decision-making process. W e validated DRL V iz us- ability with three experts and report on their findings that informed us on future improv ement such as applicability to other scenarios, and nov el interactions to reduce the memory of an agent and better find patterns within it. 2. Context and Background The context of our work is related to building deep neural network models to train robots achieving human assistance tasks in real- world en vironments. As the sample ef ficiency of current RL algo- rithms is limited, training requires a massive amount of interactions of the agent with the en vironment — typically in the order of a billion. Simulators can pro vide this amount of interactions in a rea- sonable time frame, and enable to w ork with a constantly controlled world, that will generate less noise (e.g., a shade) in the agent’ s la- tent representation. W e will discuss in the perspecti ves section the extension of our w ork beyond simulators and the knowledge trans- fer from simulation to real-world scenarios, where v ariability (e.g., lighting, clouds, shades, etc.) and non-deterministic behaviors (e.g., robots may turn more or less depending on its battery charge) occur . 2.1. Navigation Problem Definitions Our focus is on navigation problems, where an agent (e.g., robot, human) moves within a 2D space we call envir onment (Fig. 2 ). An en vironment contains obstacles (e.g., walls), items the agent may want to gather or av oid, and is usually bounded (e.g., a room). The goal of the agent can vary according to the problem variation, but typically is to reach a particular location (e.g., gather items, find a particular spot). Importantly , the goal itself needs to be discovered by the agent through feedback in the form of a scalar re ward signal the en vironment provides: for instance, hitting a wall may provide negati ve re ward, finding a certain item may result in positi ve re- ward. T o discover and achieve the goal, the agent must explore its en vironment using actions. In our case, those actions are discrete and elements of the following alphabet: a ∈ A , with A = {forward, forwar d+right, right, left, forward+left} . The navigation task ends when the agent reaches its goal, or when it f ails (e.g., dies, timeout). As the agent e xplores its en vironment, it produces a trajectory . A trajectory is a series of positions p ( x , y ) in a space S bounded by the environment. Those positions are ordered by time-step t ∈ T , where t 0 < t 1 < t n , and the interval between t n and t n + 1 is the time the agent takes to act. In addition to positions, trajectories con- tain complementary attrib utes b , which may v ary depending on the agent goal (e.g., number of gathered items, velocity , etc.). W e call step t the combination of both the agent position p and its attributes c 2020 The Author(s) Computer Graphics Forum c 2020 The Eurographics Association and John Wile y & Sons Ltd. T . J aunet, R. V uillemot and C. W olf / Understanding Decisions and Memory in Deep Reinforcement Learning b , at a giv en time-step t . Thus st e p t can be represented as follows < p t , b t > . The transition between steps occurs as the agent makes a decision. An episode groups all iterations from the first step at t 0 , until the agent wins or looses at t n . t t t Obstacles Items Environment T rajectory Field of view Agent Perception Memory Decision Action Update -2 -1 t -3 -4 t 4 3 2 1 Controller Input (Image) Output (Action) Perception Update Memory Decision Action Reward Reward Reward Figure 2: Our navigation pr oblem consists in solving a visual task (e.g ., fetc h, interact, or r ecognize items) while avoiding obstacles in an en vir onment. Deep Reinfor cement Learning can be used to solve this problem by using an image as input ¬ at time t . F eatures ar e then extr acted from this image , and combined with the pre vious memory vector t − 1 ® . Using this memory vector , the agent decides to move forwar d or turn left, for instance ¯ . 2.2. Navigation using the V iZDoom Simulation The simulation en vironment we use to train agents to na vigate is V iZDoom [ KWR ∗ 16 ] which pro vides instances of the na vigation problem based on Doom, a very popular video game in the 90’ s. V iZDoom is a 3D world and as such is a proxy problem to mobile service robotics. It supplies dif ferent scenarios focusing on various goals (e.g., surviv e, reach a location, gather items, av oid enemies, etc.). F or expert e valuation, and Fig. 2 we used the k-items scenario from [ BWDS19 ] with k = 4. In this scenario, the agent, walls and items are randomly placed in an en vironment at the beginning of each episode. Then the agent needs to e xplore the environment until it succeed, f ail or reach a timeout of 525 steps. T o succeed the agent must first gather a green armor , then a red armor , followed by a health pack, and finally a soul-sphere (blue circle). Gathering the items in another order instantly kills the agent and ends the episode (fail). Gathering an item in the right order grants a + 0 . 5 reward r , while failing grants a reward of − 0 . 25. Additionally , the agent receiv es a reward of − 0 . 0001 at each step. Despite V iZDoom being a 3D world, the agent positions p are within a bounded continuous 2D plane corresponding to the bird’ s eye view of the environment. W e summarize a time-step t as follo ws: < p t , ( r t ) > . This task is challenging as the agent is required to take a decision on the ne xt action based on partial information of the en vironment, i.e., the task is partial observable. The observ ed image represents the agent’ s field of view (i.e., what is in front of it), in a 90 degree range and unlimited depth. The agent is required to recall previ- ously seen observations in some way as it doesn’t have access to a global view of the map. These views are stored in its latent mem- ory , the representation studied in this work. The agent should also use its memory to encode information on the items it gathered, and the positions of items or walls encountered in order to quickly com- plete this task. 2.3. Deep Reinforcement Lear ning and Memory As expressed in the taxonomy [ ADBB17 ], DRL reached state of the art performance in tasks such as robot control [ LFD A16 ] and board g ames [ SSS ∗ 17 , JBTR19 ] where it e ven surpasses humans in some cases. Recent Deep Reinforcement learning (DRL) models, such as Deep Q-networks (DQN) [ MKS ∗ 13 , MKS ∗ 15 ], and Asyn- chronous Adv antage Actor-Critic (A3C) [ MPBM ∗ 16 ], learned to play video games with human le vel control using only images as in- put. As a result, they achiev ed human-lev el performances on Atari 2600 games [ BNVB13 ] such as breakout. Those models rely on the hypothesis that the optimal action can be decided based on a single frame. Howe ver , these approaches operate on environments that can be totally observed (like a chess or GO board game), and not partially with a field of view which is smaller than the environ- ment. T o address this, an internal latent memory can be intro- duced [ HS15 ] to provide a space the model can use to store an approximation of the history of previous inputs and solve navi- gation problems [ MPV ∗ 16 , ZMK ∗ 17 , OCSL16 ], allowing learning in simulated environments such as Matterport3D [ CDF ∗ 17 ], V iZ- Doom [ KWR ∗ 16 , BWDS19 ]. 2.4. Visual Analytics and Deep Lear ning V isual Analytics hav e been proven to be significantly helpful to deep learning (DL) experts to better understand their mod- els [ HKPC19 ], by providing insights on their decisions and in- ner representations. Such tools can be applied to Recurrent Neu- ral Networks used as memory . In LSTMV is [ SGPR17 ] users can formulate hypothesis on how the memory behaves with respect to the current input sentence. It displays memory elements in a par- allel plot, and by selecting time interv als highlights the most ac- tiv e ones. The re-ordering of memory elements using a 1D t-SNE projection applied to handwriting trajectory prediction [ CHJO16 ] provides an overvie w of the representation and highlight patterns on how different feature dimensions reacts to different path e.g., curvatures. Memory dimensions displayed over the input text of a character level prediction model [ KJFF15 ] highlights characters that trigger specific memory activ ations, and thus provide insights on how certain parts of the memory react to characters (e.g., to quotes). RNN evaluator [ MCZ ∗ 17 ], uses clustering of memory el- ements into grids and associate them to word clusters for each in- put. This tool, also provides additional information on a chosen input in a detail on demand view . RetainV is [ KCK ∗ 18 ], a tool ap- plied to the medical domain, studies how a modified model out- puts its prediction based on data. With RetainV is, a user can probe an interesting data-point and alter it in a what-if approach to see c 2020 The Author(s) Computer Graphics Forum c 2020 The Eurographics Association and John Wile y & Sons Ltd. T . J aunet, R. V uillemot and C. W olf / Understanding Decisions and Memory in Deep Reinforcement Learning how it af fects predictions. T o reach this le vel of interpretability , the model they used is altered, in a way that reduces its performances, which is dif ferent than our approach as visualize the model post- hoc. RNNbow [ CPMC ], is a tool able to handle dif ferent type of input domains, and can be adapted to DRL. Howe ver , RNNbow visualize the training of RNNs rather than their decisions. Such a tool, displays the gradients extracted from the model’ s training, and contextualize it with the input sequence and its corresponding out- put and label. In DRL with memory , the model does not receive a feedback at each decisions, but rather at the end of the game. This mak es RNNbow more dif ficult implement as it produces large batches on which this tool have issues scaling to. As the authors mentioned, RNNbow targets non-experts user, and a domain spe- cific tool may be required for experts. As demonstrated by those tools, a decision at a time-step t can be affected by an input seen at t − n . In our case, such inputs are images and experts must first asses what the model did grasp from them before exploring what is stored in the memory . In addition the rewards from navigation tasks, are often sparse which results in a lack of supervision over actions, known as the credit assign- ment problem inherent to RL problems (the re ward provided at a giv en time step can correspond to decisions taken at arbitrary time steps in the past). The model interacts with an en vironment it only sees partially , therefore, its performances can be altered by factors outside its inputs. This forces experts to visualize multiple time- steps in order to analyse a single decision which makes them more difficult to analyse with e xisting tools. T o our knowledge, DRL visualizations are under-represented in the literature compared to other methods on visualizing deep learn- ing. LSTM activ ations from an A3C agent [ MPV ∗ 16 ] ha ve been displayed using a t-SNE [ VDMH08 ] projection. Despite being ef- fectiv e for an overvie w of the agent’ s memory , it offers limited in- formation on the role of the memory . T -SNE projections hav e also been applied to memory-less DRL agents on 2D Atari 2600 games, in the seminal DQN paper [ MKS ∗ 15 ], and in [ ZBZM16 ]. DQN- V iz [ WGSY18 ] displays the training of memory-less models under 4 perspectives. First an ov erview of the complete training, action distribution of one epoch, a trajectory replay combined with metrics such as rew ards and whether an action was random. DQNV iz also includes a details vie w to explore CNN parameters. Such a tool, demonstrates the ef fectiv eness of visual analytics solutions applied to DRL. Ho wever , DQNV iz focuses on the training of the model, and how random decisions through training can affect it. In addi- tion, the model of DQNV iz is limited to fully observable 2D en vi- ronments in which the only movements av ailable are left or right and thus cannot be applied to navigation tasks. Finally , DQNV iz is not designed to display or analyze any memory . In this paper , we address the under-e xplored challenge of vi- sualizing a trained DRL model’ s memory in a 3D partially ob- served en vironment. W e contextualize this memory with output de- cisions, inputs, and deriv ed metrics. W e also provide interaction to ov erview , filter , and select parts of such memory based on this con- text to provide clues on agents decision reasoning and potentially identify how the model uses its memory elements. 3. Model and Design Goals This section presents the model we used to design and implement DRL V iz. W e describe the inner workings of those models and data characteristics. One ke y aspect being how the memory of DRL is created and updated by the agent, ov er space and time. Note that those data will be generated and then visualized with DRL V iz after the training phase. 3.1. DRL Model The DRL model we relied on only recei ves pixels from an RGB image as input, from which it decides the action the agent should perform with the Adv antage Actor-Critic (A2C) [ MPBM ∗ 16 ] algo- rithm. The model is composed of 3 conv olutional layers followed by a layer of Gated Recurrent Unit (GR U) [ CGCB14 ], and Fully Connected (FC) layers to match the actions set A . This model is in- spired by LSTM A3C as presented in [ MPV ∗ 16 ] with A3C instead of A2C, and a LSTM [ GSK ∗ 17 ] instead of GR U. Those changes re- duce the agent’ s training time, while preserving its performances. The underlying structure that allows our model to associate raw pixels to an action is illustrated on Fig. 2 and described as follo ws: Stage 1: En vironment → Image. First, the agent’ s field of view is captured as image x t , i.e. a matrix with dimensions of 112 × 64 with 3 RGB color channels. Stage 2: Image → Featur e vector . The image x t is then analyzed by 3 con volutional layers designed to extract features f t , result- ing in a tensor of 32 features shaped as a 10 × 4 matrices. These features are then flattened and further processed with a Fully Con- nected (FC) layer . Formally , the full stack of conv olutional and FC layers is denoted as function f t = Φ ( x t , θ Φ ) with trainable parame- ters θ Φ taking x t as input and giv en features f t as output. Stage 3: (Featur es + previous memory) → New memory . The model maintains and updates a latent representation of its inputs using a Gated Recurrent Unit (GR U) [ CGCB14 ], a variant of recurrent neural networks. This representation, called hidden state h t , is a time varying vector of 128 dimensions, which is updated at each time-step t with a trainable function Ψ taking as input the current observation, encoded in features f t , and the previous hidden state h t − 1 , as follows: h t = Ψ ( h t − 1 , f t , θ Ψ ) . Stage 4: Memory vector → Action. The model maps the current hidden state h t to a probability distribution ov er actions A using a fully connected layer followed by a softmax activ ation function, denoted as the following trainable function: a t = ξ ( h t , θ ξ ) with trainable parameters θ ξ . The highest probability corresponds to the action a t which the agent estimated as optimal for the current step t . The full set of parameters θ = { θ Φ , θ Ψ , θ ξ } is trained end-to- end. W e used 16 parallel agents and updated the model ev ery 128 steps in the en vironments. The gamma factor was 0 . 99, and we used the RMSProp [ TH12 ] optimizer with a learning rate of 7 e − 4. W e trained the agent ov er 5M frames, with a frame skip of 4. During training, the agent does not necessary pick the action with the high- est probability , as it needs to explore its en vironment, and ev en- tually find better solutions. Ho wev er, once the agent is trained, it always chooses the action with the highest probability . c 2020 The Author(s) Computer Graphics Forum c 2020 The Eurographics Association and John Wile y & Sons Ltd. T . J aunet, R. V uillemot and C. W olf / Understanding Decisions and Memory in Deep Reinforcement Learning Activated element Not activated element t t t t t -2 -1 +1 +2 Elements T ime-steps Start (T ) End (T ) 0 525 0 128 Activated Not activated Positive value Negative value Activated Not activated Positive value Negative value Figure 3: Memory construction pr ocess: at a curr ent time-step t , the agent updates its memory by producing a new memory vec- tor . Each dimension of this vector (r epresented as a column) is ap- pended to the pr evious ones chr onologically (fr om left to right). As a result, each r ow of the appended vectors repr esent the actions of a single memory element. 3.2. Constructing the Memory of DRL In the partially observed na vigation problem we focus on, the agent only sees the current observ ation, i.e., what is in its field of view at the time-step t . Ho wever , past observations are also relev ant for decision making (e.g., to gather previously seen items). Therefore the agent needs to build a representation of relev ant information extracted from the history of observations. This information is en- coded in h t , a high dimensional (128 in our case) time v arying vec- tor . Fig. 3 represents the construction process of the hidden states matrix, which consists of the hidden states h t ov er the time of an episode — the central visualization in DRL V iz (Fig. 1 ). Each hid- den state is v ertically aligned per time-step t at which they are pro- duced. Therefore, the accumulation of hidden states forms a large 2D matrix, where the horizontal axis is time ( h t − 1 < h t < h t + 1 ) and the rows are elements. A ro w of this 2D matrix represents the ev olution and activity of a hidden state element through time and space as the agent mov es. The acti vity of a hidden state element is characterized by its value. In our case, each element of the hid- den states is a quantity within the range [ − 1 , 1 ] . A value close to 0 represents lo w activity , whereas a value close to an y extremity rep- resents high activity . As it can be seen in Fig. 3 , hidden states can drastically change their v alues between two time-steps. Such value changes can be widely observ ed across hidden states elements dur- ing episodes. Howe ver , it remains unclear which elements, corre- spond to which representations, and thus, responsible for decisions. Norms of latent activ ations are an informativ e way of visualiz- ing influences [ CBYCT19 , ZKL ∗ 16 ]. With modern training meth- ods such as weight decay , dropout and batch normalization, it is highly improbable that a high activ ation can occur for unused features. An alternati ve to hidden state activations would be to analyze gradients of action probabilities with respect to hidden states [ SCD ∗ 17 , CPMC ]. Such an approach can provide informa- tion on how a chosen action is directly tied to the current state of the memory , and which dimension influences the more this deci- sion. Ho wev er, in DRL V iz we focus on actions through the episode as a sequence rather than small sub-sequences. When visualizing activ ations of an LSTM on text, Karpathy et al. [ KJFF15 ] discov- ered a pattern occurring outside back-propagation limitations of the gradient signal. A solution would be to display both acti vations and gradients, howe ver preserving the usability and interpratbility of a tool con veying such information is challenge yet to be tackled. 4. Design of DRL Viz W e built DRL V iz as a visual analytics interface to understand the connections between the latent memory representation (as de- picted in Fig. 3 ) and decisions of an agent trained using Deep Reinforcement Learning. DRL V iz primarily exposes the internal memory (Fig. 1 ) which is interactive and provides overviewing , filtering and r eduction both for exploration and knowledge gen- eration [ KAF ∗ 08 ]. DRL V iz is designed towards experts in DRL to identify elements responsible for both lo w-level decisions (e.g., mov e to wards a spotted HP) and eventually higher-le vel strategies (e.g., optimizing a path). 4.1. Design Motivation and Goals W e iterativ ely built DRL V iz with frequent meetings from col- leagues experts in DL and DRL (a total of 12 meetings with three experts ov er 7 months). W e first identified their current process to analyze trained agents, e.g., recording videos to playback agents episodes (from its point of view) and decisions (actions probabil- ity) to get a sense of the strategy . W e also observed experts do a system print of the models’ inner v alues, sometimes add conditions to those prints (e.g., when an item is in the field of view of the agent), and manually look for unusual v alues. Our approach w as to re-build a similar interface in DRL V iz with input/output views and facilitate playback, b ut 1) in an interactive way , and 2) by adding advanced, coordinated views to support advanced models visual- ization aimed at models developers [ HKPC19 ] (e.g., view on the agent’ s memory). Based on a revie w of the current practices of researchers from our focus group, and related work, we identified the following de- sign goals ( G ) to be addressed to understand the behavior of a trained agent using a learning model for navigation problems: G1 Show an agent’s decisions over (a) space and (b) time , es- pecially input and outputs of the model. G2 Expose the memory’s internal structur e , i.e., the temporal vector b uilt over time (Fig. 3 ). G3 Link memory over (a) time and (b) decisions with multiple endpoints, e.g., starting from any time, location, memory or tra- jectory point. G4 Filter a sub-set of the memory (a sub-space) tied to a specific agent behavior or strate gy . 4.2. Overview and W orkflow of DRL Viz Fig. 1 shows an o verview of DRL V iz where the most prominent visualization is the memory timeline of a trained agent ( G2 ). The primary interaction is bro wsing the timeline and playback the input video feed and action probabilities ( G1 ). Be yond re-playing sce- narios, DRL V iz implements multiple interactions to: c 2020 The Author(s) Computer Graphics Forum c 2020 The Eurographics Association and John Wile y & Sons Ltd. T . J aunet, R. V uillemot and C. W olf / Understanding Decisions and Memory in Deep Reinforcement Learning 1. Overview the memory and check what the agent sees and its de- cisions; visual cues for selection are dark, consecutive patterns (Fig. 3 ). 2. F ilter the timeline when something is of interest, e.g., related to the activ ation, but also with additional timelines (actions, etc.). 3. Select elements whose acti vation behavior is linked to decisions. Those elements are only a subset of the whole memory and are visible on Fig. 1 à . Those interactions are carried out using a vertical thumb similar to a slider to e xplore time-steps t and select interv als. Such a selec- tion is propagated to all the views on the interface, whose main ones are ima ge (per ception) and pr obabilities (of actions) which pro vide context on the agent’ s decisions ( G1 (b)). The input image can be animated as a video feed with the playback controls, and a salienc y map overlay can be activated [ SDBR14 , GKDF17 ] representing the segmentation of the image by the agent. The trajectories view (Fig. 1 ) displays the sequence of agent positions p t − 1 > p t > p t + 1 on a 2D map ( G1 (a)). This view also displays the items in the agent’ s field of view as colored circles matching the ones on the timeline. The position p t , and orientation of the agent are repre- sented as an animated triangle. The user can brush the 2D map to select time-steps, which filters the memory view with correspond- ing time-steps for further analysis ( G3 (a)). DRL V iz, also includes a t-SNE [ VDMH08 ] view of time-steps t using a two-dimensional projection (Fig. 1 bottom left). T -SNE is a dimensionality reduc- tion technique, which sho ws similar items nearby , and in this vie w , each dot represents a hidden state h occurring in a time-step t . The dot corresponding to the current time-step t is filled in red, while the others are blue. The user can select using a lasso interaction clusters of hidden states to filter the memory with the correspond- ing time steps. Dimensions among the selected hidden states can then be re-ordered with any criteria listed in T able 1 , and brushed vertically (Fig. 1 ¯ ). The result of such an exploratory process is the subset of ele- ments of the memory (rows) that are linked to an agent’ s decision (Fig. 1 ¯ ). This addresses the design goal G4 . Such subset can be seen as a memory reduction which can be used as a substitute to the whole memory (we will discuss it in the perspecti ve sections). This subset can also be used in other episodes listed as clickable squares at the bottom left corner of DRL V iz. 4.3. Memory Timeline V iew The memory timeline exposes the memory’ s internal structure ( G2 ), which is vector (v ertical column) of 128 dimensions over 525 time- steps as a heat-map (Fig. 1 ) from which an interv al can be brushed for further analysis. Each cell (square) encodes a quan- titativ e value, whose construction is illustrated in Fig. 3 , using a bi-variate color scale from [ LB04 ] with blue for negati ve values and orange for positiv e v alues. Preserving the values as they were initially produced by the model is pertinent as some memory el- ements (ro ws) can have both positi ve and negativ e v alues, which may not have the same signification for the model and thus cause different decisions. This will be further e xplored in Sec. 6.4 . By default DRL V iz displays the vector as it is produced by the model, hence the order of elements has no particular semantic. The Criteria Formula Description AC T I V A T I O N n ∑ t = 1 | h t i | Elements most in volved in decisions. C H A N G E n − 1 ∑ t = 1 | h t i − h t + 1 i | Maximal change. S TA B L E C H A N G E − 1 Minimal change. S I M I L A R | 1 n n − 1 ∑ t = 1 h t i − 1 k k − 1 ∑ t = 1 h t j | Elements in av erage different during an interval of k time-steps than outside it. T able 1: List of re-or dering criteria as they appear in DRL V iz. t is the curr ent time-step, n the number of steps ( 525 at most), and i the element. Metric Data T ype V alues Health of the agent Quantitativ e death [0,100] full Event (item gather ed) Flag (1) gathered Item in F oV Binary no item (0, 1) item Orientation to items Degree left [-45,45] right V ariation of orientation Quantitativ e stable [0,30] change Decision ambiguity Ratio sure [0,1] unsure T able 2: List of deriv ed metrics (from top to bottom on F ig . 1 ® ) memory can be re-ordered using a drop-down menu according to comparison criteria listed in table 1 . W ith the AC T I V A T I O N criteria, a user can observe elements that may be most inv olved in deci- sions, while with C H A N G E , elements that may be the most used by the model are emphasized, with S I M I L A R , a user can see elements with constant activations during selected interv als. In addition of those criteria, we provided the possibility to re-order the memory as presented in [ CHJO16 ] i.e., a one dimensional t-SNE projection of the absolute values. The re-ordering can either be applied to the whole memory or a selected interval. An order is preserved across memory filters and episodes until the user changes it. 4.4. Derived Metrics V iew The derived metrics timeline addresses the design goals G3 and G4 . It represents metrics calculated from ground truth information pro- vided by the simulator . Those metrics aim at supporting the user in finding interesting agent behaviors such as What does a trained agent do when it has no health pack in its field of view? . The view encodes measures of both the inputs (e.g., health pack is spotted) simulator (e.g., re ward) and outputs (e.g., actions). Finally DRL V iz features a stacked area chart of actions probabilities encoding prob- abilities per action represented by colors corresponding to the ones on the action distribution graph in 1 . W ith this visualization, users can observe similar sequences of decisions. The derived metrics and stacked area chart are below the memory timeline and share the v ertical thumb from the memory slider ( G3 (a)) to facilitate comparisons between the memory and the behavior of the agent ( G3 (b)) as depicted in Fig. 4 . The de- riv ed metrics can be dragged v ertically by the user as an o verlay of the memory to compare metrics with activation values, and identify memory elements related to them ( G4 ). A constant acti vation of an c 2020 The Author(s) Computer Graphics Forum c 2020 The Eurographics Association and John Wile y & Sons Ltd. T . J aunet, R. V uillemot and C. W olf / Understanding Decisions and Memory in Deep Reinforcement Learning 2 4 3 1 Figure 4: DRL V iz allows to compare selected time intervals ¬ . F or instance to compare when agents face dead-ends and when the y face health-packs ® . One can observe that more elements ar e active while the agent is facing HPs than while facing a dead-end. P erhaps those elements ar e encoding information concerning HPs. When facing a dead-end, both the orientation variation and de- cision ambiguity are high which can be interpr eted as the agent hesitating on which action to c hoose. element during the same intervals of a metric such as HP in F oV , while being different otherwise; may hint that they are related. W e provide a full list of metrics in table 2 . T wo metrics are particularly complex and described as follo ws: V ariation describes how the the agent’ s orientation (i.e., its FoV) changes over three consecutiv e time-steps. High variations indi- cate hesitation in directions and intervals during which the agent turns around, whereas lo w v ariations indicate an agent aligned with where it wants to go. Ho wev er, in some cases (e.g., the agent stuck into a wall), actions may hav e no effect on the agent’ s orientation which lead the variation to remain lo w . Ambiguity of a decision is computed using the variance V of action probabilities. The variance describes ho w uniform actions proba- bilities are with respect to the mean. A variance V = 0 indicates that there is no difference between actions probabilities, and hence that the agent is uncertain of its decision. In the other way , a high variance represents strong differences in the actions probabilities and the agent’ s high confidence on its decision. Since the sum of all actions probabilities equals to 1, the variance is bounded within the range [ 0 , 1 ] . T o ease the readability , the variance is inverted as it follows: ambiguit y = 1 − V . An ambiguity close to 1 represents an incertitude in the agent’ s decision. 5. Implementation T o explore the memory of a trained agent, one needs to create in- stances of exploration scenarios. For experts e valuations (Sec. 6 ) we used a trained agent to explore 20 times the en vironment with different configuration (i.e., positions of items, start position of the agent, its orientation). During those episodes, we collected at each time-step information from the agent such as its FoV image, action probabilities, memory vector , and information from the en viron- ment such as the items in the agent’ s FoV , the position of the agent, the agent’ s orientation and its health. The collected data is format- ted as a JSON file which groups data elements per episodes and then per steps with an a verage of 30Mo per episode. Those data are generated using DRL models implemented in Pytorch [ PGC ∗ 17 ], and formatted in Python 3. More technical details are provided as supplemental material. The user interface of DRL V iz loads data using JavaScript and D3 [ BOH11 ]. The interactions between the model and the front-end are handled by a Flask Python serv er . The data, sep- arated per episode is generated in a plug-in fashion i.e., with- out altering the model nor the simulator . Both the interface code source ( https://github.com/sical/drlviz) and an limited interactiv e prototype ( https://sical.github. io/drlviz) are av ailable online. 6. Experts Evaluation W e conducted a user study with three DRL experts who are experi- enced researchers building DRL models and match the target pro- file for DRL V iz [ HKPC19 ]. W e report on their use of DRL V iz, as well as insights they gathered. Those results may not be confirmed or denied using DRL V iz, but provide hints to formulate hypothe- sis that can then be studied outside DRL V iz e.g., through statistical evidence. 6.1. Protocol and Navigation Pr oblem W e recruited three DRL experts (Expert #1, Expert #2, Expert #3) from two different academic laboratories to e valuate DRL V iz. They were shown a 10 minutes demonstration of DRL V iz on a sim- ple V iZDoom scenario: health gathering supr eme . The e valuation started with DRL V iz loaded with data extracted from a model de- veloped by Expert #1, and ended after 35 minutes, during which experts could explore the displayed data. While using DRL V iz ex- perts were told to explain their thoughts and what they wanted to see. Then, experts were asked to fill a post-study questionnaire to collect their first impressions with open questions such as "Which part of DRL V iz was the least useful?" . The evaluation ended with a discussion guided by the post-study questionnaire on their expe- rience using DRL V iz and how it can be improved. The complete ev aluation lasted in average 1 hour depending on the length of the discussion. The model used was an A2C [ MPBM ∗ 16 ] with 3 con- volutional layers and GR U layer with 128 dimensions as memory . 6.2. Feedback from Expert #1 Expert #1 is the most experienced expert for this evaluation as he designed both the model and the navigation task [ BWDS19 ] and created animations of agents behaviors. Expert #1 w as our primary collaborator to design and build DRL V iz. Fig. 5 sho ws DRL V iz loaded with the k-item scenario. Expert #1 first selected an interval corresponding to the agent searching and gathering the last item. This interv al started one step after the agent gathered the HP (third item), and ended as the agent gathered the soul-sphere (last item). Expert #1, then used the C H A N G E criteria to re-order the interval. While replaying it, he noticed tw o elements c 2020 The Author(s) Computer Graphics Forum c 2020 The Eurographics Association and John Wile y & Sons Ltd. T . J aunet, R. V uillemot and C. W olf / Understanding Decisions and Memory in Deep Reinforcement Learning Gathering soul-sphere Same dead-end Gathering armor 6 3 4 1 5 Flag for seeing health pack 2 8 2 Focus on item 9 7 Figure 5: Summary of the insights gained by the e xperts. Expert #1 noticed two intervals during whic h the agent only turned right, by using both trajectory ¬ and stac ked area chart of actions views. Once he replayed those sequences, he stated that the ag ent came twice in the same dead-end ® . Expert #3 observed a hidden state dimension whic h is blue when the ag ent sees the r ed armor befor e the gr een armor , and then remained orange until when he saw the green armor ¯ . Expert #2 probed a dimension that is active as the agent first saw the HP , and r emained active until it gathered it. Expert #1 also identified two hidden state elements that c hanges as the a gent gather ed the health pac k and then kept their values until the end of the episode ± . Using saliency maps ² , Expert #2 observed that the agent ignor ed the soul-spher e until it gather ed the first thr ee items ³ . Finally , Expert #3 identified clusters in the t-SNE pr ojection which corresponds to the agent’ s objectives e.g ., gathering the green armor ´ . with similar activ ations (Fig. 5 ± ). Those elements remained blue during the interv al, ho wev er the y were inactivated (gray) during the rest of the episode. With further inv estigation, Expert #1 noticed that those elements were active 4 steps before the agent gathered the HP . Expert #1 described those elements as flags i.e., elements that encodes binary information. Expert #1’ s intuition was that the agent learned to complete the na vigation problem by focusing on one item at the time. And only used its memory to encode informa- tion on items it already gathered, and hence which item it should currently gather . Expert #1 concluded that the tw o elements may be the agent’ s r epresentation that it gather ed the HP , and hence that it should now f ocus on gathering the soul-sphere. Then using the action probabilities temporal stacked area chart (Fig. 5 ), Expert #1 noticed a specific time interval dur - ing which the agent repeated the same action for almost 15 steps. Intrigued by such beha vior , Expert #1 replayed this interval and no- ticed that the agent was within a dead-end (Fig. 5 ® ) and repeated the action right until it changed its orientation up to 180 degrees. Expert #1 commented that observing such interval is interesting be- cause as the agent con ver ges to wards an optimal policy , it may ha ve less chances to encounter dead-ends, and thus for got ho w to escape them. Expert #1 also observed a similar interv al with only right ac- tions in which the agent escaped the same dead-end. Expert #1 concluded that the dead-end was not encoded in the agent’s memory , and hence the agent retur ned to it while sear ching for items. 6.3. Feedback from Expert #2 Our second expert, Expert #2, started by re-ordering the memory using the S TA B L E criteria. He noticed a hidden state element, and zoomed (vertical brush) on it. This element had continuous acti- vations starting as the agent first saw the HP and remained acti ve until the agent gathered both the red armor and the HP . Because such element is active r egardless of the items the agent gath- ered yet, Expert #2 interpr eted this element as a flag encoding if the agent has seen the health pack or not. Then Expert #2 focused on the saliency maps combined with episode playback. He noticed that in one episode, the agent en- countered the soul-sphere (last item) before it gathered the red armor (second item). During those time-steps, the saliency maps are not activ ated towards the soul-sphere despite being the agent’ s FoV (Fig. 5 ² ), and the memory had no visible changes. Expert #2 intuition was that the agent did not perceived the item. In the final steps of the episode, once the agent gathered the firsts 3 items and then re-encountered the soul-sphere, the saliency maps were acti- vated towards it (Fig. 5 ³ ) and the memory activations changed. c 2020 The Author(s) Computer Graphics Forum c 2020 The Eurographics Association and John Wile y & Sons Ltd. T . J aunet, R. V uillemot and C. W olf / Understanding Decisions and Memory in Deep Reinforcement Learning Expert #2 expressed that "It is interesting because as soon as it sees it [the soul-sphere] its behavior changes" . Expert #2 con- cluded that the agent intentionally ignored the soul-sphere be- for e it gathered pr evious items, and as Expert #1 mentioned, the agent learned to solve this navigation problem by f ocusing on one item at a time. 6.4. Feedback from Expert #3 Expert #3 began his exploration with the t-SNE 2D projection as entry point to identify clusters of hidden states. Expert #3 se- lected groups of states using the lasso selection (Fig. 5 ´ ) to filter the memory timeline. The selected cluster represented consecutive steps, forming a continuous time interval. After replaying this in- terval, Expert #3 observed that it started at the beginning of the episode and ended when the green armor (first item) entered the agent’ s FoV . Expert #3 interpr eted this cluster as correspond- ing to an agent objective, in this case gathering the first item. Follo wing up on the pre viously identified cluster , Expert #3 re- ordered it with the S TA B L E criteria. Expert #3 noticed one particu- lar hidden state dimension that w as activ ated in blue until the green armor entered the agent’ s FoV , and then was activ ated in orange for the rest of the episode. Expert #3 interpreted such element ac- tiv ation as a flag encoding if the agent has seen the green armor . Howe ver , after observing this element activations across episodes, Expert #3 noted that it was inactivated (grayish) at the start of an episode. After re-playing this episode he observed that the agent had no armor in its FoV , as opposed to the first episode analyzed where the agent started with the red armor in its F oV . In another episode, where the agent has the green armor in its FoV since the start, the element was constantly activated in orange. Expert #3 concluded that this element encoded if the agent saw an ar- mor rather than just the green armor . Howev er, once the agent gathered the green armor , the element remained orange despite still having the red armor in the agent’ s F oV . Expert #3 added that this element also encodes if the agent gathered the gr een armor . 7. Discussion In this section, we discuss the collected feedback from experts, as well as the limits of the current version of DRL V iz. 7.1. Summary of Experts Feedback Experts filled a post-study questionnaire relative to DRL V iz use- fulness and usability . Overall DRL V iz was positi vely received by all them: both Expert #1 and Expert #2 stated that DRL V iz is " in- ter esting to explain the behavior of the agent " and " easy to use ". Howe ver , Expert #3 stated that he felt " overwhelmed at first, but soon got used to navigation ". All 3 e xperts ev aluated the 2D t-SNE projection as the most useful view because it can provide insights on the agent’ s memory and strate gies. They used this vie w as entry point on at least one episode. They commented that the re-ordering was effectiv e to observe desired hidden states dimensions. Both Ex- pert #2 and Expert #3 used the S TAB L E criteria because it high- lights elements that are different from the rest and should corre- spond the selected interval. In the other hand, Expert #1 preferred the C H A N G E re-ordering criteria because those elements have in- formation concerning the interval. Expert #3 also noted that " itÂt ’s handy being able to dra g it up [derived metrics timeline] and over - lay it on the hidden states " ( G3 ). The experts concluded that the agent learned to solve this task sequentially , i.e., by focusing on gathering one item at the time. And thus that the agent only stored information corresponding to which items its has gathered rather than the positions of ev ery seen items at any time-steps. All three experts e valuated the memory reduction interaction that filters the memory view (zoom) not intuitiv e and hard to use with- out loosing visual contact with the hidden state dimensions they wanted to focus on. This partially validates our memory reduction goal ( G4 ). On this matter , Expert #1 commented that since this agent’ s memory has 128 dimensions the zoom is not as useful as it could on lar ger memories. Expert #2 also commented on the use of the different re-ordering criteria, and that their specific functioning was hard to understand, especially the projection. Expert #3 also mentioned that he " doesn’t fully understand how the projections r e-ordering methods ar e helpful ". T o tackle those issues, Expert #3 suggested to use the derived timeline to re-order the memory , i.e., observe hidden states activ ations when a feature enters the FoV . Expert #3 also commented that a horizontal zoom could be useful to focus on one particular time interval, and reduce the number of steps to observe. Expert #1 mentioned that brushing the memory while keeping activ ation areas as squares , i.e., both horizontally and vertically could be a better way to implement a more consis- tent zooming interaction. 7.2. Limits Generalization and scalability are the main limits of the current version of DRL V iz. Regarding generalization, specific calculations need to be made such as for the derived metrics timeline that is generated from the simulator i.e., the items in the agent’ s FoV . So the current metrics are tied to V iZDoom b ut minor adapta- tion of the tool to specific en vironments will be needed, but re- quiring technical knowledge. In the next section we will explain how the interaction techniques in DRL V iz can be used beyond the tool for better timeline comparisons. Scalability is always a con- cern with visualization techniques. DRL V iz supports long episodes and variable memory size. Howe ver , if those are larger than the screen real estate (e.g., beyond on average 1200 steps and more than 1000 memory dimensions) each memory cell would be smaller than one pixels, and thus difficult to in vestigate. T o tackle such an issue, LSTMV is [ SGPR17 ] introduced a parallel coordinate plot with each line encoding a memory element. Ho wev er, with DRL V iz we sought to support trend detection and thus encode the memory ov erview using colored stripes [ FFM ∗ 13 ] which complies with our data density challenge and requirement to align the memory with the derived metrics belo w . W e then rely on zoom interactions for details for both time and elements. W e plan in the future to support aggregation strate- gies [ WGGP ∗ 11 ] to provide more compact representation of the timelines. Alignment by ev ent of interest [ DWPQ ∗ 08 ] (e.g., gathering an item) may also pro vide more compact representations of metrics, and also better support comparison of behavior before and after this ev ent. A concern raised by experts was the com- c 2020 The Author(s) Computer Graphics Forum c 2020 The Eurographics Association and John Wile y & Sons Ltd. T . J aunet, R. V uillemot and C. W olf / Understanding Decisions and Memory in Deep Reinforcement Learning munication of insights gained during the exploration process. W e plan to explore summarizing techniques for those insights, such as state charts [ STST18 ] in which each state corresponds to a local strategy e.g., reach an item. 8. Perspectives W e present and discuss three works in progress that may be po- tential improvements of DRL V iz, based on experts feedback, that primarily expand its e xploration power and generalization. 8.1. Memory Reduction As experts noticed during interviews, agents memory can often be sparse (e.g., Fig. 1 ) or hold redundancy (e.g., Fig. 5 ± ). Thus we hypothesize that some elements may either nev er be activ ated or there might be multiple, redundant activ ation at the same time. W e conducted an experiment to assess that some sub-set of the mem- ory is sufficient to solve a navigation problem, and the rest may be discarded. W e used the health gathering supr eme scenario in which the agent must collect HPs to surviv e, hence it is easier to solve than k-item. W ith a larger memory of 512 dimensions, we "remov ed" hidden state elements by multiplying them by 0 during the experiment. T able 3 shows similar performances between agents with full and top half memory re-ordered with A C T I V AT I O N on the health gathering supr eme scenario and a large 512 memory of 512 dimen- sions. One h ypothesis to draw is that the agent has at least 256 non- essential elements. Efficient selection of those elements remains a challenge, as it must account complex temporal dependencies. W e built an explorable visualization [ JVW19 ] to support this pro- cess manually and implemented se veral strate gies, to compare with agents beha vior (e.g., being hesitant and producing mistakes such as running in circles or bumping into walls which could have been av oided using its full memory). This pav es the way for direct fil- tering by elements of the memory heat-map in a future version of DRL V iz, as the current version only selects temporal interv als. 8.2. Guiding Exploration with Extended Timelines During our interviews, experts suggested to better support the memory analysis process, as the current version of DRL V iz relies on visual exploration by the user , with no specific guidance. W e identified two areas of improvement for a future version of DR- L V iz: adding more metrics, and advanced filtering. Regarding the metrics, table 2 introduced deri ved indicators from the agent de- cision. Fig. 6 illustrate that more metrics can be added using vari- ations of their parameters (e.g., changing variability thresholds or T ype of reduction Steps HP Poison Health surviv ed gathered gathered Full-memory 503.98 37.56 4.28 81.47 Half-memory 493.92 37.88 4.66 81.61 T able 3: P erformances of agents with differ ent memory reduction strate gies (each aver aged over 100 episodes). the distance to consider an enemy is in the FoV or not) which sup- port more questions a user may w ant to inv estigate. Such metrics are represented in a compact way , and easy to activ ate by scrolling down, while remaining focused on the memory . Regarding the comparison, the current version only implements juxtaposition and overlay ; while explicit encoding [ GA W ∗ 11 ] is a third way to com- pare timelines and memory . W e applied this third way by adding a boolean queries builder [ LGS ∗ 14 ] using AND or OR to filter time- lines. Those boolean operators are also applicable to all views of DRL V iz, such as 2D-map, t-sne or a brush on the memory . This helps users to combine multiple vie ws and answer question such as Wher e ar e the ar eas of memory with the agent has high health, in this part of the en vir onment, with an enemy and an e xplosive barr el in F oV? . This results into intervals in which the agent is susceptible to shoot on barrels to kill enemies. In order to summarize the input images and ease their com- parison with deriv ed metrics, we de veloped slit squar e interaction based on slit tears [ TGF09 ]. W ith slit square, a user can brush a square on the inputs. Those squares are then compacted to with the width shared by all time-aligned elements in DRL V iz. 8.3. Generalization to other Scenarios and Simulations Finally , we started in vestigating using DRL V iz as a general-purpose tool for any trained agents with a memory and spatio-temporal informations. Fig. 6 illustrates DRL V iz loaded with a dif ferent scenario where the agent shoots towards enemies on the death- match [ LC17 ] with the Arnold model. In general, DRL V iz can be used beyond V iZDoom (e.g., referred in [ BWDS19 ]), such as Atari games [ WGSY18 ] without any major change. Using pixel- based representations [ Kei00 ] and zooming [ KAL ∗ 18 ] would as- sure scalability of the timeline representations with scenarios re- quiring more time steps. W e plan to conduct further research to identify other metrics and extend DRL V iz to other simulators mentioned by our experts, such as Matterport3D [ CDF ∗ 17 ] and Habitat-AI [ SKM ∗ 19 ] for real-world scenarios, and competitions such as Animal-AI [ CBH19 ]. 9. Conclusion In this work, we introduced DRL V iz, a visual analytics inter- face which allows users to overview , filter and select the memory of Deep Reinforcement Learning (DRL). Analysts using DRL V iz were able to explain parts of the memory of agents trained to solve navigation problems of the V iZDoom game simulator , in particular local decisions and higher lev el strategies. DRL V iz receiv ed posi- tiv e feedback from experts familiar with DRL models, who man- aged to browse an agent memory and form hypothesis on it. DR- L V iz paves the way for tools to better support memory reductions of such models that tend to be large and mostly inacti ve. 10. Acknowledgement This research was partially funded by the M2I project http://www.mob2i.fr/ , Projet In vestissement d’A venir on urban mobility by the French En vironment Agency (ADEME). c 2020 The Author(s) Computer Graphics Forum c 2020 The Eurographics Association and John Wile y & Sons Ltd. T . J aunet, R. V uillemot and C. W olf / Understanding Decisions and Memory in Deep Reinforcement Learning 1 3 2 Figure 6: Extended version of DRL V iz loaded on with death-match data. F rom a slit squar e selection ¬ outputs a timeline that summarizes the agent’ s point of view . And the additional metrics and oper ators ® . References [ADBB17] A RU L K U M A R A N K . , D E I S E N RO T H M . P . , B R U N DAG E M . , B H A R ATH A . A . : Deep Reinforcement Learning: A Brief Surve y. IEEE Signal Processing Magazine 34 , 6 (11 2017), 26–38. doi:10.1109/ MSP.2017.2743240 . 3 [BNVB13] B E L L E M A R E M . G . , N A D DA F Y . , V E N E S S J . , B O W L I N G M . : The arcade learning environment: An evaluation platform for gen- eral agents. Journal of Artificial Intelligence Resear ch (2013). 3 [BOH11] B O S TO C K M . , O G I E V E T S K Y V . , H E E R J . : D3: Data-Driv en Documents. IEEE T rans. V isualization & Comp. Graphics (Pr oc. Info- V is) (2011). 7 [BWDS19] B E E C H I N G E . , W O L F C . , D I BA N G O Y E J . , S I M O N I N O .: Deep Reinforcement Learning on a Budget: 3D Control and Reasoning W ithout a Supercomputer . arXiv pr eprint arXiv:1904.01806 (2019). 3 , 7 , 10 [CBH19] C RO S B Y M . , B E Y R E T B . , H A L I NA M .: The animal-ai olympics. Natur e Machine Intelligence 1 , 5 (2019), 257. 10 [CBYCT19] C A D E N E R . , B E N - Y O U N E S H . , C O R D M . , T H O M E N .: Murel: Multimodal relational reasoning for visual question answering. In Pr oceedings of the IEEE Confer ence on Computer V ision and P attern Recognition (2019), pp. 1989–1998. 5 [CDF ∗ 17] C H A N G A . , D A I A . , F U N K H O U S E R T. , H A L B E R M . , N I E S S - N E R M . , S A V V A M . , S O N G S . , Z E N G A . , Z H A N G Y .: Matterport3D: Learning from RGB-D Data in Indoor En vironments. International Con- fer ence on 3D V ision (3DV) (2017). 3 , 10 [CGCB14] C H U N G J . , G U L C E H R E C . , C H O K . , B E N G I O Y .: Empirical Evaluation of Gated Recurrent Neural Networks on Sequence Modeling. arXiv:1412.3555 [cs] (12 2014). 4 [CHJO16] C A RT E R S . , H A D . , J O H N S O N I . , O L A H C .: Experiments in Handwriting with a Neural Network. Distill (2016). doi:10.23915/ distill.00004 . 3 , 6 [CPMC] C A S H M A N D . , P A T T E R S O N G . , M O S C A A . , C H A N G R . : RNNbow: V isualizing Learning via Backpropagation Gradients in Re- current Neural Networks. 9. 4 , 5 [DDCW19] D E B A R D Q . , D I B A N G OY E J . , C A N U S . , W O L F C . : Learn- ing 3d navigation protocols on touch interfaces with cooperative multi- agent reinforcement learning. In T o appear in European Confer ence on Machine Learning and Principles and Practice of Knowledg e Discovery in Databases (ECML-PKDD) (2019). 2 [DDG ∗ 18] D A S A . , D AT TA S . , G K I O X A R I G . , L E E S . , P A R I K H D . , B A - T R A D .: Embodied Question Answering. In CVPR (2018). 2 [Dij59] D I J K S T R A E .: A note on two problems in connexion with graphs. Numerische mathematik 1 (1959), 269â ˘ A ¸ S271. 2 [DWPQ ∗ 08] D A V I D W A N G T. , P L A I S A N T C . , Q U I N N A . J . , S T A N - C H A K R. , S H N E I D E R M A N B . , M U R P H Y S . : Aligning T emporal Data by Sentinel Events: Discovering P atterns in Electronic Health Records . 2008. 9 [FFM ∗ 13] F U C H S J . , F I S C H E R F. , M A N S M A N N F., B E RT I N I E . , I S E N - B E R G P . : Evaluation of alternative glyph designs for time series data in a small multiple setting. In Proceedings of the SIGCHI confer ence on human factors in computing systems (2013), pp. 3237–3246. 9 [GA W ∗ 11] G L E I C H E R M . , A L B E R S D . , W A L K E R R . , J U S U FI I . , H A N S E N C . D . , R O B E RT S J . C . : V isual comparison for information visualization. Information V isualization 10 , 4 (2011), 289–309. URL: http://ivi.sagepub.com/content/10/4/289.short . 10 [GKDF17] G R E Y DA N U S S . , K O U L A . , D O D G E J . , F E R N A . : V isual- izing and understanding atari agents. arXiv preprint (2017). 6 [GKR ∗ 18] G O R D O N D . , K E M B H A V I A . , R A S T E G A R I M . , R E D M O N J . , F O X D . , F A R H A D I A .: Iqa: V isual question answering in interactive en vironments. In CVPR (2018), IEEE. 2 [GSK ∗ 17] G R E FF K . , S R I V A S TA V A R . K . , K O U T N Í K J . , S T E U N E B R I N K B . R . , S C H M I D H U B E R J .: LSTM: A Search Space Odyssey. IEEE T ransactions on Neural Networks and Learning Systems 28 , 10 (10 2017), 2222–2232. doi:10.1109/TNNLS.2016.2582924 . 4 [HKPC19] H O H M A N F. M . , K A H N G M . , P I E N TA R . , C H AU D . H . : V i- sual Analytics in Deep Learning: An Interrogative Survey for the Next Frontiers. IEEE T ransactions on V isualization and Computer Graphics (2019). doi:10.1109/TVCG.2018.2843369 . 2 , 3 , 5 , 7 [HNR68] H A RT P . , N I L S S O N N . , R A P H A E L B . : A formal basis for the heuristic determination of minimum cost paths. IEEE transactions on Systems Science and Cybernetics 4 (1968), 100–107. 2 [HS15] H AU S K N E C H T M . , S T O N E P .: Deep recurrent q-learning for par - tially observable mdps. In 2015 AAAI F all Symposium Series (2015). 3 [JBTR19] J U S T E S E N N . , B O N T R AG E R P . , T O G E L I U S J . , R I S I S .: Deep learning for video game playing. IEEE Tr ansactions on Games (2019). 3 c 2020 The Author(s) Computer Graphics Forum c 2020 The Eurographics Association and John Wile y & Sons Ltd. T . J aunet, R. V uillemot and C. W olf / Understanding Decisions and Memory in Deep Reinforcement Learning [JVW19] J AU N E T T., V U I L L E M O T R . , W O L F C .: What if we re- duce the memory of an artificial doom player? URL: https:// theo- jaunet.github.io/MemoryReduction/ . 10 [KAF ∗ 08] K E I M D . , A N D R I E N K O G . , F E K E T E J . - D . , G Ö R G C . , K O H L H A M M E R J . , M E L A N Ç O N G . : V isual Analytics: Defi- nition, Process, and Challenges. In Information V isualization . Springer Berlin Heidelberg, 2008, pp. 154–175. doi:10.1007/ 978- 3- 540- 70956- 5{\_}7 . 5 [KAL ∗ 18] K E R P E D J I E V P . , A B D E N N U R N . , L E K S C H A S F. , M C C A L - L U M C . , D I N K L A K . , S T R O B E LT H . , L U B E R J . M . , O U E L L E T T E S . B . , A Z H I R A . , K U M A R N . , H WAN G J . , L E E S . , A LV E R B . H . , P FI S T E R H . , M I R N Y L . A . , P A R K P . J . , G E H L E N B O R G N .: Higlass: web-based visual e xploration and analysis of genome interaction maps. Genome Bi- ology 19 , 1 (Aug 2018), 125. URL: https://doi.org/10.1186/ s13059- 018- 1486- 1 , doi:10.1186/s13059- 018- 1486- 1 . 10 [KCK ∗ 18] K W O N B . C . , C H O I M . - J . , K I M J . T. , C H O I E . , K I M Y . B . , K W O N S . , S U N J . , C H O O J . : Retain vis: V isual analytics with inter - pretable and interactiv e recurrent neural networks on electronic medical records. IEEE transactions on visualization and computer graphics 25 , 1 (2018), 299–309. 3 [Kei00] K E I M D . A . : Designing Pixel-Oriented V isualization T ech- niques: Theory and Applications. IEEE Tr ansactions on V isualization and Computer Graphics 6 , 1 (Jan. 2000), 59–78. URL: http:// dx.doi.org/10.1109/2945.841121 , doi:10.1109/2945. 841121 . 10 [KJFF15] K A R P AT H Y A . , J O H N S O N J . , F E I - F E I L . : V isualizing and understanding recurrent networks. arXiv pr eprint (2015). 3 , 5 [KWR ∗ 16] K E M P K A M . , W Y D M U C H M . , R U N C G . , T O C Z E K J . , J A ´ S K OW S K I W.: V iZDoom: A Doom-based AI Research Platform for V isual Reinforcement Learning. In IEEE Conference on Computational Intelligence and Games (9 2016), IEEE, pp. 341–348. 3 [LB04] L I G H T A . , B A RT L E I N P. J .: The end of the rainbow? Color schemes for improved data graphics. Eos, T ransactions American Geo- physical Union 85 , 40 (2004), 385–391. 6 [LC17] L A M P L E G . , C H A P L O T D . S . : Playing FPS games with deep reinforcement learning. In Thirty-F irst AAAI Conference on Artificial Intelligence (2017). 10 [LCM ∗ 18] L E H M A N J . , C L U N E J . , M I S E V I C D . , A D A M I C . , A L - T E N B E R G L . , B E AU L I E U J . , B E N T L E Y P . J. , B E R NA R D S . , B E S L O N G . , B RY S O N D . M . , E T A L . : The surprising creativity of digital ev olu- tion: A collection of anecdotes from the ev olutionary computation and artificial life research communities. arXiv pr eprint (2018). 2 [LFD A16] L E V I N E S . , F I N N C . , D A R R E L L T., A B B E E L P . : End-to-end training of deep visuomotor policies. The Journal of Machine Learning Resear ch 17 , 1 (2016), 1334–1373. 3 [LGS ∗ 14] L E X A . , G E H L E N B O R G N . , S T RO B E L T H . , V U I L L E M OT R . , P FI S T E R H . : Upset: visualization of intersecting sets. IEEE transactions on visualization and computer graphics 20 , 12 (2014), 1983–1992. 10 [Lip16] L I P TO N Z . C . : The mythos of model interpretability . arXiv pr eprint arXiv:1606.03490 (2016). 2 [MCZ ∗ 17] M I N G Y . , C AO S . , Z H A N G R . , L I Z . , C H E N Y . , S O N G Y . , Q U H . : Understanding Hidden Memories of Recurrent Neural Networks. arXiv:1710.10777 [cs] (10 2017). 3 [MKS ∗ 13] M N I H V . , K A V U K C U O G L U K. , S I L V E R D . , G R A V E S A. , A N T O N O G L O U I . , W I E R S T R A D . , R I E D M I L L E R M .: Playing Atari with Deep Reinforcement Learning. arXiv:1312.5602 [cs] (12 2013). 3 [MKS ∗ 15] M N I H V . , K A V U K C U O G L U K . , S I LVE R D . , R U S U A . A . , V E N E S S J . , B E L L E M A R E M . G . , G R A V E S A . , R I E D M I L L E R M . , F I D - J E L A N D A . K . , O S T ROV S K I G . , P E T E R S E N S . , B E ATT I E C . , S A D I K A . , A N T O N O G L O U I . , K I N G H . , K U M A R A N D . , W I E R S T R A D . , L E G G S . , H A S S A B I S D . : Human-lev el control through deep reinforcement learning. Natur e 518 , 7540 (2015). 2 , 3 , 4 [MPBM ∗ 16] M N I H V . , P U I G D O M È N E C H B A D I A A . , M I R Z A M . , G R A V E S A . , H A R L E Y T. , L I L L I C R A P T. P . , S I L V E R D . , K A V U K C U O G L U K .: Asynchr onous Methods for Deep Reinforcement Learning . T ech. rep., 2016. 3 , 4 , 7 [MPV ∗ 16] M I R OW S K I P . , P A S C A N U R . , V I O L A F. , S OY E R H . , B A L - L A R D A . J . , B A N I N O A . , D E N I L M . , G O R O S H I N R . , S I F R E L . , K A V U K C U O G L U K . , OT H E R S : Learning to navigate in complex envi- ronments. arXiv pr eprint arXiv:1611.03673 (2016). 3 , 4 [OCSL16] O H J . , C H O C K A L I N G A M V . , S I N G H S . , L E E H . : Control of Memory , Activ e Perception, and Action in Minecraft. 3 [OSJ ∗ 18] O L A H C . , S A T Y A N A R A YAN A . , J O H N S O N I . , C A RT E R S. , S C H U B E RT L . , Y E K . , M O R DV I N T S E V A . : The building blocks of interpretability . Distill (2018). https://distill.pub/2018/building-blocks. doi:10.23915/distill.00010 . 2 [PGC ∗ 17] P A S Z K E A . , G R O S S S . , C H I N TAL A S . , C H A N A N G . , Y A N G E . , D E V I T O Z . , L I N Z . , D E S M A I S O N A . , A N T I G A L . , L E R E R A . : Au- tomatic differentiation in PyT orch. 7 [PS18] P A R I S O T T O E . , S A L A K H U T D I N OV R .: Neural map: Structured memory for deep reinforcement learning. ICLR (2018). 2 [RSG16] R I B E I R O M . T. , S I N G H S . , G U E S T R I N C . : Why should i trust you?: Explaining the predictions of any classifier . In Pr oceedings of the 22nd A CM SIGKDD international conference on knowledge discovery and data mining (2016), A CM, pp. 1135–1144. 2 [SB18] S U T TO N R . S . , B A RT O A . G . : Reinforcement learning: An in- tr oduction . 2018. 2 [SCD ∗ 17] S E LV A R A J U R . R . , C O G S W E L L M . , D A S A . , V E D A N TAM R . , P A R I K H D . , B A T R A D .: Grad-cam: Visual explanations from deep net- works via gradient-based localization. In Pr oceedings of the IEEE inter - national confer ence on computer vision (2017), pp. 618–626. 5 [SDBR14] S P R I N G E N B E R G J . T., D O S OV I T S K I Y A . , B RO X T . , R I E D - M I L L E R M . : Striving for Simplicity: The All Con volutional Net. 6 [SGPR17] S T R O B E LT H . , G E H R M A N N S . , P FI S T E R H . , R U S H A . M .: Lstmvis: A tool for visual analysis of hidden state dynamics in recur- rent neural networks. IEEE transactions on visualization and computer graphics 24 , 1 (2017), 667–676. 2 , 3 , 9 [SKM ∗ 19] S A V V A M . , K A D I A N A . , M A K S Y M E T S O . , Z H AO Y . , W I J - M A N S E . , J A I N B . , S T R AU B J . , L I U J . , K O LT U N V . , M A L I K J . , P A R I K H D . , B A T R A D .: Habitat: A Platform for Embodied AI Research. 10 [SSS ∗ 17] S I LV E R D . , S C H R I T T W I E S E R J . , S I M O N YAN K . , A N T O N O G L O U I . , H UA N G A . , G U E Z A . , H U B E RT T. , B A K E R L . , L A I M . , B O LT O N A . , C H E N Y . , L I L L I C R A P T. , H U I F. , S I F R E L . , V A N D E N D R I E S S C H E G . , G R A E P E L T. , H A S S A B I S D .: Mastering the game of Go without human knowledge. Nature 550 , 7676 (10 2017), 354–359. doi:10.1038/nature24270 . 2 , 3 [STST18] S A L O M Ó N S . , T Î R N ˘ A U C ˘ A C . , S A L O M Ó N S . , T Î R N ˘ A U C ˘ A C . : Human Activity Recognition through W eighted Finite Au- tomata. Pr oceedings 2 , 19 (10 2018), 1263. doi:10.3390/ proceedings2191263 . 10 [TGF09] T A N G A . , G R E E N B E R G S . , F E L S S . : Exploring video streams using slit-tear visualizations. In CHI’09 Extended Abstracts on Human F actors in Computing Systems (2009), A CM, pp. 3509–3510. 10 [TH12] T I E L E M A N T., H I N T O N G . : Lecture 6.5-rmsprop: Divide the gradient by a running average of its recent magnitude. COURSERA: Neural networks for machine learning 4 , 2 (2012), 26–31. 4 [VDMH08] V A N D E R M A A T E N L . , H I N T O N G .: Visualizing Data using t-SNE. Journal of Machine Learning Resear ch 9 (2008), 2579–2605. 4 , 6 [WGGP ∗ 11] W O N G S U P H A S AW A T K . , G U E R R A G Ó M E Z J . A . , P L A I S A N T C . , W AN G T. D . , S H N E I D E R M A N B . , T AI E B - M A I M O N M . : LifeFlow: V isualizing an Overview of Event Sequences . 2011. 9 [WGSY18] W AN G J . , G O U L . , S H E N H . - W., Y A N G H . : Dqnviz: A vi- sual analytics approach to understand deep q-networks. IEEE transac- tions on visualization and computer graphics 25 , 1 (2018), 288–298. 4 , 10 c 2020 The Author(s) Computer Graphics Forum c 2020 The Eurographics Association and John Wile y & Sons Ltd. T . J aunet, R. V uillemot and C. W olf / Understanding Decisions and Memory in Deep Reinforcement Learning [Y am97] Y A M AU C H I B .: A frontier-based approach for autonomous ex- ploration. In Symposium on Computational Intelligence in Robotics and Automation (1997). 2 [ZBZM16] Z A H A V Y T., B E N - Z R I H E M N . , M A N N O R S .: Graying the black box: Understanding dqns. In International Confer ence on Machine Learning (2016), pp. 1899–1908. 4 [ZKL ∗ 16] Z H O U B . , K H O S L A A . , L A P E D R I Z A A . , O L I V A A . , T O R - R A L BA A . : Learning deep features for discriminative localization. In Pr oceedings of the IEEE conference on computer vision and pattern r ecognition (2016), pp. 2921–2929. 5 [ZMK ∗ 17] Z H U Y . , M OT TAG H I R. , K O LV E E . , L I M J. J . , G U P T A A . , F E I - F E I L . , F A R H A D I A . : T ar get-driven visual navigation in indoor scenes using deep reinforcement learning. In 2017 IEEE international confer ence on r obotics and automation (ICRA) (2017), pp. 3357–3364. 3 c 2020 The Author(s) Computer Graphics Forum c 2020 The Eurographics Association and John Wile y & Sons Ltd.
Original Paper
Loading high-quality paper...
Comments & Academic Discussion
Loading comments...
Leave a Comment