Unsupervised Domain Adaptation via Structured Prediction Based Selective Pseudo-Labeling
Unsupervised domain adaptation aims to address the problem of classifying unlabeled samples from the target domain whilst labeled samples are only available from the source domain and the data distributions are different in these two domains. As a re…
Authors: Qian Wang, Toby P. Breckon
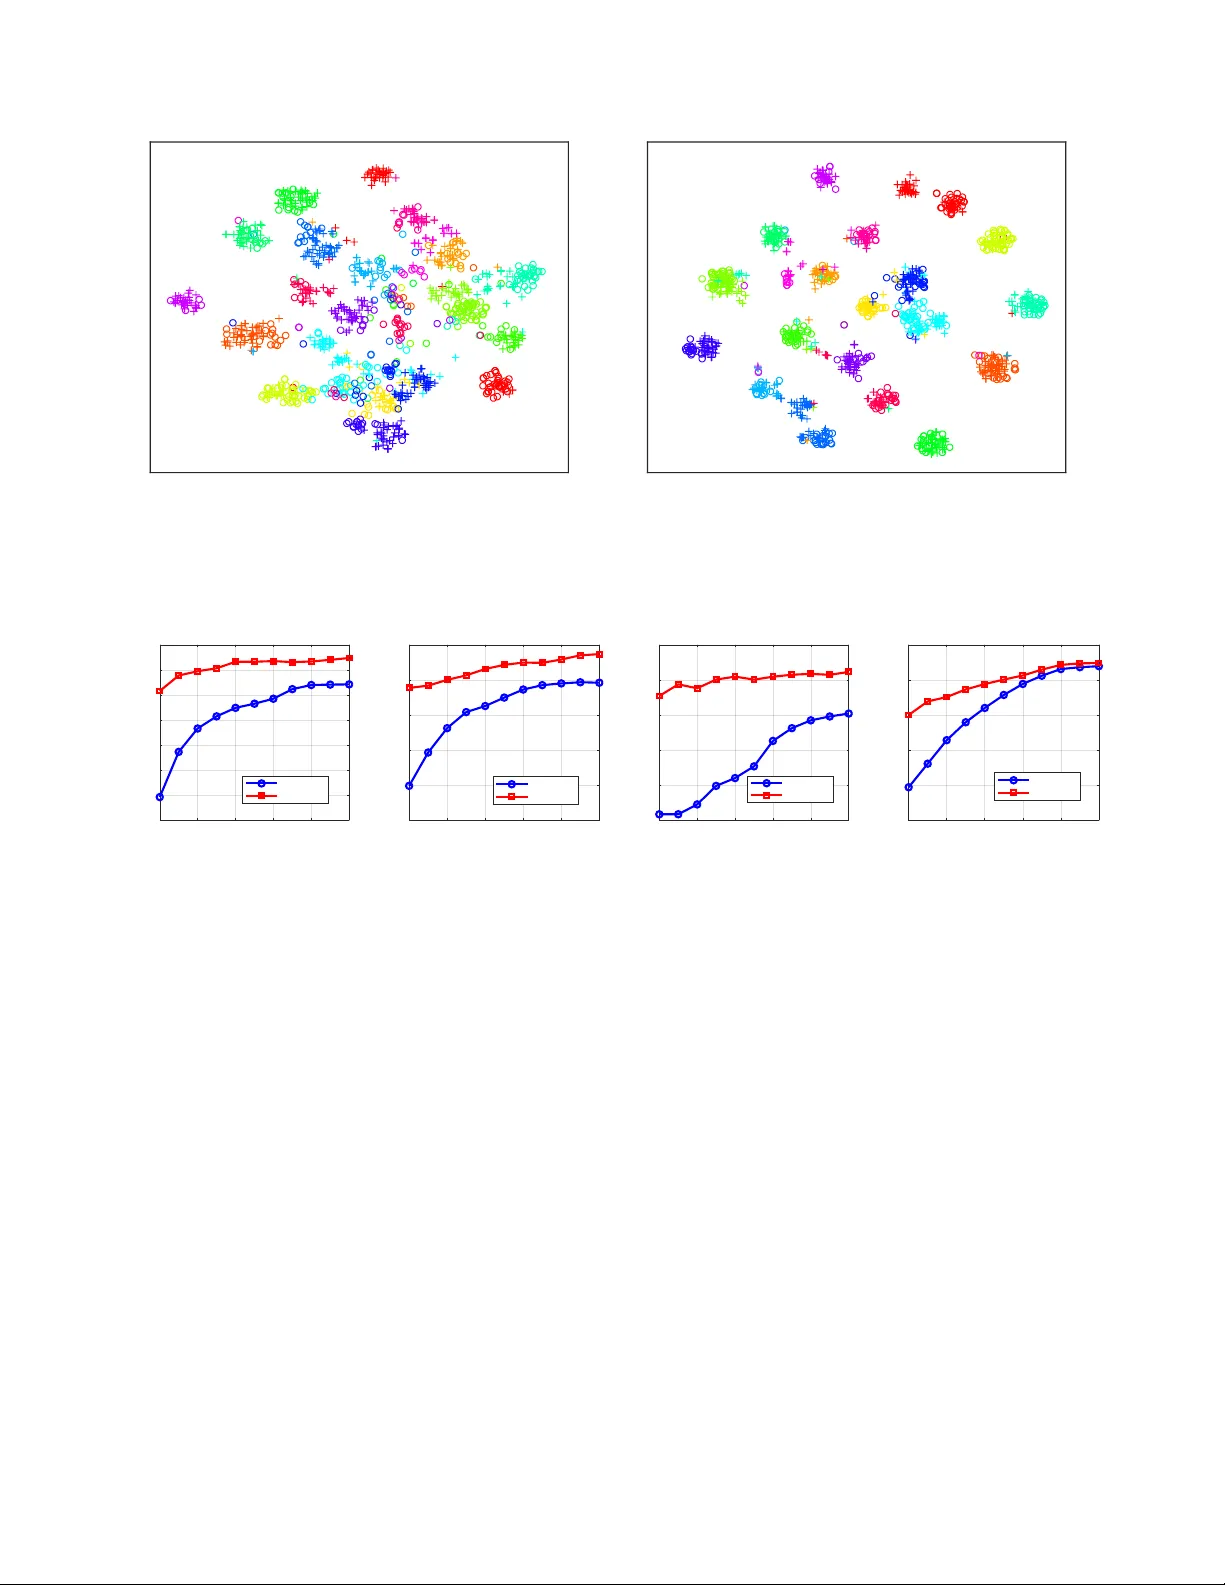
Unsupervised Domain Adaptation via Structur ed Pr ediction Based Selective Pseudo-Labeling Qian W ang, 1 T oby P . Br eckon 1,2 1 Department of Computer Science, Durham Univ ersity , United Kingdom 2 Department of Engineering, Durham Univ ersity , United Kingdom qian.wang173@hotmail.com, toby .breckon@durham.ac.uk Abstract Unsupervised domain adaptation aims to address the prob- lem of classifying unlabeled samples from the target domain whilst labeled samples are only a vailable from the source do- main and the data distributions are different in these two do- mains. As a result, classifiers trained from labeled samples in the source domain suffer from significant performance drop when directly applied to the samples from the target domain. T o address this issue, different approaches ha ve been pro- posed to learn domain-in v ariant features or domain-specific classifiers. In either case, the lack of labeled samples in the target domain can be an issue which is usually overcome by pseudo-labeling. Inaccurate pseudo-labeling, howe ver , could result in catastrophic error accumulation during learning. In this paper , we propose a no vel selectiv e pseudo-labeling strat- egy based on structured prediction. The idea of structured prediction is inspired by the fact that samples in the target domain are well clustered within the deep feature space so that unsupervised clustering analysis can be used to facili- tate accurate pseudo-labeling. Experimental results on four datasets (i.e. Of fice-Caltech, Office31, ImageCLEF-DA and Office-Home) validate our approach outperforms contempo- rary state-of-the-art methods. Introduction Domain adaptation problems exist in many real-world appli- cations. Unsupervised Domain Adaptation (UD A) aims to address problems where the unlabeled test samples and the labeled training samples are from different domains (dubbed target and source domains, respectively). Models learned with labeled samples from the source domain suffer from significant performance reduction when the y are directly ap- plied to the target samples without domain adaptation. Such reduced perform ance is mainly due to the domain shift char- acterized by the difference of data distributions between the two domains. T o address this issue, approaches to UD A have been proposed trying to align the source and target domains by learning a joint subspace so that samples from either domain can be projected into this common subspace. Dif- ferent algorithms were employed to promote the separabil- ity of target samples in such subspaces. The use of visual Copyright © 2020, Association for the Advancement of Artificial Intelligence (www .aaai.org). All rights reserved. features extracted by deep models pre-trained on the large- scale ImageNet dataset (Deng et al. 2009) further facilitates these feature transformation based approaches. On the other hand, deep learning models are used to learn domain in vari- ant features in an end-to-end manner . The gradient re versal layer (Ganin and Lempitsky 2015) and adv ersarial learning (Tzeng et al. 2017) hav e been employed for this purpose. In the UD A problem, both labeled samples from the source domain and unlabeled samples from the target do- main are assumed to be av ailable during model training and hence it is a transductiv e learning problem. The opportunity of transductive learning is when the algorithm can explore the test data (samples from the target domain in the case of UDA). One ef fectiv e method is to assign pseudo-labels to the target samples so that samples from both domains can be combined and ready for supervised learning. The accuracy of pseudo-labeling plays an important role in the whole learning process. In most e xisting methods, the target samples are pseudo-labeled independently once the classi- fier is trained overlooking the structural information under- lying the target domain. In this paper , we explore such structural information via unsupervised learning (i.e. K -means) and propose a nov el UDA approach based on selecti ve pseudo-labeling and structured prediction. Specifically , our approach tries to learn a domain inv ariant subspace by Supervised Locality Preserving Projection (SLPP) using both labeled source data and pseudo-labeled target data. The accuracy of pseudo- labeling is promoted by structured prediction and progres- siv ely selections. The contributions of this work can be sum- marized as follows: – a novel iterative learning algorithm is proposed for UD A using SLPP based subspace learning and the selecti ve pseudo-labeling strategy . – structured prediction is employed to e xplore the structural information within the target domain to promote the accu- racy of pseudo-labeling and domain alignment. – thorough comparati ve experiments and ablation studies are conducted to demonstrate the proposed approach can achiev e new state-of-the-art performance on four bench- mark datasets. Related W ork Early works on UD A problems aim to align the marginal distributions of source and target domains (Gong et al. 2012; Ganin and Lempitsky 2015; Sun, Feng, and Saenko 2016). W ith aligned marginal distrib utions, it is not guaranteed to produce good classification results as the conditional dis- tribution of the target domain can be misaligned with that of the source domain. This is mainly due to the lack of la- beled target samples. T o ov ercome this issue, many UDA ap- proaches ha ve employed pseudo-labeling strategies during learning (Long et al. 2013; Zhang, Li, and Ogunbona 2017; W ang et al. 2018; Pei et al. 2018; Zhang et al. 2018; W ang, Bu, and Breckon 2019; Chen et al. 2019b). Pseudo labeling the target samples allows to align the conditional distributions of source and target domains with traditional supervised learning algorithms. T o give a sketch of how ex- isting works handle the issue of lacking labeled samples in the target domain, in this section, we revie w related works on UD A by dividing them into three categories: appr oaches without pseudo-labeling , pseudo-labeling without selection and pseudo-labeling with selection . A pproaches without Pseudo-Labeling Approaches to UDA aiming to align the marginal distribu- tions of source and tar get domains can be realized via min- imising the Maximum Mean Discrepancy (MMD) (Long et al. 2014; Sun, Feng, and Saenko 2016). The same idea has also been employed in deep learning based approaches to learning domain inv ariant features (Long et al. 2015; Sun and Saenko 2016; Long et al. 2016; Chen et al. 2019a). Alternativ ely , the same goal can be achiev ed by the gra- dient reversal layer (Ganin and Lempitsky 2015; Ganin et al. 2016) or generati ve adversarial loss (Tzeng et al. 2017). Although these models can learn domain in v ariant features which are also discriminativ e for the source domain, the separability of tar get samples is not guaranteed since the conditional distributions are not explicitly aligned. More re- cently , domain-symmetric networks were proposed to pro- mote the alignment of joint distributions of feature and cat- egory across source and target domains (Zhang et al. 2019). In contrast to these approaches, pseudo-labeling target sam- ples is another ef fectiv e way to promote the alignment of conditional distributions. Pseudo-Labeling without Selection Pseudo-labeling without selection assigns pseudo-labels to all samples in the tar get domain. T wo strategies, i.e. hard la- beling (Long et al. 2013; Zhang, Li, and Ogunbona 2017; W ang et al. 2018) and soft labeling (Pei et al. 2018), hav e been employed in existing works. The strategy of hard label- ing assigns a pseudo-label ˆ y to each unlabeled sample with- out considering the confidence. It can be achie ved by a clas- sifier trained on labeled source samples (Long et al. 2013; Zhang, Li, and Ogunbona 2017; W ang et al. 2018). The pseudo-labeled target samples together with labeled source samples are used to learn an improv ed classification model. By iterati ve learning, the pseudo-labeling is e xpected to be progressiv ely more accurate until con ver gence. The prob- lem of such hard pseudo-labeling is that mis-labeled sam- ples by a weak classifier in the initial stage of the iterative learning can cause serious harm to the subsequent learn- ing process. T o address this issue, soft labeling was em- ployed in (Pei et al. 2018). The strategy of soft labeling as- signs the conditional probability of each class p ( c | x ) giv en a target sample x , which results in a pseudo-labeling v ector ˆ y = { p ( c 1 | x ) , p ( c 2 | x ) , ..., p ( c |C | | x ) } ∈ [0 , 1] |C | , where |C | is the number of classes. The soft label ˆ y can be updated during iterative learning and the final classification results can be deri ved by selecting the class with the highest prob- ability . Soft labeling is naturally suitable for neural network based approaches whose outputs are usually a vector of con- ditional probabilities. For instance, in the Multi-Adversarial Domain Adaptation (MAD A) approach (Pei et al. 2018), the soft pseudo-label of a target sample is used to determine how much this sample should be attended to dif ferent class- specific domain discriminators. Pseudo-Labeling with Selection Selectiv e pseudo-labeling is the other way to alle viate the mis-labeling issue (Zhang et al. 2018; W ang, Bu, and Breckon 2019; Chen et al. 2019b). Similar to the soft label- ing strategy , selective pseudo-labeling also takes into con- sideration the confidence in target sample labeling but in a different manner . Specifically , a subset of tar get samples are selected to be assigned with pseudo labels and only these pseudo-labeled target samples are combined with source samples in the next iteration of learning. The idea is that at the be ginning the classifier is weak so that only a small frac- tion of the tar get samples can be correctly classified. When the classifier gets stronger after each iteration of learning, more tar get samples can be correctly classified hence should be pseudo-labeled and participate in the learning process. One key factor in such algorithms is the criterion of sam- ple selection for pseudo-labeling. An easy-to-hard strategy was emplo yed in (Chen et al. 2019b). T arget samples whose similarity scores are higher than a threshold are selected for pseudo-labeling and this threshold is updated after each iter- ation of learning so that more unlabeled target samples can be selected. One limitation of this sample selection strategy is the risk of biasing to “easy” classes and the selected sam- ples in the first iterations can be dominated by these “easy” classes. As a result, the learned model will be seriously bi- ased to the “easy” classes. T o address this issue, a class-wise sample selection strategy was proposed in (W ang, Bu, and Breckon 2019). Samples are selected for each class indepen- dently so that pseudo-labeled target samples will contribute to the alignment of conditional distribution for each class during learning. In this paper, we propose a novel approach to selecti ve pseudo-labeling by exploring the structural in- formation within the unlabeled target samples. Proposed Method The proposed method aims to align the conditional distri- butions of source and target domains. W e employ Super- vised Locality Preserving Projection (SLPP) (He and Niyogi 2004) as an enabling technique to learn a projection matrix … k = 0 k = 1 k= T (a ) (b) (c) l ab el ed s o u rce s am p l e s o u rce cl as s pro t o t y p e p s eu d o - l ab el ed t ar g et s am p l e u n l ab el ed t ar g et s am p l e t ar g et cl u s t er m ean o ne - to - o n e m at c h P 0 P k Figure 1: The framework of our proposed approach. (a) iter- ativ e learning process (b) pseudo-labeling via nearest class prototype (c) pseudo-labeling via structured prediction. The red and the blue colors are used for the tar get and source domains respectiv ely . P which maps samples from both domains into the same latent subspace. The learned subspace is expected to hav e fa vourable properties that projections of samples from the same class will be close to each other regardless of which domain they are from. In the subspace, a classifier such as nearest neighbour is used to classify unlabeled target sam- ples. By combining both pseudo-labeled target samples and labeled source samples, the projection matrix P can be up- dated. As a result, an iterati ve learning process is employed to improv e the projection learning and pseudo-labeling al- ternately as illustrated in Figure 1 (a). Follo wing (W ang, Bu, and Breckon 2019), we use the nearest class prototype (NCP) for pseudo-labeling. Source class prototypes are computed by averaging projections of source samples from the same class in the same space. T arget samples can be pseudo-labeled by measuring the distances to these class prototypes (see Figure 1(b)). This method ov erlooks the intrinsic structural information in the target domain, resulting in sub-optimal pseudo-labeling results. Therefore, we explore the structural information underlying the target domain via clustering analysis (e.g., K -means). The clusters of target samples are matched with source classes via structured prediction (Zhang and Saligrama 2016; W ang and Chen 2017) so that target samples can be la- beled collectiv ely according to which cluster they belong to (see Figure 1 (c)). W e calculate the distances of tar get sam- ples to cluster centers as the criterion for selectiv e pseudo- labeling. The samples close to the cluster center are more likely to be selected for pseudo-labeling and participate in the projection learning in the next iteration of learning. In contrast to the existing sample selection strategies (Chen et al. 2019b; W ang, Bu, and Breckon 2019), the structured pre- diction based method tends to select samples far away from the source samples which enables a faster domain alignment. Moreov er , since these tw o methods are intrinsically different from each other , a combination of two is expected to further benefit the learning process. In the follo wing subsections, we giv e the formulation of the problem, describe each component of the proposed method in detail and analyse the comple xity of the algo- rithm. Problem F ormulation Giv en a labeled dataset D s = { ( x s i , y s i ) } , i = 1 , 2 , ..., n s from the source domain S , x s i ∈ R d represents the fea- ture vector of i -th labeled sample in the source domain, d is the feature dimension and y s i ∈ Y s denotes the corre- sponding label. UDA aims to classify an unlabeled data set D t = { x t i } , i = 1 , 2 , ..., n t from the tar get domain T , where x t i ∈ R d represents the feature vector in the tar get domain. The tar get label space Y t is equal to the source label space Y s . It is assumed that both the labeled source domain data D s and the unlabeled target domain data D t are av ailable for model learning. Dimensionality Reduction High dimensional features contain redundant information and thus result in unnecessary computation. W e apply di- mensionality reduction to the high dimensional deep fea- tures as the preprocessing. Principle Component Analysis (PCA) is selected in our work since it has been successfully used in other existing UDA approaches (Long et al. 2013; Long et al. 2014). Feature vectors of samples from source and target domains are concatenated as a matrix X = [ x s 1 , ..., x s n s , x t 1 , ..., x t n t ] ∈ R d × n , where n = n s + n t . The centering matrix is denoted as H = I − 1 n 1 , where 1 is an n × n matrix of ones. The objecti ve of PCA is: max V T V = I tr ( V T XHX T V ) (1) where tr( · ) denotes the trace of a matrix. The problem defined in Eq.(1) is equi v alent to the follow- ing eigen value problem: XHX T v = φ v . (2) By solving the eigen v alue problem, we can have the PCA projection matrix V = [ v 1 , ..., v d 1 ] ∈ R d × d 1 and the lower - dimensional features: ˜ X = V T X (3) where ˜ X ∈ R d 1 × n and d 1 ≤ d is the dimensionality of the feature space after applying PCA. Since PCA is a linear feature transformation, L 2 nor- malization is applied to each feature vector in ˜ X as ˜ x ← ˜ x / || ˜ x || 2 . The use of L 2 normalization forces samples of both source and target domains distrib uted on the surface of the same h yper-sphere which helps to align data from dif fer - ent domains (W ang and Chen 2017). Our experimental re- sults in this study also provide empirical evidence that such sample normalization is beneficial to superior performance. Domain Alignment The lower-dimensional feature space ˜ X learned by PCA and sample normalisation exhibit fav ourable properties of do- main alignment. Ho wev er , it is learned in an unsupervised manner and is thus not suf ficiently discriminativ e. T o pro- mote the class-wise alignment of two domains, we use the supervised locality preserving projection (He and Niyogi 2004) as an enabling technique to learn a domain in variant yet discriminativ e subspace Z from ˜ X . The objective of SLPP is to learn a projection matrix P by minimizing the following cost function : min P X i,j || P T ˜ x i − P T ˜ x j || 2 2 M ij , (4) where P ∈ R d 1 × d 2 and d 2 ≤ d 1 is the dimensionality of the learned space; ˜ x i is the i -th column of the labeled data matrix ˜ X l ∈ R d 1 × ( n s + n 0 t ) and ˜ X l is a collection of n s la- beled source data and n 0 t selected pseudo-labeled target data. The similarity matrix M ∈ R ( n s + n 0 t ) × ( n s + n 0 t ) is defined as follows: M ij = 1 , y i = y j , 0 , other wise. (5) The idea is that samples from the same class should be projected close to each other in the subspace regardless of which domain they are originally from. Eq (5) is a simpli- fied version of MMD matrices used in (Long et al. 2013; Zhang, Li, and Ogunbona 2017; W ang et al. 2018) where the domain differentiation is reserved while we try to promote the domain in variance. Our definition of similarity matrix in Eq (5) also dif fers from that in the original LPP formulation where local structure of the samples is considered by defin- ing the similarity value M ij based on the distance between ˜ x i and ˜ x j . Follo wing the treatment in (He and Niyogi 2004; W ang and Chen 2017), the objectiv e can be rewritten as: max P tr ( P T ˜ X l D ˜ X lT P ) tr ( P T ( ˜ X l L ˜ X lT + I ) P ) (6) where L = D − M is the laplacian matrix, D is a diago- nal matrix with D ii = P j M ij and the re gularization term tr ( P T P ) is added for penalizing extreme values in the pro- jection matrix P . The problem defined in Eq.(6) is equi v alent to the follow- ing generalized eigen value problem: ˜ X l D ˜ X lT p = λ ( ˜ X l L ˜ X lT + I ) p , (7) solving the generalized eigenv alue problem gi ves the op- timal solution P = [ p 1 , ..., p d 2 ] where p 1 , ..., p d 2 are the eigen vectors corresponding to the lar gest d 2 eigen values. Learning the projection matrix P for domain alignment requires labeled samples from both source and tar get do- mains. T o get pseudo-labels of target samples for projection learning, we describe pseudo-labeling methods via nearest class prototype and structured prediction respecti vely in the following sub-sections. Pseudo-Labeling via Nearest Class Pr ototype (NCP) Unlabeled target samples can be labeled in the learned sub- space Z where the projections of source and target samples are computed by: z s = P T ˜ x s , z t = P T ˜ x t . (8) W e sequentially apply centralisation (i.e. mean subtraction, z ← z − ¯ z , where ¯ z is the mean of all source and target sample projections) and L 2 normalisation to z to promote the separability of different classes in the space Z . The class prototype for class y ∈ Y is defined as the mean vector of the projected source samples whose labels are y , which can be computed by: ¯ z s y = P n s i =1 z s i δ ( y , y s i ) P n s i =1 δ ( y , y s i ) , (9) where δ ( y , y i ) = 1 if y = y i and 0 otherwise. After applying L 2 normalization to the class prototypes ¯ z s y , y = 1 , ..., |Y | , where |Y | denotes the number of classes, we can deri ve the conditional probability of a given target sample x t belong- ing to class y : p 1 ( y | x t ) = exp ( −|| z t − ¯ z s y || ) P |Y | y =1 exp ( −|| z t − ¯ z s y || ) . (10) Pseudo-Labeling via Structured Pr ediction (SP) Pseudo-labeling via nearest class prototype does not con- sider the intrinsic structure of the target samples which pro- vides useful information for tar get samples classification. T o explore such structure information, we employ struc- tured prediction for pseudo-labeling. Specifically , we use K -means to generate |Y | clusters ov er projection vectors z t of all target samples. The cluster centers are initialised with class prototypes calculated by Eq. (9). Subsequently , we es- tablish a one-to-one match between a cluster from the target domain and a class from the source domain so that the sum of distances of all the matched pairs of the cluster center and the class prototype is minimised. Let A ∈ { 0 , 1 } |Y |×|Y | denote the one-to-one matching matrix where A ij = 1 in- dicates that the i -th target cluster is matched with the j -th source class. The optimisation problem can be formulated as follows: min A P |Y | i =1 P |Y | j =1 A ij d ( ¯ z t i , ¯ z s j ) s.t. ∀ i, P j A ij = 1; ∀ j, P i A ij = 1 , (11) where ¯ z t i denotes the i -th cluster center in the tar get do- main. This problem can be efficiently solved by linear programming according to (Zhang and Saligrama 2016; W ang and Chen 2017). Let ¯ z t y denote the cluster center corresponding to the class y , similar to Eq. (10), we can calculate the conditional prob- ability of a giv en target sample x t belonging to class y : p 2 ( y | x t ) = exp ( −|| z t − ¯ z t y || ) P |Y | y =1 exp ( −|| z t − ¯ z t y || ) . (12) Iterative Lear ning with Selective Pseudo-Labeling (SPL) W e use an iterativ e learning strategy to learn the projec- tion matrix P for domain alignment and improved pseudo- labeling for tar get samples alternately . Although either of Algorithm 1 Unsupervised Domain Adaptation Using Se- lectiv e Pseudo-Labeling Input: Labeled source data set D s = { ( x s i , y s i ) } , i = 1 , 2 , ..., n s and unlabeled target data set D t = { x t i } , i = 1 , 2 , ..., n t , dimensionality of PCA and SLPP subspace d 1 and d 2 , number of iteration T . Output: The projection matrix P and predicted labels { ˆ y t } for target samples. 1: Initialize k = 0 ; 2: Dimensionality reduction by Eq. (3); 3: Learn the projection P 0 using only source data D s ; 4: Assign pseudo labels for all target data using Eq. (14); 5: while k < T do 6: k ← k + 1 ; 7: Select a subset of pseudo-labeled target data S k ∈ ˆ D t ; 8: Learn P k using D s and S k ; 9: Update pseudo labels for all tar get data using Eq.(14). 10: end while the two pseudo-labeling methods described above is able to provide useful pseudo-labeled target samples for projection learning in the next iteration, they are intrinsically dif fer- ent. Pseudo-labeling via nearest class prototype tends to out- put high probability to the samples close to the source data, whilst structured prediction is confident in samples close to the cluster center in the target domain regardless how far they are from the source domain. W e advocate to take ad- vantage of the complementarity of these two methods via a simple combination of Eq.(10) and Eq.(12) as follows: p ( y | x t ) = max { p 1 ( y | x t ) , p 2 ( y | x t ) } . (13) As a result, the pseudo-label of a gi ven target sample x t can be predicted by: ˆ y t = arg max y ∈Y p ( y | x t ) . (14) Now we have pseudo labels for all the target samples as well as the probability of these pseudo labels, denoted as a set of triplets ˆ D t = { ( x t i , ˆ y t i , p ( ˆ y t i | x t i )) } , i = 1 , ..., n t . Instead of using all the pseudo-labeled target samples for the projection learning, we progressively select a sub- set S k ⊆ ˆ D t containing k n t /T target samples in the k -th iteration, where T is the number of iterations of the learn- ing process. One straight forward strategy is to select top k n t /T samples with highest probabilities from ˆ D t . How- ev er , this strategy has a risk of only selecting samples from specific classes while ov erlooking the other classes. T o avoid this, we do the class-wise selection so that target samples pseudo-labeled as each class have the same opportunity to be selected. Specifically , for each class c ∈ Y , we first pick out n c t target samples pseudo-labeled as class c from which we select top k n c t /T high-probability samples to form S k . The ov erall algorithm is summarized in Algorithm 1. Computational Complexity W e analyse the computation complexity of our learning al- gorithm. The comple xity of PCA is O ( dn 2 + d 3 ) . The com- plexity of SLPP is O (2 d 1 n 2 + d 3 1 ) which is repeated for T times and leads to approximately O ( T (2 d 1 n 2 + d 3 1 )) . Since the iterativ e learning contributes the most to the computation cost, a small value of d 1 < d can make the learning process more efficient when n is not too big. Experiments and Results In this section, we describe our experiments on four com- monly used domain adaptation datasets (i.e. Office+Caltech (Gong et al. 2012), Office31 (Saenko et al. 2010), ImageCLEF-D A (Caputo et al. 2014) and Office-Home (V enkateswara et al. 2017)). Our approach is firstly com- pared with state-of-the-art UDA approaches to ev aluate its effecti veness. An ablation study is conducted to demonstrate the effects of dif ferent components and hyper-parameters in our approach. Finally , we inv estigate how different hyper- parameters affect the performance. Datasets Office+Caltech (Gong et al. 2012) consists of four do- mains: Amazon (A, images downloaded from online mer- chants), W ebcam (W , low-resolution images by a web cam- era), DSLR (D, high-resolution images by a digital SLR camera) and Caltech-256 (C). T en common classes from all four domains are used: backpack, bike, calculator, head- phone, computer-ke yboard, laptop-101, computer-monitor , computer-mouse, coffee-mug, and video-projector . There are 2533 images in total with 8 to 151 images per cate- gory per domain. Office31 (Saenko et al. 2010) consists of three domains: Amazon (A), W ebcam (W) and DSLR (D). There are 31 common classes for all three domains con- taining 4,110 images in total. ImageCLEF-DA (Caputo et al. 2014) consists o f four domains. W e follow the existing works (Zhang et al. 2019) using three of them in our exper- iments: Caltech-256 (C), ImageNet ILSVRC 2012 (I), and Pascal V OC 2012 (P). There are 12 classes and 50 images for each class in each domain. Office-Home (V enkateswara et al. 2017) is another dataset recently released for ev alu- ation of domain adaptation algorithms. It consists of four different domains: Artistic images (A), Clipart (C), Product images (P) and Real-W orld images (R). There are 65 object classes in each domain with a total number of 15,588 im- ages. Experimental Setting The algorithm is implemented in Matlab 1 . W e use the deep features commonly used in existing works for a fair com- parison with the state of the arts. As a result, the Decaf6 (Donahue et al. 2014) features (acti vations of the 6 th fully connected layer of a conv olutional neural network trained on ImageNet, d = 4096 ) are used for the Of fice-Caltech dataset. F or the other three datasets, ResNet50 (He et al. 2016) has been commonly used to extract features or as the backbone of deep models in the literature, hence we 1 Code is available: https://github.com/hello wangqian/domain- adaptation-capls T able 1: Classification Accuracy (%) on Office-Caltech dataset using Decaf6 features. Each column displays the results of a pair of source → tar get setting. Method C → A C → W C → D A → C A → W A → D W → C W → A W → D D → C D → A D → W A verage DDC(Tzeng et al. 2014) 91.9 85.4 88.8 85.0 86.1 89.0 78.0 84.9 100.0 81.1 89.5 98.2 88.2 D AN(Long et al. 2015) 92.0 90.6 89.3 84.1 91.8 91.7 81.2 92.1 100.0 80.3 90.0 98.5 90.1 DCORAL(Sun and Saenko 2016) 92.4 91.1 91.4 84.7 - - 79.3 - - 82.8 - - - CORAL(Sun, Feng, and Saenko 2017) 92.0 80.0 84.7 83.2 74.6 84.1 75.5 81.2 100.0 76.8 85.5 99.3 84.7 SCA(Ghifary et al. 2016) 89.5 85.4 87.9 78.8 75.9 85.4 74.8 86.1 100.0 78.1 90.0 98.6 85.9 JGSA(Zhang, Li, and Ogunbona 2017) 91.4 86.8 93.6 84.9 81.0 88.5 85.0 90.7 100.0 86.2 92.0 99.7 90.0 MED A(W ang et al. 2018) 93.4 95.6 91.1 87.4 88.1 88.1 93.2 99.4 99.4 87.5 93.2 97.6 92.8 CAPLS (W ang, Bu, and Breckon 2019) 90.8 85.4 95.5 86.1 87.1 94.9 88.2 92.3 100.0 88.8 93.0 100.0 91.8 SPL (Ours) 92.7 93.2 98.7 87.4 95.3 89.2 87.0 92.0 100.0 88.6 92.9 98.6 93.0 T able 2: Classification Accuracy (%) on Office31 dataset us- ing either ResNet50 features or ResNet50 based deep mod- els. Method A → W D → W W → D A → D D → A W → A A vg R TN(Long et al. 2016) 84.5 96.8 99.4 77.5 66.2 64.8 81.6 MAD A(Pei et al. 2018) 90.0 97.4 99.6 87.8 70.3 66.4 85.2 GT A (Sankaranarayanan et al. 2018) 89.5 97.9 99.8 87.7 72.8 71.4 86.5 iCAN(Zhang et al. 2018) 92.5 98.8 100.0 90.1 72.1 69.9 87.2 CD AN-E(Long et al. 2018) 94.1 98.6 100.0 92.9 71.0 69.3 87.7 JDD A(Chen et al. 2019a) 82.6 95.2 99.7 79.8 57.4 66.7 80.2 SymNets(Zhang et al. 2019) 90.8 98.8 100.0 93.9 74.6 72.5 88.4 T ADA (W ang et al. 2019) 94.3 98.7 99.8 91.6 72.9 73.0 88.4 MED A(W ang et al. 2018) 86.2 97.2 99.4 85.3 72.4 74.0 85.7 CAPLS (W ang, Bu, and Breckon 2019) 90.6 98.6 99.6 88.6 75.4 76.3 88.2 SPL (Ours) 92.7 98.7 99.8 93.0 76.4 76.8 89.6 T able 3: Classification Accurac y (%) on ImageCLEF-D A dataset using either ResNet50 features or ResNet50 based deep models. Method I → P P → I I → C C → I C → P P → C A vg R TN(Long et al. 2016) 75.6 86.8 95.3 86.9 72.7 92.2 84.9 MAD A(Pei et al. 2018) 75.0 87.9 96.0 88.8 75.2 92.2 85.8 iCAN(Zhang et al. 2018) 79.5 89.7 94.7 89.9 78.5 92.0 87.4 CD AN-E(Long et al. 2018) 77.7 90.7 97.7 91.3 74.2 94.3 87.7 SymNets(Zhang et al. 2019) 80.2 93.6 97.0 93.4 78.7 96.4 89.9 MED A(W ang et al. 2018) 79.7 92.5 95.7 92.2 78.5 95.5 89.0 SPL (Ours) 78.3 94.5 96.7 95.7 80.5 96.3 90.3 use ResNet50 features ( d = 2048 ) in our experiments. Al- though a small dimensionality of the PCA space d 1 is pre- ferred for less computation, it can cause information loss for a dataset with a large number of classes (e.g., Office-Home). T o trade off, we set the v alues of d 1 based on the number of classes in the dataset which results in d 1 = 128 , 512 , 128 and 1024 for Office-Caltech, Office-31, ImageCLEF-D A and Of fice-Home respecti vely . For the dimensionality of the space learned by SLPP , we set d 2 = 128 uniformly for all datasets. The number of iterations T is set to 10 in all e xper- iments unless otherwise specified. Comparison with State-of-the-Art A pproaches W e compare our approach with the state of the arts including those based on deep features (extracted using deep models such as ResNet50 pre-trained on ImageNet) and deep learn- ing models. The classification accuracy of our approaches and the comparati ve ones are shown in T ables 1-4 in terms of each combination of “source” → “target” domains and the av erage accurac y o ver all dif ferent combinations. In each ta- ble, the results of deep learning based models are listed on the top followed by deep feature based methods including ours. Our approach is denoted as SPL (Selective Pseudo- Labeling). W e use bold and underlined fonts to indicate the best and the second best results respectiv ely in each setting. From T ables 1-4 we can see that our proposed approach with the combination of tw o different pseudo-labeling meth- ods achie ves the highest a verage accuracy (see the last col- umn of each table) consistently on four datasets. Specif- ically , our proposed SPL achiev es an a verage accuracy of 93.0% on the Offi ce-Caltech dataset (T able 1), slightly bet- ter than MEDA (W ang et al. 2018) which has an aver - age accuracy of 92.8%. On the Office31 dataset (T able 2), SPL achie ves the best or the second-best performance in fiv e out of six tasks and the best a verage performance of 89.6% while the second-highest av erage accuracy (88.4%) was achie ved by the deep learning based approaches Sym- Nets (Zhang et al. 2019) and (W ang et al. 2019). On the ImageCLEF-D A dataset (T able 3), the proposed SPL ap- proach performs the best or the second-best in four out of six tasks and ranks the first with the average accurac y of 90.5% followed by the deep learning model SymNets (Zhang et al. 2019, 89.9%) and deep feature based model MED A (W ang et al. 2018, 89.0%). On the Office-Home dataset (T able 4, again, our approach SPL outperforms all state-of-the-art models with an average accuracy of 71.0% against 70.6% by CAPLS (W ang, Bu, and Breckon 2019) and 67.6% by SymNets (Zhang et al. 2019) and T AD A (W ang et al. 2019). In summary , our selective pseudo-labeling approach can outperform both deep learning models and traditional fea- ture transformation approaches on four commonly used datasets for UD A. Ablation Study W e conduct an ablation study to analyse how different com- ponents of our work contribute to the final performance. T o this end, we in v estigate different combinations of four components: pseudo-labeling (PL), sample selection (S) for pseudo-labeling, nearest class prototype (NCP) and struc- tured prediction (SP). W e report the average classification accuracy on four datasets in T able 5. It can be observed that methods with pseudo-labeling outperform those without pseudo-labeling and the use of selective pseudo-labeling fur- ther impro ves the performance significantly on all datasets. In terms of the pseudo-labeling strategy , structured predic- tion (SP) outperforms nearest class prototype (NCP) consis- tently while the combination of these two can further im- prov e the accuracy marginally . T able 4: Classification Accuracy (%) on Of fice-Home dataset using either ResNet50 features or ResNet50 based deep models. Method A → C A → P A → R C → A C → P C → R P → A P → C P → R R → A R → C R → P A verage J AN(Long et al. 2017) 45.9 61.2 68.9 50.4 59.7 61.0 45.8 43.4 70.3 63.9 52.4 76.8 58.3 CD AN-E (Long et al. 2018) 50.7 70.6 76.0 57.6 70.0 70.0 57.4 50.9 77.3 70.9 56.7 81.6 65.8 SymNets (Zhang et al. 2019) 47.7 72.9 78.5 64.2 71.3 74.2 64.2 48.8 79.5 74.5 52.6 82.7 67.6 T ADA (W ang et al. 2019) 53.1 72.3 77.2 59.1 71.2 72.1 59.7 53.1 78.4 72.4 60.0 82.9 67.6 MED A(W ang et al. 2018) 54.6 75.2 77.0 56.5 72.8 72.3 59.0 51.9 78.2 67.7 57.2 81.8 67.0 CAPLS (W ang, Bu, and Breckon 2019) 56.2 78.3 80.2 66.0 75.4 78.4 66.4 53.2 81.1 71.6 56.1 84.3 70.6 SPL (Ours) 54.5 77.8 81.9 65.1 78.0 81.1 66.0 53.1 82.8 69.9 55.3 86.0 71.0 32 64 128 256 512 1024 The dimensionality of PCA space 40 50 60 70 80 90 100 Average accuracy (%) The effect of d 1 Office-Caltech Office31 ImageCLEF-DA Office-Home 8 16 32 64 128 256 512 The dimensionality of SLPP space 40 50 60 70 80 90 100 Average accuracy (%) The effect of d 2 Office-Caltech Office31 ImageCLEF-DA Office-Home 1 2 3 4 5 6 7 8 9 10 15 20 The number of iterations 40 50 60 70 80 90 100 Average accuracy (%) The effect of T Office-Caltech Office31 ImageCLEF-DA Office-Home Figure 2: The effect of hyper-parameters (i.e. the dimensionality of PCA space d 1 , the dimensionality of SLPP sapce d 2 and the number of iterations T ). T able 5: Results of ablation study . Method Office-Caltech Office31 ImageCLEF-DA Office-Home PL S NCP SP 7 7 3 7 81.8 82.0 86.2 63.9 7 7 7 3 90.3 87.5 89.5 68.0 7 7 3 3 90.7 87.6 89.4 68.1 3 7 3 7 85.5 83.7 86.9 66.2 3 7 7 3 91.9 88.0 90.0 68.9 3 7 3 3 92.0 88.0 90.0 69.0 3 3 3 7 90.8 87.8 89.0 70.8 3 3 7 3 93.0 89.5 90.2 71.0 3 3 3 3 93.0 89.6 90.3 71.0 Effects of Hyper -parameters Our approach has three hyper -parameters: the dimensional- ity of PCA space d 1 , the dimensionality of SLPP space d 2 and the number of iterations T . W e in vestigate how each hyper-parameter affects the performance by setting it to a se- ries of different values while fixing the other two. The results are shown in Figure 2 in which the av erage accurac y o ver all possible source-target pairs are reported for four datasets. As we can see, the datasets with more classes (e.g., Office31 and Office-Home) tend to large values of d 1 while small v al- ues of d 1 are beneficial to the datasets with fe wer classes (e.g., Office-Caltech and ImageCLEF-D A). In terms of the dimensionality of SLPP space d 2 , the performance does not change too much unless its v alue is less than the number of classes. The number of iterations T has nearly zero effect on the performance when it is greater than 2. T o summarize, our approach is not sensiti ve to the hyper-parameters and performs comparably well if only d 2 is set greater than the number of classes. Conclusion W e propose a novel selectiv e pseudo-labeling approach to UD A by incorporating supervised subspace learning and structured prediction based pseudo-labeling into an iterati ve learning frame work. The proposed approach outperforms other state-of-the-art methods on four benchmark datasets. The ablation study demonstrates the ef fectiv eness of selec- tiv e pseudo-labeling and structured prediction which can also be employed to train the deep learning models for UD A in the future work. References [Caputo et al. 2014] Caputo, B.; M ¨ uller , H.; Martinez-Gomez, J.; V illegas, M.; Acar, B.; P atricia, N.; Marv asti, N.; ¨ Usk ¨ udarlı, S.; Paredes, R.; Cazorla, M.; et al. 2014. Imageclef 2014: Ov erview and analysis of the results. In International Conference of the Cr oss-Language Evaluation F orum for Eur opean Languages , 192– 211. Springer . [Chen et al. 2019a] Chen, C.; Chen, Z.; Jiang, B.; and Jin, X. 2019a. Joint domain alignment and discriminati ve feature learning for un- supervised deep domain adaptation. In AAAI Confer ence on Artifi- cial Intelligence . [Chen et al. 2019b] Chen, C.; Xie, W .; Huang, W .; Rong, Y .; Ding, X.; Huang, Y .; Xu, T .; and Huang, J. 2019b . Progressiv e feature alignment for unsupervised domain adaptation. In IEEE Confer - ence on Computer V ision and P attern Recognition , 627–636. [Deng et al. 2009] Deng, J.; Dong, W .; Socher , R.; Li, L.-J.; Li, K.; and Fei-Fei, L. 2009. ImageNet: A large-scale hierarchical im- age database. In IEEE conference on computer vision and pattern r ecognition , 248–255. IEEE. [Donahue et al. 2014] Donahue, J.; Jia, Y .; V inyals, O.; Hoffman, J.; Zhang, N.; Tzeng, E.; and Darrell, T . 2014. Decaf: A deep con volutional acti vation feature for generic visual recognition. In International Confer ence on Machine Learning , 647–655. [Ganin and Lempitsky 2015] Ganin, Y ., and Lempitsky , V . 2015. Unsupervised domain adaptation by backpropagation. In Interna- tional Confer ence on Machine Learning , 1180–1189. [Ganin et al. 2016] Ganin, Y .; Ustinova, E.; Ajakan, H.; Germain, P .; Larochelle, H.; Laviolette, F .; Marchand, M.; and Lempitsky , V . 2016. Domain-adversarial training of neural networks. The Journal of Machine Learning Resear ch 17(1):2096–2030. [Ghifary et al. 2016] Ghifary , M.; Balduzzi, D.; Kleijn, W . B.; and Zhang, M. 2016. Scatter com ponent analysis: A unified framew ork for domain adaptation and domain generalization. IEEE T ransac- tions on P attern Analysis and Machine Intelligence 39(7):1414– 1430. [Gong et al. 2012] Gong, B.; Shi, Y .; Sha, F .; and Grauman, K. 2012. Geodesic flo w kernel for unsupervised domain adaptation. In IEEE Conference on Computer V ision and P attern Recognition , 2066–2073. IEEE. [He and Niyogi 2004] He, X., and Niyogi, P . 2004. Locality pre- serving projections. In Advances in neural information pr ocessing systems , 153–160. [He et al. 2016] He, K.; Zhang, X.; Ren, S.; and Sun, J. 2016. Deep residual learning for image recognition. In IEEE confer ence on computer vision and pattern r ecognition , 770–778. [Long et al. 2013] Long, M.; W ang, J.; Ding, G.; Sun, J.; and Y u, P . S. 2013. Transfer feature learning with joint distribution adapta- tion. In International Conference on Computer V ision , 2200–2207. [Long et al. 2014] Long, M.; W ang, J.; Ding, G.; Sun, j.; and Y u, P . S. 2014. T ransfer joint matching for unsupervised domain adap- tation. In Computer V ision and P attern Recognition , 1410–1417. [Long et al. 2015] Long, M.; Cao, Y .; W ang, J.; and Jordan, M. I. 2015. Learning transferable features with deep adaptation net- works. In International Conference on Mac hine Learning , 97–105. JMLR. org. [Long et al. 2016] Long, M.; Zhu, H.; W ang, J.; and Jordan, M. I. 2016. Unsupervised domain adaptation with residual transfer net- works. In Advances in Neural Information Processing Systems , 136–144. [Long et al. 2017] Long, M.; Zhu, H.; W ang, J.; and Jordan, M. I. 2017. Deep transfer learning with joint adaptation networks. In International Confer ence on Machine Learning , 2208–2217. [Long et al. 2018] Long, M.; Cao, Z.; W ang, J.; and Jordan, M. I. 2018. Conditional adversarial domain adaptation. In Advances in Neural Information Pr ocessing Systems , 1647–1657. [Maaten and Hinton 2008] Maaten, L. v . d., and Hinton, G. 2008. V isualizing data using t-sne. Journal of machine learning resear ch 9(Nov):2579–2605. [Pei et al. 2018] Pei, Z.; Cao, Z.; Long, M.; and W ang, J. 2018. Multi-adversarial domain adaptation. In AAAI Confer ence on Arti- ficial Intelligence . [Saenko et al. 2010] Saenko, K.; Kulis, B.; Fritz, M.; and Darrell, T . 2010. Adapting visual category models to new domains. In Eur opean Confer ence on Computer V ision , 213–226. Springer . [Sankaranarayanan et al. 2018] Sankaranarayanan, S.; Balaji, Y .; Castillo, C. D.; and Chellappa, R. 2018. Generate to adapt: Align- ing domains using generati ve adversarial networks. In IEEE Con- fer ence on Computer V ision and P attern Recognition . [Sun and Saenko 2016] Sun, B., and Saenko, K. 2016. Deep coral: Correlation alignment for deep domain adaptation. In Eur opean Confer ence on Computer V ision , 443–450. Springer . [Sun, Feng, and Saenko 2016] Sun, B.; Feng, J.; and Saenko, K. 2016. Return of frustratingly easy domain adaptation. In AAAI 2016 , volume 6, 8. [Sun, Feng, and Saenko 2017] Sun, B.; Feng, J.; and Saenko, K. 2017. Correlation alignment for unsupervised domain adaptation. In Domain Adaptation in Computer V ision Applications . 153–171. [Tzeng et al. 2014] Tzeng, E.; Hoffman, J.; Zhang, N.; Saenko, K.; and Darrell, T . 2014. Deep domain confusion: Maximizing for domain in variance. arXiv pr eprint arXiv:1412.3474 . [Tzeng et al. 2017] Tzeng, E.; Hoffman, J.; Saenko, K.; and Dar- rell, T . 2017. Adversarial discriminativ e domain adaptation. In IEEE Confer ence on Computer V ision and P attern Recognition , volume 1, 4. [V enkateswara et al. 2017] V enkateswara, H.; Eusebio, J.; Chakraborty , S.; and Panchanathan, S. 2017. Deep hashing network for unsupervised domain adaptation. In IEEE Conference on Computer V ision and P attern Recognition , 5018–5027. [W ang and Chen 2017] W ang, Q., and Chen, K. 2017. Zero-shot visual recognition via bidirectional latent embedding. International Journal of Computer V ision 124(3):356–383. [W ang et al. 2018] W ang, J.; Feng, W .; Chen, Y .; Y u, H.; Huang, M.; and Y u, P . S. 2018. V isual domain adaptation with manifold embedded distrib ution alignment. In 2018 A CM Multimedia Con- fer ence on Multimedia Confer ence , 402–410. A CM. [W ang et al. 2019] W ang, X.; Li, L.; Y e, W .; Long, M.; and W ang, J. 2019. Transferable attention for domain adaptation. In AAAI Confer ence on Artificial Intelligence (AAAI) . [W ang, Bu, and Breckon 2019] W ang, Q.; Bu, P .; and Breckon, T . P . 2019. Unifying unsupervised domain adaptation and zero-shot vi- sual recognition. In International J oint Confer ence on Neur al Net- works . [Zhang and Saligrama 2016] Zhang, Z., and Saligrama, V . 2016. Zero-shot recognition via structured prediction. In Eur opean con- fer ence on computer vision , 533–548. Springer . [Zhang et al. 2018] Zhang, W .; Ouyang, W .; Li, W .; and Xu, D. 2018. Collaborative and adversarial network for unsupervised do- main adaptation. In IEEE Conference on Computer V ision and P attern Recognition , 3801–3809. [Zhang et al. 2019] Zhang, Y .; T ang, H.; Jia, K.; and T an, M. 2019. Domain-symmetric networks for adversarial domain adaptation. In Pr oceedings of the IEEE Conference on Computer V ision and P at- tern Recognition , 5031–5040. [Zhang, Li, and Ogunbona 2017] Zhang, J.; Li, W .; and Ogunbona, P . 2017. Joint geometrical and statistical alignment for visual do- main adaptation. In IEEE Conference on Computer V ision and P attern Recognition , 5150–5158. IEEE. Supplementary Material Due to the page limit, we present more experimental results and discussion in this supplementary material. V isualisation of Domain Alignment T o provide intuitiv e insights of domain alignment results using the proposed algorithm, we take the most challenging Office-Home dataset (V enkateswara et al. 2017) as an example to visualise the data distributions before and after domain alignment. W e randomly select 20 out of 65 classes from this dataset for a clear vie w . The t- SNE (Maaten and Hinton 2008) technique is used to enable the 2D visualisation. Figure 3 shows the visualisation results in the origi- nal deep feature space (left, before the domain alignment) and the learned subspace (right, after the domain alignment). The symbol “o” is used to denote samples from the source domain whilst “+” is for samples from the target domain. Different classes are indicated by different colors. It can be seen that our domain alignment algorithm is able to promote the separability in the learned subspace (right). Both the marginal and conditional distrib utions are well aligned. It can also be observed from Figure 3 that data distributions in the original deep feature space are already good enough due to the transferra- bility of deep models pre-trained on ImageNet (Deng et al. 2009). This is also validated by the results (T able 6) of two baseline meth- ods, i.e., 1 Nearest Neighbor (1NN) and Support V ector Machine (SVM), based solely on the labeled source samples without any domain adaptation. It is such f avorable properties of deep features that enables the structured prediction algorithm to be able to take adv antage of the cluster information and promote the domain alignment perfor- mance. T able 6: Results of 1NN and SVM without domain adapta- tion. Method Of fice-Caltech Of fice31 ImageCLEF-D A Of fice-Home 1NN 83.8 79.8 80.0 54.5 SVM 83.9 81.0 85.9 61.3 Learning Pr ocess of NCP and SP W e have demonstrated the superiority of the Structured Prediction (SP) over the Nearest Class Prototype (NCP) method in the ablation study . Here we sho w more details of the learning process when two different methods are employed in Figure 4. In this experiment, we set the number of iterations to 10 and report the classification accuracy for each iteration. It can be seen from Figure 4 that with more iterations (more pseudo-labeled target samples), the classification performance is improv ed gradually . The SP method can achieve much better per - formance than the NCP method at the beginning of the iterativ e learning process. It is due to the benefit of exploiting the structural information in the target domain. With more iterations when more target samples are pseudo-labeled and participate in the domain alignment, the classification accuracy can be improved gradually for both SP and NCP methods, although SP can always achieve better final performance than NCP . Response to Reviewers Reviewer1 While the results on Office-Home dataset ar e very good, a number of benchmarks datasets such as CIF AR, SVHN wer e omitted in the comparison. Can the authors explain why a mor e ver satile collection of datasets was not used ? in that re gards, what is the main limitation of the method ? The selected four datasets in our experiments hav e been widely used in recent publications. W e were a ware of other datasets used for UD A including those mentioned by the re viewer (e.g., MNIST - SVHN, CIF AR-STL, etc.). W e select the datasets containing more domains so that there are more sub-tasks (i.e., three domains lead to six sub-tasks and four domains lead to 12 sub-tasks) on which the proposed method can be thoroughly ev aluated and compared against state-of-the-arts fairly . W e have also conducted experiments on the CIF AR → STL and STL → CIF AR tasks using ResNet50 fea- tures and achie ved 94.9% and 82.4% accuracy respectiv ely . Ho w- ev er , our approach is not suitable for the Digit datasets due to the limitation of e xcessiv e memory usage when the number of samples is too large. This limitation is shared by many feature transforma- tion based methods and addressing it can be an interesting direction for our future work. Reviewer2 I’ve seen the computational complexity section, but can you comment on how longs do the e xperiments take in prac- tice? Running on a laptop with Intel i5-7300 CPU and 32G RAM, it takes around 18, 83, 10, 2070 seconds for all sub-tasks of the Office-Caltech, Of fice31, ImageCLEF-DA and Office-Home datasets, respectiv ely . Reviewer3 Q1. In the second par agraph p.3, the authors stated ”the structur ed pr ediction based method tends to select samples far away from the sour ce samples”. I cannot find the r eason in the paper . Thanks for pointing out this ambiguous statement in the manuscript. W e would like to gi ve an explanation here and revise the statement in the manuscript accordingly to dismiss the potential ambiguity and misleading. Most existing sample selection strate- gies select the target samples close to the source class prototypes (i.e. source class means) for pseudo labeling. As a result, the se- lected target samples are usually the outliers of the corresponding target cluster . One can imagine two point clusters (which are not completely ov erlapped due to the domain shift) representing the source sample cluster and the corresponding target sample clus- ter belonging to the same class, then the closest target point to the source cluster center must locate in the outermost shell of the target point cluster . In contrast, our structured prediction based method aims to select the tar get samples closest to the ”tar get” cluster cen- ter rather than the ”source” cluster center for pseudo labeling. As a result, the selected target samples are not necessarily the ”closest” ones to the source samples and this is why we state ”the structured prediction based method tends to select samples far away from the source samples”. The pseudo-labeled target samples will partici- pate the next iteration of supervised learning and therefore will be ”pulled” to the source data of the same class. If the pseudo-labeled target samples are only the outliers or the outermost ones of the target cluster , the result of the ”pulling” will only force the source and target clusters to ”touch” each other . Howe ver , if the pseudo- labeled target samples are close to the target cluster center , the re- sult of the ”pulling” will force the tw o clusters align. This e xplains why our structured prediction based method enables a faster (i.e. less iterations) domain alignment. Q2. Why the pseudo-labeling appr oach is employed? It seems not to be a straightforwar d implementation of the cluster assump- tion. Cannot the assumption be implemented as a loss function like as, for example , a similar formulation to the semi-supervised loss, which encour ages the decision boundary not to cr oss the dense r e- gion of unsupervised instances? W e agree that a straightforw ard implementation of the clus- ter assumption is to learn decision boundaries passing the lo w- density region of unlabeled samples. Although it works well in semi-supervised learning where the unlabeled samples come from Figure 3: Data distributions in the original deep feature space (left) and the learned subspace (right) for 20 classes from the Home-Office dataset. “o” and “+” denote the source and target samples respectiv ely . Dif ferent classes are denoted by different colors. 0 2 4 6 8 10 Iteration k 80 82 84 86 88 90 92 94 Average Accuracy (%) Office-Caltech SLP+NCP SLP+SP 0 2 4 6 8 10 Iteration k 80 82 84 86 88 90 Average Accuracy (%) Office31 SLP+NCP SLP+SP 0 2 4 6 8 10 Iteration k 86 87 88 89 90 91 Average Accuracy (%) ImageCLEF-DA SLP+NCP SLP+SP 0 2 4 6 8 10 Iteration k 62 64 66 68 70 72 Average Accuracy (%) Office-Home SLP+NCP SLP+SP Figure 4: Accuracy curv es of iterativ e learning process using nearest class prototype (NCP) and structured prediction (SP). the same distrib ution as the labeled samples, it is not necessarily a good solution to the domain adaptation problem. The reason is, in the domain adaptation problem, the unlabeled target samples and labeled source samples are from dif ferent domains and hence they can be distrib uted in separate clusters even they belong to the same class. As a result, the decision boundaries learned under the cluster assumption for UD A may not be class discriminati ve (they might be boundaries of domains rather than classes, see Figure 1 (a) in [2]). Actually , the existing works[1][2] following the cluster assumption for UD A also employ pseudo-labeling to address this issue. As we have discussed in the section of related work, pseudo- labeling is one of the enabling techniques applied in man y unsuper- vised domain adaptation approaches tow ards the alignment of both marginal and conditional distrib utions. Our approach aims to learn a subspace where the two domains are aligned via supervised LPP which requires pseudo-labeled samples from the target domain for conditional distribution alignment. The assumption of cluster struc- ture in the tar get domain is explored by our structured prediction algorithm which predicts the pseudo-labels of target samples col- lectiv ely (i.e. cluster-wisely). In this sense, the cluster assumption has been used in a totally dif ferent way from learning decision boundaries passing the lo w-density re gion. In summary , the clus- ter assumption in UD A is dif ferent from that in the semi-supervised learning problem; and we explore the cluster structural information in the target domain via our structured prediction algorithm rather than the low-density separation idea for semi-supervised learning. [1] Shu, Rui, et al. ”A dirt-t approach to unsupervised domain adaptation. ” ICLR 2018. [2] Kumar , Abhishek, et al. ”Co-re gularized alignment for unsu- pervised domain adaptation. ” NIPs 2018.
Original Paper
Loading high-quality paper...
Comments & Academic Discussion
Loading comments...
Leave a Comment