Accident Risk Prediction based on Heterogeneous Sparse Data: New Dataset and Insights
Reducing traffic accidents is an important public safety challenge, therefore, accident analysis and prediction has been a topic of much research over the past few decades. Using small-scale datasets with limited coverage, being dependent on extensiv…
Authors: Sobhan Moosavi, Mohammad Hossein Samavatian, Srinivasan Parthasarathy
Accident Risk Prediction based on Heterogeneous Sparse Data: New Dataset and Insights Sobhan Moosavi The Ohio State University Columbus, Ohio moosavi.3@osu.edu Mohammad Hossein Samavatian The Ohio State University Columbus, Ohio samavatian.1@osu.edu Srinivasan Parthasarathy The Ohio State University Columbus, Ohio srini@cse.ohio- state.edu Radu T eodorescu The Ohio State University Columbus, Ohio teodores@cse.ohio- state.edu Rajiv Ramnath The Ohio State University Columbus, Ohio ramnath@cse.ohio- state.edu ABSTRA CT Reducing trac accidents is an important public safety challenge, therefore, accident analysis and prediction has b een a topic of much research over the past few decades. Using small-scale datasets with limited coverage, being dependent on extensive set of data, and being not applicable for real-time purposes ar e the important short- comings of the existing studies. T o address these challenges, we propose a new solution for real-time trac accident prediction using easy-to-obtain, but sparse data. Our solution relies on a deep- neural-network model (which we have named D AP , for Deep Acci- dent Prediction); which utilizes a variety of data attributes such as trac events , weather data , points-of-interest , and time . D AP incorpo- rates multiple components including a recurrent (for time-sensitive data), a fully connected (for time-insensitive data), and a trainable embedding component (to capture spatial heterogeneity). T o ll the data gap , we have - thr ough a compr ehensive process of data collec- tion, integration, and augmentation - created a large-scale publicly available database of accident information name d US- Accidents . By employing the US- Accidents dataset and through an e xtensive set of experiments across several large cities, we have evaluated our proposal against several baselines. Our analysis and results show signicant improvements to predict rare accident events. Further , we have shown the impact of trac information, time, and points- of-interest data for real-time accident prediction. CCS CONCEPTS • Theor y of computation → Data integration ; • Computing methodologies → Supervise d learning by classication ; • Ap- plied computing → Transportation . KEY W ORDS Accident Prediction, US- Accidents, Heter ogeneous Data Permission to make digital or hard copies of all or part of this work for p ersonal or classroom use is granted without fee provided that copies are not made or distributed for prot or commercial advantage and that copies bear this notice and the full citation on the rst page. Copyrights for components of this work owned by others than A CM must be honor ed. Abstracting with cr edit is permitted. T o copy otherwise, or republish, to post on servers or to redistribute to lists, requires prior specic p ermission and /or a fee. Request permissions from permissions@acm.org. SIGSP A TIAL ’19, November 5–8, 2019, Chicago, IL, USA © 2019 Association for Computing Machinery . ACM ISBN 978-1-4503-6909-1/19/11. . . $15.00 https://doi.org/10.1145/3347146.3359078 A CM Reference Format: Sobhan Mo osavi, Mohammad Hossein Samavatian, Srinivasan Parthasarathy, Radu T eodorescu, and Rajiv Ramnath. 2019. Accident Risk Prediction based on Heterogeneous Sparse Data: New Dataset and Insights. In 27th A CM SIGSP A TIAL International Conference on Advances in Geographic Information Systems (SIGSP A TIAL ’19), November 5–8, 2019, Chicago, IL, USA. ACM, New Y ork, N Y , USA, 10 pages. https://doi.org/10.1145/3347146.3359078 1 IN TRODUCTION Reducing trac accidents is an important public safety challenge around the world. A global status report on trac safety [ 28 ] notes that ther e were 1.25 million trac deaths in 2013 alone, with deaths increasing in 68 countries when compared to 2010. A ccident predic- tion is imp ortant for optimizing public transportation, enabling safer routes, and cost-eectively improving the transportation infrastruc- ture, all in order to make the roads safer . Given its signicance, accident analysis and prediction has be en a topic of much research in the past few de cades. Analyzing the impact of environmental stimuli (e.g., road-network properties, w eather , and trac) on trac accident occurrence patterns [ 10 , 15 , 30 ], predicting frequency of accidents within a geographical region [ 3 , 6 , 23 , 29 , 36 ], and predict- ing risk of accidents [ 8 , 18 , 35 , 37 ] are the major related research categories. Employing small-scaled datasets with limite d coverage (e.g. a small numb er of road-segments, or just one city) [ 3 , 5 , 6 , 18 , 35 ]; being dependent on a wide range of data attributes which may not be available for all regions (e.g., satellite imagery , trac volume, and properties of road-network) [ 23 , 36 , 37 ]; b eing not applicable for real-time applications regarding the modeling constraints and pre- requisites (e.g., prediction for longer time intervals such as one day or one week, or requiring extensive set of data) [ 3 , 23 , 29 , 36 ]; and employing over simplie d methods for trac accident prediction [3, 13, 18] are the main shortcomings of the existing studies. T o addr ess these challenges and provide a reasonable solution for real-time trac accident prediction, we propose DAP , a deep-neural- network-based accident prediction mo del. DAP uses a variety of data including trac events (e .g., congestion, construction, and r oad hazards), weather (e .g., temperature, visibility , and wind sp eed), points-of-interest (e.g., trac signal, stop sign, and junction), and time (e.g., day of w eek, hour of day , and period of day ) to provide real-time prediction for a geographical region of reasonable size (i.e., a square of size 5 km × 5 km on map) and during a ne-grained time period (i.e., a 15 minutes interval). T o our knowledge, this is the SIGSP A TIAL ’19, November 5–8, 2019, Chicago, IL, USA rst research work that has emplo yed trac events and points-of- interest data for accident prediction. DAP exerts multiple important components to utilize dierent categories of attributes. T o utilize time-sensitive data ( e.g., trac, weather , and time data), D AP em- ploys a recurrent component with Long Short T erm Memor y (LSTM) cells. T o utilize time-insensitive data (e.g., points-of-interest), D AP employs feed-forward neural network layers. Further , to better cap- ture spatial heterogeneity , which has been proven to be eective for accident prediction [ 37 ], D AP employs trainable latent representa- tion for each geographical region to encode essential spatiotemp oral information. In order to mitigate the impact of data size on analysis and pre- diction, we present a new dataset, we name it US- Accidents , which includes about 2 . 25 million trac accidents took place within the contiguous United States 1 , between Februar y 2016 and March 2019. US- Accidents oers a wide range of data attributes to describe each accident including location data , time data , natural language descrip- tion of event , weather data , p eriod-of-day information 2 , and relevant points-of-interest data . Imp ortantly , we also present our process for creating the ab ove dataset from streaming trac reports and hetero- geneous contextual data (weather , points-of-interests, etc.), so that the community can validate it, and with the b elief that this process can itself ser ve as a model for dataset creation. W e performe d a variety of data analysis and proling base d on US- Accidents dataset to derive a wide-range of insights. Our analyses demonstrated that about 40% of accidents took place on or near high-sp eed roadways (highways, interstates, etc.) and about 32% on or near local roads (streets, avenues, etc.). W e also derived various insights with respect to the correlation of accidents with time, p oints-of-interest, and weather conditions. Using US- Accidents, and through extensive e xperiments across several large cities, we compared our proposal against several neural- network-based and traditional machine learning models (such as logistic regression and gradient b oosting classier). Our analysis and results show the superiority of our mo del in terms of improvement of f 1 - sc or e for the case of positive examples (i.e., cases which la- beled as accident), by ab out 16% in comparison to the best traditional model, and ab out 7% in comparison to the best neural-network- based model. When considering both positive and negative cases (negative cases are labeled as non-accident, which ar e the majority ), our proposal achieves comparable results when compared to the best baselines. Nevertheless, we note that p ositive cases are far more important, regarding their rare nature, and importance to be prop- erly predicted. Further , we conducted thorough analyses to assess the ability of dierent categories of attributes for real-time trac accident prediction using multiple testing scenarios. Our ndings indicate the importance of time, points-of-interest, and trac data for this task. The main contributions of this paper are therefore as follows. • A new methodology for heterogeneous data colle ction, cleans- ing, and augmentation to prepare a unique, large-scale dataset of trac accidents. This dataset has been collected for the con- tiguous United States over three years, and contains 2 . 25 million trac accidents. The dataset is publicly available for the research community at https://smoosavi.org/datasets/us_accidents. • A variety of insights gleaned through analyses of accident hot- spot locations, time, weather and points-of-interest correlations 1 The contiguous United States excludes Alaska and Hawaii, and considers District of Columbia (DC) as a separate state. 2 Period-of-day is associated with daylight, thus it is represented as “day” or “night” . with the accident data. These insights may directly b e utilized for applications such as urban planning, exploring aws in trans- portation infrastructure design, trac control and pr ediction, and personalized insurance. • A new deep-neural-network-based solution for trac accident prediction using heterogeneous sparse data. T o the b est of our knowledge, this is the rst work which uses information from trac ow , fuse d with other available sources of contextual data such as “weather” and “points-of-interest” , to perform accident prediction. Furthermore, our metho dology predicts future acci- dents at the ne-grained time interval of 15 minutes. For the rest of this paper , we rst provide pr eliminaries in Sec- tion 3. The overview of related work is discussed in Section 2. Sec- tion 4 describes the dataset construction process and the resulting dataset. The accident prediction framework is presented in Section 5, followed by experiments and results in Section 6. Finally , Section 7 concludes the paper . 2 RELA TED WORK Accident analysis and prediction has be en the topic of many re- search during the past few decades, where we study three categories of these work as follows. Analysis of Environmental Stimuli on Accidents. This cate- gory of work investigates the impact of environmental stimuli (e.g., weather , trac ow , and pr operties of road-network) on possibil- ity or severity of trac accidents. Studying the impact of weather factors (e.g., pr ecipitation) on road accidents [ 10 , 15 , 30 , 31 ]; apply- ing data mining techniques to extract association rules to perform causality analysis [ 1 , 17 ]; and statistical analysis of unobserved heterogeneity to explor e the impact of unavailable variables ( e.g., missing data) on severity of trac accidents [ 19 ] are some examples of this category . These studies usually provide signicant insights, howev er , may not be directly utilized for real-time prediction and planning. Accident Frequency Prediction. Prediction of the e xpecte d num- ber of trac accidents for a specic road-segment or geographical region is the target of this gr oup of studies [ 6 ]. Early work in this area by Chang et al. [ 5 ] used information such as road geometr y , annual average daily trac (AADT), and weather data to predict the frequency of accidents for a highway using a neural network model. Caliendo et al. [ 3 ] used a set of road-related attributes such as length, curvature , AADT , sight distance, and presence of junction to predict frequency of accidents. The usage of satellite imager y to predict the frequency of accidents by a convolutional neural network mo del using large scale accident and imagery data was proposed by Najjar et al. [ 23 ]. Further , Ren et al. [ 29 ] recently used a Long Short T erm Memory (LSTM) model to predict the frequency of accidents, given the histor y of past 100 hours, for grid cells of size 1 km × 1 km . Similarly , Chen et al. [ 7 ] proposed to use a stack denoising convolutional autoencoder model to predict frequency of accidents for grid cells using trac ow (collected using plate recognition systems), past trac accidents, and time data. Y uan et al. [ 36 ] proposed hetero-ConvLSTM to predict frequency of trac accidents using several sources of envir onmental data such as trac volume, road condition, rainfall, temperature , and satellite images. They evaluated their mo del using a large-scale data of trac ac- cidents from state of Iowa, p erformed predictions for grid cells of size 5 km × 5 km , and showed the importance of capturing spatial heterogeneity and temporal tr ends to better predict trac accidents S. Moosavi et al. SIGSP A TIAL ’19, November 5–8, 2019, Chicago, IL, USA [ 36 ]. Studies in this category usually make use of many pieces of information that may not be available in real-time applications. Accident Risk Prediction. This categor y of work is ver y much similar to the previous one, unless prediction here is dened as a binary classication task which better ts real-time applications [ 35 , 37 ]. Using data for a single segment of I-64 in Virginia ( US), Lin et al. [ 18 ] leveraged a decision tree model to separate pre-crash records from normal ones, using information such as weather , visibility , trac volume, speed, and occupancy information. Howev er , their limited size of data might weaken their solution or ndings. In another study Chen et al. [ 8 ] used human mobility data in terms of 1.6 million GPS records and a set of 300,000 accident records in T okyo ( Japan) to predict the possibility of accident occurrence on grid cells of size 500 m × 500 m in an hourly basis. They leveraged a stack denoising autoencoder model to extract latent features from human mobility , and then used a logistic regression model to predict accidents. Finally , Yuan et al. [ 37 ] use d a heterogeneous set of urban data such as road characteristics (AAD T , speed limit, etc.), radar- based rainfall data, temperature data, and demographic data to predict probability of accident for each road-segment in state of Iowa. They leveraged eigen-analysis to capture and represent spatial heterogeneity . Their analyses and results suggest the importance of time, human factors, weather data, and road-network characteristics for this task. Our proposal belongs to the last categor y as we seek to perform accident risk prediction. Further , our solution is more suitable for real-time applications as we provide prediction for much shorter time interval (i.e., 15 minutes) in comparison to literature. Besides, our usage of real-time trac events and points-of-interest, to the best of our knowledge, is not discussed before . Lastly , the type of input data which we use for prediction is rather easy to colle ct and available to public, in contrast to those work which use d extensive set of data for modeling and prediction. 3 PRELIMINARIES AND PROBLEM ST A TEMEN T Denition 3.1 (Trac Ev ent) . W e dene a trac event e by e = ⟨ l at , l n д , t ime , t y p e , d e s c ⟩ , where l at and l n д represent the GPS co- ordinates, t y pe is a categorical classication of the event, and d es c provides a natural language description of the e vent. A trac event is one of the following types: accident , broken-vehicle , congestion , construction , event , lane-blocked , and ow-incident . T able 1 describes these events. T able 1: Denition of Trac Events. T ype Description Accident A collision event which may involve one or mor e vehicles. Broken-vehicle Refers to the situation when there is one (or more) disabled vehicle( s) in a road. Congestion Refers to the situation when the speed of trac is slower than the expected speed or spe ed-limit. Construction Refers to maintenance project on a road. Event Situations such as sports event , demonstrations , or concerts , that could potentially impact trac ow . Lane-blocked Refers to the cases when we have blocked lane(s) due to trac or weather condition. Flow-incident Refers to all other types of trac events. Examples are broken trac light and animal in the road . Denition 3.2 (W eather Observation Record) . A weather obser- vation w is dened by w = ⟨ l at , l n д , t ime , t empe r at ur e , hum id i t y , pr e ss ur e , v is ib il i t y , w ind - spe e d , pr e ci p , r ai n , s now , f o д , hai l ⟩ . Here l at and l n д represent the GPS co ordinates of the weather station which reported w ; precip is the precipitation amount (if any); and rain, snow , fog, and hail are binary indicators of these events. Denition 3.3 (Point-of-Interest) . A point-of-interest p is dened by p = ⟨ l at , l n д , t y p e ⟩ . Here, l at and l n д show the GPS latitude and longitude coordinates, and available types for p are describ ed in T able 2. Note that several of denitions in this table are adopted from https://wiki.openstreetmap.org. T able 2: Denition of Point-Of-Interest (POI) annotation tags based on Op en Street Map (OSM). T ype Description Amenity Refers to particular places such as restaurant, library , college, bar , etc. Bump Refers to speed bump or hump to reduce the spe ed. Crossing Refers to any crossing across roads for pedestrians, cyclists, etc. Give-way A sign on road which shows priority of passing. Junction Refers to any highway ramp, exit, or entrance. No-exit Indicates there is no possibility to travel further by any transport mode along a formal path or route. Railway Indicates the presence of railways. Roundabout Refers to a circular road junction. Station Refers to public transportation station (bus, metro, etc.). Stop Refers to stop sign. Trac Calming Refers to any means for slowing down trac speed. Trac Signal Refers to trac signal on intersections. T urning Loop Indicates a widened area of a highway with a non-traversable island for turning around. Denition 3.4 (Geographical Region) . W e dene a geographical region r as a square of size l × l over the map of a city . The choice of l is related to application domain, and in this work we set l = 5 km . Given the preliminaries, we formulate the pr oblem as follows: Given: – A spatial grid R = { r 1 , r 2 , . . . , r n } , where each r ∈ R is a geographical region of size 5 km × 5 km . – A set of xed-length time intervals T = { t 1 , t 2 , . . . , t m } , where we set | t | = 15 minutes , for t ∈ T . – A database of trac events E r = { e 1 , e 2 , . . . } for each geo- graphical region r ∈ R . – A database of weather obser vation records W r = { w 1 , w 2 , . . . } for each geographical region r ∈ R . – A database of points of interest P r = { p 1 , p 2 , . . . } for each geographical region r ∈ R . Create: – A representation F r t for a region r ∈ R during a time inter val t ∈ T , using E r , W r , and P r . – A binary label L r t for F r t , where 1 indicates at least one traf- c accident happened during t in region r , and 0 otherwise. Find: – A model M to predict L r t using ⟨ F r t i − 8 , F r t i − 7 , . . . , F r t i − 1 ⟩ , which means predicting the label of current time interval using observations from the last 8 time intervals to Objective: – Minimize the prediction error . SIGSP A TIAL ’19, November 5–8, 2019, Chicago, IL, USA 4 A CCIDEN T DA T ASET This section describes the process of constructing a country-wide trac accident dataset, which w e named US- Accidents . An overview of this process is shown in Figure 1. US-A ccident contains 2 . 25 mil- lion cases of trac accidents that took place within the United States from February 2016 to March 2019. The following sub-sections pro- vide a detailed description of each step of the data preparation process. The dataset is publicly available at https://smoosavi.org/ datasets/us_accidents. FinalAccidentDataset DataAugmentation (4):WithReverseGeo- coding( Nominatim ) (5):WithW eatherData ( W undergr ound ) (6):WithPoints-of- Interest( OSM ) (7):WithPeriod-of-Day ( T imeAndDate ) T rafficDataCollection (1): MapQuest RealtimeTraf fic DataCollector (2): MS-Bing RealtimeTraf fic DataCollector (3):Integration RawAccident Dataset Figure 1: Process of Creating Trac Accident Dataset 4.1 Trac Data Collection 4.1.1 Realtime T raic Data Collection. W e collected streaming traf- c data using two real-time data providers, namely “MapQuest Traf- c” [ 20 ] and “Microsoft Bing Map Trac” [ 2 ], whose APIs broadcast trac events (accident, congestion, etc.) captured by a variety of entities - the US and state departments of transportation, law en- forcement agencies, trac cameras, and trac sensors within the road-networks. W e pulled data every 90 seconds from 6am to 11pm, and every 150 seconds from 11pm to 6am. In total, we collected 2 . 27 million cases of trac accidents between February 2016 and March 2019; 1 . 73 million cases were pulled from MapQuest, and 0 . 54 million cases from Bing. 4.1.2 Integration. Integration of the data consisted of removing cases duplicated across the two sources and building a unied dataset. W e considered two ev ents as duplicates if their Haver- sine distance and their recorded times of o ccurrence were both below a heuristic threshold (set empirically at 250 meters and 10 minutes, respectively). W e believe these settings to be conservative, but we settled on them in order to ensure a very low possibility of duplicates. Using these settings, we found about 24 , 600 duplicate d accident records, or about 1% of all data. The nal dataset after removing the duplicated cases comprised 2 . 25 million accidents. 4.2 Data Augmentation 4.2.1 A ugmenting with Reverse Ge o-Coding. Raw trac accident records contained only GPS data. W e employed the Nominatim tool [ 24 ] to perform reverse geocoding to translate GPS coordinates to addresses, each consisting of a str eet number , street name , relative side (left/right) , city , county , state , countr y , and zip-code . This process is same as point-wise map-matching . 4.2.2 A ugmenting with W eather Data. W eather information pro- vides important context for trac accidents. Thus, we employed W eather Underground API [ 34 ] to obtain weather information for each accident. Raw weather data was collected from 1,977 weather stations located in airp orts all around the United States. The raw data comes in the form of observation records, where each r ecord consists of several attributes such as temperature , humidity , wind- speed , pressure , precipitation (in millimeters), and condition 3 . For each weather station, w e collected se veral data records per day , each of which was reported upon any signicant change in any of the measured weather attributes. Each trac event e was augmente d with weather data as fol- lows. First the closest weather station s was identied. Then, of the weather observation records which w ere reported from s , we looked for the weather observation record w whose reported time was closest to the start time of e , and augmented it with weather data. In our integrated accident dataset, the average dierence in re- port time for an accident record and its paired weather obser vation record was about 15 minutes. 4.2.3 Augmenting with Points-Of-Interest. Points-of-interest (POI) are locations annotated on a map as amenities , trac signals , cross- ings , etc. These annotations are asso ciated with nodes on a road- network. A node can be associated with a variety of POI typ es, howev er , in this work we only use 13 types as describe d in T able 2. W e obtained these annotations from Open Street Map ( OSM) [ 25 ] for the United States, using its most recently released dataset ( ex- tracted on April 2019). The applicable POI annotations for a trac accident a are those which ar e located within a distance threshold τ from a . W e determine this threshold by evaluating dierent values to nd the value that is best able to associate a POI with an accident. Essentially , the objective is to nd the b est distance for which a POI annotation can be identied as relevant to an accident record. Therefore, w e need a mechanism to measure the relevancy . T o be- gin with, we note that the natural language descriptions of trac accidents follow a set of regular expr ession patterns, and that a few of these patterns may be used to identify and use as an annotation for the location type (e.g., intersection or junction) of the accident. Regular Expression Patterns. Given the description of trac accidents, we wer e able to identify 27 regular expression patterns; 16 of them were extracted based on MapQuest data, and 11 from Bing data. Among the MapQuest patterns, the following e xpression corresponds to junctions (see T able 2): “ . . . on . . . at exit . . . ” , and the following pattern mostly 4 determines an intersection : “ . . . on . . . at . . . ” . An intersection is associated with crossing , stop , or trac signal (see T able 2). Among Bing regular expression patterns, two of them identify junctions: “ at . . . exit . . . ” and “ ramp to . . . ” . T able 3 shows several examples of accidents, where the regular expression pattern (in bold face) identies the correct POI type 5 . The essential idea is to nd a threshold value that maximizes the correlation between annotations from POI and annotations derived using regular expression patterns. Thus, for a set of accident records, we annotate their location based on both metho ds, regular expr es- sion patterns as well as OSM-base d POI annotations (using a sp ecic distance threshold). Then, we measure the correlation between the annotations derived from these metho ds to nd which threshold value provides the highest corr elation (i.e., the best choice). Note that we employ the r egular expression patterns as pseudo ground truth labels, to evaluate OSM-based POI annotations using dier ent 3 Possible values are clear , snow , rain , fog , hail , and thunderstorm . 4 Using 200 randomly sampled accidents cases which w ere manually checked on a map, about 78% of matches using this pattern were actually occurred on intersections. 5 These cases were manually checked on a map to ensure the correctness of the anno- tation. S. Moosavi et al. SIGSP A TIAL ’19, November 5–8, 2019, Chicago, IL, USA T able 3: Examples of trac accidents with their annotation type as- signed using their natural language description by regular expres- sion patterns. Source Description T ype MapQuest Serious accident on 4th A ve at McCullaugh Rd. Intersection MapQuest Accident on NE-370 Gruenther Rd at 216th St. Intersection MapQuest Accident on I-80 at Exit 4A Treasur e Is. Junction MapQuest Accident on I-87 I-287 Southb ound at Exit 9 I-287. Junction Bing At Porter A ve/ Exit 9 - Accident. Left lane blocked. Junction Bing At IL-43/Harlem A ve/ Exit 21B - Accident. Junction Bing Ramp to I-15/Ontario Fw y/Cherry A ve - A ccident. Junction Bing Ramp to Q St - Accident. Right lane blocked. Junction Algorithm 1: Find Annotation Correlation 1: Input: a dataset of trac accidents A , a database of p oints-of-interest P , and a distance threshold τ . 2: Extract and create a set of regular expression patterns R E to identify a specic POI ν . 3: Create set S 1 : for each trac accident a ∈ A , we add it to S 1 if its natural language description a . d e s c can be matched with at least one regular expression in set R E . 4: Create set S 2 : for each trac accident a ∈ A , we add it to S 2 if there is at least one POI p ∈ P of type ν , where haversine_distance ( a , p ) ≤ τ . 5: Output: Return Jaccard ( S 1 , S 2 ) . threshold values. W e propose Algorithm 1 to nd the b est distance threshold. W e use a sample of 100 , 000 accidents as set A (step 1). For step 2, we consider either “intersection” or “junction” , and use the set of relevant regular expressions (see T able 3) in terms of R E . Next we create set S 1 by annotating each trac accident a ∈ A using the regular expression patterns in R E (step 3). Then we annotate each trac accident a ∈ A based on points-of-interests in P , using the distance threshold τ to create S 2 (step 4). Finally , we calculate the Jaccard similarity score using Equation 1 ( step 5): Jaccard ( S 1 , S 2 ) = S 1 ∩ S 2 S 1 ∪ S 2 (1) W e examined the following candidate set to nd the optimal thresh- old value (all values in meters): { 5 , 10 , 15 , 20 , 25 , 30 , 40 , 50 , 75 , 100 , 125 , 150 , 200 , 250 , 300 , 400 , 500 } . W e separately studie d samples from Bing and MapQuest, and employ ed corresponding regular expres- sion patterns for “intersection” and “jucntion” . Figure 2 shows the results for each data source and each annotation type. From Fig- ure 2a, we see that the maximum correlation for interse ctions is obtained for a threshold value of 30 meters. Figures 2b and 2c show that 100 meters is an appropriate distance threshold for annotating a junction. Thresholds for the other available annotations in T able 2 are de- rived from the thresholds for junction and interse ction as describ ed below: • Junction-based threshold. Given the denition of a junction (i.e., a highway ramp, e xit, or entrance), we used the same thresh- old (100 meters) for the following types: amenity and no-exit. • Intersection-based threshold. Given the denition of an inter- section, we used the same threshold (30 meters) for the following annotation types: bump, crossing, give-way , railway , roundabout, station, stop, trac calming, trac signal, and turning loop. Using these thresholds, w e augmented each accident record with points-of-interest. In summar y , 27 . 5% of accident records were aug- mented with at least one of the available POI typ es in T able 2. Fur- ther discussion on annotation results are presented in Section 4.3. 4.2.4 A ugmenting with Period-of-Day . Given the start time of an accident record, we used “TimeAndDate ” API [ 32 ] to label it as day or night . W e assign this label based on four dierent daylight systems, namely Sunrise/Sunset , Civil Twilight , Nautical T wilight , and A stronomical T wilight . Note that these systems ar e dened based on the position of the sun with respe ct to the horizon, and each provide a dierent denition for period-of-day 6 . 4.3 US- Accidents Dataset Using the process described ab ove , we created a country wide dataset of trac accidents, which we name US-A ccidents . US-A ccident con- tains ab out 2 . 25 million cases of trac accidents that took place within the contiguous United States from February 2016 to March 2019. T able 4 shows the important details of US-A ccidents. Also, Figure 3 provides more details on characteristics of the dataset. Fig- ure 3-(a) shows that signicantly more accidents were observed during the weekdays than weekends. Base d on parts (b) and (c) of Figure 3, it can be observed that the hourly distribution during weekdays has two peaks (8am and 5pm), while the weekend distri- bution shows a single peak (1pm). Figur e 3-(d) demonstrates that most of the accidents to ok place near junctions or intersections (crossing, trac signal, and stop). MapQuest tends to report more accidents near intersections, while Bing reported more cases near junctions. This shows the complementary behavior of these APIs, and hence the comprehensiveness of our dataset. Figure 3-(e) de- scribes distribution of road typ es, extracted from the map-matching results (i.e., street names). W e use d street names to identify typ e of the road. Here we note that ab out 32% of accidents happened on or near local roads ( e.g., streets, avenues, and boulevards), and about 40% took place on or near high-speed roads (e.g., highways, interstates, and state roads). W e also note that Bing reported more cases on high-sp eed roads. Finally , the p eriod-of-day data shows that about 73% of accidents happene d after sunrise ( or during the day). T able 4: US-A ccidents: details as of March 2019. T otal Attributes 45 Trac Attributes (10) id, source, TMC [33], sev erity , start_time, end_time, start_point, end_point, distance, and description Address Attributes (8) number , street, side (left/right), city , county , state, zip-code, country W eather Attributes (10) time, temperature, wind_chill, humidity , pressure, visibility , wind_direction, wind_speed, precipitation, and condition (e.g., rain, sno w , etc.) POI Attributes (13) All cases in T able 2 Period-of-Day (4) Sunrise/Sunset, Civil T wilight, Nautical T wilight, and Astronomical T wilight T otal Accidents 2,243,939 # MapQuest Accidents 1,702,565 (75.9%) # Bing Accidents 516,762 (23%) # Reported by Both 24,612 (1.1%) T op States California (485K), T exas (238K), Florida (177K), North Carolina (109K), New Y ork (106K) 6 See https://en.wikipedia.org/wiki/Twilight for mor e details. SIGSP A TIAL ’19, November 5–8, 2019, Chicago, IL, USA 0 30 100 200 300 400 500 Threshold (meters) 0.50 0.52 0.54 0.56 0.58 Jaccard Correlation Intersections (MapQuest) (a) Using MapQuest for Intersection 0 100 200 300 400 500 Threshold (meters) 0.68 0.69 0.70 0.71 0.72 0.73 0.74 Jaccard Correlation Junctions (MapQuest) (b) Using MapQuest for Junction 0 100 200 300 400 500 Threshold (meters) 0.61 0.62 0.63 0.64 Jaccard Correlation Junctions (Bing) (c) Using Bing for Junction Figure 2: Correlation study b etween regular-expression and OSM-based extracted annotations to nd the b est distance threshold values. Mon Tue Wed Thu Fri Sat Sun 5 10 15 Ratio (%) (a) Day of W eek 0 5 10 15 20 0 2 4 6 8 10 Ratio (%) (b) Hour of Day (weekdays) 0 5 10 15 20 0 2 4 6 Ratio (%) (c) Hour of Day ( weekends) Amenity Bump Crossing Giveway Junction Noexit RndAbout Railway Station Stop Traf_Calm Traf_Sign Turn_Loop 0 5 10 15 Ratio (%) Bing MapQuest (d) points-of-interest Distribution MapQuest Bing All 0 10 20 30 40 50 60 Ratio (%) Local-Road High-Speed Other (e) Road-type Distribution 0 10 20 30 40 50 60 70 80 90 >90 Temperature (F) 0 5 10 15 20 Ratio (%) (f ) T emperature Distribution Figure 3: Characteristics of US-A ccidents dataset, in terms of time analysis (a)–( c), points-of-interest-based augmentation dis- tribution analysis (d), map-matching-based road type coverage analysis (e), and temp erature analysis (f ). 5 A CCIDEN T PREDICTION MODEL In this se ction we describe our trac accident prediction framework. W e start with description of feature vector r epresentation, and then present our proposal for real-time trac accident prediction. 5.1 Feature V ector Representation Regarding the problem description in Section 3, we create a feature vector representation for each geographical region r of size 5 km × 5 km during a time inter val t = 15 minut es . Such representation includes the following feature categories: • T rac : a vector of size 7 representing frequency of available trac events (i.e., accident, broken-vehicle , congestion, construc- tion, event, lane-blocked, and ow-incident) during the current 15 minutes interval. W e obtain trac events from [22]. • Time : includes weekday ( a binar y value to show weekday or weekend), hour-of-day (a one-hot vector of size 5 to show belong- ing to a specic time interval as dened in [ 21 ]) 7 , and daylight (an attribute to show period-of-day: day or night). W e obtain daylight data from [32]. 7 These time intervals are [6am – 10am], [10am – 3pm], [3pm – 7pm], [7pm – 10pm], and [10pm – 6am]. • W eather : a vector representing 10 weather attributes including temperature, pressure , humidity , visibility , wind-sp eed, precip- itation amount; and four indicator ags for spe cial events rain, snow , fog, and hail. W e obtain weather data from [34]. • POI : a vector of size 13 to represent fr equency of POIs within r , for amenity , sp eed bump, crossing, giv e-way sign, junction, no- exit sign, railway , roundabout, station, stop sign, trac calming, trac signal, and turning loop. W e obtain POI data from [25]. • Desc2V ec : given a historical set of trac ev ents in region r , we use their natural language description, and by employing the Glo V e pre-trained distributed word vectors [ 27 ], we create a description to vector (Desc2V ec) representation for r . Such repre- sentation is the average r epresentation of words in description of all events which took place within r during a particular time period. Size of this vector is 100 . The choice of Glo V e among the existing models is be cause of its well-known applicability for generic applications and also reasonable dictionary size (i.e., 400K terms). W e obtain trac events from [22]. In this way , we represent r during time interval t by 24 time-variant (i.e., trac, time, and weather) and 113 time-invariant (i.e., POI and Desc2V ec) attributes. In order to predict the label of r during t , we S. Moosavi et al. SIGSP A TIAL ’19, November 5–8, 2019, Chicago, IL, USA use a vector representing the last 8 time intervals (last two hours), including one instance of time-invariant attributes (113 features) and 8 instances of time-variant attributes ( 8 × 24 features) 8 . 5.2 Deep Accident Prediction (DAP) Mo del T o b etter utilize heterogeneous sources of data and p erform real- time trac accident prediction, we propose a deep neural network model, named the Deep Accident Prediction (D AP). This model is shown in Figure 4, and we describe its components as follows. POIvector <13> Trainable Embedding Matrix <|R|x128> Desc2V ec <100> GloV e Model[27] FC(128) Embedding <128> FC(128) FC(128) POIData <|R|x13> LSTM LSTM LSTM LSTM LSTM LSTM LSTM LSTM t 1 :TTWvec<24> t 2 :TTWvec<24> t 8 :TTWvec<24> t 3 :TTWvec<24> ... ... ... <8x24>T ime-variantfeatures FC(512) FC(256) FC(64) Output(2) RecurrentComponent Fully-connectedComponent EmbeddingComponent Description-to-V ectorComponent Points-Of-InterestComponent Figure 4: DAP: A Deep neural-network-based Accident Pre- diction mo del. Here, R is the set of all regions; each C i is a grid-cell (or region); and FC, T T W , and POI stand for fully connected, time-trac-weather , and point-of-interest, respectively . • Recurrent Component : Regarding the denition of our pr edic- tion framework, we use a set of 8 vectors, each of size 24 (i.e., time-variant attributes), which can b e treated as a se quence of such vectors (given their temporal or der); therefore , we may ben- et from the recurrent neural network models. Specically , we use a long-short-term-memory (LSTM) model [ 12 ] as repr esented in Figure 4, which includes tw o recurrent layers, each with 128 LSTM cells. Thus, the output is a vector of size 128. • Embedding Component : Given the index of a grid-cell, this component provides a distributed representation of that cell which encodes essential information in terms of spatial heter o- geneity , trac characteristics, and impact of other environmental stimuli on accident occurrence. This distribute d repr esentation will be derived as we train the entir e pipeline. W e feed this repre- sentation to a feed-for ward layer of size 128 that uses the s i д moid activation function. Note that the embe dding matrix is of size | R | × 128 , where R is the set of all grid-cell regions in input dataset. • Description-to- V e ctor Component : This comp onent utilizes the natural language description of historical trac ev ents in a grid-cell, that is, Desc2V ec data. W e fe ed Desc2V ec of a grid-cell to a feed-forward layer of size 128 using the s i д moid activation function. 8 See Section 3 for formulation of prediction task. • Points-of-Interest Comp onent : This component utilizes points- of-interest data (a vector of size 13), which is a representation of spatial characteristics. W e feed a POI vector to a fe ed-forward layer of size 128 which also uses the s i д moid activation function. • Fully-connected Component : This component utilizes the out- put of above components to make the nal prediction. Her e we have four dense layers of size 512, 256, 64, and 2, respectively . Additionally , to spe ed-up the training process, we use batch nor- malization [ 14 ] after the second and the thir d layer . W e use ReLU as the activation function of the rst three layers, and apply softmax on the output of the last layer . The DAP model utilizes inputs of various types to b etter capture temporal and spatial heterogeneity . Using DAP we are able to extract latent spatio-temporal features in terms of embedding representa- tions, whose impact we show through our real-w orld experiments. W e employed grid-search to perform hyper-parameter tuning to nd the optimal number of recurrent layers (choices of { 1 , 2 , 3 } ); the best type of recurrent cells (choices of { V anil l a - R N N , G RU , LST M } ); size of the embe dding vector for grid-cells (choices of { 50 , 100 , 150 } ); sizes of the dierent fully connected layers ( choices of { 64 , 128 , 256 , 512 } ); and activation function for each fully connected layer (choices of { si д mo i d , Re LU , t anh } ). W e employed the Adam optimizer [ 16 ] with an initial learning rate of 0 . 01 to train the model. 6 EXPERIMEN TS AND RESULTS In this section we rst describe the data which is used for prediction and analysis. Then, we describe baseline models. Next we compare dierent models using a variety of metrics, followed by analyses of data attributes. All implementations are in Python using T ensor- ow [ 11 ], Keras [ 9 ], and scikit-learn [ 26 ] libraries; and experiments were run on nodes at the Ohio Supercomputer Center [4] 9 . 6.1 Data Description T o evaluate our accident prediction framework, we chose six cities: Atlanta , A ustin , Charlotte , Dallas , Houston , and Los A ngeles ; primar- ily so as to achieve diversity in trac and weather conditions, p opu- lation, population density , and urban characteristics (road-network, prevalence of urban versus highway roads, etc.). W e sampled a subset of data (trac, weather , etc.) colle cted from June 2018 to A ugust 2018 (i.e., 12 weeks) for each city . W e chose this time pe- riod to prevent any noises as result of seasonality in weather and trac patterns. T o create Desc2V ec for each grid cell region, we used trac events which took place within that r egion from June 2017 to May 2018 (i.e., a one-year time frame), where data obtaine d from the Large-Scale Trac and W eather Events dataset [ 22 ]. From the trac, time, weather , POI, and Desc2V e c data for each grid cell, and by scanning through the data with a window of size 2 hours and 15 minutes and a shift of 15 minutes ( see Figure 5), we built a sample entry using data of the rst two hours (see Section 5.1). Each entry is represented by 113 time-invariant and 8 × 24 time-variant features. The last 15 minutes is used to label the sample entry as an accident or non-accident case. Since accidents are rare and because our dataset is sparse 10 , we performed negative sampling to balance the frequency of samples between accident and non-accident classes. Sp ecically , we uni- formly sampled from the non-accident class with a probability of 2 . 0% . T able 5 summarizes the numb er of samples for each class (Acc 9 Code and sample data is available at https://github.com/mhsamavatian/D AP. 10 Our data is result of streaming data with possibility of missing records. SIGSP A TIAL ’19, November 5–8, 2019, Chicago, IL, USA T ime 2 Hours 15 m T o create representation for sample entry T o label sample entry 2 Hours 15 m Previous sample entry Current sample entry Figure 5: Creating a Sample Entry (see Section 6.1). versus Non- Acc), for each city , after negative sampling. A s can be seen, the maximum ratio of accident to non-accident is about 27% for Los A ngeles (which is still lower than the ratio which is employed by previous studies; e.g., Y uan et al. [ 37 ] employed 33% ). Table 5 also shows the number of all other trac events (except accidents) which took place during the selecte d 12 weeks time frame. W e use data from the rst 10 weeks to train and data from the last two weeks as the test set, for each city . T able 5: Distribution of accident (Acc) and non-accident (Non-A cc) classes, and trac events (except accidents). City #Acc #Non- Acc Acc/Non- Acc #Trac Ev ents Atlanta (GA) 2,630 11,970 22% 24,396 A ustin (TX) 4,274 23,280 18% 16,313 Charlotte (NC) 5,295 20,192 26% 14,030 Dallas (TX) 3,363 28,537 12% 28,098 Houston (TX) 5,859 43,762 13% 40,735 Los Angeles (CA) 7,974 29,020 27% 97,090 6.2 Baseline Models W e chose logistic r egression (LR), gradient boosting classier (GBC), and a Deep Neural Network (DNN) model as baselines. - Logistic Regression (LR) : A signicant number of previous studies leveraged regr ession-based models to perform accident prediction [ 5 , 7 , 8 ]. Therefore, w e employ logistic regression as a reasonable baseline to perform our binary classication task. - Gradient Boosting Classier (GBC) : GBC is a p opular general- purpose classication model, with useful boosting characteristics and a suitable learning process. In practice , GBC usually provides superior results for binary or multi-class classication tasks, when compared to the other models such as Random Forest or Support V ector Machine; our preliminary experiments also conrmed this. - Deep Neural Network (DNN) : This is a four-layer feed-for ward neural network, with three hidden layers of size 512, 256, and 64, respe ctively . Re LU was use d as the activation function of the hidden layers, and softmax was applied on the output of the last layer . T o speed-up the training process, we use d batch normalization [ 14 ] after the second and third hidden layers. W e employed the Adam optimizer [ 16 ] with an initial learning rate of 0 . 01 to train this model. As input, the baseline models utilize vectors of size 305, that in- cludes 113 time-invariant and 192 time-variant attributes (see Sec- tion 5.1). The output is the prediction probability for “accident” and “non-accident” classes. Using grid-search over heuristic choices of parameters, we found the best parameter setting for each model. For LR, we p erformed the grid search over choices of regular- izations: { L 1 , L 2 } , maximum iterations: { 100 , 100 , 10000 , 100000 } , and solvers: { new t on - c д , l b f д s , s a д , l i b l i near } . For GBC, the grid search was performed over choices of learning rates: { 0 . 01 , 0 . 05 , 0 . 1 , 0 . 15 } , numb er of estimators: { 100 , 200 , 300 , 400 } , and maximum depth: { 3 , 4 , 5 , 6 } . For DNN, the grid search was performed over choices of initial learning rates: { 0 . 001 , 0 . 01 , 0 . 05 , 0 . 1 } , activation functions: { si д mo i d , Re L U } , number of hidden layers: { 2 , 3 , 4 } , and size of hidden layers: { 128 , 256 , 512 } . 6.3 Exploring Models In this section we evaluate dier ent models based on their ability to predict trac accidents. That is, we compare dierent models based on F 1 - sc or e (dened by Equation 2), r eported for each class separately , as well as the weighted average F 1 - sc or e (the relative frequency of each class is used as its weight). P r e c i s i o n = true positive true positive + false positive R e c a l l = true positive true positive + false negative F 1 - S c o r e = 2 × Precision × Recall Precision + Recall (2) W e used logistic regression (LR), gradient boosting classier (GBC), and a deep neural network (DNN) model as baselines. W e report the result of our DAP model, as well as a variation of DAP without the embedding component (DAP-NoEmbed). W e ran each model three times, and reported the average results. As mentioned before, we used grid search to nd the optimal parameters. For LR and GBC, we performed this for each city , but for the neural- network-based models we employed grid search for one city and used the best architecture setting for the other cities. DNN, DAP , and DAP-NoEmbed were trained for 60 epochs, and using early stopping based on the validation set (i.e., 10% of the training set), we used the best mo del for prediction on the test set. It is worth noting that each model is separately trained and tested for each city and we do not train a single model for all cities. T able 6 presents the results of this experiment. In this table we report F 1 - sc or e for class of accident ( Acc), non-accident (Non- Acc), and the w eighted average (W -A vg). W e note that the class of accident is usually more important, while we seek to provide reasonable r esults for the other class (non-accident) as well. LR and GBC usually provide better results for non-accident class, and given the frequency of this class, their weighted average score is also reasonably high. Ho wever , when considering the accident class, we note that neural-network- based models pro vide more satisfactory results, where our proposed D AP model pro vides superior results for 5 of the 6 cities (DNN provided the best result for Houston). Considering the weighted average on F 1 - sc or e , we note that DAP provides better r esults when compared to the other neural-network-based models. T o b etter compare dierent models, Figure 6 shows the aver- age results of dierent mo dels across all six cities, by separately reporting F 1 - sc or e for class of accident and non-accident, and the weighted average F 1 - sc or e . As one can see, our propose d mo del provides a signicant improvement for class of accidents, while LR and GBC provide slightly b etter results for the non-accident class. When considering the weighted av erage, w e observe LR, D AP and GBC slightly outp erform the other mo dels. Once again note that the “accident class” is the one of most importance, given that accidents are rare ev ents. Hence we should pay more attention to false negatives (i.e., predicting an accident as a non-accident) rather than false positives (i.e., predicting a non-accident as an accident). S. Moosavi et al. SIGSP A TIAL ’19, November 5–8, 2019, Chicago, IL, USA T able 6: Accident prediction results based on F1-score for class of accidents (Acc), non-accidents (Non-A cc), and weighted average (W -avg). P P P P P P City Model LR GBC DNN DAP-NoEmbed DAP Acc Non-A cc W - A vg Acc Non-A cc W - A vg Acc Non- Acc W -A vg Acc Non-A cc W - A vg Acc Non- Acc W -A vg Atlanta 0.54 0.91 0.83 0.57 0.91 0.84 0.62 0.89 0.83 0.62 0.91 0.84 0.65 0.89 0.84 A ustin 0.58 0.93 0.87 0.61 0.93 0.87 0.62 0.92 0.87 0.62 0.93 0.87 0.64 0.91 0.87 Charlotte 0.56 0.91 0.83 0.60 0.91 0.84 0.61 0.87 0.82 0.61 0.87 0.81 0.63 0.87 0.82 Dallas 0.30 0.94 0.87 0.32 0.94 0.87 0.36 0.94 0.87 0.43 0.88 0.83 0.50 0.93 0.88 Houston 0.49 0.94 0.88 0.51 0.94 0.88 0.59 0.93 0.88 0.58 0.92 0.88 0.58 0.93 0.88 Los Angeles 0.41 0.88 0.78 0.45 0.88 0.79 0.53 0.81 0.75 0.53 0.77 0.72 0.56 0.84 0.78 F1 Accident 0.45 0.48 0.50 0.53 0.55 0.58 0.60 F1 Non-Accident 0.75 0.80 0.85 0.90 LR GBC DNN DAP No-Embed DAP F1 W-Average 0.70 0.73 0.75 0.78 0.80 0.83 0.85 Figure 6: Comparing dierent models based on average F 1 - s c o r e (across all six cities) for class of accident, non-accident, and weighted average. While we cannot directly compare our pr oposal with the state- of-the-art models such as [ 8 , 18 , 37 ] (due to inconsistency between input typ es, unavailability of input data used by those mo dels, incon- sistency b etween reported metrics, etc.), we note that their reported results based on F 1 - sc or e show similar trend and values (see [ 37 ] for example). Further , we believe that separately reporting predic- tion results for dierent classes (i.e., accident versus non-accident) provides a better context to compare dier ent solutions. 6.4 Exploring Features Our next experiment was to examine the importance of dierent feature categories for the task of accident prediction. For this explo- ration, we designed two testing scenarios as follows: • Only One : This scenario means we only use one category of features (trac, POI, time, etc.) to perform accident prediction. • All But One : This scenario means to remove only one category of features and perform the prediction task. For this experiment, we only report the result of GBC and DAP- NoEmbed, and omit the results of other models for the interest of space. Also, b ecause of having the trainable embedding component, we choose DAP-NoEmbed ov er D AP to exclude the eect of the em- bedding component when studying the impact of other features 11 . Figure 7 demonstrates the results, where we r eport weighted aver- age F 1 - sc or e , and F 1 - sc or e on accident class. Based on parts ( a), (b), (e), and (f ), we generally observe weather (WE) and time (TM) are the least important categories of attributes to b e used alone 12 . Ho w- ever , parts (c), (d), ( g), and (h) reveal that removing time attributes would signicantly hurt the prediction performance. Based on these gures, when we remove Desc2V ec, POI, and Trac attributes (i.e., 11 Since DAP utilizes an embedding component, we cannot fairly study the impact of several categories of features (in isolation), such as trac, weather , and points-of- interest; given the correlation between these categories and the latent r epresentation which will be derived for each region. 12 Note that we could not use categories D2V and POI for DAP-NoEmbed, regar ding the architecture of this model. D+P+TR), the prediction p erformance drops signicantly , which shows the importance of these categories. W e may also note that these categories might have correlation, where removing one of them does not signicantly change the prediction results (see (c) and (d)). Ther efore, when we r emove all three, then w e observe a signicant drop. It is worth noting that among the POI types, we found “ crossing” , “junction” , “stop ” , and “trac signal” to be more eective than the others for the task of accident prediction. 7 CONCLUSION AND F U T URE W ORK Trac accidents are a major public safety issue , with much research devoted to analysis and prediction of these rare events. However , most of the studies suer from using small-scale datasets, relying on extensive data that is not easily accessible to other researchers, and being not applicable for real-time purposes. T o address these chal- lenges, we introduced a new framework for real-time trac accident prediction based on easy-to-obtain, but sparse data. Our prediction model incorporated several neural network based comp onents that used a variety of data attributes such as trac e vents, weather data, points-of-interest, and time information. W e also created a publicly available countrywide trac accident dataset, named US-A ccidents, through a comprehensive process of data collection, cleansing, and augmentation. Using the data from US- Accidents, w e compared our work against sev eral neural-netw ork-based and traditional machine leaning models, and showed its superiority by means of extensive experiments. Further , we studied the impact of dierent categories of data attributes for trac accident prediction, and found time, trac events, and points-of-interest as having signicant value. In the future, we plan to incorp orate other publicly available sources of data (e .g., demographic information and annual trac r eports) for the task of real-time trac accident prediction. A CKNO WLEDGMEN TS This w ork is supported by a grant from the NSF (EAR-1520870), one from the Nationwide Mutual Insurance ( GRT00053368), and another from the Ohio Supercomputer Center (P AS0536). Any ndings and opinions are those of the authors. REFERENCES [1] Joaquín Abellán, Griselda López, and Juan De OñA. 2013. Analysis of trac accident severity using decision rules via decision trees. Expert Systems with A pplications 40, 15 (2013), 6047–6054. [2] Bing Map Trac API. 2019. https://ww w .bingmapsportal.com/. Accessed: 2019- 09-1. [3] Ciro Caliendo, Maurizio Guida, and Alessandra Parisi. 2007. A crash-prediction model for multilane roads. Accident Analysis & Prevention 39, 4 (2007), 657–670. [4] Ohio Supercomputer Center . 1987. Ohio Sup ercomputer Center . http://osc.edu/ ark:/19495/f5s1ph73 SIGSP A TIAL ’19, November 5–8, 2019, Chicago, IL, USA All D2V POI TR WE TM Category used (a) 0.70 0.75 0.80 0.85 G B C F1 Weighted Avg Atlanta LosAngeles Austin Houston Charlotte Dallas All D2V POI TR WE TM Category used (b) 0.0 0.1 0.2 0.3 0.4 0.5 0.6 F1 Accident None D2V POI TR WE TM D+P+TR Category removed (c) 0.70 0.75 0.80 0.85 F1 Weighted Avg None D2V POI TR WE TM D+P+TR Category removed (d) 0.0 0.1 0.2 0.3 0.4 0.5 0.6 F1 Accident All TR WE TM Category used (e) 0.3 0.4 0.5 0.6 0.7 0.8 0.9 D A P N o E m b e d F1 Weighted Avg All TR WE TM Category used (f) 0.0 0.1 0.2 0.3 0.4 0.5 0.6 F1 Accident None D2V POI TR WE TM D+P+TR Category removed (g) 0.60 0.65 0.70 0.75 0.80 0.85 F1 Weighted Avg None D2V POI TR WE TM D+P+TR Category removed (h) 0.0 0.1 0.2 0.3 0.4 0.5 0.6 F1 Accident Figure 7: Prediction results using only one category (a, b, e, and f ), and all but one category (c, d, g, and h). Here D2V , TR, WE, and TM stand for Desc2V ec, trac, weather , and time, respectively . Also, “D+P+TR” means removing Desc2V e c, POI, and trac from input features. [5] Li- Y en Chang. 2005. Analysis of freeway accident frequencies: negative binomial regression versus articial neural network. Safety science 43, 8 (2005), 541–557. [6] Li- Y en Chang and W en-Chieh Chen. 2005. Data mining of tree-based models to analyze freeway accident frequency. Journal of safety research 36, 4 (2005), 365–375. [7] Chao Chen, Xiaoliang Fan, Chuanpan Zheng, Lujing Xiao, Ming Cheng, and Cheng W ang. 2018. SDCAE: Stack Denoising Convolutional Autoencoder Model for Accident Risk Prediction Via Trac Big Data. In 2018 Sixth International Conference on Advanced Cloud and Big Data (CBD) . IEEE, 328–333. [8] Quanjun Chen, Xuan Song, Harutoshi Y amada, and Ryosuke Shibasaki. 2016. Learning deep r epresentation from big and heterogeneous data for trac accident inference. In Thirtieth AAAI Conference on A rticial Intelligence . AAAI, Palo Alto, CA, USA. [9] François Chollet et al. 2015. Keras. https://github.com/fchollet/keras. [10] Daniel Eisenberg. 2004. The mixed eects of precipitation on trac crashes. Accident analysis & prevention 36, 4 (2004), 637–647. [11] Abadi et al. 2015. T ensorFlow: Large-Scale Machine Learning on Heterogeneous Systems. https://w ww .tensorow .org/ Software available from tensorow .org. [12] Sepp Hochreiter and Jürgen Schmidhuber . 1997. Long short-term memory . Neural computation 9, 8 (1997), 1735–1780. [13] Chukwutoo C Ihueze and Uchendu O Onwurah. 2018. Road trac accidents prediction modelling: An analysis of Anambra State, Nigeria. Accident Analysis & Prevention 112 (2018), 21–29. [14] Sergey Ioe and Christian Szegedy . 2015. Batch normalization: Accelerating deep network training by reducing internal covariate shift. arXiv preprint arXiv:1502.03167 (2015). [15] David Jaroszweski and T om McNamara. 2014. The inuence of rainfall on road accidents in urban areas: A weather radar approach. Travel b ehaviour and society 1, 1 (2014), 15–21. [16] Diederik P Kingma and Jimmy Ba. 2014. Adam: A method for stochastic opti- mization. arXiv preprint arXiv:1412.6980 (2014). [17] Sachin Kumar and Durga T oshniwal. 2015. A data mining framework to analyze road accident data. Journal of Big Data 2, 1 (2015), 26. [18] Lei Lin, Qian W ang, and Adel W Sadek. 2015. A novel variable selection method based on frequent pattern tree for real-time trac accident risk prediction. Trans- portation Research Part C: Emerging T echnologies 55 (2015), 444–459. [19] Fred L Mannering, V enky Shankar , and Chandra R Bhat. 2016. Unobserved heterogeneity and the statistical analysis of highway accident data. A nalytic methods in accident research 11 (2016), 1–16. [20] MapQuest T rac API. 2019. https://ww w .mapquest.com/. Accessed: 2019-09-1. [21] Sobhan Moosavi, Behrooz Omidvar- T ehrani, R Bruce Craig, Arnab Nandi, and Rajiv Ramnath. 2017. Characterizing driving context from driver behavior. In Proceedings of the 25th ACM SIGSP A TIAL International Conference on Advances in Geographic Information Systems . ACM, New Y ork, NY, USA, 46:1–46:4. https: //doi.org/10.1145/3139958.3139992 [22] Sobhan Moosavi, Mohammad Hossein Samavatian, Arnab Nandi, Srinivasan Parthasarathy , and Rajiv Ramnath. 2019. Short and Long-term Pattern Discov- ery Over Large-Scale Geo-Spatiotemporal Data. In Procee dings of the 25th ACM SIGKDD International Conference on Knowledge Discovery & Data Mining . ACM, New Y ork, N Y , USA, 2905–2913. https://doi.org/10.1145/3292500.3330755 [23] Alameen Najjar, ShunâĂŹichi Kaneko, and Y oshikazu Miyanaga. 2017. Combining satellite imager y and open data to map road safety. In Thirty-First AAAI Conference on A rticial Intelligence . AAAI, Palo Alto, CA, USA. [24] Nominatim Tool. 2019. https://wiki.openstreetmap.org/wiki/Nominatim. Ac- cessed: 2019-09-1. [25] Open Street Map (OSM). 2019. https://www.openstreetmap.org/. Accessed: 2019-09-1. [26] F. Pedregosa, G. V aroquaux, A. Gramfort, V . Michel, B. Thirion, O. Grisel, M. Blondel, P. Prettenhofer , R. W eiss, V . Dubourg, J. V anderplas, A. Passos, D . Cour- napeau, M. Brucher , M. Perrot, and E. Duchesnay . 2011. Scikit-learn: Machine Learning in Python. Journal of Machine Learning Research 12 (2011), 2825–2830. [27] Jerey Pennington, Richard Socher , and Christopher Manning. 2014. Glove: Global vectors for word repr esentation. In Proceedings of the 2014 conference on empirical methods in natural language processing (EMNLP) . 1532–1543. [28] W orld Health publisher . 2015. Global status report on road safety 2015 . W orld Health publisher . [29] Honglei Ren, Y ou Song, Jingwen W ang, Y ucheng Hu, and Jinzhi Lei. 2018. A Deep Learning Approach to the Citywide Trac Accident Risk Prediction. In 2018 21st International Conference on Intelligent Transportation Systems (I TSC) . IEEE, 3346–3351. [30] JD T amerius, X Zhou, R Mantilla, and T Greeneld-Huitt. 2016. Precipitation ef- fects on motor vehicle crashes vary by space, time , and environmental conditions. W eather , Climate, and Society 8, 4 (2016), 399–407. [31] Athanasios Theolatos. 2017. Incorporating real-time trac and weather data to explore road accident likelihood and severity in urban arterials. Journal of safety research 61 (2017), 9–21. [32] Time And Date website. 2019. https://ww w .timeanddate.com/. Accessed: 2019- 09-1. [33] Trac Message Channel (TMC) Code. 2019. https://wiki.op enstreetmap.org/wiki/ TMC/Event_Code_List. Accessed: 2019-09-1. [34] W eather Underground. 2014-2019. https://ww w .wunderground.com/. A ccessed: 2019-09-1. [35] Lu W enqi, Luo Dongyu, and Yan Menghua. 2017. A model of trac accident prediction based on convolutional neural network. In 2017 2nd IEEE International Conference on Intelligent Transportation Engineering (ICI TE) . IEEE, 198–202. [36] Zhuoning Yuan, Xun Zhou, and Tianbao Y ang. 2018. Hetero-ConvLSTM: A deep learning approach to trac accident prediction on heter ogeneous spatio- temporal data. In Proceedings of the 24th ACM SIGKDD International Conference on Knowledge Discovery & Data Mining . A CM, New Y ork, NY, USA, 984–992. [37] Zhuoning Y uan, Xun Zhou, Tianbao Y ang, James Tamerius, and Ricar do Mantilla. 2017. Predicting trac accidents through heterogeneous urban data: A case study . In Proceedings of the 6th International W orkshop on Urban Computing ( UrbComp 2017), Halifax, NS, Canada , V ol. 14. ACM, New Y ork, N Y , USA.
Original Paper
Loading high-quality paper...
Comments & Academic Discussion
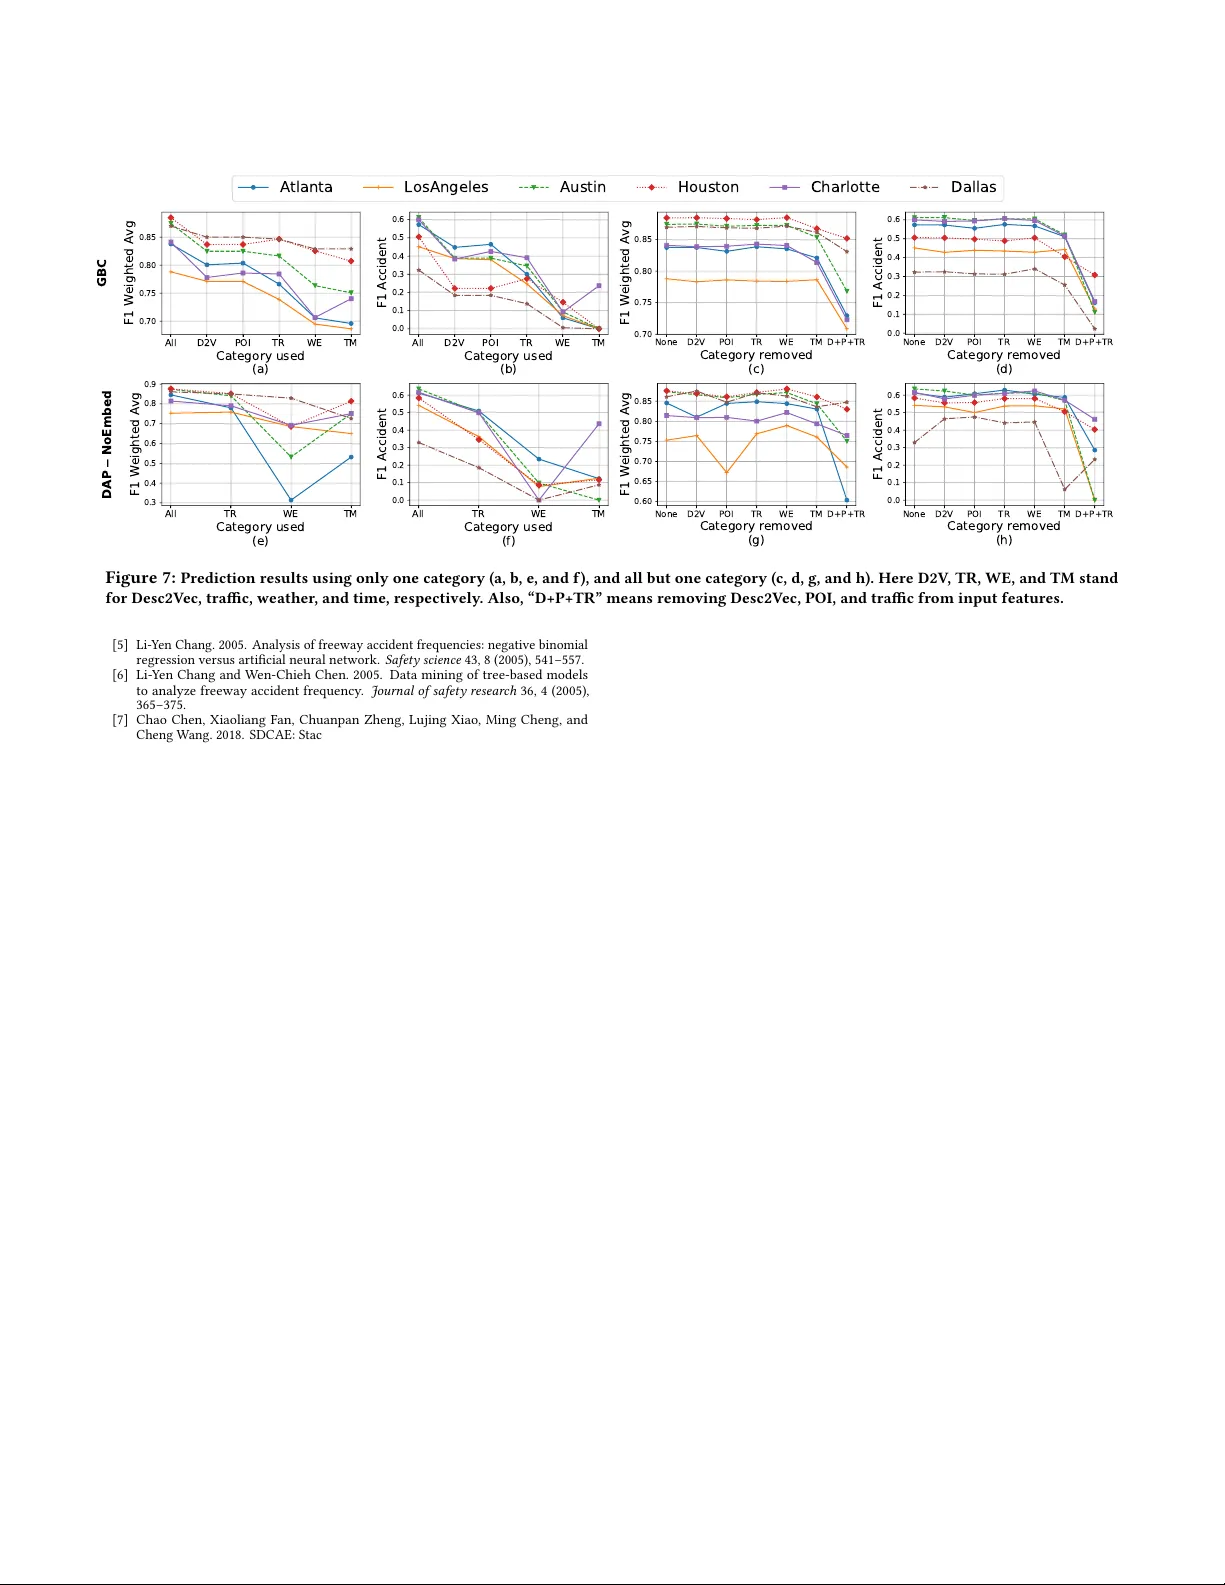
Loading comments...
Leave a Comment