Multivariate Big Data Analysis for Intrusion Detection: 5 steps from the haystack to the needle
The research literature on cybersecurity incident detection & response is very rich in automatic detection methodologies, in particular those based on the anomaly detection paradigm. However, very little attention has been devoted to the diagnosis ab…
Authors: Jose Camacho, Jose Manuel Garcia-Gimenez, Noemi Marta Fuentes-Garcia
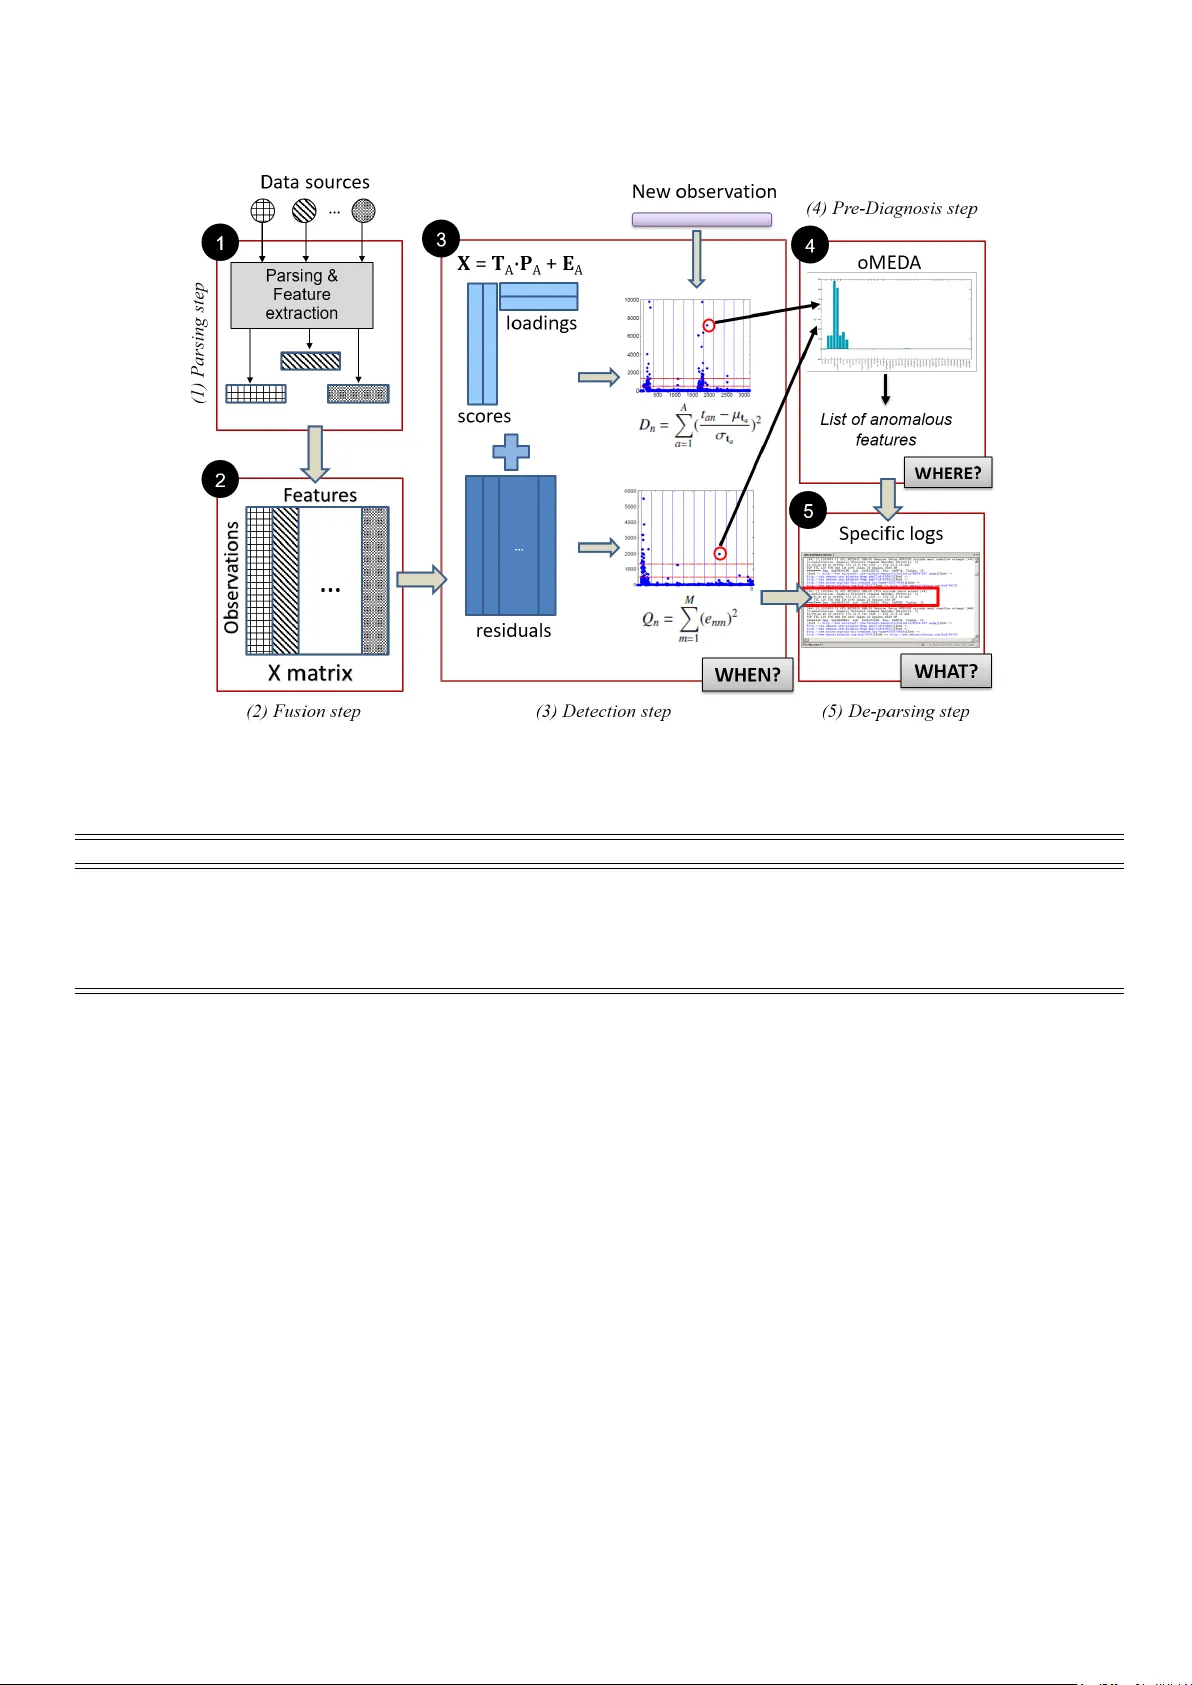
Multi v ariate Big Data Analysis for Intrusion Detection: 5 steps from the haystack to the needle Jos ´ e Camacho , Jose Manuel Garc ´ ıa-Gim ´ enez , Noem ´ ı Marta Fuentes-Garc ´ ıa , Gabriel Maci ´ a-Fern ´ andez Department of Signal Theory , T elematics and Communications School of Computer Science and T elecommunications - CITIC University of Granada (Spain) Abstract The research literature on cybersecurity incident detection & response is v ery rich in automatic detection methodologies, in par- ticular those based on the anomaly detection paradigm. Howe v er , very little attention has been de voted to the diagnosis ability of the methods, aimed to provide useful information on the causes of a given detected anomaly . This information is of utmost impor- tance for the security team to reduce the time from detection to response. In this paper , we present Multiv ariate Big Data Analysis (MBD A), a complete intrusion detection approach based on 5 steps to e ff ectiv ely handle massi v e amounts of disparate data sources. The approach has been designed to deal with the main characteristics of Big Data, that is, the high volume, velocity and variety . The core of the approach is the Multi v ariate Statistical Netw ork Monitoring (MSNM) technique proposed in a recent paper . Unlike in state of the art machine learning methodologies applied to the intrusion detection problem, when an anomaly is identified in MBD A the output of the system includes the detail of the logs of raw information associated to this anomaly , so that the security team can use this information to elucidate its root causes. MBDA is based in two open software packages av ailable in Github: the MED A T oolbox and the FCParser . W e illustrate our approach with two case studies. The first one demonstrates the application of MBD A to semistructured sources of information, using the data from the V AST 2012 mini challenge 2. This complete case study is supplied in a virtual machine av ailable for do wnload. In the second case study we sho w the Big Data capabilities of the approach in data collected from a real network with labeled attacks. K e ywor ds: Multiv ariate Statistical Network Monitoring, Anomaly Detection, Intrusion Detection, Diagnosis, Big Data 1. Introduction Intrusion Detection has become a priority for many organi- zations, as a result of data becoming a fundamental asset for creating value on modern services. According to the VERI- ZON annual Data Breach In vestig ation Report (DBIR) [1], in 2017 several tens of thousands of attacks targeted priv ate and public corporations. The 94% of these attacks had an economic motiv ation, including industrial espionage. They show a profile of high sophistication, with organized teams of high technical specialization that are sometimes referred to as Adv anced Per- sistent Threats (APTs). An alarming factor of the DBIR report is the ratio between mean time of compromise and mean time of detection. While the former is in the order of minutes, the latter is in the order of weeks or even months. This means the attacker has plenty of time for privilege escalation and any other neces- sary malicious activity to access and ex-filtrate protected data. On av erage, stolen personal registers are in the tens of millions per attack, with a tremendous impact on the corporate image. T o mention some notorious e xamples, the data breach of 412M personal files including email accounts associated to the adult dating service Friend Finder Network and Penthouse.com and ∗ Corresponding author: J. Camacho (email: josecamacho@ugr .es) the data breach of more than a billion personal accounts from the email operator Riv er City Media, used in a massive SP AM campaign [2]. This situation has boosted the market of intrusion detection, in particular of the so-called Security Information and Event Management (SIEM) systems [3]. A SIEM is aimed at aggre- gating and analyzing data coming from div erse sensor devices deployed through the netw ork, with the ultimate goal of detect- ing, triaging and v alidating security incidents. In a recent report [4], Gartner estimates in 90 billion dollars the cost associated to cybersecurity incidents in 2017, which implies an increment of 7 . 6% with respect to the preceding year . The report foresees a change of tendency in cybersec, with a growing e ff ort in de- tection and response in comparison to prev ention means. Fol- lowing this tendency , the corporations are de voting more eco- nomic and human resources to incident detection, creating the so-called Cyber Incident Response T eams (CIR Ts). A CIR T de- votes a large proportion of its resources to analyze potential in- cidents. A main limitation for that is the shortage of specialized professionals. Combining this shortage with the proliferation of information leakage attacks, there is a clear need of e ffi cient tools and mechanisms to aid in the detection, triaging and anal- ysis of incidents, in order to make CIR Ts more e ff ectiv e in the Pr eprint submitted to Computers & Security J uly 1, 2019 arms race against APTs. Multiv ariate Analysis has been recognized as an outstanding approach for anomaly detection in se veral domains, including industrial monitoring [5] and networking [6]. In the field of industrial processing, in particular in the chemical and biotech- nological industries, the state-of-the-art multiv ariate approach for anomaly detection is named Multi variate Statistical Process Control (MSPC), and has been developed for more than three decades. In a previous work [7], we introduced a methodology named Multi variate Statistical Network Monitoring (MSNM), which is an extension of MSPC to the cybersecurity domain. W e also extended the multiv ariate methodology to combine tra ffi c data with sources of security data, like IDS or fire wall logs, so as to e ffi ciently integrate disparate sources in the inci- dent detection. This paper presents the Multi variate Big Data Analysis (MBD A), a complete intrusion detection and analysis approach based on 5 steps to e ff ectiv ely handle tons of disparate data sources in c ybersecurity . The core of the approach is the MSNM technique. MBD A is a Big Data extension of MSNM in which, when an anomaly is identified, the output includes the logs of raw information associated with it. These, in turn, can be presented to the CIR T , so as to elucidate the root causes for the anomaly . This diagnosis ability of MBD A is a main advan- tage ov er other machine learning methodologies. MBD A is based in two open software pack- ages av ailable in Github: the MED A T oolbox [8] (https: // github .com / josecamachop / MED A-T oolbox) and the FCParser (https: // github.com / josecamachop / FCP arser), the latter presented in this paper for the first time. The FCParser is a python tool for the parsing of both structured and unstructured logs. With the MED A T oolbox, multi variate modeling and data visualization of the Big Data stream are possible. Combining these two software packages in the 5 steps of MBD A, we sho w that we are capable of accurately identifying the original raw information related to a detected anomaly in the Big Data. That is, we find the needle in the haystack. This makes MBDA a perfect tool to div e into the ov erwhelming v olumes of disparate sources of information in the cybersecurity conte xt. The rest of the paper is organized as follows. Section 2 pro- vides a brief re vision of principal works on PCA-based anomaly detection in networking and extensions to Big Data. Section 3 presents the fundamentals of the approach of this paper . Sec- tions 4 and 5 illustrate the MBD A approach in two case studies: the V AST 2012 mini challenge 2 and data collected from a real network with labeled attacks. Section 6 summarizes the main conclusions of the work. 2. Related W ork Among sev eral other anomaly detection paradigms, statisti- cal solutions hav e been widely adopted in the literature [9]. In particular , the use of multiv ariate approaches such as PCA were proposed more than a decade ago [10]. One of the main adv an- tages of PCA, similar to other one-class classifiers like OCSVM [11], is its unsupervised nature, which does not require –and is not limited by– an a-priori specification of potential anomalies in the system. This means that PCA is useful to detect both known and new types of anomalies, something mandatory in real world network anomaly detection. The most referred work for PCA anomaly detection is that of Lakhina et al. [12]. Ho wev er , a number of flaws are pointed out for this approach [13], mainly as a result of its di ff erences with the more developed MSPC theory [7]. Se veral modifica- tions of the original approach hav e been proposed with the aim of solving some of those issues, e.g . [14 – 16]. More recent research on multi variate analysis for security-related anomaly detection has opted for combining PCA with other detection schemes. Thus, Aiello et al. [17] combine PCA with mutual information for profiling DNS tunneling attacks. Fernandes et al. [6] combine PCA with a modified version of dynamic time warping for network anomaly detection. They also propose an alternativ e approach based on ant colony optimization. Jiang et al. [18] apply PCA over a wav elet transform of the network tra ffi c for network-wide anomaly detection. Chen et al. [19] use a similar approach with multi-scale PCA. Xia et al. pro- pose an algorithm based in the Singular V alue Decomposition (SVD) which is combined with other techniques for anomaly detection by considering the cyclostationarity of the data [20]. Despite such a big e ff ort in the field, most of the propos- als still share part of the problems reported related to [12]. This motiv ated us to dev elop the MSNM methodology , which was introduced in 2015 to solve these open problems [7]. The MSNM methodology allo ws to combine tra ffi c data with other security data sources [21], demonstrating detection capabilities comparable to state-of-the-art machine learning methodologies with the additional adv antage of providing diagnosis support [22]. On the other hand, the huge amount of machine-generated data in the network has fostered the application of Big Data techniques for netw ork anomaly detection [23]. A general trend is to apply traditional anomaly detection on top of Big Data tools like Hadoop [24][25], Apache Spark [26][27] or tools de- riv ed from them [28]. Most works are based on clustering and classification techniques [29][30][31][32][33][34] or use host mining [35][31][36] to distinguish between normal and anoma- lous patterns. A combination of clustering with k-means and host mining is proposed in [37]. The k-means algorithm is also used in other approaches, such as [38][39]. Entropy calcula- tion to identify disturbances in the data is used in [40][41][42]. Finally , PCA is used in [35] for host mining together with clas- sification trees. Most of previous solutions are suited to handle the high volume in Big Data. Howe ver , other well-kno wn Big Data problems are the velocity , the veracity and the v ariety , that is, the high incom- ing pace of data, the lev el of trust in data and the requirement to combine disparate data sources, respectiv ely . The veloc- ity is a relev ant problem because most of the approaches need to re-build the models on-line from new incoming data. This problem is dealt in [43] by proposing an Iterati ve-T unning Sup- port V ector Machine (SVM), which makes the training of the model faster than the regular SVM. V elocity , volume and vari- ety are addressed in [34], where machine learning techniques are applied o ver a single v ariable to obtain signatures of kno wn 2 anomalies. The v elocity and volume are handled by cloud com- puting over an Apache Spark cluster . The entropy of flows in network tra ffi c is measured for anomaly detection in [41]. A Least-Mean-Square adaptive filter is applied to obtain the cor- relation between the entropies and make better predictions. The velocity and volume are dealt with using an Apache Storm clus- ter . The veracity is faced up in [44], proposing an entropy-based anomaly detection system to identify attacks over the veracity of the system, such as data injection attacks. MBD A builds on previous works on MSNM and extends the latter for its application to Big Data. On the one hand, the Big Data functionality in the MED A T oolbox [8, 45] is employed to issue analytics on the Big Data stream used to calibrate the anomaly detection model. This makes it pos- sible to detect and isolate outliers that may a ff ect the model performance. On the other hand, a ne w tool named the FC- Parser (https: // github .com / josecamachop / FCParser) has been dev eloped to w ork in perfect association with MSNM. This tool transforms raw data into analysis features and the other way round, so that we can extend the MSNM diagnosis to the orig- inal Big Data stream. This way , security professionals can use MBD A without any kno wledge of multiv ariate analysis, some- thing which was not possible with MSNM. This enhancement is expected to be very e ff ecti ve in reducing the time from detec- tion to response in the face of cybersecurity incidents. 3. Multivariate Big Data Analysis: the 5 Steps The MBD A approach consists of 5 steps: 1) Parsing: the ra w data coming from structured and unstruc- tured sources are transformed into quantitativ e features. 2) Fusion: the features of the di ff erent sources of data are combined into a single data stream. 3) Detection: anomalies are identified in time. 4) Pre-diagnosis: the features associated with an anomaly are found. 5) De-parsing: Using both detection and pre-diagnosis infor- mation, the original raw data records related to the anoma- lies are identified and presented to the analyst. Notice the first three steps are equiv alent to what it is com- monly done in other machine learning methodologies. How- ev er , steps 4 and 5, which perform the diagnosis of the anoma- lies, are a main advantage of the present proposal. These steps are possible thanks to the white-box, exploratory characteris- tics of Principal Component Analysis (PCA) as the core of the MSNM approach. PCA is a linear model and as such it is easy to interpret in terms of the connection between anomalies and features, something much more complicated or not e ven pos- sible in the non-linear machine learning variants, like for in- stance deep learning. The fi ve steps, discussed in detail in what follows, are illustrated in Figure 1 and summarized in T able 1. Note all these steps can be fully automatized. 3.1. P arsing The information captured from a network is usually pre- sented in the form of system logs or network traces, and cannot be directly used to feed a typical tool for anomaly detection. Therefore, some sort of feature engineering and parsing needs to be done in order to generate quantitativ e features that can be used for data modeling. In the context of anomaly detection with PCA, Lakhina et al. [12] proposed the use of counters obtained from Netflow records. In [21], we generalized this definition to consider sev eral sources of data, proposing the feature-as-a-counter ap- proach: essentially the combination of data counts with multi- variate analysis. Each feature contains the number of times a giv en ev ent takes place during a gi ven time window . Examples of suitable features are the count of a given word in a log or the number of tra ffi c flo ws with gi ven destination port in a Net- flow file. This general definition makes it possible to integrate, in a suitable way , most sources of information into a model for anomaly detection. This parsing approach is also used for anomaly detection in X-pack [46], the proprietary counterpart of the Elastic Stack, widely used for the analysis of Big Data streams. The parsing step is performed with the FCParser . For each feature we are interested on, a corresponding regular expression is defined in a configuration file. T o obtain the specific v alues of the features in a given sampling interval, the corresponding regular expressions are run ag ainst the ra w data of that interv al, and the parser records the number of matches. The selection of the specific features included in the parsing step is a manual process guided by expert knowledge of the data domain. Al- though it is desirable to hav e an automatic feature extraction process able to identify the relev ant features to be considered in the parsing step, this is still open to future research. In the specific case study examples described in Sections 4 and 5 of this paper we describe how we hav e applied a manual selection of features. Among the five steps, the parsing step performs the most ef- fectiv e compression of the data, reason why it is instrumental for the application of MBDA to Big Data. Thus, the suitabil- ity of the MBD A approach for intrusion detection is grounded on the idea that we are capable of identifying security-related anomalies in the resulting parsed (compressed) information and of recov ering the raw data related to such anomalies. 3.2. Fusion In the previous step, a set of features is defined for each dif- ferent source of data. The sampling rate to deriv e the counts for each source may be chosen to be di ff erent, due to dif- ferent dynamics of the sources or for con venience. Thus, to combine the features from di ff erent sources, these need to be stretched / compressed to a common sampling rate. Then, the features of the di ff erent sources are simply appended, yielding a unique stream of featured data of high dimensionality . The Fusion step is also done in the FCParser . The combination of the feature-as-a-counter and the fusion procedure is specially suited for the subsequent multiv ariate 3 Figure 1: Illustration of the 5 steps of the proposed approach. T able 1: Summary of the five steps in MBD A. STEP INPUT OUTPUT SOFTW ARE 1. Parsing Raw data stream Stream of features per source FCParser 2. Fusion Stream of features per source Single feature stream FCParser 3. Detection Single feature stream T imestamps for anomalies MED A T oolbox 4. Pre-diagnosis Single feature stream & T imestamps for anomalies Features for anomalies MED A T oolbox 5. De-parsing Raw data stream & T imestamps & Features for anomalies Ra w logs for anomalies FCParser analysis. It yields high dimensional feature vectors that need to be analysed with dimension reduction techniques, like PCA. Furthermore, counts and their correlation are easy to interpret. W e will show that the diagnosis procedure in the 4th step, and the consequent 5th step, are benefited from the definition of a large number of features so as to better describe the anomaly taking place. This is the opposite in most anomaly detec- tion schemes, where large dimensionality is seen as a concern, sometimes ev en referred to as a curse. 3.3. Detection The core of MSNM is PCA. PCA is applied to data sets where M variables or features are measured for N observ ations. The aim of PCA is to find the subspace of maximum v ariance in the M -dimensional feature space. The original features are lin- early transformed into the Principal Components (PCs). These are the eigen vectors of X T · X , typically for mean centered X and sometimes also after auto-scaling, that is, normalizing variables to unit variance. PCA follows the e xpression: X = T A · P t A + E A , (1) where A is the number of PCs, T A is the N × A score matrix, P A is the M × A loading matrix and E A is the N × M matrix of residuals. The columns in P A are typically normalized to unit length vectors, so that the PCA transformation actually splits the variance in X into a structural part represented by the scores T A and a residual part represented by E A . For the detection of anomalies in MSNM, a pair of statis- tics are defined: the D-statistic (D-st) or Hotelling’ s T2 statis- tic, computed from the scores, and the Q-statistic (Q-st), which compresses the residuals. Thus, using PCA and these statistics, we transform the problem of monitoring a highly dimensional multiv ariate stream of data X into the much simpler problem of monitoring a pair of statistics. After a new sampling time interv al, a ne w observ ation of the features x n is computed. Subsequently , the corresponding score vector is calculated as follo ws: t n = x n · P A (2) 4 where t n is a 1 × A vector with the corresponding scores, while e n = x n − t n · P t A (3) corresponds to the residuals. The D-st and the Q-st for obser- vation n can be computed from the follo wing equations: D n = t n · ( Σ T ) − 1 · t t n (4) Q n = e n · e t n (5) where Σ T represents the covariance matrix of the scores in the calibration data. The values of D n and Q n are contrasted to the statistics of the calibration data to identify anomalies. A large percentage of the working e ff ort of a CIR T is to an- alyze data related to potential incidents. If an e ffi cient triaging method is available, more incidents can be detected by the same amount of personnel. As a result, in the practical application of MSNM to intrusion detection, we are more interested on the anomalies triaging rather than on the dichotomous distinction between what should be identified as anomaly and what should not. T o combine the D-st and the Q-st into a single triaging score, we define here the Tscore of observation n according to the following equation: T n = α · D n / U C L D . 99 + (1 − α ) · Q n / U C L Q . 99 (6) where U C L D . 99 and U C L Q . 99 are the upper control limits for the D-st and Q-st of the calibration data [7], respectiv ely , computed as 99% percentiles, and α is weighting factor for the combina- tion, which value is discussed afterw ards. MSNM, follo wing prior theory in the industrial field [5], establishes two phases or modes of application. In the ex- ploratory mode [12] or Phase I , PCA is applied to a data block in order to find anomalies in that block. In the learning mode [7] or Phase II , PCA is calibrated from a data block to build a normality model, and then applied to new , incoming data, to find the anomalous ev ents. Phase I is dev oted to network opti- mization, troubleshooting and situation awareness: essentially to detect, understand and solve any security-related problem and misconfiguration that was already a ff ecting the network when the MSNM system was first deployed. These problems are the so-called special causes of variability in the argot of MSPC, because they induce unwanted variability in the data collected from the system under monitoring. Phase I is car- ried out by detecting and diagnosing outliers in the data. The diagnosis is necessary to identify when there is a problem that needs to be solved by the technical personnel. For instance, if we identify an excess of blocked tra ffi c in a gatew ay fire wall, this can be the result of a cyber-attack attempt that was cor - rectly blocked by perimeter security measures, and therefore no further action needs to be applied. Alternati vely , this can be the result of the firewall misconfiguration, which needs to be fixed. Following an iterative procedure in Phase I , outliers are isolated and diagnosed, and corresponding problems identified and solved. When only non-relev ant outliers remain, so that the network can be considered under normal operation condi- tions (NOC) or statistical control, we proceed to Phase II . In Phase II , the anomaly detector is used to identify anomalies in incoming data, typically in real time. The main idea beneath the definition of these two phases is that an anomaly detector should be de veloped only for a system under statistical control. Both phases in MSNM will be illustrated in the case studies of this paper . Sometimes it is di ffi cult to determine what should be under- stood as an outlier and what not, and therefore when to stop Phase I. The practical approach we suggest to follow is to look for outliers in a bi-plot of the monitoring statistics or a barplot of the Tscor e . In those plots, outliers are easily identifiable. If no outlier is found, we start Phase II . If otherwise any of the detected outliers reflects a real configuration / security problem, this needs to be solved and Phase I re-started by measuring ne w tra ffi c from the netw ork. If no outlier identifies a practical prob- lem, we still need to check whether the outliers pollute the PCA model or not. For that purpose, we can compare the amount of variance captured by each PC in the model with and without outliers. If this does not v ary to a large extent, then we can proceed with Phase II . Otherwise, we discard the outliers and re-start Phase I using the remaining data. It should be noted that the computation of the Tscor e , in par - ticular the weighting parameter in eq. (6), di ff ers in the two phases. In Phase I, the data we inspect for outliers is also the one used for model calibration. Therefore, outliers are inti- mately connected to the model variance, that is, outliers are expected to lay in the directions of high v ariance of the model. In this situation, we can set α to the percentage of variance cap- tured by the model. Thus, we put more weight on the part that captures more variance, which depending on the case can be the model or the residual part. In Phase II , howe ver , this is not an adequate way of setting α , since outliers are not part of the data used to fit the model and therefore they may separate from the rest of data in any potential direction of the space. Follo wing [22], in Phase II we use α equal to the ratio between the number of PCs A and the number of variables M . The multiv ariate analysis in this paper is performed using the MED A toolbox [8], which provides of a set of tools for multi- variate anomaly detection. When data grows beyond a certain volume, the Big Data extension of the toolbox can be used. The basic principle of this extension is that multi v ariate models lik e PCA can be computed iterativ ely , in a way that is scalable to any data size and fully parallelizable. The loading vectors of PCA can be identified using the eigendecomposition (ED) of the cross-product matrix X T · X , of dimension M × M . This ma- trix can be computed in an iterative, incremental w ay as data is inputting the system, so that the number of ro ws in X , N , is not a limitation any more [21]. T o visualize the statistics of large numbers of observations, we use a clustering version of multi- variate plots [45]. The Big Data module of the MED A T oolbox includes tw o computational cores: the iterativ e core and the ex- ponentially weighted moving average (EWMA) core. Both al- gorithms solve the out-of-core computation of models and the corresponding clustering. The iterativ e core is used in this pa- per to compute the models. 5 3.4. Pr e-Diagnosis Once an anomaly is signaled, a pre-diagnosis step is per- formed to identify the features associated with it. This informa- tion is v ery useful to mak e a first guess on the root causes of the anomaly . The contribution of the features to a given anomaly can be inv estigated with the contribution plots or similar tools. Among them, the most straightforward but e ff ecti ve approach is named Univ ariate-Squared (US) [47], and follo ws: d 2 = ( x n ) T · | x n | (7) Thus, anomalies are detected in the D-st and / or Q-st charts, and then the pre-diagnosis is performed with the US. The output of US is a 1 × M vector where each element contains the contrib u- tion of the corresponding feature to the anomaly under study . Those contributions with large magnitude, either positi ve or negati ve, are determined to be relev ant. The computation of US for normal size data and Big Data is included in the MED A toolbox. 3.5. De-P arsing The last step of the MBD A approach is the extraction of the specific logs in the ra w information that are associated with the anomaly . T o accomplish that, we use both the information from the detection and the pre-diagnosis modules. The former pro- vides the timestamps for the anomaly , which can be one or a set of consecutiv e sampling intervals. The latter provides the main features associated with the anomaly using eq. (7). The de- parsing consist in re verting the parsing procedure selectiv ely , obtaining, as a result, the raw logs related to the anomalies. T o this end, the raw logs in the selected timestamps are matched against the pre-diagnosis features and sorted by the number of features they match. Depending on the data-set and the anoma- lies detected, the amount of information extracted in the de- parsing step could still be too large for visual inspection. For this reason, a user-defined threshold is set to limit the amount of retriev ed data. The FCParser is employed again in this step with the same configuration files used in the parsing step, where the regular expressions associated with the features were defined. In Al- gorithm 1, the procedure of the de-parsing is detailed. Firstly , the algorithm goes through all the input files corresponding to the di ff erent data sources, looking for data records that occurred in the given timestamps T and obtaining a selection of logs L . Then, the algorithm goes through all log lines in L and assigns a score called f score . The f score for a log line is the num- ber of pre-diagnosis features ( F ) that appears in that line. This metric enables the algorithm to sort the log lines by relev ance in an e ffi cient way . Then, in a second loop, the extraction is performed. On each iteration, the algorithm extracts all the log lines that have f score equal to N , where N is initialized to the number of features in F . In this manner , the log lines that con- tain all features F are extracted first. If the number of log lines is not abo ve the thre shold , the number of features N is reduced by one and the process is repeated. This is done for each data source until we reach the thr e shold or N reaches 0. The motiv ation for the de-parsing algorithm is that features identified in the pre-diagnosis step will likely be correlated, b ut do not necessary need to be present in all raw logs correspond- ing to an attack. Sometimes the attack is described by sev eral types of logs that appear in the same time period. These logs will not contain all the features identified in the de-parsing, but a subset of them. Algorithm 1: De-Parsing algorithm Input: detection, pre-diagnosis Output: R 1 T ← timestamps // Timestamps from detection 2 L ← select(T) // Logs from timestamps 3 F ← pre-diagnosis // Anomalous features 4 R ← [] 5 N ← #F // Number of features to match 6 for each logline in L do 7 fscor e [ logline ] = n feat(logline,F) // # of anomalous features in the // logline 8 while len ( R ) < thr e shold do 9 R + = e xtr act ( L , N , f score ) // Extract lines with fscore=N 10 N ← N − 1 11 retur n R 3.6. Comparison of MBD A 5-steps with State-of-the-Art Methodologies In this section, we compare the main state-of-the-art anomaly detection methodologies discussed in Section 2 with our pro- posal, taking the 5-steps as a comparison framework. T a- ble 2 relates the aforementioned contributions to the 5 steps. A checkmark is shown for those approaches that consider the corresponding step. If the checkmark is into parenthesis, only partial functionality of such step is implemented. Methodologies based on traditional machine learning [11, 36, 43] typically perform steps 1 to 3, not dealing with pre- diagnosis (step 4) or de-parsing (step 5). The same applies for machine learning techniques focused in Big Data anomaly de- tection [30–35, 37, 38]. Furthermore, some of the approaches that combine traditional methodologies with Big Data tools [40, 44], or multiv ariate techniques like [9, 10] only mention step 1 (feature engineering) and step 3 (detection). The PCA techniques based in Lakhina’ s work [6, 12, 17 – 20] are more complete, in the sense that they consider steps 1 to 4. Still, the diagnosing method is limited in those methods and improv ed in MSNM [47, 48]. Y et, in MSNM works the de- parsing step was not considered. 4. Case Study I: V AST Challenge 4.1. Experimental F r amework The data set comes from the V AST 2012 2nd mini challenge [49], a publicly av ailable dataset used for the IEEE Scientific V isualization Conference of the year 2012. The V AST -MC2 6 T able 2: State-of-the-art anomaly detection methodologies compared to the MBDA 5 steps. Methodology Y ears Ref. Parsing Fusion Detection Pre-diagnosis De-parsing PCA-based I 2003 [10] X 7 X 7 7 SVM 2003–2015 [11, 43] ( X ) ( X ) X 7 7 PCA-based II 2004–2018 [12, 15, 16, 20] X X X ( X ) 7 Clustering 2009–2016 [30 – 35, 37, 38] X X X 7 7 HASHDOOP 2014 [28] X X X 7 7 Entropy Calculation I 2015 [44] ( X ) 7 X 7 7 Entropy Calculation II - T ADOOP 2015 [40] X 7 X 7 7 Entropy Calculation III 2016 [41] X X X 7 7 MSNM 2016–2017 [22, 48] X X X X 7 MBD A 5-steps 2019 X X X X X presents a corporate network scenario where security incidents occur during two days. In particular, some of the sta ff report unwanted messages and a non-legitimate anti-virus program appearing on their monitors. Also, their systems seem to be running more slo wly than normal. In summary , a forensics op- eration is required to discover the most rele v ant security ev ents and their root causes. As the challenge is from the past, we know the solution beforehand: a botnet infected the network and attacked the DNS servers, causing performance issues and the infection of workstations with adware. This case of study serves to illustrate Phase I (exploratory mode) for anomaly detection in an environment with disparate security data sources. Phase II is not feasible because the net- work is already infected and data under NOC is not av ailable. The main objectiv e of Phase I is network troubleshooting and optimization, detecting anomalies that leads to problems and misconfiguration. The network infrastructure for the challenge consists of ap- proximately 4,000 workstations and 1,000 servers that operate 24 hours a day . The intra-network nodes are in the IP range of 172.x.x.x and IPs from other ranges are considered external. The data provided with the V AST 2012 mini challenge 2 consist of Cisco ASA firew all logs including a total of 23,711,341 data records, and intrusion detection system logs including 35,948 data records. The dataset details are av ailable at [49]. Reproducibility of results in this case study is possible by downloading the virtual machine at https: // nesg.ugr .es / v eritas / index.php / mbda 4.2. Application of the 5-steps methodology P arsing & Fusion steps. First of all, using the FCParser tool, the data from the two data sources is parsed and fused into observations for analysis. Firewall and IDS logs are semi- structured data sources because the format of the di ff erent data entries is not fixed. Thus, this experiment illustrates ho w the FCParser can be used to deal with di ff erent kinds of sources of information with unev en formats. From the raw data, 265 features hav e been designed, 122 for firewall logs and 143 for IDS logs. In T ables 3 and 4 an ov erview of the features can be found. W e decided to use 1 minute time interval for each observation, obtaining, as a re- sult, a 2345 x 265 matrix of parsed data. This reduces the 4.2 GB of raw data to less than 2.5 MB, sho wing that this step is e ff ectiv ely used as a compression step. T able 3: Firewall features ov erview Number of features Data considered in the features 6 Source and destination IPs 84 Source and destination ports 13 ASA Messages 2 Protocol 8 Syslog priority 7 Action 2 Direction of conection T able 4: IDS features overvie w Number of features Data considered in the features 6 Source and destination IPs 84 Source and destination ports 4 Snort priority 33 Snort Classification 10 Snort ev ent description 6 IP headers Detection step. The relev ance of the di ff erent features in terms of security is heterogeneous. For example, a connection to the port 80 found in the fire wall logs is not as important as a SSH brute force attack detected in the IDS logs. For this reason, to establish levels of se verity , each feature is assigned a weight from 1 to 10. This weight is multiplied to the data after auto- scaling, so that the higher the weight, the higher the relev ance of the variable in the model. Once the parsed data is prepared, the MSNM Phase I analy- sis is performed. For that, the PCA model is obtained and the D-st and Q-st are computed for each observ ation. Because the data volume is reduced, we did not employ the Big Data func- tionality in the MED A T oolbox, which will be illustrated in the other case study . With the monitoring statistics, the Tscor e in Eq. (6) is computed for observation triaging. Figure 2 shows the Tscore values for the complete two day interval. The 5 ob- servations that stand out the most are selected for further anal- 7 0 500 1000 1500 2000 Observation 0 2 4 6 8 10 12 14 16 18 20 22 Tscore 369,370 389 384 1413 Figure 2: Tscore values for each observ ation. ysis: 369, 370, 1413, 389, 384. Pre-diagnosis step. W e use the US tool to extract informa- tion about the selected anomalies following Eq. (7). This pro- cedure yields a subgroup of features that are related to the giv en anomalies providing insight into those ev ents. The US scores with the highest absolute magnitude highlight the main vari- ables related to an anomaly . A positiv e score for a variable means that the anomaly presents an unexpectedly high value of that variable, while a negati v e score means right the oppo- site: the value of the variable is lo wer than expected. Many times, US scores are informative enough to avoid the need to look at the original raw data, that is, to perform the deparsing step. This makes diagnosis faster and, in turn, response to se- curity incidents faster . In Figure 3, the US plot of the observation number 369, cor- responding to timestamp 2012-04-06 00:04, is sho wn. The fea- tures with values that stand out from the others are selected. T able 5 shows the features associated to each of the fiv e obser- vations identified in the detection. Those results demonstrate that MBD A makes the most of the combination of the two data sources, as the US yields feafures from both sources, for e xam- ple, for observations 369 and 370. De-parsing step. Finally , from the timestamps of the ev ents and the features related to anomalies, the specific raw logs as- sociated with the detected anomalies are extracted. This is achiev ed using the FCParser tool. The last three columns in T able 5 summarize the results of de-parsing the 5 anomalies from the anomaly detection step. T o sum up, a total of 450 log entries are retriev ed, representing a 0.0019% of the logs in the original data. Howe ver , there are only 10 di ff erent log types, representing only 0.00004% of all the input data, which makes the analyst interpretation of the results straightforward. In the following this interpretation is discussed. At 06 / 04 00:04, numerous attempts of data exfiltration by T elnet and SSH were discovered. The firew all blocked the T el- net connections, ho wev er , the SSH connections passed through. 50 100 150 200 250 -2 0 2 4 6 8 10 12 d 2 A 10 4 FW IDS Figure 3: US plot for the observation 369. At 06 / 04 00:05, an information leakage carried out using SNMP was detected by the IDS. The deparser also shows that those requests were blocked by the fire wall. At 06 / 04 00:19 and 06 / 04 00:24 we can see multiple vulner - ability scans targeting remote desktop services like VNC and RDP . In particular , the detection of just two logs related to RPD shows that the MBD A approach is especially sensitive to e vents which are not common in the tra ffi c, being an adequate tool to identify those ev ents as soon as they sho w up. At 06 / 04 17:28 the logs extracted from the deparser spotlight a coordinated attack from multiple infected systems targeting the DNS server at 172.23.0.10. If the DNS server is compro- mised, that would be the reason for the ad-ware and malicious anti-virus programs that appeared on the systems. Summary . This example shows that with the proposed ap- proach and one single iteration of the Phase I analysis, we can extract most of the relev ant information on the compromise of the network in the present example. Just 10 log types are enough to shed light on what has occurred on the most anoma- lous ev ents, drastically reducing the time from detection to re- sponse and consequently , the cost derived from those e v ents. 5. Case Study II: ISP Network 5.1. Experimental F r amework In this section, we present the 5-steps methodology applied to a real network scenario, taking as input the UGR’16 dataset. For the sake of completeness, we provide a brief description of the dataset in what follows, although all the details can be found in [50]. W e collected this data on a real network of a Tier 3 ISP . The services provided by the ISP are mainly virtualization and host- ing. T o a shorter e xtent, the ISP also pro vides common Internet access services. Netflow sensors were deployed in the border routers of the network to collect tra ffi c corresponding to its normal operation. 8 T able 5: V AST2102: Anomaly Diagnosis. Index T imestamps Tscore Sources Features selected logs log types Deparsing (Interpretation) fw dport telnet ids ssh scan Data exfiltration attempt 369 06 / 04 00:04 19.94 ids & fw ids ssh scan outbound 32 3 by SSH and T elnet, the latter ids dport ssh blocked by access lists. fw dport snmp fw denyacl ids dport snmp ids snmp req Attempted information 370 06 / 04 00:05 19.52 ids & fw ids successful-recon-limited 71 4 leak using the SNMP protocol. fw error ids brute force ids attempted-recon 384 06 / 04 00:19 7.36 ids ids scanbehav 2 1 Scan for windows RDP ports for vulnerabilities. ids attempted-recon Scan ports in range 389 06 / 04 00:24 17.25 ids ids successful-recon-limited 91 1 5900-5920 looking ids prio2 ids vnc scan for vulnerabilities. 1413 06 / 04 17:28 19.38 ids ids policy-violation 254 1 DNS server attack from ids prio1 ids dns update multiple systems. T able 6: Characteristics of the calibration and the test sets. Featur e Calibration T est Capture start 10:47h 03 / 18 / 2016 13:38h 07 / 27 / 2016 Capture end 18:27h 06 / 26 / 2016 09:27h 08 / 29 / 2016 Attacks start N / A 00:00h 07 / 28 / 2016 Attacks end N / A 12:00h 08 / 09 / 2016 Number of files 17 6 Size (compressed) 181GB 55GB # Connections ≈ 13,000M ≈ 3,900M In addition, a total of 25 virtual machines were deployed in or- der to perform controlled malicious acti vities. Some of these virtual machines were used to launch a number of specific at- tacks over time against the rest, which acted as the victims of the attacks. The ISP personnel was aware and collaborated in the experiment. W e obtained two sets of data. A calibration set with more than three months of tra ffi c and a test set of appr . one month. The main characteristics of both sets are shown in T able 6. At- tacks were generated during the test set time period, in intervals of 2 hours and alternating with legitimate tra ffi c for 12 consec- utiv e days. This example illustrates the application of the pro- posal through Phases I & II (exploratory and learning mode). 5.2. Application of the 5-steps methodology P arsing step. In the first step, data from the calibration and test datasets are parsed into M -dimensional vectors (observa- tions) representing time intervals of 1 minute. In particular , we defined a set of M = 138 network-related features, correspond- ing to 11 di ff erent Netflow variables as sho wn in T able 7. The 1 minute interval leads to app. 144K observ ations in the cali- bration data, with an storage volume of app. 80 MB. A sin- gle machine with 16 cores running the FCParser parses 100M connection logs in 3 hours and 16 seconds, and computations can be fully parallelized. Thus, the complete computation of T able 7: Overview of Features in the second case study . V ariable #featur es → values Source IP 2 → public, private Destination IP 2 → public, private Source port 50 → specific services, Other Destination port 50 → specific services, Other Protocol 5 → TCP , UDP , ICMP , IGMP , Other Flags 6 → A, S, F , R, P , U T oS 3 → 0, 192, Other # Packets in 5 → very low , low , medium, high, very high # Packets out 5 → very low , low , medium, high, very high # Bytes in 5 → very low , low , medium, high, very high # Bytes out 5 → very low , low , medium, high, very high 13,000M connection logs in our calibration data set can be done in app. 16 days in a single, 16 core, machine, or in little more than 6 hours in a large-size parallel cluster of 1000 cores. A main limitation to speed-up the parsing is the use of python as the programing language of the FCParser . Regular expres- sions in python are much slower than in other programming technologies. T o check an alternati ve technology in order to re- duce processing times, we also programmed an ad-hoc parser in C, which was observed to be 100-times faster . The latter defines the regular expressions corresponding to the features at code lev el, unlike the FCParser , where the selection of features is done at configuration le vel, i.e. in configuration files. The definition of the features in configuration files is slower , but simplifies the application of the 5-steps methodology in a new problem and the re-definition / modification of features. Thanks to the compression ability of the first step, the rest of steps can be performed in a regular computer . Fusion step. In this example we work on a single source of data: Netflow . Therefore, no data fusion is necessary . Phase I. Detection step. In this case study , we first detail the Phase I analysis of the calibration set , and then we proceed with the Phase II using the test data . In what follows, steps 3 to 9 T able 8: Most relev ant variables in the US pre-diagnosis for outliers 20160326t1229-20160326t1230 and 20160513t1003. T ime interval 20160326t1229-20160326t1230 ‘npackets verylo w’ ‘srctos zero’ ‘tcpflags A CK’ ‘dstip public’ ‘srcip public’ ‘protocol udp’ ‘nbytes medium’ ‘dport register’ ‘sport register’ T ime interval 20160513t1003 ‘dstip public’ ‘srcip public’ ‘tcpflags ACK’ ‘protocol tcp’ ‘tcpflags SYN’ ‘npackets verylo w’ ‘nbytes verylow’ ‘srctos zero’ ‘dport reserved’ ‘dport smtp’ ‘sport reserved’ ‘srctos other’ ‘tcpflags RST’ ‘sport smtp’ 5 are illustrated for both phases. While the pre vious steps led to a large compression of the information (from 181GB to 80 MB), the numbers in terms of observations are still too large for the direct computation of the PCA model. Thus, in this example, the Big Data module of the MED A T oolbox is employed. 0 500 1000 1500 2000 2500 3000 3500 4000 4500 D-st 0 2 4 6 8 10 12 Q-st × 10 11 20160326t1229 20160326t1230 20160513t1003 Figure 4: Compressed MSNM plot for the calibration set: scatter plot of the Q-st vs the D-st. Outliers are labeled with their timestamps. The compressed MSNM plot for Phase I analysis is sho wn in Figure 4. The plot is a scatter plot of D-st values vs Q-st val- ues, which is an alternati ve to the Tscore bar plot. Thanks to the functionality in the Big Data module of the MED A T oolbox, the 144K observ ations were clustered in 100 clusters to improv e vi- sualization. The size of the markers depends on the multiplicity of each cluster , that is, the number of original observ ations in it. This is particularly useful in anomaly detection, where outliers typically sho w up as indi vidual or very small clusters. Control limits containing the 99% percentiles of the calibration sample are shown in the plot to facilitate the identification of outliers. Labels in the plot display the timestamp of se veral individual observations. W e can see that there is an excursion from nor- mal tra ffi c at day 2016-03-26 between 12:29 and 12:30, and another at 10:03 of 2016-05-13. Phase I. Pre-diagnosis step. In T able 8, we show the features with highest magnitude according to the US for the two outliers identified. For day 2016-03-26, the pre-diagnosis information in the T able is too general, and we can search for more detail with the MBD A 5th step. Phase I. De-parsing step. Since the FCParser cannot handle binary data in its current version, we will manually perform the de-parsing step with nfdump commands. W e run the following command, extracted from the timestamps and the definition of the features: PROMPT$ nfdump -r -t 2016/03/26.12:29:00-2016/03/26.12:30:59 ‘(packets <4) and (bytes > 1000 and bytes < 10001) and (dst port > 1024 and dst port < 49151) and (src port > 1024 and src port < 49151) and (flags A or proto udp)’ where we intentionally combined ‘tcpflags ACK’ and ‘proto- col udp’ with an ’or’ junction, since they are obviously contra- dictory . The query provided 436K flo ws out of the total ≈ 1.2M flo ws in the two minute interval, which corresponds to 0.00003% of the total size of the calibration data (a needle in a haystack). From those, all but 80 flows were related to the anomaly (99.98% of specificity). The flows rev eal a scanning operation from an internal machine (42.219.156.231) to all the 65535 pos- sible UDP ports at machine with anonymized IP 62.151.13.8. Further inspecting among the two IPs uncovered a total of 1M flows. For day 2016-05-13, the pre-diagnosis results show there was an unexpected e xcess of very short SMTP connections. T o proceed with step 5, we run the following command: PROMPT$ nfdump -r -t 2016/05/13.12:29:00-2016/05/13.12:30:59 ‘packets < 4 and bytes < 151 and dst port = 25 and (flags S or flags A or flags R)’ where again flags are combined with ’ors’. The query yielded a total of app. 125K flo ws out of the 400K flows in that minute interval, from which all but 15 were re- lated to the anomaly (99.99% of specificity). T o interpret the result, the flows only need to be aggregated b y origin IP , leading just to 4 public IPs following the pattern of a SP AM campaign. The ISP IT team confirmed this was a client that hired virtual machines during a period. The hired IPs finished in the Y A- HOO blacklists, and that is probably the reason why the client stopped hiring the virtual machines. This misuse behavior was repeated throughout the capture interval. According to the MSNM philosophy discussed before, the problems identified in the data need to be solved and further data need to be collected to continue Phase I. Since we are working on a previous capture, we cannot collect ne w data. Howe v er , to continue the analysis an alternative is to filter out the netflo w traces isolating the attacks, and repeat Phase I from the rest of data. After this second iteration, we stopped Phase I 10 2000 4000 6000 8000 10000 12000 14000 16000 18000 Observation 10 -4 10 -3 10 -2 10 -1 Tscore 20160801t0410-0414 Figure 5: Tscores per test observation: higher values represent identified anomalies. T able 9: V ariables in order of rele vance according to the oMED A diagnosis for the selected anomaly in the test set . T ime interval 20160801t0410-0414 ‘srctos other’ ‘sport register’ ‘nbytes low’ ‘dport register’ ‘npackets verylo w’ ‘protocol udp’ ‘srcip public’ ‘dstip public’ ‘tcpflags ACK’ ‘label background’ ‘srctos zero’ to proceed with Phase II. Phase II. Detection step. Once we finish Phase I, we have a definitiv e normality model of the tra ffi c and can proceed to analyze incoming data in real time. This is ex emplified using the test data. The Tscore plot of the test data is shown in Fig. 5. While a compressed MSNM plot like the one shown be- fore could be computed for this data, the toolbox only includes its computation for calibration data, that is, data that is used to generate the model. Still, the Tscore provides the identifi- cation of the outliers. W e can see there are outliers above the regular spikes, the latter that correspond to synthetic attack pe- riods. The most relev ant anomaly corresponds to the interv al 20160801t0410 to 20160801t0414, annotated in Figure 5. Phase II. Pre-diagnosis step. The US pre-diagnosis of this short interv al sho ws an increase of A CK packets and very short connections using UDP (see rele vant features in T able 9), a pat- tern that resembles that of the first anomaly in the calibration data set, diagnosed as a scanning attack. Phase II. De-parsing step. Proceeding with the 5th step, we find a single IP from Germany creating 800K connections (0.0002% of the total) from origin ports 5061, 5062, 5066 and 5069. The destinations are 4097 di ff erent hosts in 16 di ff er- ent subnets with / 24 mask. Each host is scanned through ports 6000-6060. The whole time interval contained more than 1M flows, and the query accurately identified the connections of interest plus a limited number of less that 1000 connections (specificity of 99.87%). According to the IT sta ff , the e vent seems to be a malware dri ven scanning, due to this specific pat- tern of connection. Summary . This example illustrates the application of the 5- step methodology in a real data set, showing the viability of both Phase I and Phase II analyses. In both situations, the methodology could identify real attacks with a lev el of speci- ficity higher than 99% and providing a reduced set of logs for analysis. This experience also sho wed that the computation of the 5-steps can be orders of magnitude faster using paralleliza- tion hardware and / or a fast processing language. Permanent de- ployments of this technique should take into account this find- ing. 6. Discussion and Conclusion In this paper, we propose a Big Data anomaly detection methodology named Multiv ariate Big Data Analysis (MBD A). The approach is based on 5 steps and allo ws to detect anomalies and isolate the related original information with high accuracy . This information is very useful for the security team to reduce the time from detection to e ff ecti ve response. W e illustrated our approach in a emulated benchmark with two semistructured sources and in a real world network security problem. Using MBD A, identifying the timestamp and the character- istics of the anomalous tra ffi c ( e.g . , the services a ff ected) is a matter of seconds. W e illustrate sev eral examples in which we could identify the raw information corresponding to an attack with a level of specificity higher than 99%, that is, more than 99% of the isolated logs were truly related to the attack. Fur- thermore, extracted information corresponds in all cases to a tiny portion of far less than 1% (a needle) of the complete data set (the haystack). Acknowledgement This work is partly supported by the Spanish Ministry of Economy and Competitiveness and FEDER funds through project TIN2014-60346-R and TIN2017-83494-R. References [1] VERIZONE, Data breach in vestigation report (2017). [2] David McCandless. Information Is Beautiful. W orld’ s Biggest Data Breaches & Hacks, http://www.informationisbeautiful.net/ visualizations/worlds- biggest- data- breaches- hacks , [On- line; accessed 11-Feb-2019]. [3] T . Bussa, K. M. Kavanagh, Critical Capabilities for Security Information and Event Management (SIEM) Report, Gartner (2017) 1–15. [4] A. Forni, R. van der Meulen, Market Insight: Security Market Trans- formation Disrupted by the Emergence of Smart, Pervasiv e and E ffi cient Security Critical Capabilities for Security Information and Event Man- agement, Gartner (2017) 1–16. [5] A. Ferrer, Latent structures-based multivariate statistical process control: A paradigm shift, Quality Engineering 26 (1) (2014) 72–91. [6] G. Fernandes, L. F . Carvalho, J. J. Rodrigues, M. L. Proenc ¸ a, Network anomaly detection using IP flows with Principal Component Analysis and Ant Colony Optimization, Journal of Network and Computer Applications 64 (2016) 1–11. URL http://www.sciencedirect.com/science/article/pii/ S1084804516000618 11 [7] J. Camacho, A. P ´ erez-V illeg as, P . Garc ´ ıa-T eodoro, G. Maci ´ a-Fern ´ andez, PCA-based multiv ariate statistical network monitoring for anomaly detection, Computers & Security 59 (2016) 118–137. URL http://www.sciencedirect.com/science/article/pii/ S0167404816300116 [8] J. Camacho, A. P ´ erez-V illeg as, R. A. Rodr ´ ıguez-G ´ omez, E. Jim ´ enez, Multiv ariate exploratory data analysis (MEDA) toolbox for Matlab, Chemometrics and Intelligent Laboratory Systems 143 (2015) 49 – 57. [9] H. Om, T . Hazra, Statistical techniques in anomaly intrusion detection system, Int. Journal of Advances in Engineering & T echnology 5 (1) (2012) 387–398. [10] A. Kanaoka, E. Okamoto, Multi variate statistical analysis of network traf- fic for intrusion detection, 14th international workshop on Database and Expert System Applications (2003) 1–5. [11] K. Heller , K. Svore, A. D. K eromytis, S. Stolfo, One class support vector machines for detecting anomalous windows registry accesses, W orkshop on Data Mining for Computer Security (DMSEC), Melbourne, FL, November 19, 2003. URL http://sneakers.cs.columbia.edu/ids/publications/ ocsvm.pdf [12] A. Lakhina, M. Crov ella, C. Diot, Diagnosing network-wide tra ffi c anomalies, ACM SIGCOMM Computer Communication Revie w 34 (4) (2004) 219–230. URL http://dl.acm.org/citation.cfm?id=1030194.1015492 [13] H. Ringberg, A. Soule, J. Rexford, C. Diot, Sensitivity of PCA for tra ffi c anomaly detection, A CM SIGMETRICS Performance Evaluation Revie w 35 (1) (2007) 109–120. URL http://dl.acm.org/citation.cfm?id=1269899.1254895 [14] C. Callegari, L. Gazzarrini, S. Giordano, M. Pagano, T . Pepe, A novel PCA-based network anomaly detection, in: IEEE International Confer- ence on Communications, V ol. 27, 2011, pp. 1731–1751. [15] A. Delimargas, E. Ske vakis, H. Halabian, I. Lambadaris, Evaluating a modified PCA approach on network anomaly detection, Fifth Interna- tional Conference on Next Generation Networks and Services (NGNS) (2014) 124–131. [16] C. Callegari, L. Gazzarrini, S. Giordano, M. Pagano, T . Pepe, Improv- ing PCA-based anomaly detection by using multiple time scale analysis and Kullback-Leibler div ergence, International Journal of Communica- tion Systems 27 (10) (2014) 1731–1751. URL http://@doi.wiley.com/10.1002/dac.2432 [17] M. Aiello, M. Mongelli, E. Cambiaso, G. Papaleo, Profiling DNS tunneling attacks with PCA and mutual information, Logic Journal of IGPL (2016) 1–14. URL http://jigpal.oxfordjournals.org/lookup/@doi/10. 1093/jigpal/jzw056 [18] D. Jiang, C. Y ao, Z. Xu, W . Qin, Multi-scale anomaly detection for high-speed network tra ffi c, Transactions on Emerging T elecommunica- tions T echnologies 26 (3) (2015) 308–317. [19] Z. Chen, C. K. Y eo, B. S. Lee, C. T . Lau, Detection of Network Anoma- lies using Improved-MSPCA with Sk etches, Computers & Security . URL http://linkinghub.elsevier.com/retrieve/pii/ S0167404816301419 [20] H. Xia, B. Fang, M. Roughan, K. Cho, P . Tune, A BasisEvolution frame- work for network tra ffi c anomaly detection, Computer Networks 135 (2018) 15–31. doi:10.1016/j.comnet.2018.01.025 . URL https://doi.org/10.1016/j.comnet.2018.01.025 [21] J. Camacho, G. Maci ´ a-Fern ´ andez, J. D ´ ıaz-V erdejo, P . Garc ´ ıa-T eodoro, T ackling the big data 4 Vs for anomaly detection, Proceedings - IEEE INFOCOM (1) (2014) 500–505. [22] J. Camacho, P . Garc ´ ıa-T eodoro, G. Maci ´ a-Fern ´ andez, Tra ffi c Monitoring and Diagnosis with Multiv ariate Statistical Network Monitoring: A Case Study , IEEE Security & Privac y International W orkshop on Tra ffi c Mea- surements for Cybersecurity (WTMC 2017). [23] M. Iturbe Urretxa, Data-driven anomaly detection in industrial networks, Ph.D. thesis, Mondragon Unibertsitatea (2017). [24] A. Bialecki, M. Caf arella, D. Cutting, O. O’Malley , Hadoop: a framework for running applications on large clusters b uilt of commodity hardware. URL http://hadoop.apache.org [25] J. Dean, S. Ghemawat, Mapreduce: simplified data processing on large clusters, Communications of the A CM 51 (1) (2008) 107–113. [26] M. Zaharia, M. Chowdhury , M. J. Franklin, S. Shenker , I. Stoica, Spark: cluster computing with w orking sets, in: 2nd USENIX conference on Hot topics in cloud computing, 2010, pp. 10–10. [27] M. Zaharia, R. S. Xin, P . W endell, T . Das, M. Armbrust, A. Dave, X. Meng, J. Rosen, S. V enkataraman, M. J. Franklin, Apache spark: a uni- fied engine for big data processing, Communications of the A CM 59 (11) (2016) 56–65. [28] R. Fontugne, J. Mazel, K. Fukuda, Hashdoop: a mapreduce framework for network anomaly detection, Computer Communications W orkshops (INFOCOM W orkshops) (2014) 494–499. [29] J. Dromard, G. Roudi ` ere, P . Owezarski, Unsupervised network anomaly detection in real-time on big data, Communications in Computer and In- formation Science 539 (2005) 197–206. [30] G. P . Gupta, M. Kulariya, A framework for fast and e ffi cient cyber secu- rity network intrusion detection using apache spark, Procedia Computer Science 93 (2016) 824–831. [31] D. Gonc ¸ alv es, J. a. Bota, M. Correia, Big data analytics for detecting host misbehavior in lar ge logs, Trustcom / BigDataSE / ISP A 1 (2015) 238–245. [32] W . Hurst, M. Merabti, P . Fergus, Big data analysis techniques for cyber- threat detection in critical infrastructures, Advanced Information Net- working and Applications W orkshops (W AIN A) 1 (2014) 916–921. [33] M. M. Rathore, A. Ahmad, A. Paul, Real time intrusion detection system for ultra-high-speed big data en vironments, The Journal of Supercomput- ing (2016) 1–22. [34] S. W allace, X. Zhao, D. Nguyen, K.-T . Lu, Big data analytics on smart grid: Mining pmu data for event and anomaly detection, in: Big Data: Principles and Paradigms, Morgan Kaufmann, 2016, Ch. 17, pp. 417– 429. [35] W . Xu, L. Huang, A. Fox, D. Patterson, M. I. Jordan, Detecting large- scale system problems by mining console logs, in: A CM SIGOPS 22nd Symposium on Operating Systems Principles, SOSP09, 2009, pp. 117– 132. [36] D. Had ˇ ziosmanovi ´ c, D. Bolzoni, P . H. Hartel, A log mining approach for process monitoring in scada, International Journal of Information Secu- rity 11 (4) (2012) 231–251. [37] T .-F . Y en, A. Oprea, K. Onarlioglu, T . Leetham, W . Robertson, A. Juels, E. Kirda, Beehi ve: large-scale log analysis for detecting suspicious activ- ity in enterprise networks, in: 29th Annual Computer Security Applica- tions Conference, A CM, 2013, pp. 199–208. [38] J. Therdphapiyanak, K. Piromsopa, An analysis of suitable parameters for e ffi ciently applying K-means clustering to large TCPdump data set using Hadoop framew ork, in: 10th International Conference on Electrical En- gineering / Electronics, Computer , T elecommunications and Information T echnology (ECTI-CON), 2013, pp. 1–6. [39] J. Therdphapiyanak, K. Piromsopa, Applying Hadoop for log analysis tow ard distributed IDS, in: 7th International Conference on Ubiquitous Information Management and Communication, A CM, 2013, pp. 3–3. [40] G. Tian, Z. W ang, X. Y in, Z. Li, X. Shi, Z. Lu, C. Zhou, Y . Y u, D. Wu, T ADOOP: Mining Network Tra ffi c Anomalies with Hadoop, in: Lec- ture Notes of the Institute for Computer Sciences, Social Informatics and T elecommunications Engineering, V ol. 164, Springer . [41] Z. W ang, J. Y ang, H. Zhang, C. Li, S. Zhang, H. W ang, T owards on- line anomaly detection by combining multiple detection methods and storm, in: Network Operations and Management Symposium (NOMS), IEEE / IFIP , IEEE, 2016, pp. 804–807. [42] M. Krotofil, J. Larsen, Rocking the pocket book: Hacking chemical plants, in: DefCon Conference, DEFCON, 2015. [43] Y . Hong, C. Huang, B. Nandy , N. Seddigh, Iterative-tuning support vec- tor machine for network tra ffi c classification, Proceedings of the 2015 IFIP / IEEE International Symposium on Integrated Network Manage- ment, IM 2015 (2015) 458–466 doi:10.1109/INM.2015.7140323 . [44] M. Krotofil, J. Larsen, D. Gollmann, The process matters: Ensuring data veracity in cyber-physical systems, in: Proceedings of the 10th A CM Symposium on Information, Computer and Communications Security , A CM, 2015, pp. 133–144. [45] J. Camacho, V isualizing Big data with Compressed Score Plots: Ap- proach and research challenges, Chemometrics and Intelligent Laboratory Systems 135 (2014) 110 – 125. URL http://www.sciencedirect.com/science/article/pii/ S016974391400080X [46] X-pack, https://www.elastic.co/products/x- pack , [Online; ac- cessed 15-Mar-2018]. 12 [47] M. Fuentes-Garca, G. Maci-Fernndez, J. Camacho, Evaluation of diag- nosis methods in PCA-based Multiv ariate Statistical Process Control, Chemometrics and Intelligent Laboratory Systems 172 (2018) 194 – 210. URL http://www.sciencedirect.com/science/article/pii/ S0169743917302046 [48] J. Camacho, P . Garc ´ ıa-T eodoro, G. Maci ´ a-Fern ´ andez, Tra ffi c monitoring and diagnosis with multiv ariate statistical network monitoring: A case study , in: 2017 IEEE Security and Priv acy W orkshops (SPW), 2017, pp. 241–246. [49] V isual Analytics Community . V AST Challenge 2012, http://www. vacommunity.org/VAST+Challenge+2012 (2012). [50] G. Maci ´ a-Fern ´ andez, J. Camacho, R. Mag ´ an-Carri ´ on, P . Garc ´ ıa-T eodoro, R. Ther ´ on S ´ anchez, UGR’16: a new dataset for the e valuation of cyclostationarity-based network IDSs, Computer & Security . URL http://www.sciencedirect.com/science/article/pii/ S0167404817302353 13
Original Paper
Loading high-quality paper...
Comments & Academic Discussion
Loading comments...
Leave a Comment