Compact Autoregressive Network
Autoregressive networks can achieve promising performance in many sequence modeling tasks with short-range dependence. However, when handling high-dimensional inputs and outputs, the huge amount of parameters in the network lead to expensive computat…
Authors: Di Wang, Feiqing Huang, Jingyu Zhao
Compact Autoregressiv e Net w ork Di W ang † , F eiqing Huang † , Jingyu Zhao † , Guo dong Li † , Guang jian Tian ‡ † Dep artment of Statistics and A ctuarial Scienc e, University of Hong Kong ‡ Huawei No ah’s Ark L ab, Hong Kong, China Septem b er 10, 2019 Abstract Autoregressiv e net works can achiev e promising p erformance in man y sequence mo d- eling tasks with short-range dep endence. Ho wev er, when handling high-dimensional inputs and outputs, the h uge amoun t of parameters in the netw ork lead to exp ensive computational cost and lo w learning efficiency . The problem can b e alleviated sligh tly b y in tro ducing one more narrow hidden la yer to the net work, but the sample size re- quired to achiev e a certain training error is still large. T o address this challenge, we rearrange the weigh t matrices of a linear autoregressive net work into a tensor form, and then mak e use of T uck er decomp osition to represen t lo w-rank structures. This leads to a no v el compact autoregressive net work, called T uck er AutoRegressive (T AR) net. In terestingly , the T AR net can b e applied to sequences with long-range dependence since the dimension along the sequen tial order is reduced. Theoretical studies sho w that the T AR net improv es the learning efficiency , and requires muc h fewer samples for model training. Exp erimen ts on syn thetic and real-world datasets demonstrate the promising p erformance of the prop osed compact net w ork. Keywor ds : artificial neural net work, dimension reduction, sample complexit y analysis, sequence mo deling, tensor decomposition 1 1 In tro duction Sequence mo deling has been used to address a broad range of applications including macro e- conomic time series forecasting, financial asset managemen t, sp eec h recognition and mac hine translation. Recurrent neural net works (RNN) and their v ariants, such as Long-Short T erm Memory (Hochreiter and Sc hmidhuber, 1997) and Gated Recurren t Unit (Cho et al., 2014), are commonly used as the default architecture or ev en the synon ym of sequence mo deling b y deep learning practitioners (Go o dfellow et al., 2016). In the meanwhile, esp ecially for high-dimensional time series, w e ma y also consider the autoregressiv e mo deling or m ulti-task learning, b y t = f ( y t − 1 , y t − 2 , . . . , y t − P ) , (1) where the output b y t and each input y t − i are N -dimensional, and the lag P can b e very large for accomo dating sequen tial dep endence. Some non-recurrent feed-forward net works with con v olutional or other certain arc hitectures ha ve been prop osed recently for sequence mo deling, and are sho wn to hav e state-of-the-art accuracy . F or example, some autoregressive net works, such as PixelCNN (V an den Oord et al., 2016b) and W a veNet (V an den Oord et al., 2016a) for image and audio sequence mo deling, are compelling alternativ es to the recurrent net works. This pap er aims at the autoregressiv e mo del (1) with a large n umber of sequences. This problem can b e implemen ted b y a fully connected netw ork with N P inputs and N outputs. The num b er of w eights will b e v ery large when the n umber of sequences N is large, and it will b e m uch larger if the data ha ve long-range sequen tial dep endence. This will lead to excessiv e computational burden and lo w learning efficiency . Recently , Du et al. (2018) sho w ed that the sample complexity in training a con v olutional neural netw ork (CNN) is directly related to net work complexit y , whic h indicates that compact models are highly desirable when a v ailable samples ha ve limited sizes. T o reduce the redundancy of parameters in neural net works, man y low-rank based ap- proac hes ha ve b een inv estigated. One is to reparametrize the mo del, and then to mo dify 2 the net work arc hitecture accordingly . Mo dification of architectures for model compression can b e found from the early history of neural net works (F ontaine et al., 1997; Gr´ ezl et al., 2007). F or example, a b ottlenec k la yer with a smaller n um b er of units can b e imp osed to constrain the amount of information trav ersing the netw ork, and to force a compact repre- sen tation of the original inputs in a multila y er p erceptron (MLP) or an auto enco der (Hinton and Salakh utdinov, 2006). The b ottlenec k architecture is equiv alen t to a fully connected net work with a lo w-rank constrain t on the weigh t matrix in a linear net work. Another approach is to directly constrain the rank of parameter matrices. F or instance, Denil et al. (2013) demonstrated significan t redundancy in large CNNs, and prop osed a lo w-rank structure of w eight matrices to reduce it. If w e treat w eigh ts in a la yer as a m ulti- dimensional tensor, tensor decomp osition metho ds can then b e emplo y ed to represent the lo w-rank structure, and hence compress the netw ork. Among these works, Leb edev et al. (2014) applied the CP decomp osition for the 4D kernel of a single conv olution lay er to sp eed up CNN, and Jaderb erg et al. (2014) prop osed to construct a low-rank basis of filters to exploit cross-c hannel or filter redundancy . Kim et al. (2016) utilized the T uck er decomp osi- tion to compress the whole netw ork b y decomposing con v olution and fully connected la y ers. The tensor train format was emplo yed in No vik o v et al. (2015) to reduce the parameters in fully connected la yers. Several tensor decomposition methods w ere also applied to compress RNNs (Tjandra et al., 2018; Y e et al., 2018; Pan et al., 2019). In spite of the empirical success of low-rank matrix and tensor approac hes in the literature, theoretical studies for learning efficiency are still limited. A fully connected autoregressiv e net w ork for (1) will hav e N 2 P w eigh ts, and it will reduce to N r + N P r for an MLP with one hidden la yer and r hidden units. The b ottlenec k arc hitec- ture still has too man y parameters and, more imp ortan tly , it do es not attempt to explore the p ossible compact structure along the sequen tial order. W e first simplify the autoregressive net work into a touc hable framew ork, by rearranging all w eights into a tensor. W e further apply T uc ker decomp osition to in tro duce a lo w-dimensional structure and translate it in to a compact autoregressiv e net work, called T uck er AutoRegressive (T AR) net. It is a sp ecial 3 compact CNN with interpretable architecture. Differen t from the original autoregressiv e net work, the T AR net is more suitable for sequences with long-range dep endence since the dimension along the sequen tial order is reduced. There are three main con tributions in this pap er: 1. W e inno v ativ ely tensorize weigh t matrices to create an extra dimension to accoun t for the sequen tial order and apply tensor decomposition to exploit the low-dimensional structure along all directions. Therefore, the resulting netw ork can handle sequences with long-range dep endence. 2. W e pro vide theoretical guidance on the sample complexit y of the prop osed netw ork. Our problem is more challenging than other sup ervised learning problems owing to the strong dep endency in sequen tial samples and the m ulti-task learning nature. Moreov er, our sample complexit y analysis can b e extended to other feed-forw ard net works. 3. The prop osed compact autoregressiv e net w ork can flexibly accommo date nonlinear mappings, and offer ph ysical interpretations b y extracting explainable laten t features. The rest of the pap er is organized as follows. Section 2 prop oses the linear autoregressive net works with lo w-rank structures and presents a sample complexit y analysis for the lo w- rank netw orks. Section 3 in tro duces the T uc ker autoregressive net b y reform ulating the single-la yer netw ork with low-rank structure to a compact multi-la yer CNN form. Extensive exp erimen ts on syn thetic and real datasets are presen ted in Section 4. Pro ofs of theorems and detailed information for the real dataset are pro vided in the App endix. 2 Linear Autoregressiv e Net w ork This section demonstrates the metho dology by considering a linear v ersion of (1), and the- oretically studies the sample complexit y of the corresp onding net work. 4 2.1 Preliminaries and Background 2.1.1 Notation W e follow the notations in Kolda and Bader (2009) to denote v ectors b y lo wercase b oldface letters, e.g. a ; matrices by capital b oldface letters, e.g. A ; tensors of order 3 or higher b y Euler script b oldface letters, e.g. A . F or a generic d th -order tensor A ∈ R p 1 ×···× p d , denote its elemen ts b y A ( i 1 , i 2 , . . . , i d ) and unfolding of A along the n -mode b y A ( n ) , where the columns of A ( n ) are the n -mo de v ectors of A , for n = 1 , 2 , . . . , d . The vectorization op eration is denoted by v ec( · ). The inner pro duct of tw o tensors A , B ∈ R p 1 ×···× p d is defined as h A , B i = P i 1 · · · P i d A ( i 1 , . . . , i d ) B ( i 1 , . . . , i d ). The F rob enius norm of a tensor A is defined as k A k F = p h A , A i . The mo de- n m ultiplication × n of a tensor A ∈ R p 1 ×···× p d and a matrix B ∈ R q n × p n is defined as ( A × n B )( i 1 , . . . , j n , . . . , i d ) = p n X i n =1 A ( i 1 , . . . , i n , . . . , i d ) B ( j n , i n ) , for n = 1 , . . . , d , resp ectiv ely . F or a generic symmetric matrix A , λ max ( A ) and λ min ( A ) represen t its largest and smallest eigenv alues, resp ectiv ely . 2.1.2 T uc ker decomp osition The T uc ker ranks of A are defined as the matrix ranks of the unfoldings of A along all mo des, namely rank i ( A ) = rank( A ( i ) ), i = 1 , . . . , d . If the T uck er ranks of A are r 1 , . . . , r d , where 1 ≤ r i ≤ p i , there exist a tensor G ∈ R r 1 ×···× r d and matrices U i ∈ R p i × r i , suc h that A = G × 1 U 1 × 2 U 2 · · · × d U d , (2) whic h is known as T uck er decomp osition (T uck er, 1966), and denoted by A = [ [ G ; U 1 , U 2 , . . . , U d ] ]. With the T uck er decomp osition (2), the n -mode matricization of A can b e written as A ( n ) = U n G ( n ) ( U d ⊗ · · · ⊗ U n +1 ⊗ U n − 1 ⊗ · · · ⊗ U 1 ) > , where ⊗ denotes the Kronec ker product for matrices. 5 A 1 A 2 A 3 A P · · · A 1 A P . . . . . . tenso rization matricization Figure 1: Rearranging P w eight matrices of a linear autoregressiv e net work in to a tensor. 2.2 Linear Autoregressiv e Net w ork Consider a linear autoregressiv e netw ork, h t = A 1 y t − 1 + A 2 y t − 2 + · · · + A t − P y t − P + b , where h t = b y t is the output, A i s are N × N w eight matrices, and b is the bias v ector. Let x t = ( y > t − 1 , . . . , y > t − P ) > b e the N P -dimensional inputs. W e can rewrite it into a fully connected net work, h t = W x t + b , (3) for t = 1 , . . . , T , where W = ( A 1 , ..., A P ) ∈ R N × N P is the weigh t matrix. Note that T denotes the effectiv e sample size, whic h is the num b er of samples for training. In other w ords, the total length of the sequential data is T + P . T o reduce the dimension of W , a common strategy is to constrain the rank of W to b e r , which is muc h smaller than N . The low-rank w eight matrix W can be factorized as W = AB , where A is a N × r matrix and B is a r × N P matrix, and the fully connected net work can be transformed into h t = AB x t + b . (4) The matrix factorization reduces the num b er of parameters in W from N 2 P to N r + N P r . Ho wev er, if b oth N and P are large, the w eight matrix B is still of large size. W e alternativ ely rearrange the w eigh t matrices A i s into a 3 rd -order tensor W ∈ R N × N × P suc h that W (1) = W ; see Figure 1 for the illustration. The T uck er decomp osition can then 6 b e applied to reduce the dimension from three mo des simultaneously . If the lo w-T uck er-rank structure is applied on W with ranks r 1 , r 2 , r 3 , the net work becomes h t = U 1 G (1) ( U 3 ⊗ U 2 ) > x t + b , (5) b y T uck er decomp osition W = [ [ G ; U 1 , U 2 , U 3 ] ]. The T uck er decomp osition further reduces the dimension from the other tw o mo des of low-rank structure in (4), while the low-rankness of W only considers the lo w-dimensional structure on the 1-mo de of W but ignores the p ossible compact structure on the other t w o mo des. W e train the netw ork based on the squared loss. F or simplicit y , eac h sequence is sub- tracted b y its mean, so the bias v ector b can b e disregarded. The weigh t matrix or tensor in (3), (4) and (5) can b e trained, resp ectiv ely , b y minimizing the following ordinary least squares (OLS), lo w-rank (LR) and low-T uc ker-rank (L TR) ob jectiv e functions, c W OLS = arg min W 1 T T X t =1 k y t − W x t k 2 2 , c W LR = b A b B = arg min A , B 1 T T X t =1 k y t − AB x t k 2 2 , c W L TR = [ [ b G ; b U 1 , b U 2 , b U 3 ] ] = arg min G , U 1 , U 2 , U 3 1 T T X t =1 k y t − U 1 G (1) ( U 3 ⊗ U 2 ) > x t k 2 2 . These three minimizers are called OLS, LR and L TR estimators of weigh ts in the linear autoregressiv e netw ork, resp ectiv ely . The matrix factorization or tensor T uck er decomp osition is not unique. Con ven tionally , orthogonal constrain ts can b e applied to these comp onen ts to address the uniqueness issue. Ho wev er, w e do not imp ose an y constrain ts on the comp onents to simplify the optimization and mainly fo cus on the whole w eigh t matrix or tensor instead of its decomposition. 2.3 Sample Complexit y Analysis The sample complexity of a neural netw ork is defined as the training sample size requiremen t to obtain a certain training error with a high probability , and is a reasonable measure of learning efficiency . W e conduct a sample complexit y analysis for the three estimators, c W OLS , 7 c W LR and c W L TR , under the high-dimensional setting b y allo wing b oth N and P to grow with the sample size T at arbitrary rates. W e further assume that the sequence { y t } is generated from a linear autoregressiv e pro cess with additiv e noises, y t = A 1 y t − 1 + A 2 y t − 2 + · · · + A t − P y t − P + e t . (6) Denote by W 0 = ( A 1 , A 2 , . . . , A P ) the true parameters in (6) and by W 0 the corresp onding folded tensor. W e assume that W 0 has T uck er ranks r 1 , r 2 and r 3 , and require the follo wing conditions to hold. Condition 1. A l l r o ots of matrix p olynomial | I N − A 1 z − · · · − A P z P | = 0 ar e outside unit cir cle. Condition 2. The err ors { e t } is a se quenc e of indep endent Gaussian r andom ve ctors with me an zer o and p ositive definite c ovarianc e matrix Σ e , and e t is indep endent of the historic al observations y t − 1 , y t − 2 , · · · . Condition 1 is sufficien t and necessary for the strict stationarit y of the linear autoregres- siv e process. The Gaussian assumption in Condition 2 is v ery common in high-dimensional time series literature for tec hnical conv enience (Basu and Mic hailidis, 2015). Multiple sequence data ma y exhibit strong temp oral and in ter-sequence dep endence. T o analyze how dep endence in the data affects the learning efficiency , we follo w Basu and Mic hailidis (2015) to use the sp ectral measure of dep endence b elo w. Definition 1. Define the matrix p olynomial A ( z ) = I N − A 1 z − · · · − A P z P , wher e z is any p oint on the c omplex plane, and define its extr eme eigenvalues as µ min ( A ) := min | z | =1 λ min ( A ∗ ( z ) A ( z )) , µ max ( A ) := max | z | =1 λ max ( A ∗ ( z ) A ( z )) , wher e A ∗ ( z ) is the Hermitian tr ansp ose of A ( z ) . 8 By Condition 1, the extreme eigen v alues are b ounded aw a y from zero and infinity , 0 < µ min ( A ) ≤ µ max ( A ) < ∞ . Based on the sp ectral measure of dep endence, we can deriv e the non-asymptotic statistical con v ergence rates for the LR and L TR estimators. Note that C denotes a generic p ositive constant, which is independent of dimension and sample size, and ma y represen t differen t v alues ev en on the same line. F or any p ositiv e num b er a and b , a . b and a & b denote that there exists C such that a < C b and a > C b , resp ectiv ely . Theorem 1. Supp ose that Conditions 1-2 ar e satisfie d, and the sample size T & r 1 r 2 r 3 + N r 1 + N r 2 + P r 3 . With pr ob ability at le ast 1 − exp[ − C ( r 1 r 2 r 3 + N r 1 + N r 2 + P r 3 )] − exp( − C √ T ) , k c W L TR − W 0 k F . M r r 1 r 2 r 3 + N r 1 + N r 2 + P r 3 T , wher e M := [ λ max ( Σ e ) µ max ( A )] / [ λ min ( Σ e ) µ 1 / 2 min ( A )] is the dep endenc e me asur e c onstant. Theorem 2. Supp ose that Conditions 1-2 ar e satisfie d, r ≥ r 1 and the sample size T & r ( N + N P ) . With pr ob ability at le ast 1 − exp[ − C r ( N + N P ))] − exp( − C √ T ) , k c W LR − W 0 k F . M r r ( N + N P ) T . The pro ofs of Theorems 1 and 2 are provided in the supplemen tal material. The ab o ve tw o theorems presen t the non-asymptotic conv ergence upper b ounds for L TR and LR estimators, resp ectiv ely , with probabilit y tending to one as the dimension and sample size gro w to infinity . Both upp er b ounds take a general form of M p d/T , where M captures the effect from dep endence across x t , and d denotes the num b er of parameters in T uck er decomp osition or matrix factorization. F rom Theorems 1 and 2, w e then can establish the sample complexity for these t wo estimators accordingly . Theorem 3. F or a tr aining err or > 0 , if the c onditions of The or em 1 hold, then the sample c omplexity is T & ( r 1 r 2 r 3 + N r 1 + N r 2 + P r 3 ) / 2 for the L TR estimator to achieve k c W L TR − W 0 k F ≤ . Mor e over, if the c onditions of The or em 2 hold, then the sample c omplexity is T & r ( N + N P ) / 2 for the LR estimator to achieve k c W LR − W 0 k F ≤ . 9 Remark 1. The OLS estimator c an b e shown to have the c onver genc e r ate of O ( p N 2 P /T ) , and its sample c omplexity is N 2 P / 2 for a tr aining err or > 0 and k c W OLS − W 0 k F ≤ . The sample complexity for the linear autoregressiv e net w orks with different structures is prop ortional to the corresp onding mo del complexity , i.e. sample complexity is O ( M d/ε 2 ). Compared with the OLS estimator, the LR and L TR estimators b enefit from the compact lo w-dimensional structure and ha v e smaller sample complexit y . Among the three linear autoregressiv e net works, the L TR netw ork has the most compact structure, and hence the smallest sample complexit y . Remark 2. F or the gener al sup ervise d le arning tasks r ather than se quenc e mo deling, the upp er b ound in The or ems 1 and 2 c an b e extende d to the c ase with indep endent and identic al ly distribute d x t , wher e M is r eplac e d by the inverse of signal-to-noise r atios. The sample complexit y analysis of the autoregressiv e netw orks can b e extended to the general feed-forward net works, and explains why the low-rank structure can enhance the learning efficiency and reduce the sample complexit y . 3 T uc k er Autoregressiv e Net This section in tro duces a compact autoregressiv e netw ork by form ulating the linear autore- gressiv e net w ork with the low-T uc ker-rank structure (5), and it has a compact multi-la yer CNN arc hitecture. W e call it the T uck er AutoRegressiv e (T AR) net for simplicity . 3.1 Net w ork Arc hitecture Rather than directly constraining the matrix rank or T uck er ranks of w eigh ts in the zero- hidden-la yer netw ork, w e can modify the netw ork arc hitecture b y adding con volutional lay ers and fully connected la yers to exploit lo w-rank structure. By some algebra, the framew ork (5) can b e rewritten in to h t = U 1 G (1) v ec( U > 2 X t U 3 ) + b , 10 Sym b ol La yer Con tent and explanation Dimensions No. of parameters INPUT - design matrix N × P - C1 N × 1 conv olutions r 2 feature maps 1 × P N r 2 C2 1 × P con volutions r 2 r 3 feature maps 1 × 1 P r 3 F1 full connection resp onse factor loadings r 1 × 1 r 1 r 2 r 3 OUTPUT full connection output prediction N × 1 N r 1 T able 1: Sp ecification of CNN structure in T AR net. where X t = ( y t − 1 , . . . , y t − P ). A direct translation of the lo w-T uck er-rank structure leads to a multi-la y er conv olutional netw ork architecture with tw o con v olutional la yers and t w o fully connected la yers; see Figure 2 and T able 1. Figure 2: CNN structure of T AR net. T o b e sp ecific, each column in U 2 is a N × 1 con volution and the first lay er outputs r 2 1 × P feature maps. Similarly , U 3 represen ts the conv olution with kernel size 1 × P and r 3 c hannels. These tw o con volutional lay ers wor k as an enco der to extract the r 2 r 3 - dimensional representation of the N × P input X t for predicting y t . Next, a full connection from r 2 r 3 predictor features to r 1 output features with w eights G (1) is follow ed. Finally , a fully connected la yer serv es as a deco der to N ouputs with w eights U 1 . The neural net w ork architectures corresp onding to the lo w-rank estimator c W LR and or- 11 dinary least squares estimator without lo w-dimensional structure c W OLS are the one-hidden- la yer MLP with a b ottlenec k lay er of size r and the zero-hidden-lay er fully connected net work, resp ectiv ely . The CNN represen tation in Figure 2 has a compact arc hitecture with r 1 r 2 r 3 + N r 1 + N r 2 + P r 3 parameters, whic h is the s ame as that of the T uc k er decomp osition. Compared with the b enc hmark mo dels, namely the one-hidden-la yer MLP (MLP-1) and zero-hidden-lay er MLP (MLP-0), the introduced low-T uck er-rank structure increases the depth of the netw ork while reduces the total num b er of w eights. When the T uck er ranks r 1 , r 2 , r 3 are small, the total num b er of parameters in our net work is muc h smaller than those of the b enchmark net works, whic h are r ( N + N P ) and N 2 P , respectively . T o capture the complicated and non-linear functional mapping betw een the prior inputs and future resp onses, non-linear activ ation functions, such as rectified linear unit (ReLU) or sigmoid function, can b e added to eac h lay er in the compact autoregressiv e net work. Hence, the additional depth from transforming a low-T uc ker-rank single la yer to a multi- la yer conv olutional structure enables the net w ork to better approximate the target function. The linear netw ork without activ ation in the previous section can b e called linear T AR net (L T AR). 3.2 Separable Con volutiona l Kernels Separable conv olutions hav e b een extensively studied to replace or appro ximate large con- v olutional kernels by a series of smaller kernels. F or example, this idea was explored in m ultiple iterations of the Inception blo c ks (Szegedy et al., 2015, 2016, 2017) to decomp ose a con volutional la y er with a 7 × 7 k ernel in to that with 1 × 7 and 7 × 1 k ernels. T ensor decomp osition is an effectiv e metho d to obtain separable k ernels. In our T AR net, these tw o conv olutional lay ers extract the information from inputs along the column-wise direction and row-wise direction separately . Compared with the lo w-rank matrix structure, the additional decomp osition in the T uc k er decomp osition along the second and third mo des in fact segregates the full-sized con volutional k ernel in to r 2 r 3 pairs of separable k ernels. 12 3.3 Tw o-Lane Netw ork If no activ ation function is added, the first t wo ro w-wise and column-wise con v olutional la y ers are exc hangeable. How ev er, exc hanging these t wo lay ers with nonlinear activ ation functions can result in differen t nonlinear approximation and physical in terpretation. F or the general case where w e ha v e no clear preference on the order of these t w o la yers, w e consider a t wo-lane net work v ariant, called T AR-2 netw ork, by in tro ducing b oth structures in to our mo del in parallel follo wed by an av erage p o oling to enhance the flexibility; see Figure 3. N × P (a) r 3 × 1 × P r 2 × N × 1 r 2 r 3 × r 1 r 1 × N N × 1 N × P (b) r 3 × 1 × P r 2 × N × 1 r 2 r 3 × r 1 r 1 × N N × 1 ReLU ReLU ReLU ReLU N × P (c) r 3 × 1 × P r 2 × N × 1 r 2 r 3 × r 1 r 1 × N N × 1 r 3 × 1 × P r 2 × N × 1 r 2 r 3 × r 1 r 1 × N N × 1 Combine ReLU ReLU ReLU ReLU ReLU ReLU ReLU ReLU Figure 3: Structures of L T AR net (a), T AR net (b) and T AR-2 net (c). 3.4 Implemen tation 3.4.1 Details W e implement our framew ork on PyT orc h, and the Mean Squared Error (MSE) is the target loss function. The gradien t descen t metho d is employ ed for the optimization with learning rate and momentum b eing 0 . 01 and 0 . 9, resp ectiv ely . If the loss function drops b y less than 10 − 8 , the pro cedure is then deemed to ha v e reac hed conv ergence. 13 3.4.2 Hyp erparameter tuning In the T AR net, the sequential dependence range P and the T uc k er ranks r 1 , r 2 and r 3 are presp ecified h yp erparameters. Since cross-v alidation cannot b e applied to sequence mo del- ing, w e suggest tuning hyperparameters by grid searc h and rolling forecasting p erformance. 4 Exp erimen ts This section first p erforms analysis on t wo synthetic datasets to verify the sample complexit y established in Theorem 3 and to demonstrate the capabilit y of T AR nets in nonlinear func- tional appro ximation. A US macro economic dataset Ko op (2013) is then analyzed b y the T AR-2 and T AR nets, together with their linear coun terparts. F or the sake of comparison, some benchmark netw orks, including MLP-0, MLP-1, Recurren t Neural Netw ork (RNN) and Long Short-T erm Memory (LSTM), are also applied to the dataset. 4.1 Numerical Analysis for Sample Complexit y 4.1.1 Settings In T AR net or the lo w-T uck er-rank framework (5), the h yp erparameters, r 1 , r 2 and r 3 , are of significan tly smaller magnitude than N or P , and are equally set to 2 or 3. As sample complexit y is of prime interest rather than the range of sequen tial dep endence, w e let P equal to 3 , 5 or 8. F or eac h com bination of ( r 1 , r 2 , r 3 , P ), w e consider N = 9 , 25 and 36, and the sample size T is chosen suc h that p N /T = (0 . 15 , 0 . 25 , 0 . 35 , 0 . 45). 4.1.2 Data generation W e first generate a core tensor G ∈ R r 1 × r 2 × r 3 with entries b eing independent standard normal random v ariables, and then rescale it such that the largest singular v alue of G (1) is 0 . 9. F or eac h 1 ≤ i ≤ 3, the leading r i singular vectors of random standard Gaussian matrices are used to form U i . The weigh t tensor W 0 can thereby b e reconstructed, and it is further 14 rescaled to satisfy Condition 1. W e generate 200 sequences with iden tical W 0 . The first 500 sim ulated data p oin ts at eac h sequence are discarded to alleviate the influence of the initial v alues. W e apply the MLP-0, MLP-1 and L T AR to the syn thetic dataset. The a v eraged estimation errors for the corresp onding OLS, LR, and L TR estimators are pre sen ted in Figure 4. 4.1.3 Results The x -axis in Figure 4 represents the ratio of p N /T , and the y -axis represents the av eraged estimation error in F rob enius norm. Along eac h line, as N is set to b e fixed, w e obtain differen t p oin ts b y readjusting the sample size T . Roughly speaking, regardless of the mo dels and parameter settings, estimation error increases with v arying rates as the sample size decreases. The rates for OLS rapidly b ecome explosiv e, follow ed by LR, whereas L TR remains appro ximately linear, which is consisten t with our findings at Theorem 3. F urther observ ation rev eals that the increase in P predominantly accelerates the rates for OLS and LR, but app ears to hav e insignifican t influence on the estimation error from L TR. F or the case with P = 8, instabilit y of the estimation error manifests itself in LR under insufficien t sample size, sa y when p N /T is as large as 0 . 35. This further provides the rationale for dimension reduction along sequential order. When p N /T = 0 . 45, the solution is not unique for b oth OLS and LR, and consequen tly , these p oints are not sho wn in the figure. 4.2 Numerical Analysis for Nonlinear Appro ximation 4.2.1 Settings The target of this exp erimen t is to compare the expressiv eness of L T AR, T AR and T AR-2 nets. The conjecture is that, regardless of the data generating pro cess, T AR-2 and T AR nets under the same hyperparameter settings as the L T AR net w ould hav e an elev ated ability to capture nonlinear features. W e set ( r 1 , r 2 , r 3 , N , P ) = (2 , 2 , 2 , 25 , 3), and ha ve also tried 15 sev eral other combinations. Similar findings can b e observ ed, and the results are hence omitted here. 4.2.2 Data generation Tw o data generating pro cesses are considered to create sequences with either strictly linear or highly nonlinear features in the embedding feature space. W e refer to them as L-DGP and NL-DGP , resp ectiv ely . L-DGP is achiev ed b y randomly assigning w eights to L T AR lay ers and producing a recursiv e sequence with a given initial input matrix. NL-DGP is attained through imposing a nonlinear functional transformation to the lo w-rank hidden la y er of an MLP . In detail, w e first transformed a N × P matrix to a r 1 × r 2 lo w-rank enco der. Then, w e applied a nonlinear mapping f ( · ) = cos(1 / k · k F ) to the enco der, b efore going through a fully connected la yer to retriev e an output of size N × 1. 4.2.3 Implemen tation & Ev aluation In this exp erimen t, w e use L-DGP and NL-DGP to separately generate 200 data sequences whic h are fitted by T AR-2, T AR and L T AR nets. The sequence lengths are chosen to be either 101 or 501. F or eac h sequence, the last data point is retained as a single test p oint, whereas the rest are used in mo del training. W e adopt three ev aluation metrics, namely , the a veraged L 2 norm b et w een prediction and true v alue, the standard Ro ot-Mean-Square Error (RMSE), and Mean Absolute Error (MAE). The results are giv en in T able 2. 4.2.4 Results When the data generating pro cess is linear (L-DGP), the L T AR net reasonably excels in comparison to the other t wo, obtaining the smallest L 2 -norm, RMSE and MAP . T AR-2 yields p o orer results for a small sample size of 100 due to p ossible o verparametrization. Ho wev er, its elev ated expressiv eness leads it to outp erform T AR when T = 500. F or nonlinear data generating pro cess (NL-DGP), as w e exp ect, the T AR-2 and T AR nets with nonlinear structure outp erform the L T AR net. In the meanwhile, as the exchangeabilit y 16 of laten t features holds, the T AR-2 net seems to suffer from model redundancy and thereby p erforms w orse than the T AR net. 4.3 US Macro economic Dataset 4.3.1 Dataset W e use the dataset pro vided in Ko op (2013) with 40 US macro economic v ariables. They co ver v arious aspects of financial and industrial activities, including consumption, production indices, stock market indicators and the in terest rates. The data series are taken quarterly from 1959 to 2007 with a total of 194 observ ed time p oin ts. In the prepro cessing step, the series were transformed to b e stationary b efore b eing standardized to ha v e zero mean and unit v ariance; details see the supplemental material. DGP T Net work L 2 -norm RMSE MAP L-DGP 100 T AR-2 5.5060 1.1238 0.8865 T AR 5.4289 1.0998 0.8702 L T AR 5.1378 1.0388 0.8265 500 T AR-2 5.1836 1.0493 0.8369 T AR 5.2241 1.0585 0.8436 L T AR 4.9338 0.9972 0.7936 NL-DGP 100 T AR-2 5.2731 1.0703 0.8579 T AR 5.2710 1.0712 0.8510 L T AR 5.3161 1.0738 0.8573 500 T AR-2 5.0084 1.0111 0.8062 T AR 5.0036 1.0110 0.8060 L T AR 5.0144 1.0126 0.8087 T able 2: Performance of different net works on fitting L-DGP and NL-DGP datasets. 17 Figure 4: Exp erimen t on sample complexit y . Results are shown for OLS ( ), LR ( ) and L TR ( ) estimators. Three different v alues of N are presented b y different mark ers: N = 9 ( • ), N = 25 ( H ) and N = 36 (+). W e set ( r 1 , r 2 , r 3 ) = (2 , 2 , 2) for the three subplots in the left column and ( r 1 , r 2 , r 3 ) = (3 , 3 , 3) for subplots in the right column. And the upp er, middle and lo wer panels refer to cases with P = 3 , 5 and 9, resp ectively . 18 4.3.2 Mo dels for comparison F or the sak e of comparison, b esides the proposed mo dels, T AR-2, T AR and L T AR, we also consider four other commonly used netw orks in the literature with well-tuned hyperparame- ters. The first tw o are the previously men tioned MLP-0 and MLP-1. The remaining t w o are RNN and LSTM, which are tw o traditional sequence mo deling frameworks. RNN implies an autoregressiv e moving av erage framew ork and can transmit extra useful information through the hidden la y ers. It is hence exp ected to outp erform an autoregressiv e net work. LSTM ma y b e more susceptible to small sample size. As a result, RNN and LSTM with the optimal tuning h yp erparameter serve as our b enchmarks. 4.3.3 Implemen tation F ollowing the settings in Ko op (2013), w e set P = 4. Consisten tly , the sequence length in b oth RNN and LSTM is fixed to b e 4, and w e consider only one hidden la y er. The num b er of neurons in the hidden la yer is treated as a tunable h yp erparameter. T o b e on an equal fo oting with our mo del, the size of the hidden lay er in MLP-1 is set to 4. W e further set r 1 = 4, r 2 = 3 and r 3 = 2. The bias terms are added back to the T AR-2, T AR and L T AR nets for expansion of the mo del space. The dataset is segregated into tw o subsets: the first 104 time points of eac h series are used as the training samples with an effective sample size of 100, whereas the rolling forecast pro cedure is applied to the rest 90 test samples. F or each netw ork, one-step-ahead forecasting is carried out in a recursiv e fashion. In other words, the trained netw ork predicts one future step, and immediately includes the new observ ation for the prediction of the next step. The a veraged L 2 -norm, RMSE and MAP are used as the ev aluation criteria. 4.3.4 Results F rom T able 3, the prop osed T AR-2 and T AR nets rank top tw o in terms of one-step-ahead rolling forecast performance, exceeding the fine-tuned RNN model with the size of the hidden la yer equal to one. The tw o-lane net work T AR-2 clearly outp erforms the one-lane net w ork 19 Net work L 2 -norm RMSE MAE MLP-0 11.126 1.8867 1.3804 MLP-1 7.8444 1.3462 1.0183 RNN 5.5751 0.9217 0.7064 LSTM 5.8274 0.9816 0.7370 L T AR 5.5257 0.9292 0.6857 T AR 5.4675 0.9104 0.6828 T AR-2 5.4287 0.8958 0.6758 T able 3: Performance comparison on US macro economic dataset. T AR emphasizing its abilit y to capture non-exc hangeable laten t features. According to our exp erimen ts, the p erformance of both RNN and LSTM deteriorates as the dimension of the hidden la yer increases, whic h indicates that o verfitting is a serious issue for these tw o predominate sequence mo deling techniques. Figure 5 plots the forecast v alues against the true v alues of the v ariables “SEYGT10” (the spread b etw een 10-yrs and 3-mths treasury bill rates) for the T AR-2 net and the RNN mo del. It can b e seen that T AR-2 sho ws strength in capturing the pattern of p eaks and troughs, and hence resem bles the truth more closely . 20 Figure 5: Rolling forecasting for the v ariable “SEYGT10”. The solid line ( ), the dashed line ( ) and the dash-dotted line ( ) represen t true v alue, predictions from T AR-2 and RNN, resp ectiv ely . 5 Conclusion and Discussion This pap er rearranges the w eights of an autoregressiv e net work into a tensor, and then makes use of the T uck er decomp osition to introduce a low-dimensional structure. A compact au- toregressiv e netw ork is hence prop osed to handle the sequences with long-range dep endence. Its sample complexity is also studied theoretically . The prop osed netw ork can achiev e b et- ter prediction performance on a macroeconomic dataset than some state-of-the-art methods including RNN and LSTM. F or future research, this work can b e improv ed in three directions. First, our sample complexit y analysis is limited to linear models, and it is desirable to extend the analysis to net works with nonlinear activ ation functions. Secondly , the dilated con volution, prop osed b y W av eNet V an den Oord et al. (2016a), can reduce the con volutional kernel size along the sequen tial order, and hence can efficiently access the long-range historical inputs. This structure can b e easily incorp orated in to our framework to further compress the net work. Finally , a deep er autoregressiv e net work can b e constructed b y adding more lay ers in to the curren t netw ork to enhance the expressiv eness of nonlinearity . A T ec hnical Pro ofs of Theorems 1 and 2 A.1 Pro ofs of Theorems W e first pro v e the statistical con vergence rate for c W L TR and denote it as c W for simplicit y . The main ideas of the pro of come from Raskutti et al. (2019). 21 Denote ∆ = c W − W 0 , then b y the optimality of the L TR estimator, 1 T T X t =1 k y t − c W (1) x t k 2 2 ≤ 1 T T X t =1 k y t − W 0 x t k 2 2 ⇒ 1 T T X t =1 k ∆ (1) x t k 2 2 ≤ 2 T T X t =1 h e t , ∆ (1) x t i ⇒ 1 T T X t =1 k ∆ (1) x t k 2 2 ≤ 2 T * T X t =1 e t ◦ X t , ∆ + , where ◦ denotes the tensor outer product. Since the T uck er ranks of b oth c W and W are ( r 1 , r 2 , r 3 ), the T uck er ranks of ∆ are at most (2 r 1 , 2 r 2 , 2 r 3 ). Denote the set of tensor S ( r 1 , r 2 , r 3 ) = { W ∈ R N × N × P : k W k F = 1 , rank i ( W ) ≤ r i , i = 1 , 2 , 3 } . Then, w e ha ve 1 T T X t =1 k ∆ (1) x t k 2 2 ≤ 2 k ∆ k F sup W ∈S (2 r 1 , 2 r 2 , 2 r 3 ) * 1 T T X t =1 e t ◦ X t , W + . Giv en the restricted strong conv exity condition, namely α RSC k ∆ k 2 F ≤ T − 1 P T t =1 k ∆ (1) x t k 2 2 , w e can obtain an upp er b ound, k ∆ k F ≤ 2 α RSC sup W ∈S (2 r 1 , 2 r 2 , 2 r 3 ) * 1 T T X t =1 e t ◦ X t , W + . Since y t is a strictly-stationary V AR pro cess, w e can easily c heck that it is a β -mixing pro cess. Denote the unconditional cov ariance matrix of x t as Σ x . Let m t = Σ − 1 / 2 x x t and M t ∈ R N × P b e the corresp onding matrix from m t . By sp ectral measure (Basu and Mic hailidis, 2015, Prop osition 2.3), the largest eigen v alue of Σ x is upp er b ounded, namely λ max ( Σ x ) ≤ 2 π M ( f X ) ≤ λ max ( Σ e ) /µ min ( A ). Therefore, conditioning on all ( e t )’s, w e hav e P ( sup W ∈S (2 r 1 , 2 r 2 , 2 r 3 ) 1 T T X t =1 h e t ◦ X t , W i > x ) ≤ P ( sup W ∈S (2 r 1 , 2 r 2 , 2 r 3 ) 1 T T X t =1 h e t ◦ M t , W i > s µ min ( A ) λ max ( Σ e ) x ) . Denote M = ( m 1 , . . . , m T ) and denote m ( i ) as the i -th ro w of M . F urther, if we condi- tion on { M t } , since e t is a sequence of iid random vectors with mean zero and cov ariance 22 Σ e , for an y x > 0, P ( sup W ∈S (2 r 1 , 2 r 2 , 2 r 3 ) 1 T T X t =1 h e t ◦ M t , W i > x ) ≤ P ( sup W ∈S (2 r 1 , 2 r 2 , 2 r 3 ) max 1 ≤ j ≤ N P r k m ( j ) k 2 2 T r λ max ( Σ e ) T h N , W i > x ) , where N ∈ R N × N × P is a random tensor with i.i.d. standard normal en tries. Since m ( j ) is a sequence of β -mixing random v ariables with mean zero and unit v ariance, b y Lemma A.3, for each j , there exists some constan t C and c > 0, suc h that P k m ( j ) k 2 2 T ≥ 4 ≤ C √ T exp( − c √ T ) . T aking a union b ound, if √ T & log ( N P ), we ha v e P max 1 ≤ j ≤ N P k m ( j ) k 2 √ T ≤ 2 ≥ 1 − C exp[ c (log( T ) + log( N P ) − √ T )] ≥ 1 − C exp( − c √ T ) . Therefore, w e hav e P " sup W ∈S (2 r 1 , 2 r 2 , 2 r 3 ) 1 T T X t =1 h e t ◦ X t , W i > x # ≤ P " sup W ∈S (2 r 1 , 2 r 2 , 2 r 3 ) 1 T T X t =1 h e t ◦ M t , W i > s µ min ( A ) λ max ( Σ e ) x # ≤ P " sup W ∈S (2 r 1 , 2 r 2 , 2 r 3 ) 2 r λ max ( Σ e ) T h N , W i ≥ s µ min ( A ) λ max ( Σ e ) x # + C exp( − c √ T ) = P " sup W ∈S (2 r 1 , 2 r 2 , 2 r 3 ) 1 √ T h N , W i ≥ p µ min ( A ) x 2 λ max ( Σ e ) # + C exp( − c √ T ) . F or any fixed W ∈ S (2 r 1 , 2 r 2 , 2 r 3 ), it can be chec k ed that h N , W i ∼ N (0 , 1). Hence, there exists a constan t C such that for an y t > 0 P [ h N , A i ≥ t ] ≤ exp( − C t 2 ) . Consider a -net S (2 r 1 , 2 r 2 , 2 r 3 ) for S (2 r 1 , 2 r 2 , 2 r 3 ). Then, for an y W ∈ S (2 r 1 , 2 r 2 , 2 r 3 ), there exists a W ∈ S (2 r 1 , 2 r 2 , 2 r 3 ) suc h that k W − W k F ≤ . Note that the m ultilinear ranks of ∆ = W − W are at most (4 r 1 , 4 r 2 , 4 r 3 ). As shown in Figure 6, w e can split the higher 23 Figure 6: Splitting HOSVD order singular v alue decomp osition (HOSVD) of ∆ in to 8 parts suc h that ∆ = P 8 i =1 ∆ i suc h that rank j ( ∆ i ) ≤ 2 r j for i = 1 , . . . , 8 and j = 1 , 2 , 3, and h ∆ j , ∆ k i = 0 for an y j 6 = k . Note that h N , W i = h N , W i + 8 X i =1 h N , ∆ i i = h N , W i + 8 X i =1 h N , ∆ i / k ∆ i k F ik ∆ i k F . Since eac h ∆ i / k ∆ i k F ∈ S (2 r 1 , 2 r 2 , 2 r 3 ), h N , ∆ i / k ∆ i k F i ≤ sup A ∈S (2 r 1 , 2 r 2 , 2 r 3 ) h N , A i . Since k ∆ k 2 F = P 8 i =1 k ∆ i k 2 F , by Cauc hy inequalit y , P 8 i =1 k ∆ i k F ≤ 2 √ 2 k ∆ k F ≤ 2 √ 2 . Hence, w e hav e γ := sup W ∈S (2 r 1 , 2 r 2 , 2 r 3 ) h N , W i ≤ max W ∈S (2 r 1 , 2 r 2 , 2 r 3 ) h N , W i + 2 √ 2 γ . In other w ords, sup W ∈S (2 r 1 , 2 r 2 , 2 r 3 ) h N , W i ≤ (1 − 2 √ 2 ) − 1 max W ∈S (2 r 1 , 2 r 2 , 2 r 3 ) h N , W i . 24 Therefore, w e hav e P " sup W ∈S (2 r 1 , 2 r 2 , 2 r 3 ) 1 √ T h N , W i ≥ p µ min ( A ) x 2 λ max ( Σ e ) # ≤ P " max W ∈S (2 r 1 , 2 r 2 , 2 r 3 ) 1 √ T h N , W i ≥ (1 − 2 √ 2 ) p µ min ( A ) x 2 λ max ( Σ e ) # ≤|S (2 r 1 , 2 r 2 , 2 r 3 ) | · P " h N , W i ≥ (1 − 2 √ 2 ) p T µ min ( A ) x 2 λ max ( Σ e ) # ≤ exp " log( |S (2 r 1 , 2 r 2 , 2 r 3 ) | ) − C (1 − 2 √ 2 ) 2 T µ min ( A ) x 2 λ 2 max ( Σ e ) # . By Lemma A.1, |S ( r 1 , r 2 , r 3 ) | ≤ (12 / ) 8 r 1 r 2 r 3 +2 N r 1 +2 N r 2 +2 P r 3 . W e can tak e = 1 / 10 and x = C √ r 1 r 2 r 3 + N r 1 + N r 2 + P r 3 λ max ( Σ e ) T − 1 / 2 µ − 1 / 2 min ( A ), and then obtain that P " sup W ∈S (2 r 1 , 2 r 2 , 2 r 3 ) 1 T T X t =1 h e t ◦ X t , W i ≥ C λ max ( Σ e ) µ 1 / 2 min ( A ) r r 1 r 2 r 3 + N r 1 + N r 2 + P r 3 T # ≤ 1 − exp[ − C ( r 1 r 2 r 3 + N r 1 + N r 2 + P r 3 )] − exp( − C √ T ) . Finally , b y Lemma A.2, the restricted conv exit y condition holds for α RSC = λ min ( Σ e ) / (2 µ max ( A )), with probability at least 1 − C exp[ − c ( r 1 r 2 r 3 + N r 1 + N r 2 + P r 3 )], which concludes the pro of of c W L TR . Similarly , we can obtain the error upp er b ound for c W L T b y replacing the co v ering num b er of low-T uc k er-rank tensors to that of lo w-rank matrices, and the co v ering n umber of lo w-rank matrices are in vestigated b y Candes and Plan (2011). A.2 Three Lemmas Used in the Pro ofs of Theorems Lemma A.1. (Covering numb er of low-multiline ar-r ank tensors) The -c overing numb er of the set S ( r 1 , r 2 , r 3 ) := { T ∈ R p 1 × p 2 × p 3 : k T k F = 1 , rank i ( T ( i ) ) ≤ r i , i = 1 , 2 , 3 } is |S ( r 1 , r 2 , r 3 ) | ≤ (12 / ) r 1 r 2 r 3 + p 1 r 1 + p 2 r 2 + p 3 r 3 . Pr o of. The pro of hinges on the co vering num b er for the low-rank matrix studied by Candes and Plan (2011). 25 Recall the HOSVD T = [ [ G ; U 1 , U 2 , U 3 ] ], where k T k F = 1 and each U i is an orthonormal matrix. W e construct an -net for T by cov ering the set of G and all U i ’s. W e tak e G to b e an / 4-net for G with | G | ≤ (12 / ) r 1 r 2 r 3 . Next, let O n,r = { U ∈ R n × r : U > U = I r } . T o co ver O n,r , it is b eneficial to use the k · k 1 , 2 norm, defined as k X k 1 , 2 = max i k X i k 2 , where X i denotes the i th column of X . Let Q n,r = { X ∈ R n × r : k X k 1 , 2 ≤ 1 } . One can easily c heck that O n,r ⊂ Q n,r , and th us an / 4-net O n,r for O n,r ob eying | O n,r | ≤ (12 / ) nr . Denote T = { [ [ G ; U 1 , U 2 , U 3 ] ] : G ∈ G, U i ∈ O n i ,r i , i = 1 , 2 , 3 } and w e hav e | T | ≤ | G | × | O N × r 1 | × | O N × r 2 | × | O P × r 3 | = (12 / ) r 1 r 2 r 3 + N r 1 + N r 2 + P r 3 . It suffices to show that for any T ∈ S ( r 1 , r 2 , r 3 ), there exists a T ∈ T such that k T − T k F ≤ . F or an y fixed T ∈ S ( r 1 , r 2 , r 3 ), decomp ose it b y HOSVD as T = [ [ G ; U 1 , U 2 , U 3 ] ]. Then, there exist T = [ [ G ; U 1 , U 2 , U 3 ] ]with G ∈ G , U i ∈ O n i ,r i satisfying that k U i − U i k 1 , 2 ≤ / 4 and k G − G k F ≤ / 4. This gives k T − T k F ≤ k [ [ G − G ; U 1 , U 2 , U 3 ] ] k F + k [ [ G ; U 1 − U 1 , U 2 , U 3 ] ] k F + k [ [ G ; U 1 , U 2 − U 2 , U 3 ] ] k F + k [ [ G ; U 1 , U 2 , U 3 − U 3 ] ] k F . Since each U i is an orthonormal matrix, the first term is k G − G k F ≤ / 4. F or the second term, b y the all-orthogonal prop erty of G and the orthonormal prop erty of U 2 and U 3 , k [ [ G ; U 1 − U 1 , U 2 , U 3 ] ] k F = k G × 1 ( U 1 − U 1 ) k F ≤ k G k F k U 1 − U 1 k 2 , 1 ≤ / 4 . Similarly , we can obtain the upp er b ound for the third and the last term, and thus show that k T − T k F ≤ . Lemma A.2. (R estricte d str ong c onvexity) Supp ose that T & N P , with pr ob ability at le ast 1 − C exp[ − c log ( N P )] , α RSC k ∆ k 2 F ≤ 1 T T X t =1 k ∆ (1) x t k , wher e α RSC = λ min ( Σ e ) / (2 µ max ( A )) . 26 Pr o of. Denote X = ( x 1 , . . . , x T ), b Γ = X X > /T , Γ = E b Γ and δ = vec ( ∆ (1) ). Note that T − 1 T X t =1 k ∆ (1) x t k 2 2 = T − 1 k ∆ (1) X k 2 F = T − 1 k ( X > ⊗ I N ) δ k 2 2 = δ > [( X X > /T ) ⊗ I N ] δ . Th us, the ob jective is to sho w δ > [( X X > /T ) ⊗ I N ] δ is lo wer bounded aw ay from zero. Since b Γ = Γ + ( b Γ − Γ ) and by sp ectral measure, we ha ve λ min ( Γ ) ≥ λ min ( Σ e ) /µ max ( A ). Then, it suffices to show that δ > [( b Γ − Γ ) ⊗ I N ] δ do es not deviate muc h from zero for any ∆ ∈ S (2 r 1 , 2 r 2 , 2 r 3 ). By Prop osition 2.4 in Basu and Mic hailidis (2015), for an y single vector v ∈ R N 2 P − 1 suc h that k v k 2 = 1, an y η > 0, P | v > [( b Γ − Γ ) ⊗ I N ] v | > 2 π M ( f X ) η < 2 exp[ − cT min( η , η 2 )] . Then, we can extend this deviation b ound to the union b ound on the set S (2 r 1 , 2 r 2 , 2 r 3 ). By Lemma A.1, for S (2 r 1 , 2 r 2 , 2 r 3 ), we can construct a -net of cardinality at most (12 / ) r 1 r 2 r 3 + N r 1 + N r 2 + P r 3 and appro ximate the deviation on this net, which yields that for some κ > 1, P " sup ∆ ∈S (2 r 1 , 2 r 2 , 2 r 3 ) | δ > [( b Γ − Γ ) ⊗ I N ] δ | > 2 π κ M ( f X ) η # ≤ 2 exp[ − cT min( η , η 2 ) + ( r 1 r 2 r 3 + N r 1 + N r 2 + P r 3 ) log(12 / )] . Then, we can set η = [ λ min ( Σ e )] / [4 π κ M ( f X ) µ min ( A )] < 1, and then we obtain that for T & ( r 1 r 2 r 3 + N r 1 + N r 2 + P r 3 )[( λ max ( Σ e ) µ max ( A )) / ( λ min ( Σ e ) µ min ( A ))] 2 , P " sup ∆ ∈S (2 r 1 , 2 r 2 , 2 r 3 ) δ > ( b Γ ⊗ I N ) δ ≤ λ min ( Σ e ) 2 µ max ( A ) # ≤ C exp[ − c ( r 1 r 2 r 3 + N r 1 + N r 2 + P r 3 )] . Therefore, P " T − 1 T X t =1 k ∆ (1) x t k 2 2 ≥ λ min ( Σ e ) 2 µ max ( A ) k ∆ k 2 F # ≤ C exp[ − c ( r 1 r 2 r 3 + N r 1 + N r 2 + P r 3 )] . The following Lemma is the concen tration of β -mixing subgaussian random v ariables in W ong et al. (2019). 27 Lemma A.3. L et z = ( Z 1 , . . . , Z T ) c onsist of a se quenc e of me an-zer o r andom variables with exp onential ly de c aying β -mixing c o efficients, i.e. ther e exists some c onstant c β > 0 such that ∀ l ≥ 1 , β ( l ) ≤ exp( − c β l ) . L et K b e such that max T t =1 k Z t k ψ 2 ≤ √ K . Cho ose a blo ck length a T ≥ 1 and let µ T = b T / (2 a T ) c . We have, for any t > 0 , P 1 T k z k 2 2 − E k z k 2 2 > t ≤ 4 exp − C min t 2 µ T K 2 , tµ T K + 2( µ T − 1) exp( − c β a T ) + exp − 2 tµ T K . B Real Dataset Information The US macroeconomics dataset is pro vided by Koop (2013). The dataset includes a list of 40 quarterly macro economic v ariables of the United States, from Q1-1959 to Q4-2007. All series are transformed to b e stationary as in T able 1, standardized to hav e zero mean and unit v ariance, and seasonally adjusted except for financial v ariables. These forty macro eco- nomic v ariables capture many aspects of the econom y (e.g. pro duction, price, in terest rate, consumption, lab or, stock markets and exchange rates) and man y empirical econometric lit- erature ha v e applied V AR mo del to these data for structural analysis and forecasting (Ko op, 2013). 28 T able 4: F ort y quarterly macro economic v ariables. Except for financial v ariables, v ariables are seasonally adjusted. All v ariables are transformed to stationarit y with the follo wing transformation co des. The code represen ts: 1 = no transformation, 2 = first difference, 3 = second difference, 4 = log, 5 = first difference of logged v ariables, 6 = second difference of logged v ariables. Short name Co de Description Short name Co de Description GDP251 5 Real GDP , quan tity index (2000=100) SEYGT10 1 Spread bt wn 10-yr and 3-mth T-bill rates CPIA UCSL 6 CPI all items HHSNTN 2 Univ of Mic h index of consumer exp ectations FYFF 2 In te rest rate: federal funds (% per ann um) PMI 1 Purc hasing managers’ index PSCCOMR 5 Real spot mark et price index: all commo dities PMDEL 1 NAPM v endor deliveries index (%) FMRNBA 3 Dep ository inst reserv es: non b orrow ed (mil$) PMCP 1 NAPM commodity price index (%) FMRRA 6 Dep ository inst reserv es: total (mil$) GDP256 5 Real gross priv ate domestic in vestmen t FM2 6 Money sto ck: M2 (bil$) LBOUT 5 Output p er hr: all p ersons, business sec GDP252 5 Real Personal Cons. Exp., Quantit y Index PMNV 1 NAPM inv entories index (%) IPS10 5 Industrial pro duction index: total GDP263 5 Real exports UTL11 1 Capacit y utilization: manufacturing (SIC) GDP264 5 Real imports LHUR 2 Unemp. rate: All work ers, 16 and ov er (%) GDP 265 5 Real govt cons exp enditures & gross inv estment HSFR 4 Housing starts: T otal (thousands) LBMNU 5 Hrs of all p ersons: nonfarm business sector PWFSA 6 Producer price index: finished goo ds PMNO 1 NAPM new orders index (%) GDP273 6 P ersonal Consumption Exp.: price index CCINR V 6 Consumer credit outstanding: nonrev olving CES275R 5 Real avg hrly earnings, non-farm pro d. work ers BUSLO ANS 6 Comm. and industrial loans at all comm. banks FM1 6 Money sto ck: M1 (bil$) PMP 1 NAPM pro duction index (%) FSPIN 5 S&P’s common stock price index: industrials GDP276 1 6 Housing price index FYGT10 2 In terest rate: US treasury const. mat., 10-yr GDP270 5 Real final sales to domestic purchasers EXR US 5 US effectiv e exc hange rate: index num b er GDP253 5 Real personal cons exp enditures: durable goo ds CES002 5 Emplo yees, nonfarm: total priv ate LHEL 2 Index of help-wan ted ads in newspap ers 29 References Basu, S. and Michailidis, G. (2015). Regularized estimation in sparse high-dimensional time series mo dels. The A nnals of Statistics , 43(4):1535–1567. Candes, E. J. and Plan, Y. (2011). Tight oracle inequalities for low-rank matrix recov ery from a minimal n um b er of noisy random measuremen ts. IEEE T r ansactions on Information The ory , 57(4):2342–2359. Cho, K., V an Merri¨ en b o er, B., Gulcehre, C., Bahdanau, D., Bougares, F., Sc hw enk, H., and Bengio, Y. (2014). Learning phrase representations using rnn enco der-deco der for statistical mac hine translation. In Empiric al Metho ds in Natur al L anguage Pr o c essing . Denil, M., Shakibi, B., Dinh, L., De F reitas, N., et al. (2013). Predicting parameters in deep learning. In A dvanc es in Neur al Information Pr o c essing Systems , pages 2148–2156. Du, S. S., W ang, Y., Zhai, X., Balakrishnan, S., Salakhutdino v, R. R., and Singh, A. (2018). Ho w man y samples are needed to estimate a con v olutional neural netw ork? In A dvanc es in Neur al Information Pr o c essing Systems , pages 373–383. F ontaine, V., Ris, C., and Boite, J.-M. (1997). Nonlinear discriminant analysis for improv ed sp eec h recognition. In Fifth Eur op e an Confer enc e on Sp e e ch Communic ation and T e ch- nolo gy . Go o dfello w, I., Bengio, Y., and Courville, A. (2016). De ep le arning . MIT press. Gr ´ ezl, F., Karafi´ at, M., Kon t´ ar, S., and Cernocky , J. (2007). Probabilistic and b ottle-neck features for lv csr of meetings. In 2007 IEEE International Confer enc e on A c oustics, Sp e e ch and Signal Pr o c essing-ICASSP’07 , v olume 4, pages IV–757. IEEE. Hin ton, G. E. and Salakh utdinov, R. R. (2006). Reducing the dimensionality of data with neural net works. Scienc e , 313(5786):504–507. 30 Ho c hreiter, S. and Sc hmidhuber, J. (1997). Long short-term memory . Neur al Computation , 9(8):1735–1780. Jaderb erg, M., V edaldi, A., and Zisserman, A. (2014). Sp eeding up con v olutional neural net- w orks with lo w rank expansions. In Pr o c e e dings of the British Machine Vision Confer enc e . BMV A Press. Kim, Y.-D., Park, E., Y o o, S., Choi, T., Y ang, L., and Shin, D. (2016). Compression of deep con volutional neural net w orks for fast and lo w p o w er mobile applications. In International Confer enc e on L e arning R epr esentations . Kolda, T. G. and Bader, B. W. (2009). T ensor decomp ositions and applications. SIAM R eview , 51(3):455–500. Ko op, G. M. (2013). F orecasting with medium and large ba yesian v ars. Journal of Applie d Ec onometrics , 28(2):177–203. Leb edev, V., Ganin, Y., Rakhuba, M., Oseledets, I., and Lempitsky , V. (2014). Sp eeding- up con v olutional neural netw orks using fine-tuned cp-decomp osition. arXiv pr eprint arXiv:1412.6553 . No viko v, A., Podoprikhin, D., Osokin, A., and V etrov, D. P . (2015). T ensorizing neural net works. In A dvanc es in Neur al Information Pr o c essing Systems , pages 442–450. P an, Y., Xu, J., W ang, M., Y e, J., W ang, F., Bai, K., and Xu, Z. (2019). Compressing recurren t neural netw orks with tensor ring for action recognition. In Pr o c e e dings of the AAAI Confer enc e on A rtificial Intel ligenc e , volume 33, pages 4683–4690. Raskutti, G., Y uan, M., and Chen, H. (2019). Con v ex regularization for high-dimensional m ulti-resp onse tensor regression. The A nnals of Statistics , page to appear. Szegedy , C., Ioffe, S., V anhouc ke, V., and Alemi, A. A. (2017). Inception-v4, inception-resnet and the impact of residual connections on learning. In Thirty-First AAAI Confer enc e on A rtificial Intel ligenc e . 31 Szegedy , C., Liu, W., Jia, Y., Sermanet, P ., Reed, S., Anguelo v, D., Erhan, D., V anhouc ke, V., and Rabino vic h, A. (2015). Going deep er with conv olutions. In Pr o c e e dings of the IEEE Confer enc e on Computer Vision and Pattern R e c o gnition , pages 1–9. Szegedy , C., V anhouck e, V., Ioffe, S., Shlens, J., and W o jna, Z. (2016). Rethinking the inception architecture for computer vision. In Pr o c e e dings of the IEEE Confer enc e on Computer Vision and Pattern R e c o gnition , pages 2818–2826. Tjandra, A., Sakti, S., and Nak amura, S. (2018). T ensor decomp osition for compressing recurren t neural net work. In 2018 International Joint Confer enc e on Neur al Networks , pages 1–8. T uck er, L. R. (1966). Some mathematical notes on three-mo de factor analysis. Psychome- trika , 31(3):279–311. V an den Oord, A., Dieleman, S., Zen, H., Simony an, K., Viny als, O., Grav es, A., Kalch bren- ner, N., Senior, A., and Kavuk cuoglu, K. (2016a). W a venet: A generative mo del for ra w audio. arXiv pr eprint arXiv:1609.03499 . V an den Oord, A., Kalch brenner, N., Esp eholt, L., Viny als, O., Gra ves, A., et al. (2016b). Conditional image generation with pixelcnn deco ders. In A dvanc es in Neur al Information Pr o c essing Systems , pages 4790–4798. W ong, K. C., Li, Z., and T ewari, A. (2019). Lasso guaran tees for β -mixing heavy tailed time series. The A nnals of Statistics , page to app ear. Y e, J., W ang, L., Li, G., Chen, D., Zhe, S., Ch u, X., and Xu, Z. (2018). Learning compact recurren t neural netw orks with blo ck-term tensor decomp osition. In Pr o c e e dings of the IEEE Confer enc e on Computer Vision and Pattern R e c o gnition , pages 9378–9387. 32
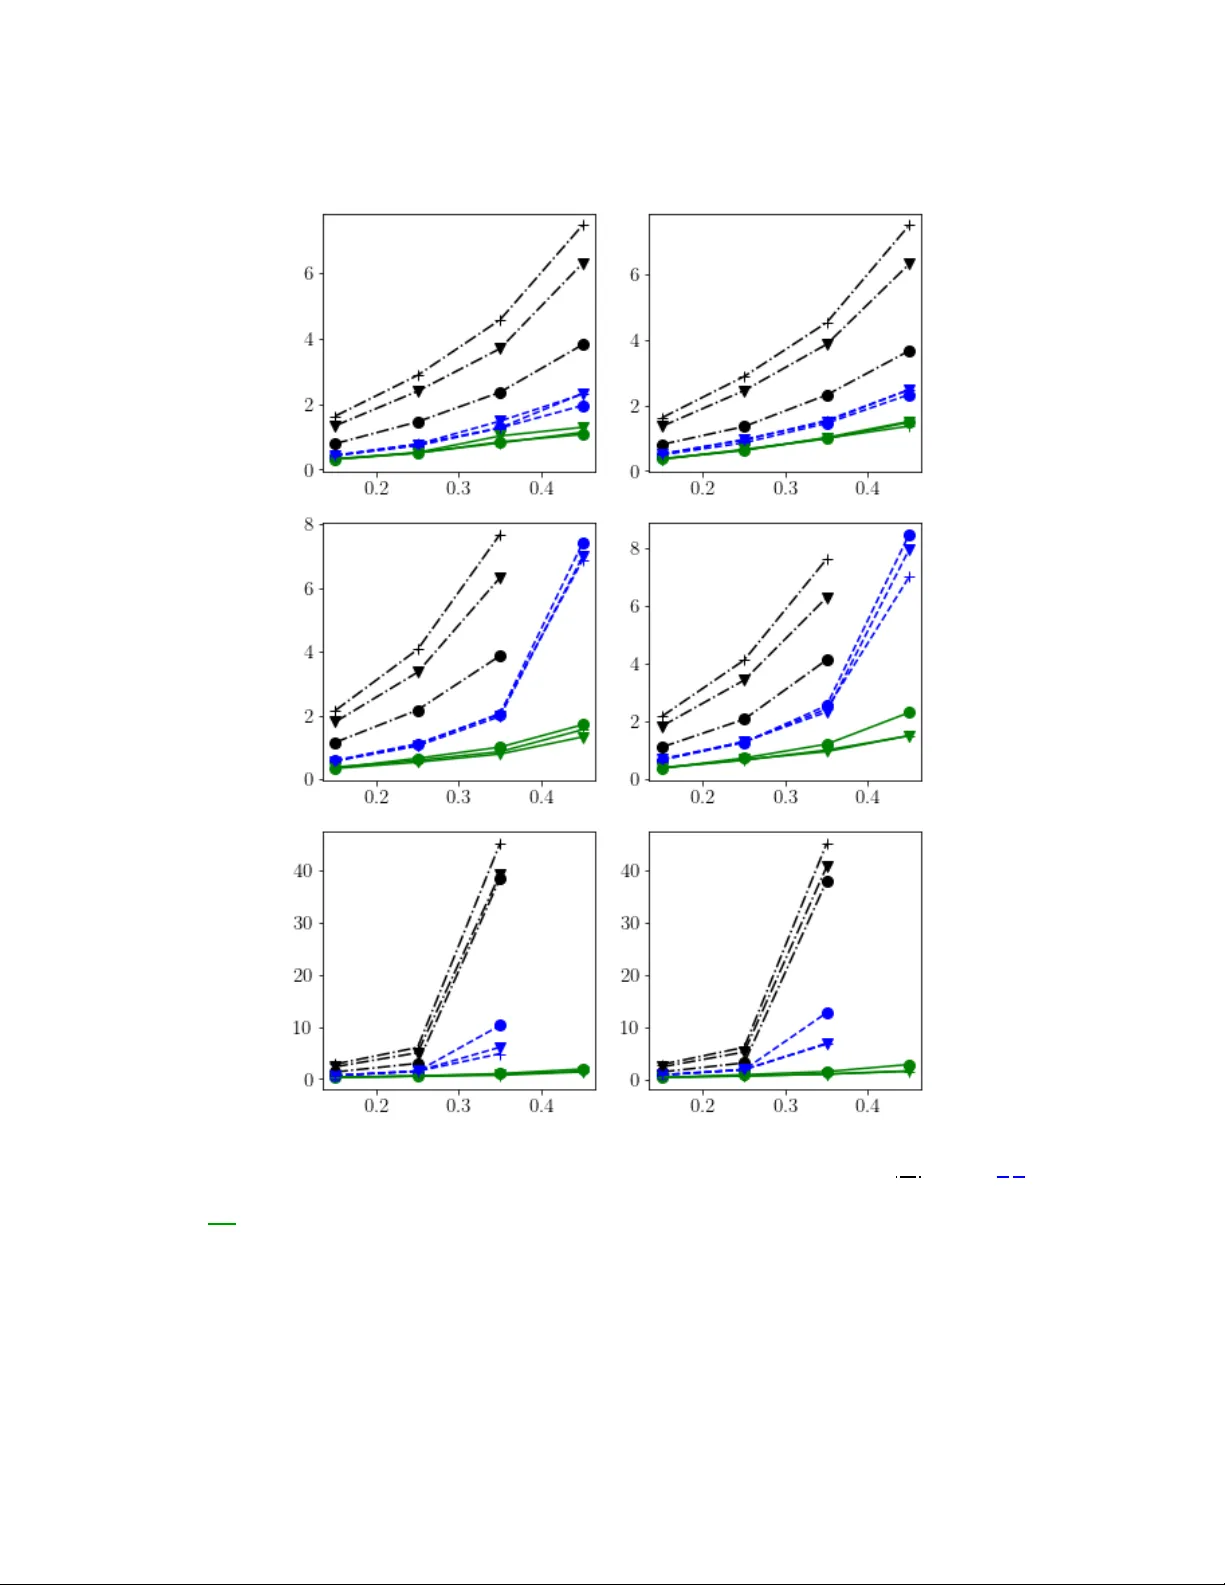
Original Paper
Loading high-quality paper...
Comments & Academic Discussion
Loading comments...
Leave a Comment