Globally-Aware Multiple Instance Classifier for Breast Cancer Screening
Deep learning models designed for visual classification tasks on natural images have become prevalent in medical image analysis. However, medical images differ from typical natural images in many ways, such as significantly higher resolutions and sma…
Authors: Yiqiu Shen, Nan Wu, Jason Phang
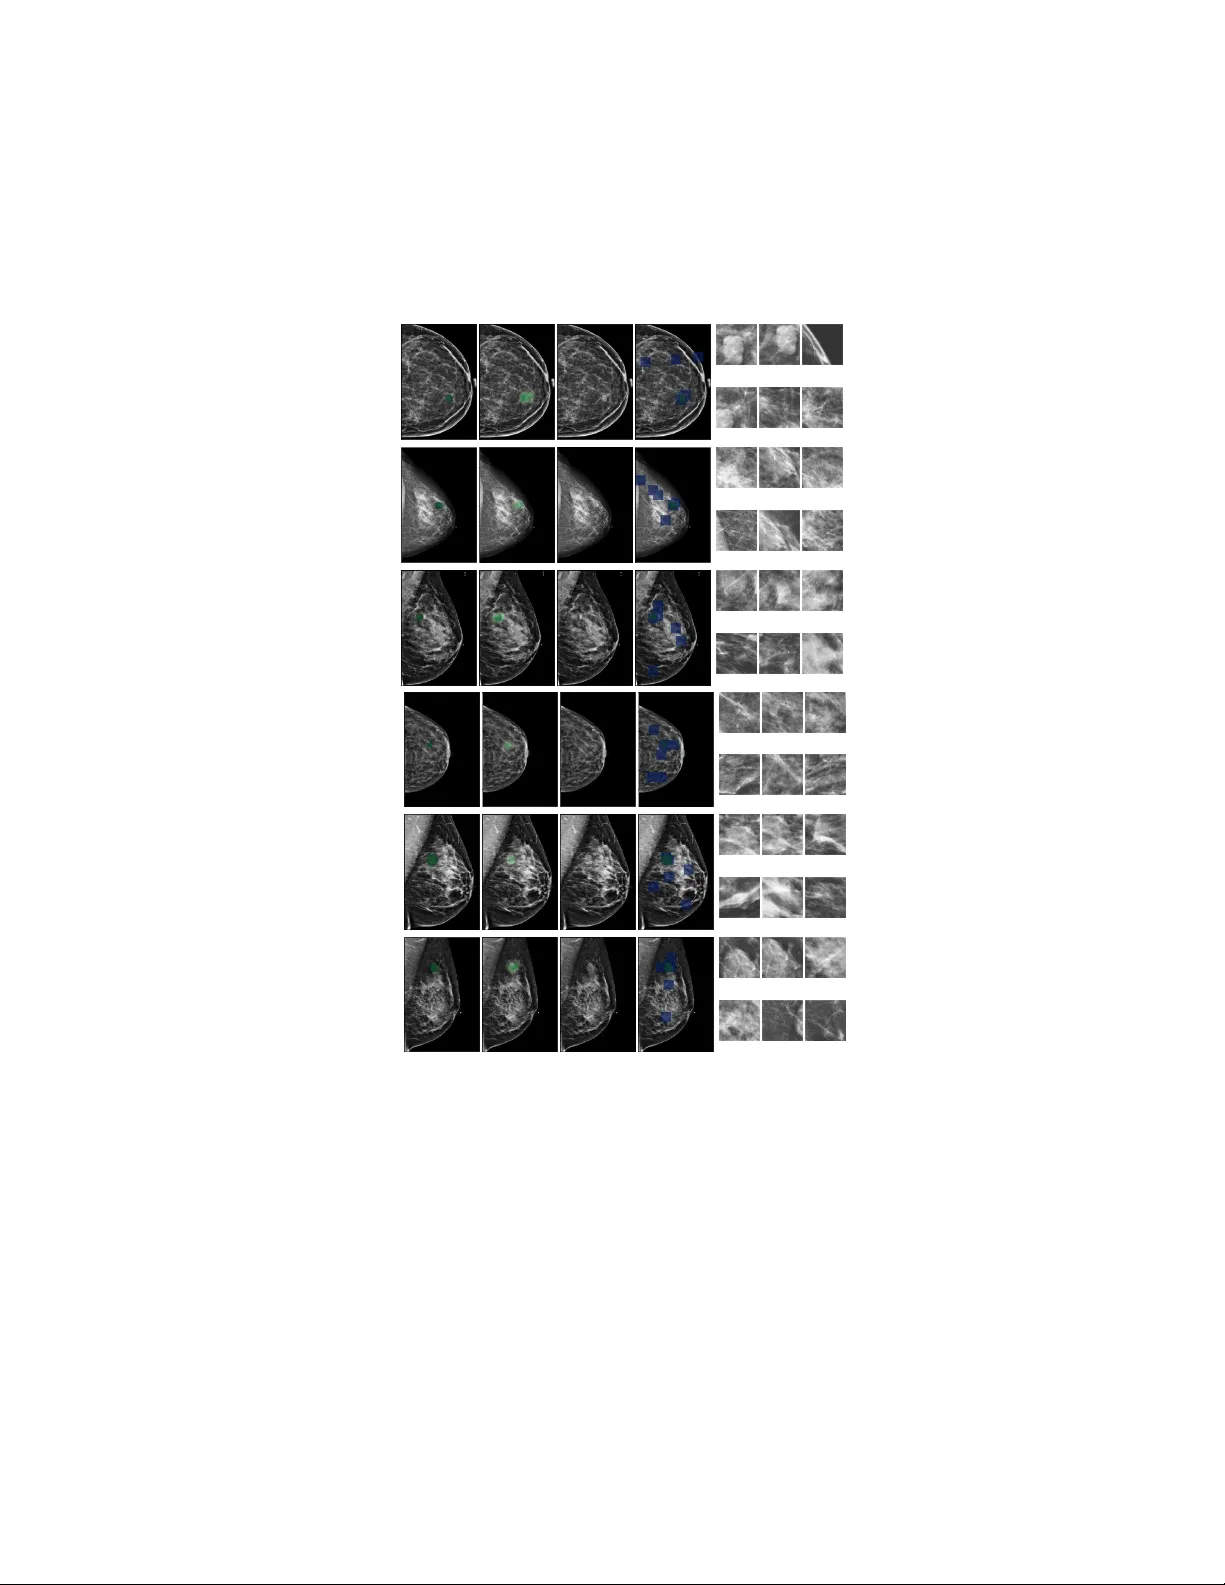
Globally-A w are Multiple Instance Classifier for Breast Cancer Screening Yiqiu Shen 1 , Nan W u 1 , Jason Phang 1 , Jungkyu P ark 1 , Gene Kim 2 , Linda Mo y 2 , Kyungh yun Cho 1 , 3 , 4 , 5 , and Krzysztof J. Geras 2 , 1 1 Cen ter for Data Science, New Y ork Univ ersity 2 Departmen t of Radiology , New Y ork Univ ersity Sc ho ol of Medicine 3 Departmen t of Computer Science, Courant Institute, New Y ork Univ ersity 4 F aceb ook AI Research 5 CIF AR Azrieli Global Scholar Abstract. Deep learning models designed for visual classification tasks on natural images ha ve become prev alent in medical image analysis. Ho w- ev er, medical images differ from t ypical natural images in many wa ys, suc h as significantly higher resolutions and smaller regions of in terest. Moreo ver, both the global structure and local details pla y important roles in medical image analysis tasks. T o address these unique properties of medical images, we prop ose a neural netw ork that is able to classify breast cancer lesions utilizing information from both a global saliency map and multiple lo cal patc hes. The proposed mo del outp erforms the ResNet-based baseline and achiev es radiologist-level p erformance in the in terpretation of screening mammography . Although our mo del is trained only with image-lev el lab els, it is able to generate pixel-level saliency maps that provide lo calization of possible malignan t findings. Keyw ords: deep learning · neural netw orks · breast cancer screening · w eakly supervised localization · high-resolution image classification 1 In tro duction As the second leading caus e of cancer death among w omen in the US, breast can- cer has b een studied for decades. While studies ha ve shown sc reening mammog- raph y has significan tly reduced breast cancer mortalit y , it is an imperfect to ol [8]. T o address its limitations, con volutional neural netw orks (CNN) designed for computer vision tasks on natural images ha ve b een applied. F or instance, VG- GNet [11], designed for ob ject classification on ImageNet [2], has b een applied to breast density classification [13] and F aster R-CNN [9] has been adapted to lo calize suspicious findings in mammograms [10]. W e refer the readers to [5] for a comprehensiv e review of prior work on machine learning for mammograph y . The compatibility b etw een the mo dels designed for natural images and the distinct prop erties of medical images remains an op en question. Firstly , medical images are usually of a muc h higher resolution than t ypical natural images, so deep CNNs that work w ell for natural images ma y not b e applicable to medi- cal images due to GPU memory constraints. Moreov er, for many applications, 2 Y. Shen et al. regions of interest (R OI) in medical images, such as lesions and calcifications, are prop ortionally smaller in size compared to those in natural images. Fine details, often only a few pixels in size, along with global features suc h as the spatial distribution of radio dense tissue determine the lab els. In addition, while natural images can b e aggressively downsampled and preserv e the information necessary for classification, significant amounts of information could b e lost from do wnsampling medical images, making the correct diagnosis unattainable. Con tributions. In this work, w e address the aforemen tioned issues by prop osing a nov el mo del for the classification of medical images. The prop osed mo del preserves global information in a saliency map and aggregates imp ortan t details with a Multiple Instance Learning (MIL) framew ork. Unlik e existing ap- proac hes that rely on pixel-level lesion annotations [14,10], our mo del only re- quires image-level sup ervision and is able to generate pixel-level saliency maps that highlight suspicious lesions. In addition, our mo del is equipped with an at- ten tion mechanism that enables it to select informative image patches, making the classification process interpretable. When trained and ev aluated on more than 1 million high-resolution breast cancer screening exams, our mo del outp er- forms a ResNet-based baseline [14] and ac hieves radiologist-level performance. Related W orks. Existing metho ds hav e approached the breast cancer de- tection problem using techniques such as MIL [16] and 3D CNNs [12]. Our model is inspired b y w orks on w eakly supervised ob ject detection. Recent progress demonstrates that CNN classifiers, trained with image-level lab els, are able to p erform seman tic segmentation at the pixel level [3,4,15]. This is achiev ed in t wo steps. First, a bac kb one CNN con verts the input image to a saliency map (SM) which highlights the discriminative regions. A global p o oling op erator then collapses the SM into scalar predictions which makes the en tire mo del trainable end-to-end. T o mak e an image-lev el prediction, most existing mo dels rely on the SM which often neglects fine-grained details. In contrast, our mo del also lev erages lo cal information from R OI prop osals using a dedicated patch-lev el classifier. In Section 3.2, w e demonstrate that the ability to fo cus on fine visual detail is imp ortan t for classification. 2 Metho ds W e form ulate our task as a m ulti-lab el classification. Giv en a grayscale high- resolution image x ∈ R H,W , w e would like to predict the label y , where y c denotes whether class c ∈ C is present. As shown in Figure 1, the Globally- A w are Multiple Instance Classifier (GMIC) consists of three modules: (i) The lo calization mo dule pro cesses x to generate a SM, denoted by A , whic h indicates appro ximate lo calizations of R OIs. (ii) The detection mo dule uses A to retrieve K patches from x as refined prop osals for ROIs. (iii) W e use an MIL framew ork to aggregate information from retriev ed patches and generate the final prediction. Globally-A ware Multiple Instance Classifier for Breast Cancer Screening 3 Fig. 1: Overall architecture of GMIC. The input image is annotated with true R OIs (red). The patch map indicates p ositions of ROI patches (bl ue squares) on the input. 2.1 Lo calization Mo dule As illustrated in Figure 1, the lo calization mo dule first uses a CNN f d ( · ) to ex- tract relev ant features from x . Due to memory constraints, input images are usu- ally down-sampled b efore f d ( · ) [15]. F or mammograms, ho wev er, down-sampling distorts imp ortan t visual details suc h as lesion margins and blurs small ROIs. In order to retain the original resolution, we parameterize f d ( · ) as a ResNet-22 [14] and remo v e its global av erage po oling and fully connected la y ers. This model has few er filters than the original ResNet architectures in each lay er in order to pro cess the image at the full resolution while keeping GPU memory consump- tion manageable. The feature maps obtained after the last residual blo ck are transformed into the SM A ∈ R h,w, | C | using 1 × 1 conv olution with sigmoid non-linearit y . Eac h element of A , A c i,j ∈ [0 , 1] , denotes a score that indicates the con tribution of spatial lo cation ( i, j ) tow ards classifying the input as class c . 2.2 Detection Mo dule Due to its limited width, f d ( · ) is only able to provide coarse localization. W e prop ose using patches as ROI prop osals to complement the lo calization module with fine-grained detail. W e designed a greedy algorithm (Algorithm 1) to re- triev e K prop osals for ROIs, ˜ x k ∈ R h c ,w c , from the input x . In our exp eriments, w e set K = 6 , and w c = h c = 256 . The reset rule in line 12 explicitly ensures that extracted R OI prop osals do not significantly ov erlap with eac h other. 2.3 Multiple Instance Learning Module Since R OI patc hes are retrieved using a coarse saliency map, the information relev an t for classification carried in eac h patc h v aries significantly . T o address 4 Y. Shen et al. Algorithm 1 Retrieve the ROIs Require: x ∈ R H,W , A ∈ R h,w, | C | , K Ensure: O = { ˜ x k | ˜ x k ∈ R h c ,w c } 1: O = ∅ 2: for each class c ∈ C do 3: ˜ A c = min-max-normalization ( A c ) 4: end for 5: ˆ A = P c ∈ C ˜ A c 6: l denotes an arbitrary h c h H × w c w W rectangular patch on ˆ A 7: f c ( l, ˆ A ) = P ( i,j ) ∈ l ˆ A [ i, j ] 8: for each 1 , 2 , ..., K do 9: l ∗ = argmax l f c ( l, ˆ A ) 10: L = p osition of l ∗ in x 11: O = O ∪ { L } 12: ˆ A [ i, j ] = 0 , ∀ ( i, j ) ∈ l ∗ 13: end for 14: return O this, we apply an MIL framework to aggregate information from ROI patches. A detection netw ork f t ( · ) is first applied on ev ery instance ˜ x k and con v erts them into feature v ectors ˜ h k ∈ R L . W e use L = 128 in all exp erimen ts. W e parameterize f t ( · ) as a ResNet-18 (pretrained on ImageNet [2]). Since not all ROI patc hes are relev ant to the prediction, we use the Gated Atten tion Mec hanism prop osed in [6] to let the mo del select informative patches. The selection pro cess yields an attention-w eighted representation z = P K k =1 α k ˜ h k , where atten tion score α k ∈ [0 , 1] indicates the relev ance of each patch ˜ x k . The representation z is then passed to a fully connected lay er with sigmoid activ ation to generate a prediction ˆ y mil = sigm ( w mil T z ) , where w mil ∈ R L ×| C | are learnable parameters. 2.4 T raining It is difficult to make this mo del trainable end-to-end. Since the detection mo dule is not differentiable, the gradient from the training loss L ( y , ˆ y mil ) will not flow in to the lo calization mo dule. Inspired by [3], w e circumv ent this problem with a sc heme that simultaneously trains the lo calization mo dule and the MIL mo dule. An aggregation function f agg ( A c ) : R h,w 7→ [0 , 1] is designed to map the SM for eac h class c in to a prediction ˆ y c loc . The design of f agg ( A c ) has b een extensively studied [4]. Global A v erage P o oling (GAP) would dilute the prediction as most of the spatial lo cations in A c corresp ond to background and pro vide little training signal. On the other hand, Global Max Pooling (GMP) only bac kpropagates gradien t into a single spatial lo cation which makes the learning pro cess slow and unstable. In our work, w e use a soft balance b et ween GAP and GMP : f agg ( A c ) = 1 | H + | P ( i,j ) ∈ H + A c i,j , where H + denotes the set containing lo cations of top t % v alues in A c , and t is a hyper-parameter. The prediction ˆ y c loc = f agg ( A c ) is a v alid probability as A c i,j ∈ [0 , 1] . T o fine-tune the SM and preven t the localization mo dule from highligh ting irrelev ant areas, we imp ose the follo wing regularization on A c : L reg ( A c ) = P ( i,j ) | A c i,j | β , where β is a hyper-parameter. In summary , the loss function used to train the en tire mo del is: L ( y , ˆ y ) = X c ∈ C BCE ( y c , ˆ y c loc ) + BCE ( y c , ˆ y c mil ) + λL reg ( A c ) , (1) Globally-A ware Multiple Instance Classifier for Breast Cancer Screening 5 where BCE ( · , · ) is the binary cross-entrop y and λ is a hyper-parameter. In the inference stage, the prediction is computed as ˆ y = 1 2 ( ˆ y mil + ˆ y loc ) . 3 Exp erimen ts The prop osed mo del is ev aluated on the task of predicting whether any benign or malignan t findings are presen t in a mammography exam. The d ataset includes 229,426 exams (1,001,093 images). Across the entire data set, malignan t findings w ere present in 985 breasts and b enign findings in 5,556 breasts. As shown in Figure 2, each exam contains four grayscale images ( 2944 × 1920 ) representing t wo standard views (CC and MLO) for b oth left and right breasts. A lab el y ∈ { 0 , 1 } 2 is asso ciated with each breast where y c ∈ { 0 , 1 } ( c ∈ { b enign , malignant } ) denotes the presence or absence of a b enign/malignan t finding in a breast. All findings are confirmed b y a biopsy . In each exam, tw o views on the same breast share the same lab el. A small fraction ( < 1% ) of the data are associated with pixel-lev el segmentation M c ∈ { 0 , 1 } H × W where M c i,j = 1 if pixel i, j b elongs to the findings of class c . In all exp eriments, segmentations are only used for ev aluation. 3.1 Exp erimen tal Set-up and Ev aluation Metrics R-CC L-CC R-MLO L-MLO Fig. 2: Example exam for a patient. Benign findings are highlighted in green. W e adopt the same pre-pro cessing as [14]. The dataset is divided into disjoin t training (186,816), v alidation (28,462) and test (14,148) sets. In each iteration, we train the mo del using all exams that con tain at least one benign or malignan t finding and an equal num- b er of randomly sampled negative exams. All images are cropp ed to 2944 × 1920 pixels and normalized. The training loss is optimized using A dam [7]. W e optimize the hyper-parameters using random search [1]. Sp ecifically , we search on a logarithmic scale for the learning rate η ∈ 10 [ − 5 . 5 , − 3 . 8] , the regularization w eight λ ∈ 10 [ − 5 , − 2 . 8] , the regularization exp onent β ∈ e [ − 1 . 6 , 1 . 6] , and the p o oling threshold t ∈ e [ − 5 , − 1 . 5] . W e train 100 separate mo dels, each for 40 epo chs. F or classification p erformance, we report the area under the ROC curve (A UC) on the breast-level. As our mo del generates a prediction for each image and eac h breast is asso ciated with tw o images (CC and MLO), we define breast-level predictions as the a verage of the tw o image-level predictions. T o quantitativ ely ev aluate our mo del’s localization abilit y , we use the con tinuous F1 score, where precision (P) and recall (R) are defined as: P = ( P i,j ∈ M c A c i,j ) / ( P i,j A c i,j ) and R = ( P i,j ∈ M c A c i,j ) / | M c | , and M c denotes the segmen tation lab el and A c is the SM for class c . On the test set, these metrics are a veraged ov er images for which segmentation lab els are av ailable. 6 Y. Shen et al. 0.00 0.25 0.50 0.75 1.00 false positive rate 0.0 0.2 0.4 0.6 0.8 1.0 true positive rate GMIC (top-5) (0.876) avg reader (0.778) max reader (0.860) hybrid (0.883) Fig. 3: Reader study T able 1: AUCs of the baseline mo del and a few v ariations of GMIC Mo del Malignan t Benign ResNet-22 [14] 0.827 0.731 GMIC-lo c 0.885 0.777 GMIC-mil 0.878 0.766 GMIC-noattn 0.823 0.726 GMIC-random 0.757 0.692 GMIC-lo c-random 0.889 0.776 GMIC 0.900 0.784 3.2 Classification Performance In this section, w e rep ort the a verage test p erformance of the 5 mo dels from the hyper-parameter searc h that ac hieved the highest v alidation A UC on ma- lignan t classification (referred to as top-5 ). In order to understand the impact of each module, w e ev aluate GMIC under a n umber of settings. GMIC-lo c uses ˆ y loc as its predictions and GMIC-mil uses ˆ y mil . As shown in T able 1, both v ari- an ts of GMIC outp erform the baseline, esp ecially in predicting malignancy . The full mo del, GMIC, using the aggregated prediction ˆ y = ˆ y loc + ˆ y mil 2 , attains higher A UC than GMIC-lo c and GMIC-mil. W e attribute this improv ement to the syn- ergy of lo cal and global information. T o empirically v alidate this conjecture, we test three additional mo dels: GMIC-noattn assigns equal atten tions on eac h ROI patc h; GMIC-random outputs prediction ˆ y random b y applying MIL mo dule on patc hes randomly selected from the input image; GMIC-loc-random com bines the predictions from GMIC-lo c and GMIC-random ˆ y = ˆ y loc + ˆ y random 2 . As T able 1 sho ws, GMIC-noattn is less accurate than GMIC-mil, suggesting that the atten- tion mechanism in MIL mo dule is essen tial for classification. Moreov er, GMIC- random is weak er than GMIC-mil and GMIC-lo c-random do es not demonstrate an y p erformance gain on top of GMIC-lo c. These observ ations confirm our hy- p othesis that applying the MIL mo dule on high-resolution ROI patches supple- men ts the global information extracted by SM and refines predictions. T o ev aluate the clinical v alue of our mo del, we compare the p erformance of GMIC with radiologists using data from the reader study described in [14]. This reader study includes 14 radiologists, each pro viding a probability estimate of malignancy for 720 screening exams (1440 breasts). The radiologists were only shown images for each exam with no other data. T o further improv e our predictions, we ensemble the predictions of the top-5 mo dels. As shown in Figure 3, the ensem ble GMIC model achiev es higher A UC (0.876) than the a verage (0.778) and the most accurate (0.860) among the 14 readers. GMIC obtains a marginally worse p erformance in the reader study than in the test set b ecause the reader study con tains a muc h larger p ortion of positive samples. W e also assess the efficacy of a h uman-machine hybrid, whose predictions are simply the av erage of predictions from the radiologists and the mo del. The Globally-A ware Multiple Instance Classifier for Breast Cancer Screening 7 h uman-machine hybrid achiev es an A UC of 0.883. These results suggest that our mo del captures different aspects of the task compared to radiologists and can b e used as a to ol to assist in interpreting breast cancer screening exams. annotatedinput benignSM malignantSM patchmap ROIpatches 0.95 0.00 0.01 0.01 0.00 0.03 0.60 0.38 0.02 0.00 0.00 0.00 0.09 0.17 0.38 0.25 0.06 0.04 Fig. 4: Visualization of three examples. Input images are annotated with segmentation lab els (green=b enign, red=malignant). ROI patc hes are shown with their attention scores. 3.3 Lo calization Performance W e select the model with the highest v alidation F1 for malignancy localiza- tion. At the inference stage, we upsample SMs using nearest neighbour in- terp olation to matc h the resolution of the segmen tation lab els. The a v erage con tinuous F1/precision/recall on test set is 0.207/0.288/0.254 for malignant and 0.133/0.135/0.224 for b enign. In addition, the best lo calization mo del also ac hieves a classification AUC of 0.886/0.78 for malignan t/b enign classes. T o better understand our mo del’s b eha vior, we visualize SMs of three samples selected from the test set in Figure 4. In the first tw o examples, the SMs are highly activ ated on the true lesions, suggesting that our mo del is able to detect suspicious lesions without pixel-lev el sup ervision. Moreo ver, the attention α k is highly concentrated on ROI patc hes that o verlap with the annotated lesions. In the third example , the malignant SM only highlights parts of a large malignant lesion. This b eha vior is related to the design of f agg : a fixed p o oling threshold t cannot be optimal for all sizes of R OI. F urthermore, this observ ation also illustrates that while human exp erts are asked to annotate the en tire lesion, CNNs tend to emphasize only the most informativ e part. 8 Y. Shen et al. 4 Conclusion W e presen t a no vel mo del for breast cancer screening exam classification. The prop osed metho d uses the input in its original resolution while b eing able to fo cus on fine details. Moreov er, our mo del also generates saliency maps that provide additional interpretabilit y . Ev aluated on a large mammography dataset, GMIC outp erforms the ResNet-based baseline and generates predictions that are as accurate as radiologists. Given its generic design, the prop osed mo del is widely applicable to other image classification tasks. Our future researc h will fo cus on designing joint training mec hanisms that w ould enable GMIC to improv e its lo calization using error signals from the MIL mo dule. A ckno wledgmen ts The authors would like to thank Catriona C. Geras for correcting earlier v ersions of this manuscript and Jo e Katsnelson and Mario Vi- dena for supp orting our computing en vironment. W e also gratefully ac knowledge the supp ort of Nvidia Corp oration with the donation of some of the GPUs used in this research. This work was supp orted in part by gran ts from the National Institutes of Health (R21CA225175 and P41EB017183). References 1. Bergstra, J., Bengio, Y.: Random search for hyper-parameter optimization. Journal of Machine Learning Research 13 (F eb) (2012) 2. Deng, J., Dong, W., So c her, R., Li, L.J., Li, K., F ei-F ei, L.: ImageNet: A Large- Scale Hierarchical Image Database. In: CVPR09 (2009) 3. Diba, A., Sharma, V., Pazandeh, A.M., Pirsiav ash, H., V an Go ol, L.: W eakly su- p ervised cascaded con volutional netw orks. In: CVPR (2017) 4. Durand, T., Mordan, T., Thome, N., Cord, M.: Wildcat: W eakly sup ervised learn- ing of deep convnets for image classification, p oin twise lo calization and segmenta- tion. In: CVPR (2017) 5. Gao, Y., Geras, K.J., Lewin, A.A., Moy , L.: New frontiers: An update on computer- aided diagnosis for breast imaging in the age of artificial intelligence. American Journal of Ro entgenology 212 (2), 300–307 (2019) 6. Ilse, M., T omczak, J.M., W elling, M.: Atten tion-based deep m ultiple instance learn- ing. arXiv:1802.04712 (2018) 7. Kingma, D., Ba, J.: Adam: A metho d for sto chastic optimization. In: ICLR (2015) 8. K opans, D.B.: Beyond randomized con trolled trials: organized mammographic screening substantially reduces breast carcinoma mortality . Cancer 94 (2) (2002) 9. Ren, S., He, K., Girshick, R., Sun, J.: F aster r-cnn: T ow ards real-time ob ject de- tection with region prop osal netw orks. In: NIPS (2015) 10. Ribli, D., Horváth, A., Unger, Z., Pollner, P ., Csabai, I.: Detecting and classifying lesions in mammograms with deep learning. Scientific rep orts 8 (1) (2018) 11. Simon yan, K., Zisserman, A.: V ery deep con volutional net works for large-scale image recognition. arXiv:1409.1556 (2014) 12. W ang, N., Bian, C., W ang, Y., Xu, M., Qin, C., Y ang, X., W ang, T., Li, A., Shen, D., Ni, D.: Densely deep sup ervised net works with threshold loss for cancer detection in automated breast ultrasound. In: MICCAI (2018) Globally-A ware Multiple Instance Classifier for Breast Cancer Screening 9 13. W u, N., Geras, K.J., Shen, Y., Su, J., Kim, S., Kim, E., W olfson, S., Moy , L., Cho, K.: Breast density classification with deep conv olutional neural netw orks. In: ICASSP (2018) 14. W u, N., Phang, J., Park, J., Shen, Y., Huang, Z., Zorin, M., Jastrzebski, S., Févry , T., Katsnelson, J., Kim, E., et al.: Deep neural net works impro ve radiologists’ p erformance in breast cancer screening. arXiv preprin t arXiv:1903.08297 (2019) 15. Y ao, L., Prosky , J., Poblenz, E., Covington, B., Lyman, K.: W eakly sup ervised med- ical diagnosis and lo calization from m ultiple resolutions. arXiv:1803.07703 (2018) 16. Zh u, W., Lou, Q., V ang, Y.S., Xie, X.: Deep multi-instance net works with sparse lab el assignment for whole mammogram classification. In: MICCAI (2017) 10 Y. Shen et al. A A dditional Visualizations annotatedinput benignSM malignantSM patchmap ROIpatches 0.36 0.48 0.01 0.06 0.07 0.02 0.52 0.07 0.07 0.29 0.04 0.01 0.18 0.13 0.18 0.18 0.29 0.04 0.96 0.01 0.01 0.00 0.01 0.01 0.61 0.28 0.03 0.01 0.05 0.02 0.55 0.02 0.09 0.14 0.17 0.03 Fig. 5: Additional visualizations of b enign examples. Input images are annotated with segmen tation lab els (green=b enign, red=malignan t). ROI patches are shown with their atten tion scores. Globally-A ware Multiple Instance Classifier for Breast Cancer Screening 11 annotatedinput benignSM malignantSM patchmap ROIpatches 0.69 0.00 0.31 0.00 0.00 0.00 0.39 0.57 0.01 0.00 0.03 0.00 0.46 0.02 0.02 0.43 0.06 0.01 0.13 0.01 0.03 0.01 0.58 0.25 0.24 0.68 0.01 0.01 0.06 0.00 0.31 0.01 0.03 0.00 0.15 0.49 Fig. 6: Additional visualizations of malignant examples. Input images are annotated with segmentation lab els (green=b enign, red=malignant). ROI patches are shown with their attention scores.
Original Paper
Loading high-quality paper...
Comments & Academic Discussion
Loading comments...
Leave a Comment