Evolution of Hierarchical Structure & Reuse in iGEM Synthetic DNA Sequences
Many complex systems, both in technology and nature, exhibit hierarchical modularity: smaller modules, each of them providing a certain function, are used within larger modules that perform more complex functions. Previously, we have proposed a model…
Authors: Payam Siyari, Bistra Dilkina, Constantine Dovrolis
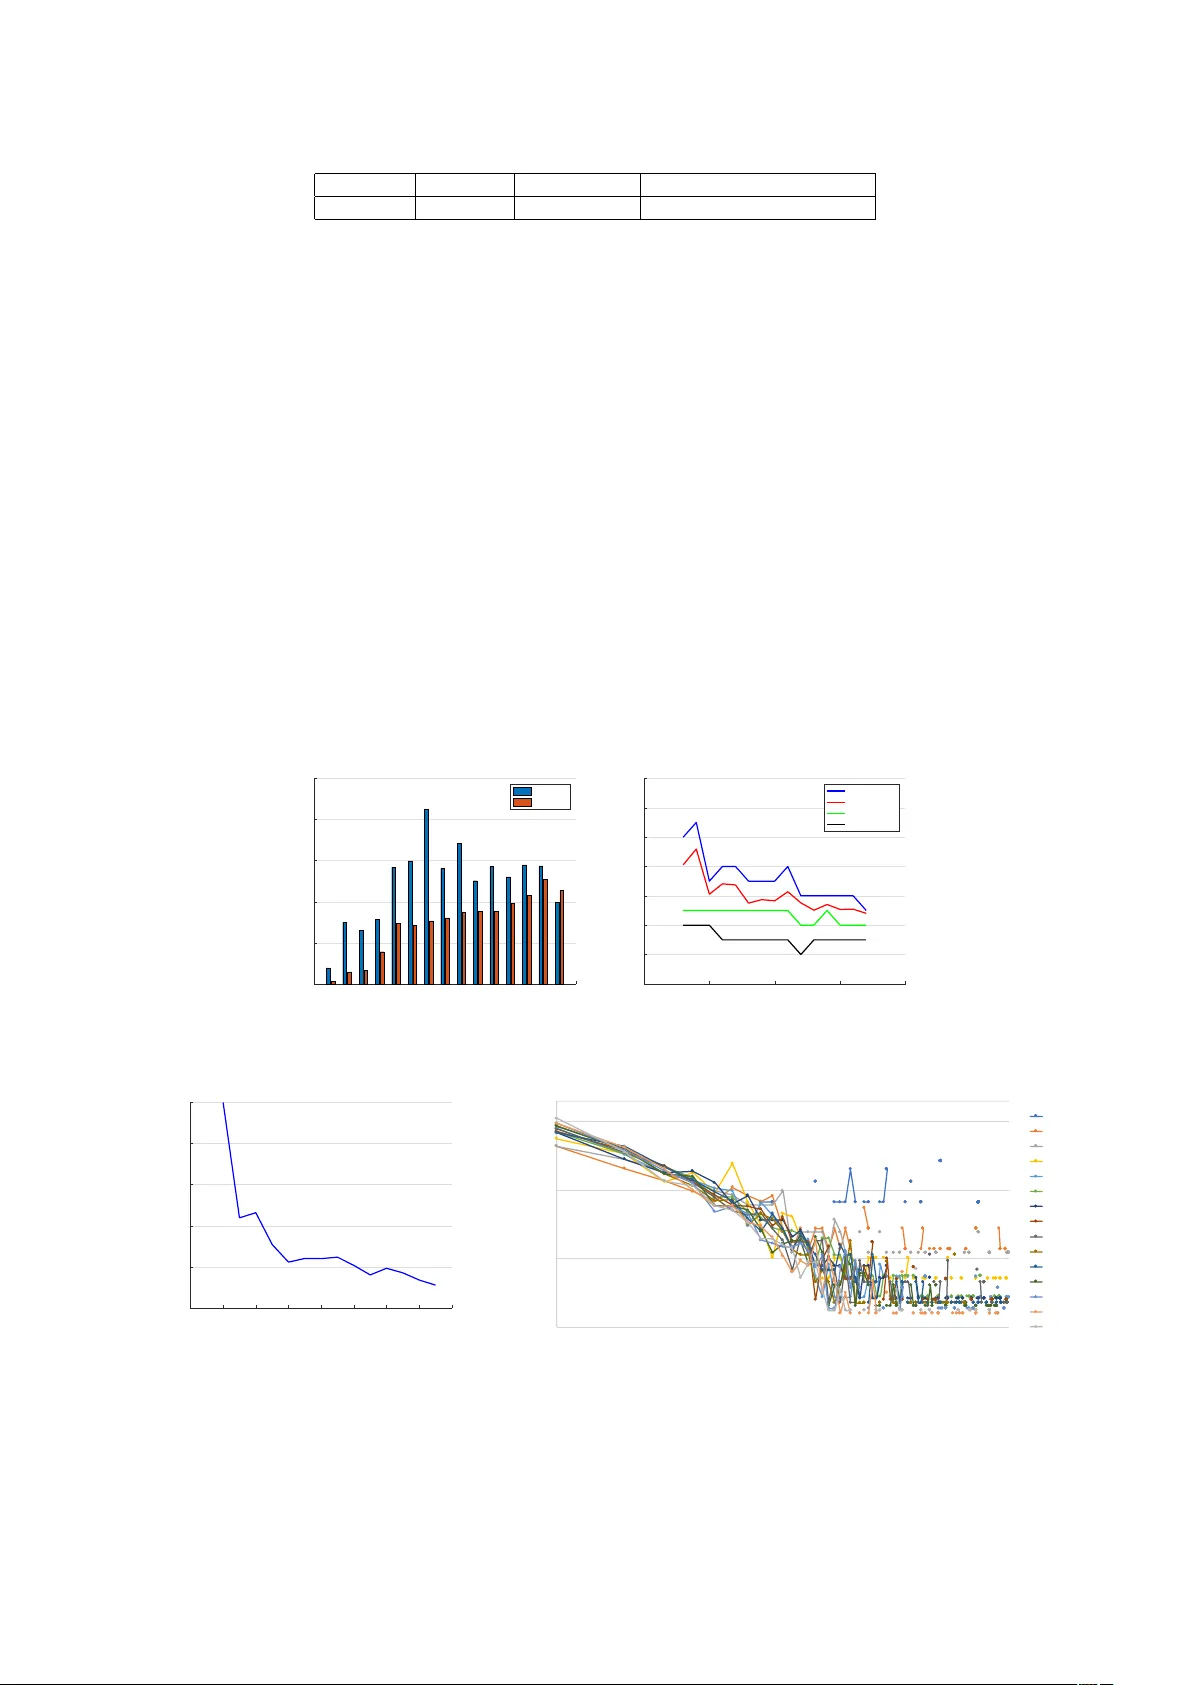
Ev olution of Hierarc hical Structure & Reuse in iGEM Syn thetic DNA Sequences P ay am Siy ari 1 , Bistra Dilkina 2 , and Constan tine Do vrolis 1 1 Georgia Institute of T ec hnology , Atlan ta GA 30332, USA { payamsiyari, constantine } @gatech.edu 2 Univ ersity of Southern California, Los Angeles CA 90007, USA dilkina@usc.edu Abstract. Man y complex systems, both in technology and nature, exhibit hierarchical mo dularit y: smaller mo dules, eac h of them providing a certain function, are used within larger mo dules that p erform more complex functions. Previously , we hav e prop osed a mo deling framew ork, referred to as Ev o-Lexis [21], that provides insigh t to some fundamental questions about evolving hierarc hical systems. The predictions of the Evo-Lexis mo del should b e tested using real data from evolving systems in whic h the outputs can be well represented b y sequences. In this paper, we inv estigate the time series of iGEM synthetic DNA dataset sequences, and whether the resulting iGEM hierarchies exhibit the qualitativ e properties predicted by the Evo-Lexis framew ork. Contrary to Evo-Lexis, in iGEM the amoun t of reuse decreases during the timeline of the dataset. Although this results in developmen t of less cost-efficien t and less deep Lexis-D AGs, the dataset exhibits a bias in reusing specific nodes more often than others. This results in the Lexis-D AGs to take the shape of an hourglass with relativ ely high H-score v alues and stable set of core nodes. Despite the reuse bias and stability of the core set, the dataset presents a high amount of diversit y among the targets which is in line with mo deling of Ev o-Lexis. Keyw ords: complex systems · hierarchical structure · optimization · hourglass effect · iGEM. 1 In tro duction Hierarc hically mo dular designs enhance ev olv ability in natural systems [15,16,19], make the maintenance easier in technological systems, and provide agility and better abstraction of the system design [9,18]. In prior work in [21], we present Evo-L exis , a mo deling framework for the emergence and ev olution of hierarc hical structure in complex modular systems. There are many hypotheses in the literature regarding the factors that contribute to either the hierarc hy or mo dularity properties. Lo cal resource constrain ts in social netw orks and ecosystems [17], mo dularly v arying goals [7,13,14], selection for more robust phe- not yp es [4,24], and selection for low er connection costs in a netw ork [15] are some of the mechanisms that hav e b een previously explored and shown to lead to hierarchically mo dular systems. The main h y- p othesis that Evo-Lexis follo ws is along the lines of [15], which assumes that systems in b oth nature and tec hnology care to minimize the cost of their in terconnections or dep endencies b etw een mo dules. W e also studied the hourglass effect via Evo-Lexis. Informally , an hourglass architecture means that the system of interest pro duces many outputs from man y inputs through a relativ ely small num b er of highly central in termediate mo dules, referred to as the “waist” of the hourglass. It has b een observed that hierarchi- cally mo dular systems often exhibit the architecture of an hourglass; for reference, in fields like computer net working [2], neural netw orks [11,10], embry ogenesis [5], metabolism [8,23], and many others [19,22], this phenomena is observed. A comprehensiv e survey of the literature on hierarchical systems ev olution, and the hourglass effect is presen ted in [19]. The motiv ation for this pap er is that the Ev o-Lexis model is quite general and abstract, and it do es not attempt to capture an y domain-sp ecific asp ects of biological or technological evolution. As suc h, it makes sev eral assumptions that can b e criticized for b eing unrealistic, such as the fact that all targets hav e the same length, or their length stays constan t, or the fitness of a sequence is strictly based on its hierarchical cost. W e b elieve that such abstract mo deling is still v aluable b ecause it can pro vide insights into the This research is supported by D ARP As Lifelong Learning Machines (L2M) program, under Coop erative Agreemen t HR0011- 18-2-0019, and b y the National Science F oundation under Gran t No. 1319549. 2 P . Siy ari et al. qualitativ e properties of the resulting hierarchies under different target generation models. Ho wev er, we also b elieve that the predictions of the Ev o-Lexis mo del should b e tested using real data from ev olving systems in which the outputs can b e well represented by sequences. One such system is the iGEM syn thetic DNA dataset [1]. The target DNA sequences in the iGEM dataset are built from standard “BioBric k parts” (more elemen tary DNA sequences) that collectively form a library of synthetic DNA sequences. These sequences are submitted to the registry of standard biological parts in the ann ual iGEM comp etition. Previous researc h in [3,20] has provided some evidence that these synthetic DNA sequences are designed by reusing existing components, and as suc h, it has a hierarc hical organization. In this paper, w e inv estigate ho w to apply the Evo-Lexis framework in the time series of iGEM sequences, and whether the resulting iGEM hierarchies exhibit the same qualitative prop erties w e observed in [21] which w as solely based on abstract target generation models. W e ask the following questions in this pap er: 1. Ho w can we analyze the iGEM dataset using the evolutionary framework of Ev o-Lexis? Ho w are the batches of targets formed? What prop erties of the iGEM batches are different than Ev o-Lexis’s setting? 2. When formed incrementally ov er the iGEM dataset, which are the architectural prop erties of Lexis- D AGs, and why? 2 Preliminaries T o develop Evo-L exis , we extend the previously prop osed optimization framework L exis in [20]. Lexis mo dels the most elemen tary mo dules of the system as symbols (“sources”) and the mo dules at the highest lev el of the hierarch y as sequences of those symbols (“targets”). Evo-L exis is a dynamic or ev olving version of Lexis, in the sense that the set of targets changes ov er time through additions (births) and remov als (deaths) of targets. Evo-L exis computes an (approximate) minim um-cost adjustment of a given hierarc h y when the set of targets c hanges ov er time (a pro cess we refer to as “incremental design”). 2.1 Lexis Optimization Giv en an alphabet S and a set of “target” strings T o ver the alphab et S , we need to construct a Lexis- D AG. A Lexis-D AG D is a directed acyclic graph D ( V , E ), where V is the set of no des and E the set of edges, that satisfies the follo wing three constrain ts: 3 a) Each no de v ∈ V in a Lexis-DA G represents a string S ( v ) of characters from the alphab e t S . The no des V S that represen t characters of S are referred to as sour c es , and they hav e zero in-degree. The no des V T that represent target strings T = { t 1 , t 2 , . . . , t m } are referred to as tar gets , and they hav e zero out-degree. V also includes a set of interme diate no des V M , whic h represent substrings that app ear in the targets T . So, V = V S ∪ V M ∪ V T . b) Eac h no de in V M ∪ V T of a Lexis-DA G represents a string that is the concatenation of tw o or more substrings, sp ecified b y the incoming edges from other nodes to that node. Note that there may b e more than one edge from no de u to no de v . c) A Lexis-DA G should only include in termediate no des that hav e an out-degree of at least tw o, ∀ v ∈ V M , d out ( v ) ≥ 2 for a more parsimonious hierarchical representation. Fig. 1 illustrates the concepts in tro duced here. Fig. 1: Illustration of the Lexis-DA G for a single target T = { abbbbbba } and sources S = { a, b } . Edge-lab els indicate the o ccur- rence indices: (a) A v alid Lexis-DA G hav- ing both minim um n umber of concatenations and edges. (b) An inv alid Lexis-DA G: tw o in termediate no des are re-used only once. (c) An in v alid Lexis-D AG: the top-la yer string is not equal to the concatenation of its t wo in- neigh b ors (b est viewed in color). a b abbbbbba 1 7 bbb 2 5 1 2 3 (a) a b abbbb 1 bbbb 2 bba 3 bb 1 abbbbbba 1 6 1 3 1 2 (b) a b abbbb 1 bbbb 2 bbbba 5 1 abbbbbba 1 4 bb 1 3 1 2 (c) 3 T o simplify the notation, ev en though D is a function of S and T , we do not denote it as suc h. Ev olution of Hierarchical Structure & Reuse in iGEM Syn thetic DNA Sequences 3 The Lexis Optimization Problem The L exis optimization problem is to construct a minim um-cost Lexis-D AG for the given alphabet S and target strings T . In other w ords, the problem is to determine the set of in termediate no des V M and all required edges E so that the corresp onding Lexis-DA G D is optimal in terms of a giv en cost function C ( D ). This problem can b e formulated as follo ws: min ( E ,V M ) C ( D ) s.t. D = ( V , E ) is a Lexis-DA G for S and T where C ( D ) = E ( D ) = X v ∈ V d in ( v ) = | E | (1) A natural cost function, as inv estigated in previous w ork [20], is the num b er of edges in the Lexis- D AG. The e dge c ost to construct a no de v ∈ V is defined as the n umber of incoming edges required to construct S ( v ) from its in-neigh b ors, which is equal to d in ( v ). The edge cost of source nodes is ob viously zero. The edge cost E ( D ) of Lexis-DA G D is defined as the edge cost of all no des, which is equal to the n umber of edges in D . With edge cost, the problem in Eq. (1) is NP-Hard [20]. This problem is similar to the Smal lest Gr ammar Pr oblem (SGP) [6] and in fact its NP-Hardness is sho wn by a reduction from SGP [20]. W e solve the Lexis optimization problem in Eq. (1) with a greedy heuristic, called G-Lexis [20]. G-Lexis starts with the trivial flat Lexis-DA G, and at each iteration it chooses the substring ξ that maximally reduces the edge cost, when it is added as a new intermediate no de to the Lexis-DA G and the corresp onding edges are rewired by its addition. P ath-Centralit y and the Core of a Lexis-DA G After constructing a Lexis-DA G, an imp ortant question is to rank the constructed in termediate no des in terms of significance or c entr ality. More formally , let P D ( v ) b e the num b er of source-to-target paths that trav erse node v ∈ V M ; we refer to P D ( v ) as the p ath c entr ality of intermediate no de v . P ath centralit y can b e computed as: P ( v ) = P S ( v ) P T ( v ) where P S ( v ) is the num ber of paths from an y source to v , and P T ( v ) is the num ber of paths from v to an y target. 4 An imp ortant follow-up question is to identify the c or e of a Lexis-DA G, i.e., a set of in termediate no des that represen t, as a whole, the most imp ortan t substrings in that Lexis-DA G. In tuitively , we exp ect that the core should include no des of high path centralit y , and that almost all source-to-target dep endency c hains of the Lexis-DA G should trav erse at least one of these core no des. More formally , supp ose K is a set of intermediate no des and P − ( K ) is the set of source-to-target paths after we remov e the no des in K from D . The core of D is defined as the minimum-cardinalit y set of intermediate no des C or e ( τ ) = ˆ K suc h that the fraction of remaining source-to-target paths after the remov al of ˆ K is at most τ : 5 ˆ K = ar g min K ⊆ V M | K | s.t. | P − ( K ) | ≤ τ | P − ( ∅ ) | (2) where | P − ( ∅ ) | is the num b er of source-to-target paths in the original Lexis-DA G, without remo ving any no des. W e solve the core identification problem with a greedy algorithm referred to as G-Core [20]. This algorithm adds in each iteration the no de with the highest path-centralit y v alue to the core set, up dates the Lexis-D AG by remo ving that no de and its edges, and recomputes the path centralities of the remaining nodes b efore the next iteration. Hourglass score In tuitiv ely , a Lexis-DA G exhibits the hourglass effect if it has a small core. W e use a metric, named as Hourglass Score, or H-Sc or e , in our study for measuring the “hourglass-ness” of a net work. This metric w as originally presen ted in [19]. T o calculate the H-score, w e create a flat Lexis-DA G D f con taining the same targets as the original Lexis-DA G D . Note that D f preserv es the source-target dep endencies of D : each target in D f is constructed based on the same set of sources as in D . How ever, the dep endency paths in D f are direct, without forming an y intermediate mo dules that could b e reused across differen t targets. So, b y construction, the flat Lexis-DA G D f cannot ha ve a non-trivial core since it do es not hav e any intermediate no des. W e define the H-score as follows: H D ( τ ) = 1 − | C or e ( τ ) | | C or e f ( τ ) | where 4 A similar metric, called str ess c entr ality of a vertex, is studied in [12]. 5 T o simplify notation, w e do not denote the core set as function of D . 4 P . Siy ari et al. C or e ( τ ) and C or e f ( τ ) are the core sets of D and D f for a given threshold τ , respectively . Since that C or e f can include a combination of sources and targets, it would never b e larger than either the set of sources or targets, i.e., | C or e f ( τ ) | ≤ min {| S | , | T |} . Th us, 0 ≤ H ( τ ) ≤ 1. The H-score of D is approximately one if the core size of the original Lexis-DA G is negligible compared to the the core size of the corresp onding flat Lexis-D AG. 2.2 Ev o-Lexis F ramew ork and Key Results The Ev o-Lexis framework includes a n umber of comp onents that are described b elow. A general illus- tration of the framew ork is shown in Fig. 2. In every iteration, the following steps are p erformed: (1) A batc h of new targets is generated via a target generation mo del. (2) In the “expansion phase”, the new targets are added incrementally to the current Lexis-DA G by minimizing the marginal cost of adding ev ery new target to the existing hierarc hy . W e refer to this incr emental design algorithm as Inc-Lexis , and it is describ ed in detail [21]. (3) If the num ber of targets that are presen t in the system has reac hed a steady-state threshold, we also remov e the batch of oldest targets from the Lexis-DA G. • • • • • • • • • • • • • • • • • • • • • • • • • • • • • • • • • • • • • • • • • • • • • • Targ et Gene ra tion Model New batch of targets Evo-Lexis Incremental Design • • • • • • • • • • • • • • • • • • • • • • • • • • • • • • • • • • • • • • • • Old t argets removal (one batch) Initial Lexis - DAG Expansion Phase • • Final Lexis - DAG • • • • • • • • • • • • • • • • • • • • • • • • • • • • • • • • • • • • • • • • • • • • • • • • • • • • • • • • • • • • • • • • • • • • • • • • • • • • • • • • • • • • • Pruning Phase Removal of batch o f old targets Fig. 2: A diagram of the Evo-Lexis framework. In general, a system in teracts with its en vironment in a bidirectional manner: the environmen t im- p oses v arious constraints on the system and the system also affects its en vironment. T o capture this co-ev olutionary setting in Evo-L exis , we study ho w c hanges in the set of targets affect the resulting hier- arc hy but also ho w the current hierarc h y affects the selection of new targets (i.e. whether a new candidate target is selected or not dep ends on its fitness or cost – and that depends on how easily that target can be supp orted b y the given hierarch y). By incorp orating well-kno wn evolu tionary mechanisms, suc h as tin- k ering (mutation), recom bination, and selection, Evo-L exis can capture such co-evolutionary dynamics b et ween the generation of new targets and the hierarch y that supp orts them. Fig. 3 is an o verview of the follo wing k ey results from the Evo-Lexis mo del: i) Tinkering/mutation in the target generation pro cess is found to b e a strong initial force for the emergence of lo w-cost and deep hierarchies. ii) Sele ction is found to enhance the emergence of more complex intermediate modules in optimized hierarchies. The bias to wards reuse of complex modules results in an hourglass arc hitecture in whic h almost all source-to-target dep endency paths trav erse a small set of intermediate mo dules. iii) The addition of r e c ombination in the target generation pro cess is essential in pro viding target diversit y in optimized hierarchies. Ev olution of Hierarchical Structure & Reuse in iGEM Synthetic DNA Sequences 5 MR S Mo de l (i .e. M utations+ Recombi nat ion + Sel ection Mode l ) 1- Low -cost hierarchy 4- Hourglass property 2- Deep hierarchy 5- Target diversity 3- Reuse of complex nodes ✓ ✓ ✓ ✓ ✓ • • • • • • • • • • • • • • • • • • • • • • • • • • • • • • • • • • • • • Ta rge t Ge ne r a tion M ode ls a nd R e s ulting Hie r a r c hie s Remo v ing E v olu tiona ry Mech an isms - R em ove Sel e ct i on (i .e. Mutati on Mode l ) • • • • • • • • • • • • • • • • • • • • • • • • • • • • • • • • • • • • • • • • • • • • • • • • - R em ove Rec om bi nat i o n (i .e. M utations+Sel ect ion Mod el ) 1- Low -cost hierarchy 4- Hourglass property 2- Deep hierarchy 5- Target diversity 3- Reuse of complex nodes ✓ ✓ ✓ ✓ x • • • • • • • • • • • • • • • • • • • • • • • • • • • • • • • • • • • • • Le x is f r a m e wor k De s i g n o p t i m a l h i e r a r c h i e s ov er a s et of t ar get s fr o m a g i v e n a l p h a b e t o f s o u r c e s Ev o - Le x is f r a m e wor k Co - ev ol ut i on of ta r g e ts a n d h i e r a r c h y • • • • • So u r c e s Ta r ge t s • • • • • • • • • • • • • • • • • • • • • • • • • • • • • • • • • • • • • • • • • • • • • • • 1 . I n i t i a l L e xi s - DA G 2 . N e w t a r g e t s g e n e r a t e d ( b i r t h s) / O l d t a r g e t s r e m o ve d ( d e a t h s) S e l e ct i o n b a se d o n t a r g e t st r u ct u r e a n d cu r r e n t L e xi s - D A G co n t e n t s ✓ C o st = 2 C o st = 6 x • • • • • • • • • • • • • • • • • • • • • • • • • • • • • • • • • • • • • • • • • • • • • • 3 . I n cr e m e n t a l l y a d j u st e d L e xi s - DA G I n cr e a si n g n o d e co m p l e xi t y ( se q u e n ce l e n g t h ) • • • • • ? • • • • • • • • • • • • • • • • • • • • • • • • • • • • • • • • • • • • • • • - R em ove Muta tion (Ra ndom Targets) (i .e. Ra ndo m M o de l ) • • • • • • • • • • • • • • • • • • • • • • • • • • 1- Low -cost hierarchy 4- Hourglass property 2- Deep hierarchy 5- Target diversity 3- Reuse of complex nodes ✓ ✓ ✓ 1- Low -cost hierarchy 4- Hourglass property 2- Deep hierarchy 5- Target diversity 3- Reuse of complex nodes x x x x x x x Fig. 3: Overview of results from Evo-Lexis. 3 iGEM Dataset 3.1 Preliminaries The In ternational Genetically Engineered Machine (iGEM) is an ann ual worldwide synthetic biology comp etition. The competition is b etw een students from div erse backgrounds including biology , chemistry , ph ysics, engineering, and computer science to construct syn thetic DNA structures with nov el functional- ities. Ev ery year at the b eginning of the summer, there is a “Distribution Kit” handed to teams which includes interc hangeable parts (so called “BioBricks”) from the Registry of Standard Biological Parts comprising v arious genetic comp onents such as promoters, terminators, reporter elements, and plasmid bac kb ones. Then, the teams try to use these parts and the new standardized parts of their own in order to build biological systems. The teams can build on previous pro jects or create completely new parts. At the end of the summer, all teams add their new BioBric ks to the registry for further p ossible reuse in next y ears. The iGEM Registry (i.e., the dataset we are working with) includes a s et of standard biological parts. A [biological] part is a DNA sequence which enco des a biological function, e.g., a promoter or protein co ding sequence. These biological parts are standardized to b e easily assembled together and reused with other standardized parts in the registry . A “basic part” is a functional unit of a syn thesized DNA that cannot b e sub divided into smaller comp onen t parts. BBa R0051 is an example of a promoter basic part. Basic parts hav e the role of sources in the Lexis setting. A “compos ite part” is a functional unit of DNA consisting of t wo or more basic parts assembled together. BBa I13507 is an example of a comp osite part, consisting of four basic parts “BBa B0034 BBa E1010 BBa B0010 BBa B0012”. The dataset we analyze is the set of all composite parts sub mitted to the registry from 2003 to 2017. In this dataset, the composite parts are represented b y the string of their basic parts (i.e., a non-dividing representation). The sequence of iGEM comp osite parts can b e considered as a sequence of target strings ov er a set of sources (i.e., basic parts). W e hav e acquired the iGEM data from https://github.com/biohubx/igem- data . All the BioBric k parts were cra wled until Dec 28th 2017. In T able 1, the preliminary statistics ab out the dataset are listed. The dataset mostly presen ts targets of small length. The top 5 categories ha ving the highest fraction of the targets b elongs to those of length 5, 2, 3, 4 and 6, accounting for more than 70% of the dataset. Less than 10% of the targets hav e a length of more than 10. 6 P . Siy ari et al. T able 1: Basic statistics on iGEM dataset during 15 y ears (2003-2017) # Sources # T argets T otal Length Min/Max T arget Length 7,889 18,394 107,022 2 / 100 3.2 Considering Annual Batches of T argets The iGEM comp etition is conducted annually . Hence, it is reasonable to consider the sequences of targets as annual batches of targets arriving eac h year. This consideration is in line with the incremental design pro cess in Evo-Lexis. T o show some differences b etw een iGEM and Evo-Lexis, in Fig. 4, we can see how the num b er of sources, the num b er of targets, length statistics and source reuse statistics change ov er time. W e can mak e the following observ ations from these figures: 1. The n umber of sources increases, where it was constant in Ev o-Lexis. 2. In the first four y ears, the n umber of targets p er year is noticeably small. Later on, the n umber of targets increases up to 2,000 and then fluctuates around 1,000 to 1,300 targets per y ear. In Evo-Lexis, the n umber of targets p er batch is constant and they all hav e the same length. 3. The mean and median of target lengths stay in the same range ( ∈ [5 , 7]) during all 15 years. 4. The reuse of sources (except for the b eginning y ears) is extremely sk ewed in all years: few sources are used muc h more often than most of the sources (Fig. 4d). In Evo-Lexis, all sources are equally likely . In the following sections, we sho w that how these differences b etw een iGEM dataset and Evo-Lexis cause differences betw een the resulting Lexis-DA Gs. 2002 2004 2006 2008 2010 2012 2014 2016 2018 Year 0 500 1000 1500 2000 2500 Number of Sources/Targets Targets Sources (a) 2000 2005 2010 2015 2020 Year 0 2 4 6 8 10 12 14 Length 3rd Quantile Mean Median 1st Quantile (b) 2002 2004 2006 2008 2010 2012 2014 2016 2018 Year 0 0.2 0.4 0.6 0.8 1 Year by year similarity (c) Source set similarity in years 0. 0005 0. 005 0. 05 0. 5 1 10 10 0 PDF Numbe r of r e use 20 03 20 04 20 05 20 06 20 07 20 08 20 09 20 10 20 11 20 12 20 13 20 14 20 15 20 16 20 17 (d) PDF of reuse of the sources p er year. Fig. 4: Statistics of iGEM dataset when considered as yearly batches. Number of reuse is the num b er of times a source app ear in a target in each year. Ev olution of Hierarchical Structure & Reuse in iGEM Synthetic DNA Sequences 7 4 Analysis of iGEM Dataset in Ev o-Lexis F ramew ork F rom this section on, we compare the results ov er iGEM with the results gathered from Evo-Lexis in [21]. W e refer the reader to [21] for details of the model and parameter settings. 4.1 Lexis-D AG Cost Analysis In this section, we observe how cost efficient the Lexis-DA Gs ov er the iGEM dataset are. W e consider an incremen tal setting similar to Ev o-Lexis: In the first y ear, a clean-slate Lexis-D AG is constructed o ver the targets of that y ear. F or the targets of the subsequent years, an incremen tal Lexis-D AG is constructed. Fig. 5 shows ho w the normalized cost of the Lexis-DA Gs v aries ov er the years on iGEM. W e observe ma jor differences with Evo-Lexis; in Ev o-Lexis the normalized cost remains almost constant. 2002 2004 2006 2008 2010 2012 2014 2016 2018 Year 0 0.2 0.4 0.6 0.8 1 Normalized Cost After stage-1 of Inc-Lexis After stage-2 of Inc-Lexis (a) The cost evolution in iGEM 0 1000 2000 3000 4000 5000 Evolution Iterations 0 0.2 0.4 0.6 0.8 1 Normalized Cost (b) The cost evolution in Evo-Lexis Fig. 5: Comparison of cost evolution in iGEM and Evo-Lexis (from [21]) T o inv estigate the reasons for the ab ov e observ ations, in the same Fig. 5, w e also track the cost reduction p erformance of the tw o stages of Inc-Lexis for each batc h (as a reminder, in stage-1, we reuse in termediate no des from previous Lexis-DA G and in stage-2, w e further optimize the hierarch y using G- Lexis ). This exp eriment is done due to our interest in seeing how muc h stage-1 of Inc-Lexis contributes to the cost reduction on iGEM. There are tw o observ ations that we can mak e: 1. In most batches, more than 50% of the cost reduction is achiev ed b y the stage-1, i.e., reuse stage. The contribution of stage-2 of Inc-Lexis is roughly constant throughout y ears. This suggests that iGEM targets reuse a significant amount of sequences from previous years in their o wn submissions. 2. There is an increasing trend in the normalized cost after stage-1. This observ ation means that the con tribution of the reuse stage in Inc-Lexis decreases ov er the years. As men tioned, the contribution of stage-2 stays mostly constant. Hence, we can relate the increasing trend of the normalized cost to the fact that the amount of reuse reduces from year to year. W e can find the ro ot-cause of the decrease of reuse ov er time on iGEM to the increase of the size of the set of sources. W e hav e observed in Fig. 4a that there are man y new sources that get introduced o ver the y ears. One of the requirements for reuse from one batch to another in Evo-Lexis is the fact that the set of sources do es not drastically change (in fact it is constant in the Evo-Lexis framework). T o in vestigate whether this is true in iGEM, we c heck the ratio of the sources from one year to the next that remain the same. Specifically , if we hav e y 2 = y 1 + 1, and if S y 1 & S y 2 are the set of sources in year y 1 & y 2 resp ectiv ely , w e chec k the ratio: | S y 1 ∩ S y 2 | | S y 1 | . This ratio, i.e., ye ar-by-ye ar similarity , is the fraction of sources that remain from the previous y ear. Fig. 4c shows how this ratio changes from year to year. By y ear 2008, the ratio drops significan tly to a v alue around 0.2 whic h means around 80% of the sources from 8 P . Siy ari et al. the previous year are not reused. This reduces the amount of reuse that is p ossible in the iGEM dataset. The in tro duction of new sources is also propagated in individual targets. As time progresses, there is a higher probabilit y to use more than X n um b er of new sources per target. This observ ation is a further obstacle for reuse, esp ecially given that the targets in iGEM are often short (5-7 subparts). F ollo wing the increase of the normalized cost, Fig. 6 shows that the DA Gs get less deep and ha ve lo wer av erage no de length as time progresses. Ov erall, the results of this section show a num b er of differences b etw een iGEM and Ev o-Lexis: 0 1000 2000 3000 4000 5000 Evolution Iterations (Evo-Lexis) 0 1 2 3 4 5 6 7 8 Average Depth 2004 2006 2008 2010 2012 2014 2016 Year (iGEM) (a) Av erage depth 0 1000 2000 3000 4000 5000 Evolution Iterations (Evo-Lexis) 0 5 10 15 20 25 Average Node Length 2004 2006 2008 2010 2012 2014 2016 Year (iGEM) (b) Av erage no de length Fig. 6: Average depth and no de length in iGEM and Evo-Lexis (in green, [21]) 1. In iGEM, the set of sources in each year has low similarity to the previous years, while in Evo-Lexis the source set is constan t. The high amoun t of ch urn in the set of sources is the primary reason for the low er reuse in iGEM data compared to Evo-Lexis. The fact that the targets are shorter is another factor for iGEM’s low er potential for reuse of longer in termediate no des. 2. The normalized cost, depth and av erage no de length are all low er in iGEM due to the reduced reuse p oten tial as discussed ab o ve. 4.2 Hourglass Effect in iGEM The following results in this section sho w that in all years, there is a small num b er of core nodes in the iGEM Lexis-DA Gs. Fig. 7 sho ws that such small cores make the top ology of iGEM Lexis-D AGs consisten t with an hourglass organization (high H-score v alues - more than 0.6 in Fig. 7c). In Evo-Lexis, w e observe similar v alues of H-score for DA Gs constructed using syn thetic data. As observed, although the core size increases in iGEM ov er time, we see a steeper increase in the size of the flat DA G’s core mostly due to the increase in set of sources. In Ev o-Lexis, the core size shows a decreasing trend while the size of the core of the flat DA G do es not significantly change, reflecting similarly high H-score v alues as in iGEM. Ov erall, w e can see that the top ology of the Lexis-DA Gs in iGEM data is in line with the Ev o-Lexis mo del, although the bias in selection of cost-saving nodes is not sufficiently large to cause a non-increasing normalized cost. 4.3 Div ersity among iGEM T argets Another question is the degree of diversit y among the targets of iGEM o ver time. W e define the concept of Normalize d Diversity as follows: Suppose we ha ve a set of strings T = { t 1 , t 2 , ..., t n } . The goal is to pro vide a single n umber that quantifies ho w dissimilar these elemen ts are to eac h other. – W e first iden tify the me doid M T of the set T , i.e., the element that has the lo west av erage distance from all other elements. W e use Levensh tein distance as a measure of distance b etw een targets: M T = ar g min m ∈ T P t ∈ T LD ( t, m ). Ev olution of Hierarchical Structure & Reuse in iGEM Synthetic DNA Sequences 9 2002 2004 2006 2008 2010 2012 2014 2016 2018 Year 0 200 400 600 800 1000 Core Size (a) Core Size 2002 2004 2006 2008 2010 2012 2014 2016 2018 Year 0 200 400 600 800 1000 Core Size of Flat DAG (b) Flat DA G Core Size 2002 2004 2006 2008 2010 2012 2014 2016 2018 Year 0 0.2 0.4 0.6 0.8 1 H-score (c) H-score 0 1000 2000 3000 4000 5000 Evolution Iterations 0 10 20 30 40 50 60 70 80 90 Core Size (d) Core Size (e) Flat DA G Core Size 0 1000 2000 3000 4000 5000 Evolution Iterations 0 0.2 0.4 0.6 0.8 1 H-score (f ) H-score Fig. 7: Cores in iGEM and Evo-Lexis (b ottom, [21]) ( τ = 0 . 85). – T o compute how diverse the elements are with resp ect to each other, we av erage the normalized distance of all elemen ts from the medoid (distance is normalized by the maximum length of the tw o sequences in question). W e call this measure σ T , the Normalize d Diversity of set T . The bigger the metric, the more diverse a set of strings is: σ T = P t ∈ T LD [ t, M T ] max ( | t | , |M T | ) | T | . Fig. 8 shows that the normalized div ersity metric has a v alue of more than 0.5 throughout time and reac hes up to 0.8 (this means that on a verage 50% to 80% of a target should b e changed so that a target is con verted to another in the set of targets in eac h year). Although such v alues of diversit y are in line with Ev o-Lexis, it is understandable that the diversit y in iGEM is also partially impacted (to w ards higher v alues) by the introduction of new sources discussed b efore. Because of this reason, and the fact that the div ersity is measured in a slightly different wa y in [21], we do not show a direct comparison in Fig. 8. 2002 2004 2006 2008 2010 2012 2014 2016 2018 Year 0 0.2 0.4 0.6 0.8 1 Normalized Diversity (a) T arget div ersity in iGEM 2002 2004 2006 2008 2010 2012 2014 2016 2018 Year 0 0.2 0.4 0.6 0.8 1 Core Stability (b) Core stabilit y in iGEM 0 500 1000 1500 2000 Evolution Iterations 0 0.2 0.4 0.6 0.8 1 Core Stability (c) Core stabilit y in Evo-Lexis Fig. 8: T arget diversit y and core stability in iGEM ov er time. 10 P . Siy ari et al. 4.4 Core Stability in iGEM Lexis-DA Gs W e ha ve already defined the core size and the H-score. Here we define an additional metric, related to the stabilit y of the core across time. W e track the stability of the core set by comparing tw o core sets at tw o different times. A direct comparison of the core sets via the Jaccard index leads to p o or results. The reason is that often the strings of the tw o sets are similar to each other but not completely identical. Th us, w e define a generalized version of Jaccard similarity that w e call L evenshtein-Jac c ar d Similarity : – Supp ose w e aim to compute the similarity of tw o sets A and B of strings. W e define the mapping A → B where every element a ∈ A is mapp ed to the most similar element b ∈ B . W e also define the mapping B → A from ev ery element b ∈ B to the most similar element a ∈ A : ( A → B = { ( a, b ) s.t. a ∈ A & b ∈ B & b = ar g max x ∈ B S im ( a, x ) } B → A = { ( b, a ) s.t. a ∈ A & b ∈ B & a = ar g max x ∈ A S im ( b, x ) } (3) where S im ( a, b ) is the similarit y of a to b and is calculated as: S im ( a, b ) = 1 − LD ( a,b ) max ( | a | , | b | ) . Notice that max ( | a | , | b | ) is the maximum v alue of Lev enshtein distance b etw een a and b . This consideration ensures that if a = b then S im ( a, b ) = 1, and if a and b ha ve the maxim um distance then S im ( a, b ) = 0. – Considering b oth A → B and B → A , we get the union of the tw o mappings and define the Lev enshtein-Jaccard similarity as follows: Lev J ac ( A, B ) = P ( a,b ) ∈ A → B S im ( a, b ) + P ( b,a ) ∈ B → A S im ( b, a ) ( | A | + | B | ) (4) W e can see that if A = B (all weigh ts are equal to one) then Lev J ac ( A, B ) = 1. Also if none of the elemen ts in A are similar to B (all the element pairs tak e zero similarity v alue), then Lev J ac ( A, B ) = 0. As the results in Fig. 8c sho w, the core set in iGEM DA Gs ha ve relatively high v alues of the core stabilit y measure (Eq. (4)), close to the v alues we observ ed in Evo-Lexis. This means that the core no des sta y similar across time, and there are no sudden changes in the conten t of the core set. One reason for this stabilit y is that the set of core no des includes sev eral sources, and many of core sources get transferred to the next year. Additionally , every y ear the fo cus of the iGEM designers is on specific parts, most of whic h are of high path centralit y . F or example, “BBa B0010 BBa B0012” (the most widely used “terminator” part) and “BBa B0034” are almost alwa ys the top-2 central nodes (with the exception of year 2011). Also, some sources such as “BBa R0011”, alwa ys app ear in the top-20 no des in the core set. Remember that Fig. 4d sho ws that the reuse distribution of sources is highly sk ewed. In summary , the stability of the core set in iGEM is caused b y the same reason with Evo-Lexis, which is the bias and selectivity tow ards using a sp ecific set of no des in consecutiv e years. 5 Conclusions iGEM is a dataset that satisfies the basic assumption of Evo-Lexis framework: a sequence of target strings with p otential temp oral reuse of previously introduced substrings. Because of this compatibilit y , w e chose to use this dataset in a case-study and contrast its qualitative prop erties with Ev o-Lexis. W e can summarize the answers to the questions posed in the abstract of this pap er as follows: – W e observe that although increme n tal design can build efficient hierarchies ov er the iGEM targets, the normalized cost increases o ver time. This is due to the fact that the amount of reuse from previous y ears dec reases mainly due to the frequent in tro duction of new sources ov er time. The small length of the targets in iGEM is also an additional factor for low ering the p otential of reuse of the previously constructed parts in iGEM. – The increasing normalized cost causes the Lexis-DA Gs to b ecome less deep and to contain shorter no des on av erage as time progresses. This is differen t than Evo-Lexis. In addition, there is a high fraction of very short targets in eac h year in comparison to Evo-Lexis. Ev olution of Hierarchical Structure & Reuse in iGEM Synthetic DNA Sequences 11 – The iGEM Lexis-DA Gs presen t a bias in reusing sp ecific no des more often than the other no des. This biased reuse results in the Lexis-DA Gs to take the shap e of an hourglass with relatively high H-score v alues and a stable set of core no des ov er time. This observ ation is consistent with Evo-Lexis. – The core sets ov er the y ears remain stable and similar to previous y ears in iGEM data despite the fact that the set of sources changes significantly and the target sets are div erse eac h y ear. Most of the stability is contributed by a small set of central sources and cen tral intermediate no des that are hea vily reused in iGEM registry ov er time. References 1. igem.org/Main Page 2. Akhshabi, S., Do vrolis, C.: The evolution of la yered protocol stacks leads to an hourglass-shaped architecture. pp. 206–217. SIGCOMM ’11, ACM (2011) 3. Blak es, J., Raz, O., F eige, U., Bacardit, J., Widera, P ., Ben-Y ehezkel, T., Shapiro, E., Krasnogor, N.: Heuristic for maximizing DNA re-use in synthetic DNA library assembly . ACS Synthetic Biology 3 (8), 529–542 (2014) 4. Callebaut, W., Rasskin-Gutman, D.: Mo dularity: Understanding the Developmen t and Evolution of Natural Complex Systems. Vienna series in theoretical biology , MIT Press (2005) 5. Casci, T.: Hourglass theory gets molecular approv al. Nature Reviews Genetics 12 , 76 EP – (Dec 2010) 6. Charik ar, M., Lehman, E., Liu, D., Panigrah y , R., Prabhak aran, M., Sahai, A., Shelat, A.: The Smallest Grammar Problem. IEEE T. on Inf. Theory 51 (7) (2005) 7. Clune, J., Mouret, J.B., Lipson, H.: The evolutionary origins of mo dularity . Proceedings of the Roy al So ciety of London B: Biological Sciences 280 (1755) (2013) 8. Csete, M., Doyle, J.C.: Bow ties, metab olism and disease. T rends in biotechnology 22 9 , 446–50 (2004) 9. F ortuna, M.A., Bonachela, J.A., Levin, S.A.: Evolution of a mo dular softw are netw ork. PNAS 108 (50), 19985–19989 (2011) 10. F riedlander, T., May o, A.E., Tlusty , T., Alon, U.: Evolution of b ow-tie architectures in biology . PLOS Com- putational Biology 11 (3), 1–19 (03 2015) 11. Hin ton, G.E., Salakhutdino v, R.R.: Reducing the dimensionality of data with neural netw orks. Science 313 (5786), 504–507 (2006) 12. Ishakian, V., Erds, D., T erzi, E., Bestavros, A.: A F ramework for the Ev aluation and Management of Net w ork Cen trality , pp. 427–438 13. Kash tan, N., No or, E., Alon, U.: V arying environmen ts can sp eed up evolution. PNAS 104 (34), 13711–13716 (2007) 14. Kash tan, N., Alon, U.: Sp on taneous ev olution of mo dularit y and netw ork motifs. PNAS 102 (39), 13773–13778 (2005) 15. Mengistu, H., Huizinga, J., Mouret, J.B., Clune, J.: The evolutionary origins of hierarch y . PLOS Computa- tional Biology 12 (6), 1–23 (06 2016) 16. Meunier, D., Lambiotte, R., Bullmore, E.: Mo dular and hierarchically mo dular organization of brain net works. F ron tiers in Neuroscience 4 , 200 (2010) 17. Miller, W.: The hierarchical structure of ecosystems: Connections to evolution. Evolution: Education and Outreac h 1 (1), 16–24 (Jan 2008) 18. My ers, C.R.: Softw are systems as complex netw ork s: Structure, function, and evolv ability of softw are collab- oration graphs. Ph ys. Rev. E 68 , 046116 (Oct 2003) 19. Sabrin, K.M., Dovrolis, C.: The hourglass effect in hierarchical dep endency net works. Netw ork Science 5 (4), 490–528 (2017) 20. Siy ari, P ., Dilkina, B., Do vrolis, C.: Lexis: An optimization framew ork for disco vering the hierarchical structure of sequen tial data. pp. 1185–1194. SIGKDD ’16, ACM (2016) 21. Siy ari, P ., Dilkina, B., Dovrolis, C.: Emergence and ev olution of hierarchical structure in complex systems. T o App ear in Dynamics On and Of Complex Net works II I: Machine Learning and Statistical Ph ysics Approac hes (2019) 22. Supp er, J., Spangenberg, L., Planatscher, H., Dr¨ ager, A., Schr¨ oder, A., Zell, A.: Bowtiebuilder: mo deling signal transduction path wa ys. BMC Systems Biology 3 (1), 67 (Jun 2009) 23. T anak a, R., Csete, M., Doyle, J.: Highly optimised global organisation of metab olic net works. IEE Proceedings - Systems Biology 2 (4), 179–184 (Dec 2005) 24. W agner, G.P ., Pa vlicev, M., Cheverud, J.M.: The road to modularity . Nature Reviews Genetics 8 , 921 EP – (Dec 2007), review Article
Original Paper
Loading high-quality paper...
Comments & Academic Discussion
Loading comments...
Leave a Comment