Multi-Speaker DOA Estimation Using Deep Convolutional Networks Trained with Noise Signals
Supervised learning based methods for source localization, being data driven, can be adapted to different acoustic conditions via training and have been shown to be robust to adverse acoustic environments. In this paper, a convolutional neural networ…
Authors: Soumitro Chakrabarty, Emanu"el A. P. Habets
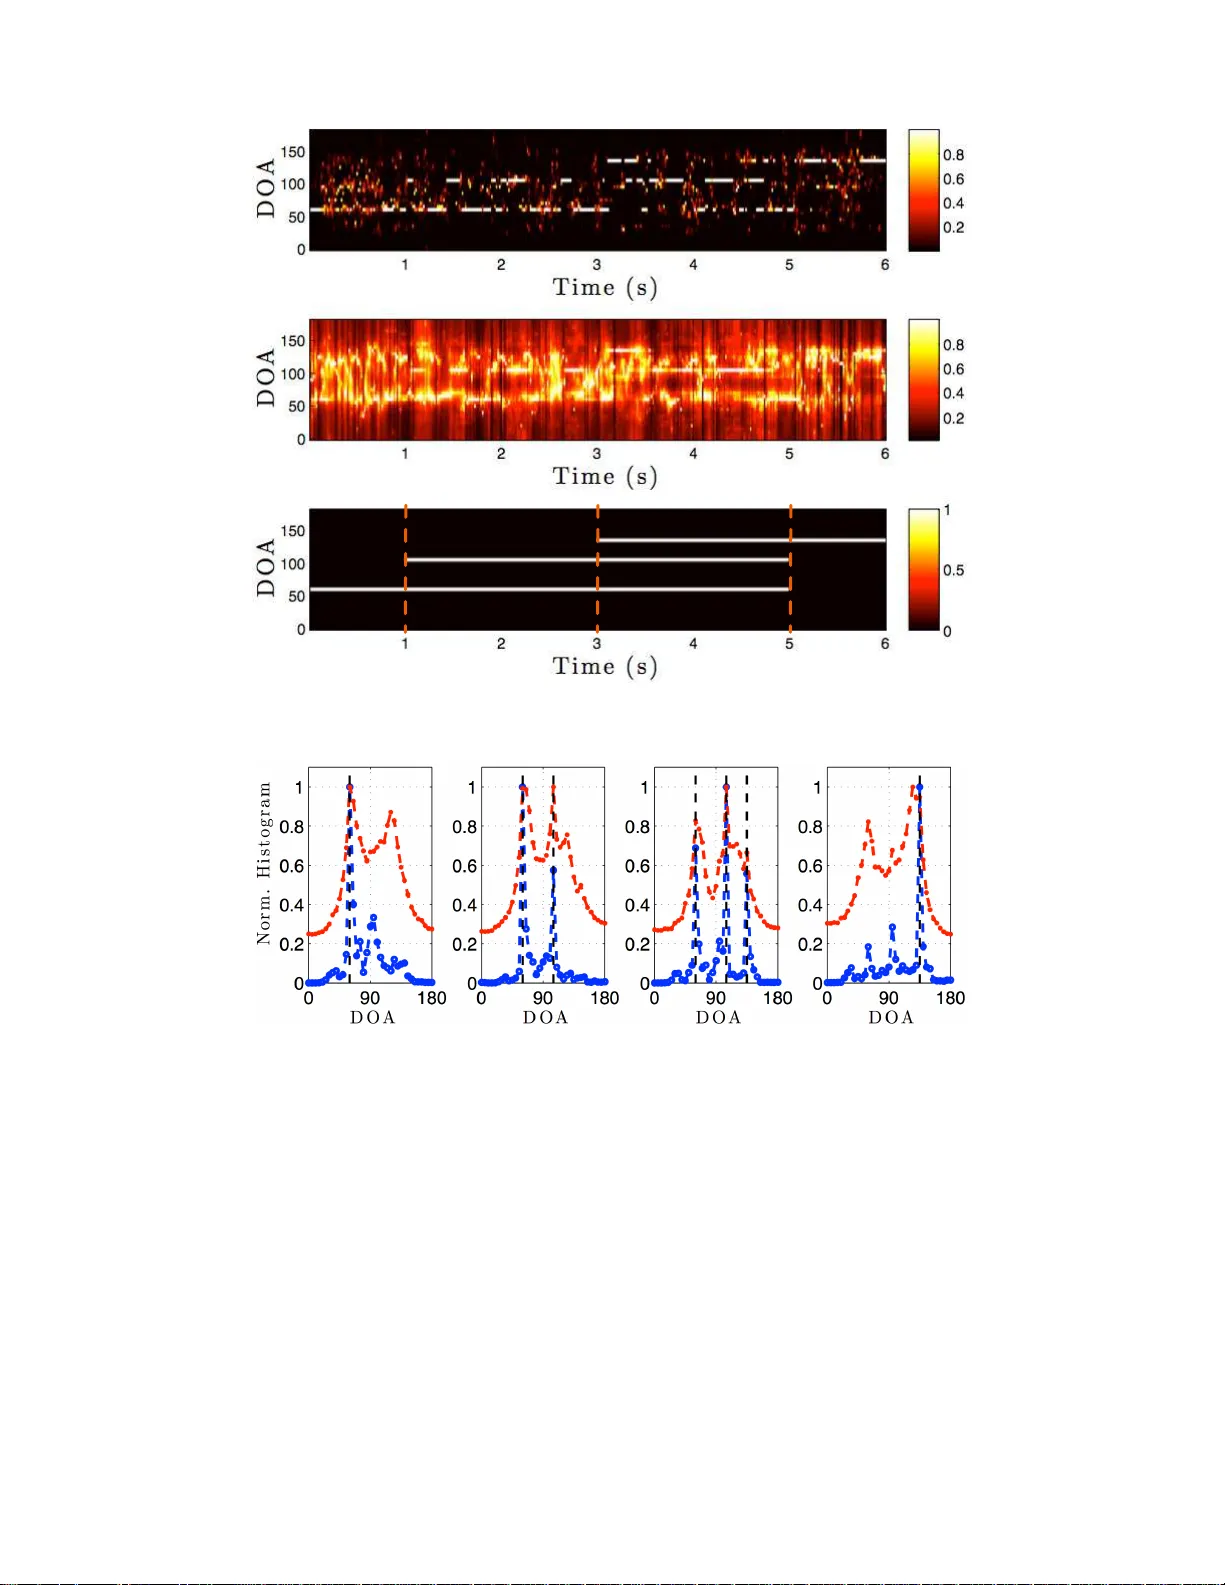
1 Multi-Sp eaker DO A Esti mation Using Deep Con volutional Networks T rained with No ise Signals Soumitro Chakrabar ty , Student Member , IEEE , and Emanu ¨ el A. P . Habets, Senio r Member , IE EE Abstract — Supervi sed learning based m ethods f or source l ocali zation, being data dri ven, can be adapted to differ ent acoustic conditions via training and hav e been shown to be rob ust to adver se acoustic en vir onme nts. In this paper , a conv olutiona l neural network (CNN) based supervi sed learni ng method for e stimating the dire ction-of-ar ri val (DO A) of multiple speakers is proposed. Multi-speake r DOA estimation is form ulated as a multi-cl ass multi-label classification probl em, where the assignment of each DO A label to the input feature is treated as a separate binary classificatio n proble m. The phase component of the short- time Fo urier transf orm (STFT) coefficie nts of the recei v ed micr ophone signals are dir ectly fed into the CNN, and the featur es for DO A estim ation are learnt during training . Utilizing the assumption of disjoint speake r acti vity in the STFT domain, a nov el method is proposed to train the CNN with synthesized noise signals. Through experimenta l e v aluation with both simulate d and measured acoustic impulse re sponses, the ability of the proposed DO A estimation approach to adapt to unseen acoustic conditions and its robustness to unseen noise type is demonstrated. Through additional empirical inv estigati on, it is also shown that with an array of M microphone s our pr oposed framework yields the best locali zation perform ance with M-1 con volution laye rs. The ability of the propose d method to accurate ly localize speaker s in a dynamic acoustic scenario with vary ing number of sources is also shown. Index T erms —source loc alizat ion, multiple speaker s, con volutional neural networks I . I N T R O D U C T I O N Many applications such as hands-free communication, teleconfer - encing, robot audition and distant speech recognition require infor- mation on t he location of sound sources in the acoustic en vironment. Information regarding the source location can be utilized for the task of enhancing the signal coming from a specific location while sup- pressing the undesired signal compo nents. In some applications, the information is used for camera steering whereas in applications like robot audition the source location information is used f or navigation purposes. T he relativ e direction of a soun d source wi t h respect to a microphone array is generally giv en in terms of the direction of arriv al (DO A) of the sound wave originating from the source position. In most practical scenarios, this info rmation is not av ailable and the DO A of the sound source need t o be estimated. Ho we ver , accurate DO A estimation is a challenging task in the presence of noise and rev erberation . The task becomes ev en more difficult when the DOAs of multiple sound sources need to be estimated. In the lit erature related to DOA estimation, there exist two kinds of estimation paradigms: broadband and narrowband DO A estimation. In narrowba nd DO A estimation, the task of DO A estimation is per- formed separately for each frequenc y sub-band, whereas in broadband Copyri ght (c) 2018 IEE E. Personal use of this material is permitted . Ho we ver , permission to use this materia l for any other purposes must be obtaine d from the IEEE by sending a request to pubs-permissions@iee e.org. Soumitro Chakrabar ty and Emanu ¨ el Habets are with the Internatio nal Audio Laboratori es Erlangen (a joint institution between the Unive rsity of Erlangen- Nurember g and Fraunhofer IIS), Germany . Correspondi ng address: Soumitro Chakra barty , Internationa l A udio Lab- oratorie s Erlangen, Uni versity of Erla ngen-Nure mberg, Am W olfsmantel 33, 91058 Erlangen, Germany . Em ail: soumitro.chakra barty@a udiolabs- erlange n.de. This manuscript has been submitted to IEEE for possible publica tion. Based on the policies of IEEE , follo wing a Copy right transfe r , this ve rsion of the articl e may not be av ail able. DO A esti mation the task i s performed for the whole input spectrum. In this work, the f ocus is on broadband DOA estimation. Over the years, sev eral approaches have been dev eloped for the task of broadband DO A estimation. Some popular approach es are: i) subspace based approache s such as multiple signal classification (MUSIC) [1 ], [2 ], ii) time difference of arriv al (TDOA) based approaches that use the family of generalized cross correlation (GCC) methods [3], [4], iii) generalizations of the cross-correlation methods such as steered response po wer with phase transform (SRP- PHA T) [5], and multichannel cross correlation coefficient (MCCC) [6], iv) ad apti ve multichan nel time delay estimation using blind system identification based methods [7], v) probabilistic model based methods such as maximum l ikelihood method [8] and vi) methods based on histogram analysis of narro wband DO A esti mates [9 ], [10]. These methods are generally formulated under the assump tion of free-field propagation of sound wa ves, howe ver in indoor acoustic en viron ments this assumption is violated due to t he prese nce of rev erberation leading to sev ere degrada tion in their performance. Additionally , these methods are also not robust to noise and generally hav e a high computational cost [6]. Compared to the signal processing based approaches , supervised learning approaches, being data driv en, have the advan tage that t hey can be adapted t o different acoustic con ditions via t raining. Also, if training data from diverse acoustic conditions are av ailable, then these approaches can be made robust against noise and reve rberation. Follo wing the recen t success of deep learning based supervised learning methods i n variou s signal processing related tasks [11], [12], differe nt methods for DOA estimation hav e been proposed [13]–[19]. A common aspect of the methods proposed in [13]–[17] is that they all inv olv e an explicit feature extraction step. In [14], [16], GCC vectors, computed from the microphone signals, are provided as input to the learning framew ork. In [15 ], [17], si milar to the computations in v olved in the MUSIC method for localization, the eigen value decomposition of the spatial correlation matrix is performed to get the eigen v ectors corresponding to the noise subspace, and is provided as input to a neural network. In [13], a binaural setup is considered and binaural cues at dif ferent frequency sub-bands are computed and gi ven as i nput. Such feature extraction steps generally lead to a high computational cost. Additionally , when features compu ted from the microphone si gnals are gi v en as input the neural network mainly just learns the functional mapping fr om the features to the final DO A, which can possibly lead to a lack of robustness against adverse acoustic conditions. One of the main reasons for the su ccess of deep learning has been the encapsulation of the feature extraction step into the learning frame work. Also, by studying the tr aditi onal si gnal processing based methods for DO A estimation, it can be seen that most methods exploit the phase difference information between the microphone signals to perform localization. Based on these observa tions, in [18], the current authors proposed a con volution al neural network (CNN) based supervised learning method for broadband DO A estimation of a single activ e speaker per short-time Fourier transform (STFT) time frame. Rather t han in v olving an explicit feature extraction step, the phase componen t of ST FT coefficients of t he input signa l were directly 2 provid ed as input to the neural network . Another contribution of the work was to show the possibility of training the system using synthesized noise signals, which made the creation of training data much simpler compared to using real world signals like speech. Follo wing that, in [19], the pre viously proposed frame work was extend ed to esti mate multiple speaker DOAs. T here, a novel method was dev eloped to generate the t raining data using synthesized noise signals for multi-speaker l ocalization. One of the main challenges of using noise signals for the multi-speaker case is that, for ov erlapping signals, the phase of the ST FT coefficients get combined non-linearly , and depen d on the magnitude of the individua l signals. This mak es the learning proced ure for the CNN difficult. T o overcome this problem, the property of W -disjoint orthogonality [20 ], which holds approximately for speech signals, was utilized. In terms of e v aluation, only prelimi nary results with simulated data for a single aco ustic setup was shown in [19]. In this paper , we furthe r extend the initial w ork o n DOA esti- mation of multiple speakers presented in [19]. The formulation of the task of multi-speak er DO A esti mation as a multi-label multi- class classification pro blem is pre sented, where first the posterior probabilities of the active source DOAs are estimated at t he frame- lev el. T hen, these frame-le vel probabilities are averaged over multiple time frames depending on the chosen block length ov er which the final DO A estimates are to be obtained. From these av eraged posterior probabilities, assuming the number of speakers, L , within that block is known, the DOAs corresponding t o the classes with the L highest probabilities are chosen as the final DOA estimates. T o build robustness to adverse acoustic conditions, multi-condition training in the f orm of training data from diverse acoustic scenarios is performed. A detailed description of the previously proposed method for generating training data using synthesized noise signals is also presented. W ith respect to the proposed CNN architecture, we first posit t hat due to the small filt ers chosen to learn the phase correlations between neighboring microph ones, M − 1 con vo lution layers are req uired to learn from the phase correlation between all the microphone pairs, where M is t he number of microphones in the array . T hrough experimen tal ev aluation, the requirement of M − 1 layers is shown in terms of both localization performance as well as number of trainable parameters. The influence of distance between t he sources and the microphone array is also in ves tigated experimentally . Thro ugh further experiments with both simulated and measured room impulse responses (RIRs), the rob ustness of t he proposed method to unseen acoustic conditions and noise types is inv estigated. Additionally , we also sho w that even when the CNN is trained t o estimate the posterior probabilities of maximum two DO A classes per STFT time f r ame, at a block level the proposed method can be used to localize greater than two speakers also. The remainder of this paper i s organ ized as follows. In Section II the formulation of the problem as a multi-class multi-label clas- sification is described. In Section III , we revie w the i nput feature representation used in our framew ork. The task of obtaining the final DO A estimates in our proposed system is described in Section IV. Section V presents a detailed description of t he proposed method for generating training data using synthesized noise signals. Experimental e v aluation of t he proposed method i s presented i n Section VI. Section VII concludes the paper . I I . P RO B L E M F O R M U L AT I O N W e want to utilize a CNN based supervised learning frame work for esti mating the DO As of multiple simultaneously activ e sources by learning the mapping from the recorded microphone signals to the DO A of the activ e speech sources using a l arge set of labeled data. STFT Input feature T rue DOA Labels DOA classifier T rain ing data STFT Input feature T est data T rain DOA classifier T raining Inference/T est Posterior probabilities DOA estimate Fig. 1: B lock diagram of the proposed system. The DOA estimation i n this work is performed for signal blocks that consist of multiple ti me frames of t he S TFT representation of the observ ed signals. The block length can be chosen depend ing on the application scenario. For example, for dynamic sound scenes it might be preferable to choose shorter block lengths compared to a scenario when it is kno wn that the sources would be st atic. The problem of multi-source DOA estimation is formulated as an I -class multi-label classification problem. As the first step, the whole DO A range is d iscretized to form a set of possible DO A values, Θ = { θ 1 , . . . , θ I } . A class vector of length I i s then formed where each class corresponds to a po ssible DOA value in the set Θ . In this work, we assume an independent source DOA model, i.e., the spatial location of the sources are independe nt of each other . Due to this assumption, multi-label classifi cation can be tackled using the binary rele v ance method [21], where t he assignment of each DO A class label to the input is treated as a separate binary classification problem. As stated earli er, the aim is t o obtain t he DOA estimates of multiple speakers for a signal block, howe ver the input to the system is a feature representation for each STF T t i me frame separately . As sho wn in Fig. 1, a supervised learning framework consists of a training and a test phase. I n the training phase, the CNN is t rained with a tr aining data set that consists of pairs of fixed dimension feature vec tors for each STFT t i me frame an d the correspo nding true DO A class labels. In t he test phase, gi ven the i nput feature representation correspond ing to a single ST F T time frame, the first task is to estimate the posterior probab ility of each DO A class. Follo wing this, depending on the chosen block length, t he frame- lev el probabilities are averag ed ov er all the time frames in the block. Finally , considering L sources, the DOA esti mates are giv en by selecting the L DO A classes with the highest probabilities. In this work, we consider t he number of sources L to be known. As an alternati ve, the number of acti ve sources can be estimated based on the number of clear peaks in the averaged posterior probabilities for a signal block. Also, t he recorded signal from a reference microphone can also be used for speaker count esti mation using the method proposed in [22]. In vestigating the best strateg y for this problem would be part of future work. I I I . I N P U T R E P R E S E N T A T I O N In t his work, the aim is to l earn the rele v ant features for the task of DO A estimation via training rather than hav e an exp licit feature extraction step to compute the input to be giv en to the system. Therefore we use the phase map [18], [19] as the input feature representation in this work. For the sake of completeness, we giv e a brief description of this representation. 3 Input: M × K Con v1: 2 × 1, 64 Con v2: 2 × 1, 64 Con v(M-1): 2 × 1, 64 F C1: 512 F C2: 512 Output: I × 1 ….. T otal F eature Maps: 64 Size: 1 × K T otal F eature Maps: 64 Size: ( M − 2) × K T otal F eature Maps: 64 Size: ( M − 1) × K Fig. 2: Proposed Architecture. As described earlier, the input to the DNN f r amework is a feature representation corresponding to each STF T time frame. Let us consider that the receiv ed microphone signals are transformed to the STFT domain using an N f point discrete Fou rier transform ( DFT). In the STF T domain, the observe d signals at each TF instance are represented by complex numbers. T herefore, the observed signal can be expressed as Y m ( n, k ) = A m ( n, k ) e j φ m ( n,k ) , (1) where A m ( n, k ) represents the magnitude componen t and φ m ( n, k ) denotes the phase component of the STFT coefficient of the received signal at the m -th microphone for the n -th time frame and k -th frequenc y bin. In this work, we directly provide the phase component of the STFT coefficients of the recei ved signals as input t o our system. Note that this phase t erm consists of the phase of the source along with the effect of the propagation path. The idea is to mak e the system learn the relev ant feature for DOA estimation from the phase componen t through training. Since the aim is t o compute t he posterior probabilities of the DO A classes at each time frame, t he input feature for t he n -th time frame is formed by arranging φ m ( n, k ) for each time-frequency bin ( n, k ) and each microphone m into a matri x of size M × K , where K = N f / 2 + 1 is the total number of frequency bins, upto the Nyquist frequency , at each time frame and M is the total number of microphones in t he array . W e call this feature representation as the phase map . For examp le, if we consider a microphone array with M = 4 microphones and N f = 256 , then the input feature matrix i s of size 4 × 129 . Giv en the input representations, the next task is to estimate the posterior probabilities of t he I DO A classes f or each time f rame. For this, we propose a CNN based supervised l earning method, described in the following section. I V . D OA E S T I M A T I O N W I T H C N N S CNNs are a variant of the standard fully-connected neural network, where the architecture typically consists of one or more con vo lution layers followed by fully-connected networks l eading ot the output [23]. In this work, the main motiv ation behind using CNNs is to learn the discriminative features for DO A estimation from the phase map input by applying small local filters to learn the phase correlations at the different frequency sub-bands. Giv en the phase map as the input, the CNN generates the posterior probability for each of t he DO A classes. Let us denote the phase map for the n -th t ime frame as Φ n . Then the posterior probability generated by the CNN at the output is given by p ( θ i | Φ n ) , where θ i is the DOA corresponding to t he i -th class. In Fig. 2, the CNN arc hitecture used in this work is shown. In the con v olution layers, small filters of size 2 × 1 are applied to learn the phase correlations between neighboring microphones at each frequenc y sub- band separately . This i s in contrast to [18], where square filters of size 2 × 2 were used to learn the features from the neighboring frequenc y bins also. Howe ver , in the case of multiple speak ers neighboring frequenc y bins might contain dom inant activity from differe nt speakers, therefore in this work we use 2 × 1 fil ters. T hese learned features for each sub-band are then aggre gated by the f ully connected layers for the classifi cation task. The proposed architecture consists of at most M − 1 con v olution l ayers, where M is the number of microphones, since after M − 1 layers performing 2D con v olutions is no longer possible as the feature maps become vectors. In terms of the design choice related to the number of con volution layers, w e posit that by using small filters of size 2 × 1 , with each subsequen t con v olution layer after the fi rst one, f or each sub-band, the phase correlation information from different microphone pairs are aggre gated due to the gro wing recepti v e field of the filters, and to learn from the correlation between all microphone pairs, M − 1 con volution layers would be required to incorporate this information into the learned features. In Section VI-B4, w e experimentally demonstrate that indeed M − 1 con volution layers are required to obtain the best DO A estimation performance for a gi ven microphone array and also sho w the ef ficiency of this design choice in terms of number of free parameters. As st ated earlier, we utilize the binary relev ance method [21] to tackle the multi-label classification problem, therefo re the output layer of the CNN consists of I sigmoid units, each corresponding to a DOA cl ass. During training, the optimization of the network weights are done in terms of each output neuron separately , using binary cross-entrop y as the loss function. Here, the task of multi-source DO A estimation is performed for a signal block consisting of N t i me frames. The block-le ve l posterior probab ility is obtained by av eraging N frame-level posterior probabilities for each θ i , giv en by p n ( θ i ) = 1 N n + N − 1 X n p ( θ i | Φ n ) . (2) From these computed ave rage posterior probabilities, the L D OAs correspondin g to the L classes wit h the highest probabilities are selected as the DO A esti mates. In this work we chose this simple method to demonstrate the ef fecti vene ss of the proposed algorithm. Using more advanced post-processing methods, su ch as automatic peak detection [24], is beyond t he scope of this paper . V . T R A I N I N G D A TA G E N E R A T I O N In this section, we describe the training data generation method employ ed i n this work. P lease recall that though the task of DO A estimation is performed for a segment of multi ple time frames, in 4 the proposed system the posterior probabilities of the DO A classes are estimated at each time fr ame. Therefore, using speech as training signals can be problematic since we would require an extremely accurate voice activity detection method in order to av oid including silent time frames in the training data, and errors in this task can adverse ly affect the t raining. T o av oid this problem, i n [18], we proposed to use synthesized n oise signals to generate the training data for the single speaker scenario. Howe v er , when trying to localize simultaneously activ e speakers, using ove rlapping noise signals for the training data is not suitable since at each TF bin, the phase componen t of the observed microphone signals’ STF T coefficient i s a non-linear combination of the phase of the individual directional sources. Thus, learning the rele v ant features from such an input might be difficult for the CNN. T o ef fectiv ely use synthesized noise signals to generate the training data, and taking into account the aim to localize speech sources, we utilize the assumption that the TF representation of two simultane- ously activ e speech sources do not overlap. This is kno wn as W - disjoint orthogon ality , and, with an appropriate choice of t he time and frequency resolutions, has been shown to hold approximately for speech signals [20]. In t he following, we explain t he procedure for generating the training data for a scenario with two activ e speakers. As a first step, w e generate the t raining signals for a single speake r case by con volving the room impulse respons es (RIRs) correspond- ing to differe nt directions for each acoustic condition considered for training with sy nthesized spectrally whit e noise signals. T hen, for a specific source array setup, the STFT representation of two multi-channel training signals, corresponding to differen t DOAs, are con catenated along the time frame axis. Following this, for each frequenc y sub-band separately , the time-frequency bins for all microphones are rand omized to get a single training signal. This procedure is r epeated for all combination s of DOAs for all different acoustic conditions considered for training. Fi nally , the phase map correspondin g to each time frame, for al l training signals, is extracted to form the complete training dataset. While generating the training data, there are two important things to note regarding the randomization process. First , it is essential that the randomization of the TF bins i s done separately for each frequenc y sub-band , such that the order of the frequenc y sub-band s remains the same for different time frames. This is essential since phase correlations are frequenc y depend ent and for all the differen t time frames, preserving the spectral structure can aid the feature learning. Secondly , it is essential that for each frequenc y sub-band, the T F bins for all the microphones are randomized together , such that phase relations between the microphon es for the individual TF bins are preserved. An illustration of this procedure is sho wn in F ig. 3. The figure on the left illustrates the concatenated TF representation of two directional signals, originating from two different directions, θ 1 and θ 2 . Follo wing the randomization procedure, it can be seen that at each time frame there are approximately equal number of TF bins with activ ity corresponding to the two DOAs. Therefore, at each fr equenc y sub-band of the phase map input to t he CNN, the phase of the STFT coef ficients for all microphones correspond to a single source. This makes the assumption of disjoint activity of signals i mplicit within our framewo rk. With this training input, the CNN can learn the relev ant features for localizing multiple speakers at each time frame from the individu al TF bins that contain the phase relati ons across the mi crophones for each source DOA separately . By repeating the above mentioned procedure for all possible angular combinations and acoustic conditions, we obtain the complete training dataset. T he different acoustic conditions considered for the multi-condition training of the C NN is giv en in T able. I. The different Randomize TF bins across time axis for each sub-band θ 1 θ 2 Fig. 3: Illustration of the method used for generating the training data. rooms as well as positions inside each room are considered to dev elop robustn ess in various acoustic conditions, whereas additionally the network is also trained with dif ferent lev els of spatially white noise for robust performance in noisy scenarios. In total, the training data consisted of around 12.4 million time frames. The C NN was trained using the Adam gradient-ba sed opti- mizer [25], with mini-batches of 512 time frames and a learning rate of 0.001. During t r aining, at the end of the con v olution layers and after each fully connected layer , a dropout procedure [26] wit h a rate of 0.5 was used to av oid ov er fitting. All the implementations were done in Ke ras [27]. Please note that, in this wo rk, the CNN is trained to estimate the posterior probabilities of DO As of only two speakers given the phase map input for each STFT time frame. By following the same procedure as described above the method can be extende d for estimating the DOA class posterior probabilities of more than two speakers per time frame. In Section VI-C1, it is shown that despite such a training procedure the proposed method can estimate the DOAs of more than two speakers for a signal block with multiple time frames. V I . E X P E R I M E N T A L E V A L U A T I O N In this section, different experiments with simulated and measured data are presented to objectiv ely e valuate the perfo rmance of the proposed system. For all the experimental ev aluation s except the one presented in Section VI-B4, we consider a ULA with M = 4 microphones with inter-microphon e distance of 8 cm, and the input signals are transformed to the STFT domain using a DFT length of N f = 512 , with 50% overlap , resulting in K = 257 . The sampling frequenc y of the signals is F s = 16 kHz. T o form the classes, we discretize the whole DO A range of a UL A wi th a 5 ◦ resolution to get I = 37 DOA classes, for both training and testi ng. All the presented objecti ve e valuations are for the tw o sp eakers scenario. Howe v er , in Section VI-C1, we also demonstrate the ability of the proposed method to deal with scenarios with varying number of speakers. The speech signals used for e v aluation are taken from the LIBR I speech corpus. With random selected speech utterances, fiv e different two speaker mixtures, each of length 2 s, were used. Since the angular space is discretized with a 5 ◦ resolution, for the experiments with simulated RIRs in Section VI -B, it w as ensured that the ang ular distance between t he two speakers in the different mixtures i s at least 10 ◦ . Therefore, for a specific source-array setup i n a room, each two speak er mixture i s considered for each possible angular combination. This was done to avoid influence of signal variation on the difference in performance for different acoustic conditions. Since the speech utterances can hav e differen t lengths of silence at the beginning, the central 0.8 s segment of the mixtures was selected for ev aluation. Considering an STFT windo w length of 32 ms with 50 % overlap, this resulted in a signal block of N = 50 ti me frames 5 T ABLE I: Configuration for training data generation. All rooms are 2.7 m high. Simulated training data Signal Synthesized noise signals Room size R1: ( 6 × 6 ) m , R2: ( 5 × 4 ) m, R3: ( 10 × 6 ) m, R4: ( 8 × 3 ) m, R5: ( 8 × 5 ) m Array positions in room 7 different positions in each room Source-array distance 1 m and 2 m for each array position R T 60 (s) R1: 0.3, R2: 0.2, R3: 0.8, R4: 0.4, R5: 0.6 SNR Uniformly sampled from 0 t o 30 dB T ABLE II: Configuration for generating test data for experi- ments presented in Section VI-B1 and VI-B2. All rooms are 3 m high. Simulate d test data Signal Speech s ignals from LIBRI Room size Room 1: ( 5 × 7 ) m , Room 2: ( 9 × 4 ) m Array positions in room 4 arbitrary positions in each room Source-ar ray distance 1.3 m for Room 1, 1.7 m for Room 2 R T 60 ( s ) Room 1: 0.38 , Room 2: 0.70 ov er which the frame-lev el posterior probabilities are averaged for the fi nal DO A estimation, as sho wn in (2). A. Baselines and objective measure s The performance of the proposed method is compared to two commonly used signal processing based methods: S teered Response Power with P Hase Tran sform (SRP -PHA T) [5], and broadband MUl- tiple SIgnal Classification (MUSIC) [2]. For t he broadband MUSIC method, to keep the comparison similar with the other methods, the MUSIC pseudo-spec trum is computed at each fr equenc y sub-band for each STFT time frame, with an angular resolution of 5 ◦ ov er the whole DOA space, and then it is av eraged over all t he frequency sub- bands to get the broadband pseudo-spe ctrum. This is then averaged ov er all the t ime frames considered in a signa l b lock and si milar to the proposed method, t he L D OAs with the highest values are selected as the final DOA estimates. Similar post-processing is also performed for the computed SRP - P HA T pseudo-likelihoods at each time frame to get the fi nal DO A estimates for a signal block. For the o bjectiv e ev aluation, two different measures were used: Mean Absolute Error (MAE) and localization accurac y (Acc.). The mean absolute error computed between the true and estimated DOAs for each ev aluated acoustic condition is giv en by MAE ( ◦ ) = 1 LC C X c =1 L X l =1 | θ c l − b θ c l | , (3) where L is the number of simultaneously active speak ers and C is the total number of speech mixture segments considered f or ev aluation for a specific acoustic condition. The true and estimated DOAs for the l -th speake r in the c -th mixture are denoted by θ c l and b θ c l , respecti v ely . The localization accuracy is given by Acc. (%) = b C acc. C × 100 , (4) where b C acc. denotes the number of speech mixtures for which the localization of the speakers is accurate. I n ou r ev aluation , the localization of speakers for a speech segment is considered accurate if the distance between the estimated and the true DOA for all the 6 mics 4 mics Fig. 4: Array setup for experiment presented in Section VI- B4. speak ers is less than or equal to 5 ◦ . B. Experimen ts with simulated RIRs In this section, first, t he performance of the proposed method is e v aluated for acoustic conditions differen t f r om those considered dur- ing training, in the presence of v arying le vels of spatially uncorrelated white noise i n Section VI-B1. Then, we ev aluate the performance in the presence of v arying le vels of diffuse babble noise, a noise type which was unseen during training, along with a constant le vel of spatially white noise in Section VI-B2. In S ecti on VI-B4, we study the influence of the number of conv olution layers on the performance of the proposed method and empirically demonstrate t he optimal choice for the number of con volution layers for t he proposed method. 1) Gener alization to unseen acoustic condition s: T o e v aluate t he performance of the methods for unseen acoustic conditions, we consider two rooms with different rev erberation times as sho wn in T able II. In each room, the ULA is placed at f our different positions and for each of these array positions, the two speakers from each of the fiv e considered mixtures are placed at different angular positions at the same specified source-array distance. For each array position, the total number of mi xtures considered for ev aluation is C = 630 ∗ 5 = 3150 , whe re 630 corresp onds to the number of possible angular comb inations with the constraint of 10 ◦ angular separation between the two speake rs for each of the fi ve mixtures. The performance of the three methods under test is e v aluated for three different lev els of spatially white noise, wit h input SNRs 10, 20 and 30 dB, for both t he rooms and the results in terms of the two considered objectiv e measures are presented in T able III. The shown results for each input SNR was av eraged ov er the four different array positions considered in each room. From t he results, it can be seen that the proposed method is able to provid e accurate localization performance in acoustic en vironments that were not part of the training data. For input SNR of 30 dB, it manages to localize both sources accurately in 98 % of the speech mixtures and shows a very lo w MAE. As the noise lev el increases, the performance worsen s, howe v er it always provides a much better localization accurac y and much lo wer error compared to both MUSIC and SRP-PHA T . 6 T ABLE III: Results for two different rooms with vary ing levels of spatiall y white noise computed over 3150 speech segments of 0.8 s for each array position. For each SNR, the result is averaged ov er the four different array positions in the room. T est Room Room 1 Room 2 SNR 10 dB 20 dB 30 dB 10 dB 20 dB 3 0 dB Measure MAE Acc. MAE Acc. MAE Acc. MAE Acc. MAE Acc. MAE Acc. SRP-PHA T 26 . 7 37 . 7 22 . 7 49 . 3 18 . 9 60 . 4 29 . 2 28 . 2 27 . 6 36 . 9 21 . 6 48 . 3 MUSIC 23 . 3 43 . 4 16 . 2 63 . 4 13 . 4 71 . 3 27 . 1 37 . 7 18 . 6 51 . 7 16 . 6 59 . 6 Propose d 14 . 5 73 . 5 3 . 5 93 . 2 1 . 5 98 . 1 16 . 8 63 . 4 4 . 3 88 . 9 2 . 7 96 . 3 T ABLE IV: Results for two different rooms wit h v arying le vels of babble noise computed over 3150 speech seg ments of 0.8 s for each array position. For each SNR, the result is ave raged over the four different array positions in the room. T est Room Room 1 Room 2 SNR − 5 dB 0 dB 5 dB − 5 dB 0 dB 5 dB Measure MAE Acc. MAE Acc. MAE Acc. MAE Acc. MAE Acc. MAE Acc. SRP-PHA T 22 . 4 40 . 8 21 . 8 46 . 1 19 . 9 57 . 8 23 . 7 40 . 2 20 . 8 46 . 6 20 . 1 48 . 3 MUSIC 23 . 9 39 . 2 18 . 8 49 . 4 16 . 3 59 . 9 25 . 9 36 . 3 19 . 2 49 . 9 18 . 1 52 . 1 Propose d 5 . 0 91 . 9 2 . 1 96 . 8 1 . 1 98 . 7 7 . 1 82 . 9 3 . 4 94 . 3 2 . 0 97 . 5 Considering same noise lev el, performance of the proposed method in both rooms is relativ ely simil ar compared to the si gnal processing based methods which have a considerably better performance in t he less rev erberant room ( Room 1). One of the main reasons for this differe nce is the assumption of free-field sound propagation in the formulation of the signal processing based methods which leads t o considerable deterioration in their performance in more rev erberant conditions. On the other hand, the proposed supervised learning based method i s t rained in a div erse set of acoustic conditions, leading to a much better robustness t o adverse acoustic en vironments. Overall, it can be seen t hat the proposed method has a superior per- formance, in terms of both MAE and localization accuracy , compared to the traditional signal processing based methods f or all the differen t lev els of spatially white noise in both rooms. Among t he t wo signal processing based methods, MUSI C performs much better since the av eraged broadband MUSIC pseudo-spectrum contains clearer peaks compared to SR P -PHA T which tends to exhibit a flatter distribu tion ov er the DO As. 2) Gener alization t o unseen noise type: In the previous experi- ment, the pe rformance of the proposed method w as ev aluated for differe nt lev els of spatially white noise, which is a noise type seen by the network during training. In this Secti on, we consider the presence of diffuse babble noise i n t he acoustic en vironment, which has different spatial as well as spectral characteristics compared to white noise, and is a noise type with which the CNN was no t trained. A 40 s long sample of multi-channel dif fuse babble noise was generated using the acoustic noise field generator [28 ], assuming an isotropic spherically diffuse noise field. The generated babble noise was di vided into 20 seg ments of 2 s each and randomly chosen segmen ts were added to each mixture. The performance of t he methods was ev aluated for three different input SNRs of babble noise: -5 dB, 0 dB and 5 dB. Along with diffu se babble n oise, spatially white noise with an input SNR of 40 dB was also added and results for the two differen t rooms are sho wn in T able IV. Similar to pre vious experiment, results for each input SNR of babble noise was av eraged ove r the four different array positions considered in each room. Though t he proposed method is not trained with diffuse babble noise, it can be seen from the results that even at the lowest input S NR of -5 dB, the proposed method is able to perform accurate localization of the two speakers in both rooms for approximately 90 % of the speech mixtures. Since we consider an isotropic spherically dif fuse noise fi eld, the spatial coherence of t he babble noise is frequenc y dependen t whereas white noise is incoherent for all frequencies. Despite this dif ference, since the proposed method is trained to localize directional sources and due to multi-condition training, as long as the noise source is not directional the proposed method can provid e very good performance. If the results from T able III are compared to T able IV, it can be seen that the deterioration in performance of the proposed method, in terms of the objectiv e measures, as the noise le vels increase i s more prominent when white noise is considered compared to diffuse babble noise. The main reason for this difference is the spectral characteristics of the two different types of noises. On one hand, spatially white no ise is presen t across the spectrum, t herefore the input features at all frequen cy sub-bands are equally affected. On the other hand, babble noise is mostly dominant at low frequencies, therefore since each filter ke rnel in the conv olution layers of the CNN learns from the complete input feature space, the filters are able t o extract the relev ant fea tures for l ocalization from the high SNR regions of the input to compensate for the lack of information in the low SNR regions. Overall, the proposed method pro vides a much better localization accurac y and lower error t han the signal processing based methods, with the difference in performance being especially significant at low input SNRs of diffus e babble noise. 3) Influence of sou r ce-arr ay distance: The CNN used for the earlier ev aluations was trained for each r oom and array position for two specific source-array distances of 1 m and 2 m. T o in v estigate the influence of source-array distance, in this part, the localization performance of the proposed method is ev aluated for varying source- array distances. For this experiment, we simulated a room with dimensions 10 × 11 × 3 m 3 and a re verbe ration time of 0.38 s. The test data was generated for t hree different array positions. For each of these array positions, the sound sources were placed at distances v arying from 0.4 m to 3 m. It should be noted that both the speak ers were placed at the same distance for each setup. A single two speaker mixture 7 0.5 1 1.5 2 2.5 3 1 2 3 4 5 6 7 8 S o u r c e - a r r a y d i s t a n c e ( m ) M A E ( ◦ ) (a) MAE 0.5 1 1.5 2 2.5 3 80 82 84 86 88 90 92 94 96 98 100 S o u r c e - a r r ay d i s t a n c e ( m ) A c c ( % ) (b) Acc. Fig. 5: Results for the exp eriment showing t he performance of t he proposed method for increasing source-array distances presented in Section VI-B3. 1 2 3 4 5 6 7 8 0 5 10 15 20 25 30 N u m b e r o f c o nv o l u t i o n l a y e r s M A E ( ◦ ) 8 mics 6 mics 4 mics (a) MAE 1 2 3 4 5 6 7 8 0 20 40 60 80 100 N u m b e r of c o nv o l u t i o n l a y e r s A c c ( % ) 8 mics 6 mics 4 mics (b) Acc. Fig. 6: Results for the experiment on the influence of con vo lution layers on the proposed method presented in S ection VI-B4. was used and spatially white noise was added resulting in input SNR of 20 dB. The results for this experiment, in terms of both MAE and l ocaliza- tion accuracy , is shown in Fig. 5. Each point in the plot corresponds to a specific source-array distance. For each of these points, the measures were averaged ov er all possible angular combinations for the two speakers at each of the different array positions i n the room. From the result plots, it can be seen that when the sources are very close to the mi crophone array the error in localization is higher , since the CNN was trained considering a far-field scenario, ho we ve r for very small source-array distances, the sources are essentially in the near-field of the array . The minimum error as wel l as maximum accurac y in localization can be observed for the t wo specific distances of 1 m and 2 m, which w ere part of the training setup. Additionally , for distances close to these training distances, the errors are also relativ ely lower . When the sources are between the two t r ai ning distances, the errors are slightly higher , howe v er if we observ e the absolute value of the MAE as well as the accuracy , the deg radation in performance is not significant. Si milarly for distances larger t han 2 m, it can be seen that the localization performance deteriorates slightly . Overall, observing the absolute value of the objectiv e measures, it can be seen that though the network i s trained wit h two specific source-array distances, there is small de terioration in p erformance for other distances, except when the sources are very close to the microphone array . 4) Influence of number of con volution layers: In the pre vious experimen ts, we considered a UL A with M = 4 microphones and the CNN architecture used was the same architecture that was proposed in [18], [19] w hich consisted of three conv olution layers follo wed by two fully connec ted layers. In this section we empirically demonstrate that giv en the choice of small fi lters of size 2 × 1 for all the con volution layers, with the aim to learn the rele v ant features for localization from the phase correlations at neighboring microphones, a CN N architecture wit h three c on volution layers is not always the best performing architecture. Here we sho w that t he number of con v olution layers need to be M − 1 to obtain the best localization performance. For t his e xperiment we con sider a ULA wit h 8 mi crophones with an inter-microphon e distance of 2 cm. From this array , we select two sub-arrays, one with 6 microphones and the other wit h 4 microphones that are formed by selecting the respecti ve number of middle microphones from the main eight element array , as sho wn in Fig. 4, to get a ULA wi th M = 6 and another ULA with M = 4 , respecti vely . All the arrays hav e the same inter-microphone distance and array center . Using the same t raining data configuration from previous experi- 8 T ABLE V: Results wi t h measured R I R s. R T 60 0.160 s 0.360 s 0.610 s Distances 1 m 2 m 1 m 2 m 1 m 2 m Measure MAE Acc. M AE Acc. MA E Acc. MAE Acc. MAE Acc. MAE Acc. SRP-PHA T 12 . 8 75 . 0 15 . 33 64 . 2 15 . 8 61 . 8 19 . 8 49 . 2 15 . 3 57 . 4 21 . 5 42 . 9 MUSIC 4 . 9 87 . 0 9 . 33 78 . 2 10 . 4 72 . 8 15 . 2 54 . 2 11 . 3 70 . 7 18 . 5 47 . 3 Propose d 1 . 9 89 . 7 3 . 4 86 . 1 3 . 27 88 . 2 4 . 35 79 . 9 3 . 14 85 . 5 4 . 43 80 . 2 ments (T able I), multi ple CNNs with number of con v olution layers v arying from 2 to M − 1 are t rained for each of the arrays. The number of con volution layers is restricted to M − 1 since further 2D con volution layers are not possible as the microphone dimension of the phase map input is reduced t o 1 after the M − 1 -th layer . For the eight micro phone array , 6 CNNs are t r ained, whereas for the six microphones and the four microphone array , 4 and 2 C N Ns are tr ained, respecti vely . Al l the networks were trained with the same amount of data. T o analyze the performance of the 12 dif ferent trained networks, test data corresp onding to the Room 1 configuration in T able II is generated for each of the arrays. Spatially white noise is added for an input SNR of 30 dB. The results f or this experiment, in terms of both MAE and localization accurac y , is sho wn in Fig. 6 . In the figures, the center of the circle markers correspon d to the v alue of the objecti v e measure and the area of the markers denote the number of trainable/free parameters for that specific network. The fi r st t rend tha t can be no ticed from the figures is that for each of the arrays, as the number of conv olution layers is decreased from M − 1 the performance of the networks degrad es in terms of both MAE and localization accurac y . This shows that with small filters of size 2 × 1 , to aggregate the phase correlation features from all the micropho ne pairs in an array , M − 1 con volution layers are required. W hen lesser number of con v olution l ayers are used, as the same filt er size is used in each of these layers, phase correlation information from all microphone pairs are not incorporated into the learned features leading to deterioration in performance. It can also be seen from the figures that the best localization performances of the three arrays i s different and it is better f or the array with higher number of micropho nes. This difference in performance comes from the different apertures of t he co nsidered arrays, and similar to signal processing based localization methods, here also we observe better performance for a ULA with a larger aperture. In F ig. 6, we also observe that as the number of con vo lution layers is decreased the number of trainable/free parameters increases, as depicted by the area of the markers for each network . From Fi g. 2 , it can be seen that when M − 1 conv olution layers are used, the si ze of each feature map at the end of the con volution layers is always 1 × K . As t he number of conv olution layers is decreased the size of each feature map at the end of the con v olution layers actually becomes larger leading to a larger num ber of t rainable/free pa rameters for the complete network. This further demonstrates the need of M − 1 con volution layers, as very large number of free parameters can lead to problems of ove r fitting, if the amount of av ailable training data is not sufficient. Since the requirement of M − 1 con volution layers is mainly related to the aggregation of information in the feature space by the slowly gro wing receptiv e fi eld of the small filters used in our framew ork, techniques for a more aggressi ve exp ansion of the recepti v e fi eld of the fi lters can also be emplo yed. This is ho we ver bey ond the scope of this paper and is a topic for future research. C. Experiments with measur ed RIR s For the experiments with measured RIRs, we used the Multichan- nel Impulse Response Database f rom Bar-Ilan University [29]. The database consists of RIR s measured at Bar-Ilan Uni versity’ s acoustics lab, of si ze 6 × 6 × 2 . 4 m 3 , for three dif ferent reve rberation times of R T 60 = 0.160, 0.360, and 0.610 s. The recordings were done for se veral source positions placed on a spatial grid of semi-circular shape cov ering the whole angular range for a linear array , i. e., [0 ◦ , 180 ◦ ] , in st eps of 15 ◦ at distances of 1 m and 2 m from the center of the microphone array . The recordings were done with a linear microphone array with three different microphone spacings. For our experiment, we chose the [8, 8, 8, 8, 8, 8, 8] cm setup [29], which consists of eight microphones where the distance between the microphones is 8 cm. W e selected a sub-array of the four middle microphones out of the total eight microphones used in the original setup, t o ha v e a ULA with M = 4 elements with an inter-microphone distance of 8 cm, which correspond s to the array setup used in experiments with simulated RIRs. Therefore, the CNN trained with simulated data used for the earlier ev aluations in Section VI - B1 and VI-B 2 was also used for these expe riments. W e used the same fiv e mixtures from earlier, wit h the total number of mixtures for ev aluation being C = 76 ∗ 5 = 380 , where 76 is the number of all possible angular combinations wit h discretization of t he complete DOA space of a ULA wi t h 15 ◦ resolution. The results for all t he differen t rev erberation times and source- array distances are sho wn in T able V. For this expe riment, spatially white noise was added to each mixture resulting in an input S N R of 30 dB. Even when trained with simulated data only , the results show that the proposed method is able to provide very good localization performance in real conditions, ev en when the sources are placed far from the array in rev erberant conditions. The performance of all the compared methods is better when the sources are close to the array , ho we ve r the differenc e in performance, for different distances, for t he signal processing based methods is considerable si nce the effect of rev erberation is more significant when the sources are further aw ay from the array . Overall, the proposed method provides significantly better perfor- mance compared to both MUSIC and S RP-PHA T , and the difference is more prominent as the acoustic en vironment becomes more rev er- berant. 1) Dynamic acoustic scenario: In al l the previous experiments, we considered the tw o speaker scenario for the ev aluation o f the performance of the proposed method. In this experiment we show that e ven though the CNN is trained to estimate the fr ame-le vel posterior probabilities of a maximum of two sources, with the proposed method it is possible to estimate the DOA of more than two sources for a short segment. Simultaneously , it is al so shown that since the input 9 S1 S2 S3 S4 (a) Frame le ve l DOA probabilitie s for the proposed m ethod (top) and MUSIC (middle). The ground truth DOAs and source acti viti es for each segment are shown in the bottom figure. S1 S2 S3 S4 (b) Normalized histogram computed from the frame lev el probabilit ies for each s egmen t. Fig. 7: Results for experiment presented in Section VI-C 1 with measured RIR and a four microphone ULA. The rev erberation time of t he room is 0.36 s with the source placed 2 m awa y from the array center . Spatially uncorrelated noise and diffuse babble noise were added to the mixture signal with input S NRs of 40 dB and 5 dB, respecti v ely . to the CNN is t he phase map for a sing le S TFT time frame, the proposed method is also able to handle dynamic acoustic scenarios where the number of speakers changes ov er time. For this experiment, we consider the reverb eration time of 0.36 s and source-array distance of 2 m from the measured RIR database used in the previous experiment. A 6 s speech mixture segment is created where for the fi r st 1 s only one source f rom 60 ◦ is activ e. For the next 2 s, an additional source is activ e from 105 ◦ . A third source from 135 ◦ is activ e for the next 2 s along with the first two sources. For t he final 1 s duration, only the third source is active. The source activ ities for each segment and t he corresponding ground t r uth DOAs of the sources are shown in the bottom figure of Fi g. 7(a). Spatially white noise and diffuse babble noise are added to the speech mixture resulting in input SNRs of 40 dB and 5 dB, respective ly . The estimated frame-lev el probabilities for the proposed method and broadband MUSIC are depicted in the top and middle figures of Fig. 7(a), respectiv ely . Since from the pre vious experiments, it was found that MUSIC is the better performing method out of the two considered signal processing based techniques , the results for SRP - PHA T are not presented. It can be seen that the estimated frame-lev el probabilities for the prop osed metho d is much more concentrated to wards t he actual source DOAs compared t o MUSIC. In Fig. 7(b), the frame lev el probabilities are averag ed ov er the time frames in each segment and then normalized to a maximum va lue of 1. This specific normalization is done for the purpose of visualization only . Fr om these fi gures, it can be seen that t he proposed method exhibits much clearer peaks at the true source DO As compared to MUSIC which lead t o the superior performance of the proposed 10 method in prev iously presented ev aluations even with the simple post- processing method considered in t his work for obtaining the fi nal DO A estimates. It can also be seen that in the segment S 3, where three sources are simultaneously active, though the network is trained to estimate frame lev el probabilities of two speakers, clear peaks are visible at all the three true source DO As. Also, when only one source is active (S1 and S4), the highest peaks correspond t o the true DO A. V I I . C O N C L U S I O N A con v olutional neural network based supervised learning method for DOA estimation of multiple speakers was presented that is t rained using synthesized noise signals. Through experimental ev al uation, it was sho wn that the proposed method provides excellent localization performance in unseen acoustic en viron ments as well as in the pres- ence of unseen noise types. It was also sho wn to exhibit a far superior performance co mpared to the signal processing based localization methods, SRP- PHA T and MUSIC, for the tested conditions. The ability of the proposed method to deal with acoustic scenarios with v arying number of sources was also shown. For the design choice of the number of con volution layers in the proposed architecture, it was empirically sho wn that f or a microphone array with M microph ones, M − 1 con vo lution layers are required for the best localization performan ce. It was also sho wn that such a choice leads to lesser number of tr ainable parameters. The choice of M − 1 con vo lution layers is required for the aggregation of the phase correlation information from all microphone pairs in t he extracted features, when using contiguou s conv olution operations, as done in this work. R E F E R E N C E S [1] R. O. Schmidt, “Multiple emitter locati on and signal parameter estima- tion, ” IEEE T rans. Antennas Pr opa g. , vol. 34, no. 3, pp. 276–280, 1986. [2] J. P . Dmochowski , J. Benesty , an d S. Affes, “Broadband MUSIC: Opportunit ies and challen ges for m ultipl e source localiz ation, ” in Proc . IEEE W orkshop on A pplicat ions of Sign al Proce ssing to Audio and Acoustics , Oct 2007, pp. 18–21. [3] C. Knapp and G. Ca rter , “The generalize d correl ation m ethod for estimati on of time delay , ” IE EE T rans. Acoust., Speech , Signal Proce ss. , vol. 24, no. 4, pp. 320–327, Aug. 1976. [4] Y . A. Huang, J. Benesty , G. W . Elko, and R. M. Merserea ti, “Real-time passi ve s ource locali zatio n: a practical linear-c orrecti on least-squares approac h, ” IEE E T rans. Speech Audio Pr ocess. , vol. 9, no. 8, pp. 943– 956, Nov . 2001. [5] M. S. Brandstein and H. F . Silverman, “A robust method for speech signal time-dela y estimation in re ve rberant rooms, ” in Pro c. IEEE Intl. Conf . on Acoustics, Speech and Signal Pr ocessing (ICASSP) , vol. 1, Apr . 1997, pp. 375–378. [6] J. Benesty , J. Chen, and Y . Huang, Micr ophone Array Signal Pro cessing . Berlin, German y: Springer -V erl ag, 2008. [7] J. Benesty and Y . Huang, Eds. , Adaptiv e Signal Proce ssing: Application to real-wo rld pr oblems , ser . Signals and Communicat ion T ec hnology . Berlin, German y: Springer , 2003. [8] P . Stoica and K. C. Sharman , “Maxi mum lik eli hood methods for direct ion-of-ar ri v al est imation , ” IEEE T rans. Acoust., Sp eec h, Signal Pr ocess. , vol. 38, no. 7, pp. 1132–1143, Jul 1990. [9] S. Delikaris-Mania s, D. Pa vlidi, A. Mouchtaris, and V . Pulkki, “Doa estimati on with histogram analysis of spatially constrained acti ve inten- sity vectors, ” in P roc. IEEE Intl. Conf. on Acoustics, Speec h and Signal Pr ocessing (ICASSP) , March 2017, pp. 526–530. [10] A. Moore, C. Evers, and P . Naylor , “2D direction of arriv al estimation of multiple moving sources using a spherical microphone array , ” in Pro c. Eur opean Signal Proc essing Conf. (EUSIPCO) , 2016, pp. 1217–1221. [11] A. Krizhe vsky , I. Sutske ve r , and G. E. Hinton, “Imagenet classifica tion with deep con volu tional neural netw orks, ” in Advances in Neural In- formation Pr oce ssing Systems 25: 26th A nnual Confer ence on Neur al Informatio n Proce ssing Systems , 2012, pp. 1106–1114. [12] G. Hinton, L. Deng, D. Y u, G. E. Dahl, A. r . Mohamed, N. Jaitly , A. Senior , V . V anh ouck e, P . Nguyen, T . N. Sainath, and B. Kingsbury , “Deep neural networks for acoustic modeling in speech recognit ion: The shared vie ws of four research groups, ” IEEE Signal Proce ssing Magazi ne , vol. 29, no. 6, pp. 82–97, Nov 2012. [13] N. Ma, T . May , and G. J. Bro wn, “Exploiting deep neural networks and head mov ements for robust binaural localiza tion of multiple sources in re ve rberant en vironment s, ” IEEE T rans. Audio, Speech , Lang. Pr ocess. , vol. 25, no. 12, pp. 2444–2453, Dec 2017. [14] F . V esperi ni, P . V ec chiott i, E. Principi, S. Squarti ni, and F . Piazza, “ A neural network ba sed algorithm for speak er l ocali zati on in a multi - room en vironment, ” in IEEE 26th International W orkshop on Machi ne Learning for Signal Proc essing (MLSP) , 2016, pp. 1–6. [15] R. T akeda and K. Komat ani, “Sound source localiz ation base d on deep neural network s with directi onal acti v ate function exploit ing phase informati on, ” in Proc . IEE E Intl. Conf. on Acoustics, Speec h and Signal Pr ocessing (ICASSP) , March 2016, pp. 405–409. [16] X. Xiao, S. Zhao, X. Zhong, D. L. Jones, E. S. Chng, and H. Li, “ A lea rning-base d approac h to directi on of arriv al estimati on in noisy and re verbe rant en viro nments, ” in Pro c. IEEE Intl. Conf. on A coustic s, Speec h and Signal Pr ocessing (ICASSP) , April 2015, pp. 2814–2818. [17] R. T akeda and K. K omatani , “ Discrimina ti v e multiple sound source local izati on based on deep neural networks using independe nt loca tion model, ” in IEEE Spoken Langua ge T echn ology W orkshop (SLT) , Dec 2016, pp. 603–609. [18] S. Chakrabarty and E . A. P . Habets, “Broadban d DOA estimation using con volutiona l neural networ ks trained with noise signals, ” in Pro c. IEE E W orkshop on Application s of Signal Proc essing to Audio and Acoustics , Oct. 2017. [19] ——, “Multi-spe ak er l ocali zatio n usin g con volutiona l neural netw ork traine d with noise, ” in ML4Audio W orskh op at Pr oc. Neural Information Pr ocessing Conf , 2017. [20] S. Rickard and O. Y ilmaz, “On the approxi mate W-disjoint orthogonali ty of s peech, ” in Proc. IEEE Intl. Conf . on Acoustics, Speec h and Signal Pr ocessing (ICASSP) , May 2002, pp. 529–532. [21] J. Read, B. Pfahrin ger , G. Holmes, and E. Frank, “Classifier chains for multi-la bel classificat ion, ” Mac hine Learning , vol. 85, no. 3, p. 333, Jun 2011. [Online]. A vaila ble: https:// doi.org/ 10.1007/s109 94- 011- 5256- 5 [22] F . Stoeter , S. Chakraba rty , B. Edler , and E . A. P . Habets, “Classificatio n vs. regression in s upervised learning for singl e channel speak er count estimati on, ” in P r oc. IEEE Intl. Conf. on Acoustics, Speech and Signal Pr ocessing (ICASSP) , 2018. [23] Y . LeCun and Y . Bengio, “The handbook of brain theory and neura l networks, ” M. A. Arbib, Ed. Cambridge , MA, USA: MIT Press, 1998, ch. Con v oluti onal Networks for Images, Speech, and Ti me Series, pp. 255–258. [Online ]. A v ai lable : http:/ /dl.acm.or g/cit ation.cfm?id=303568.303704 [24] T . H. Cormen, C. E. Leiserson, R. L . Riv est, and C. Stein, Intr oduct ion to Algorithms, Third Edition , 3rd ed. The MIT Press, 2009. [25] D. P . Kingma and J. Ba, “ Adam: A method for stochastic optimization, ” CoRR , 2014. [26] N. Sriv astav a, G. Hinton, A. Krizhe vsky , I. Sutske ver , and R. Salakhut - dino v , “Dropout: A simple way to prev ent neural network s from ove rfit- ting, ” Journa l of Mach ine Learning R esear c h , vol. 15, no. 1, Jan. 2014. [27] F . Chollet et al. , “K eras, ” https://gith ub .com/fc hollet/keras , 2015. [28] E. A. P . Habets and S. Gannot, “Generating Sensor Signals in Isotropic Noise Fields, ” J ournal Acoust. Soc. of America , vol . 122, no. 6, pp. 3464–3470, Dec. 2007. [29] E. Hadad, F . Heese, P . V ary , and S. Gannot, “Multic hannel audio databa se in va rious aco ustic e n viro nments, ” in Pr oc . Intl. W orksho p Acoust. Echo Noise Contr ol (IW AENC) , Sept 2014, pp. 313–317.
Original Paper
Loading high-quality paper...
Comments & Academic Discussion
Loading comments...
Leave a Comment