Deep Asymmetric Networks with a Set of Node-wise Variant Activation Functions
This work presents deep asymmetric networks with a set of node-wise variant activation functions. The nodes' sensitivities are affected by activation function selections such that the nodes with smaller indices become increasingly more sensitive. As …
Authors: Jinhyeok Jang, Hyunjoong Cho, Jaehong Kim
1 Deep Asymmetric Networks with a Set of Node-wise V ariant Acti v ation Functions Jinhyeok Jang, Hyunjoong Cho, Jaehong Kim, Jaeyeon Lee, and Seungjoon Y ang, Member , IEEE Abstract —This work pr esents deep asymmetric networks with a set of node-wise variant activ ation functions. The nodes’ sensitivities are affected by activation function selections such that the nodes with smaller indices become increasingly more sensitive. As a result, features learned by the nodes are sorted by the node indices in the order of their importance. Asymmetric networks not only learn input features but also the importance of those features. Nodes of lesser importance in asymmetric networks can be pruned to r educe the complexity of the networks, and the pruned networks can be r etrained without incurring performance losses. W e validate the feature-sorting property using both shallow and deep asymmetric networks as well as deep asymmetric networks transferred from famous networks. Index T erms —Asymmetric networks, activation functions, principal component analysis, pruning. I . I N T R O D U C T I O N N EURAL networks usually consist of neurons that hav e equal learning capabilities because the mathematical models of neurons are identical for all the neurons in a network. Neurons are trained by capturing the relation between their inputs and outputs. Thus, all the neurons in a network hav e an equal chance of learning input features. Consequently , without further inspections, one cannot tell whether a feature learned by one neuron is more or less important than features learned by other neurons. In this work, we provide network neurons with unequal feature-learning abilities; thus, some neurons learn more important features than others. Neural networks are often trained using backpropagation [1], [2]. Errors between network outputs and tar get outputs are propagated backward to update the weights of nodes in previous layers of the network. The updates are proportional to both the inputs and the so-called sensitivities of the nodes. By assigning different activ ation functions to nodes in a layer , we allow the nodes to hav e different sensitivities to the same inputs. W e use a set of functions parameterized by a single parameter as activ ation functions to assign node-wise variant sensitivities. Specifically , the slopes of the activ ation functions are controllable via this parameter . Thus, nodes J. Jang, J. Kim, and J. Lee are with Electronics and T elecommunications Research Institute (ETRI), Daejeon, Korea (e-mail:jangjh6297@gmail.com, jhkim504@etri.re.kr , leejy@etri.re.kr). H. Cho and S. Y ang are with School of Electrical and Computer Engi- neering, Ulsan National Institute of Science and T echnology (UNIST), Ulsan, K orea (e-mail: hyeunjoong@unist.ac.kr , syang@unist.ac.kr). This work was supported by the ICT R&D program of Ministry of Science and ICT / Institute for Information & Communications T echnology Promotion under Grant (2017-0-00162, Development of Human-care Robot T echnology for Aging Society) This work was supported by the Ulsan National Institute of Science and T echnology Free Innovation Research Fund under Grant 1.170067.01 with smaller node indices are assigned higher sensitivities. Features learned by a network with a set of node-wise variant activ ation functions are sorted by importance. When nodes in a trained network are removed individually , from last to first, the network accuracy gradually deteriorates at increasingly larger increments. A network with a set of node-wise variant activ ation function has the ability to learn not only the features that represent the inputs but also the importance of the learned features. W e call deep networks containing nodes with unequal and asymmetric learning abilities “deep asymmetric networks. ” Deep networks have achie ved great successes across a wide range of fields; ho we ver , they are usually computationally expensi ve and memory intensive. By designing an ef ficient network that requires less computation but provides the same performance, one can deploy the network on a system with small computational power or perform more tasks on a system with high computational po wer . Man y studies have inv esti- gated designing more efficient deep networks [3], [4]. In man y approaches, the importance of nodes in a trained network are e valuated with a certain measure such as l 2 , l 1 norms, and correlation [5], [6], [7]. Then the nodes showing smaller measures are pruned from the network. The performance of pruned networks depends on how effecti vely nonessential nodes are identified by the measure. W e use the ability of asymmetric networks to learn the importance of features to design more efficient deep networks. Because the nodes in a deep asymmetric networks sort features by importance, the nodes can be pruned from least to most important to meet network computational comple xity and memory requirements. The ability to learn the importance of features is validated with both a simple network in an auto-associativ e setting using Gaussian data and the MNIST dataset [8] and deep con volutional neural networks (CNN) for object recognition using the CIF AR-10 dataset [9] and for action recognition using NTU RGB+D action recognition dataset [10]. After the asymmetric networks are trained, we can analyze the individual contribution of each node to the reconstruction error and recognition accuracy . The experimental results sho w that the reconstruction error and the accuracy are increasingly influenced by the nodes with smaller indices than by those with larger indices, which indicates that the features learned by the asymmetric networks are sorted in the order of their importance. W e applied the feature-sorting property to prune the deep asymmetric CNN without a loss of recognition accuracy . Using the asymmetric technique, we were also able to prune deep networks transferred from famous complex networks. T o do this, we prepared VGG [11] and ResNet [12] 2 for a facial expression recognition task. Then, we transferred the weights from the famous networks to the asymmetric networks and trained them on the CK+ dataset [13]. The asymmetric networks pruned by the proposed procedure result in smaller (and thus more ef ficient) networks but exhibit no loss of accurac y . W e also compared our pruning to results reported in studies using the MNIST using CIF AR-10 dataset and ResNet using ImageNet dataset. The rest of this paper is or ganized as follows. Section II proposes the use of node-wise variant activ ation functions in asymmetric deep networks. The network architecture and training are introduced in Section II-A. In section II-B, the feature-sorting property of asymmetric networks is analyzed using a simple shallow network. Section III presents the pruning procedure used to design more efficient deep asym- metric networks. A pruning algorithm is given in Section III-A, and a revie w of pruning methods is giv en in Section III-B. Experimental validations are presented in Section IV for shallow , deep, and transferred deep asymmetric networks in Sections IV. Finally , conclusions are giv en in Section V. I I . D E E P A S Y M M E T R I C N E T W O R K S W I T H A S E T O F N O D E - W I S E V A R I A N T A C T I V A T I O N F U N C T I O N S A. Network Ar chitectur e W e consider a network with L layers trained with a training set of input and output pairs ( x , y ) . The number of nodes in the l th layer is n l . The relationship between the output x l i and the input x l − 1 j of the l th layer are giv en as follows. The intermediate value u l i is computed by u l i = n l − 1 X j =1 W l ij x l − 1 j (1) for a fully connected layer, or u l i = con v ( W l i , x l − 1 ) (2) for a conv olutional layer . The output is activ ated by x l i = f l ( u l i ; s l i ) (3) for i = 1 , 2 , · · · , n l , where W l ij or W l i are the weights. Instead of using a single acti vation function, we use a set of activ ation functions in each layer . The activ ation function of the l th layer f l ( · ; s l i ) takes the parameter s l i , which assigns a different activ ation function for each node. The selected activ ation functions are f l i ( u ; s l i ) = s l i f 0 ( u ) , (4) which use the parameter set 1 ≥ s 1 ≥ s 2 ≥ · · · , ≥ s n l > 0 , (5) where f 0 ( · ) is an activ ation function such as a rectified linear unit (ReLU), h ypertangent, or sigmoid function. The set of activ ation functions in each layer satisfy ∂ f l ( u ; s l i ) ∂ u ≥ 0 (6) for all i and ∂ f l ( u ; s l i ) ∂ u ≥ ∂ f l ( u ; s l i +1 ) ∂ u (7) Lay er I npu t Ful ly - Conn ect ed A ct iv at io n Lay er Output (a) Lay er I npu t Conv olu tio n Filte r Act iv atio n Lay er Out put (b) Fig. 1. A schematic of a layer in the proposed asymmetric network with a set of node-wise variant activation functions, (a) fully connected layer , and (b) con volutional layer. for i = 1 , 2 , · · · , n l − 1 for all u . As a result, the nodes with smaller indices are assigned activ ation functions that have increasingly steep slopes. Fig. 1 sho ws a schematic of the proposed network with a set of node-wise v ariant acti v ation functions (ReLU activ ation functions in this case). A network can be trained to minimize a cost function E that penalizes the difference between the network outputs and the desired outputs. When the network is trained using back- propagation [1], [2], the weight matrix W l , whose element is the weight W l ij of the l th layer , is updated by W l ← W l − η δ l x T l − 1 , (8) where η is the step size and x l − 1 is a vector whose element is x l − 1 i . With the activ ation function given in (4), the element of the sensitivity vector δ l is δ L i = s L i ∂ E ∂ x L i ∂ f L 0 ( u L i ; s l i ) ∂ u L i (9) for the last layer and δ l i = s l i ( n l +1 X k =1 δ l +1 k W l +1 kj ) f l 0 ( u l i ; s l i ) ∂ u l i (10) for the other layers. Because we adopt a set of activ ation functions whose first deri vati ves v ary with the node indices. As a result, some nodes in a layer respond more sensiti vely than others when the weights are updated. In particular , the nodes with smaller node indices become increasingly more sensitiv e 3 based on our choice of activ ation functions. W e call such networks consisting of nodes with unequal and asymmetric sensitivities “asymmetric networks. ” W e call the parameter s l i , which affects the sensitivity of a node, the “sensitivity variable. ” For activ ation functions gi ven in the form of (4), the weight matrix update in (8) can be rewritten as follows: W l ← W l − η ( s l ◦ δ 0 l ) x T l − 1 , (11) where s l is a vector whose element is the parameter s l i , δ 0 l is the sensitivity vector when a fixed activ ation function f 0 is used for all the nodes, and ◦ is the Hadamard product. The updated (11) in vector notation is v ec( W l ) ← vec( W l ) − η S l v ec( δ 0 l x T l − 1 ) , (12) where S l is a diagonal matrix whose diagonal elements are repetitions of the vector s l . Note that (12) is the update for the diagonally scaled steepest descent algorithm resulting from the variable transforms v ec( W l ) ← S 1 2 l v ec( W l ) (13) for a quadratic penalty function [14]. The diagonal scaling is originally used to transform the variables to have equal dy- namic ranges for faster con ver gence. W e assume that the inputs of the network are already properly scaled, using normalization operation for example. By using the set of parameterized activ ation functions, we intentionally make the cost function steeper in some directions than others. The con vergence in the steeper directions become much faster compared to that in the other , less steep directions. In particular , we make the cost function steeper in directions associated with the weights of sensitive nodes than in directions associated with weights of insensitive nodes. As a result, asymmetric networks learn weight of sensitive nodes much faster than that those of insensitiv e nodes. B. Analysis of Asymmetric Networks For analysis, consider an asymmetric network with one hidden layer given by ˆ y = W 2 D f 0 ( W 1 x ) , (14) where x ∈ R n and ˆ y ∈ R m are the input and output of the network, respectiv ely . The matrices W 1 ∈ R p × n and W 2 ∈ R m × p represent the operations of the first and second layers, respecti vely . The rows of W 2 and W 1 contain the weights for the output nodes of the layers. The function f 0 and the diagonal matrix D ∈ R p × p represent the operation of the acti v ation function in (4). The diagonal elements of the matrix D are the sensitivity parameters, s i ’ s. Let X and Y be matrices whose columns are input and output vectors in a training set, respectiv ely . The covariance matrices of input and output are Σ xx and Σ yy , respectively , and the cross-covariance matrix is Σ yx . The network is trained with the cost function E = k Y − W 2 D f 0 ( W 1 X ) k 2 . (15) The cost function is minimized when the operation of the network is equiv alent to the slope matrix of the least square re- gression of Y on X [15]. Let u 1 , u 2 , · · · , u r be the eigen vec- tors of Σ with corresponding eigen values λ 1 ≥ λ 2 ≥ · · · ≥ λ r . W e consider a case p > r , where the number of hidden nodes is larger than the rank of Σ . Let U = [ u 1 , u 2 , · · · , u r , 0 , · · · , 0 ] . (16) When the minimum of the cost function is achiev ed, the operation of the network is equiv alent to W 2 D f 0 ( W 1 x ) ≈ UU T (17) The sensitivity parameter s i is close to one for sensitiv e nodes, and close to zero for insensitiv e nodes. X i ∈S s i w 2 i f 0 (( w 1 i ) T x ) ≈ r X i =1 u i u T i (18) X i ∈I s i w 2 i f 0 (( w 1 i ) T x ) ≈ 0 (19) where w 2 i and w 1 i are the i th columns of W 2 and W 1 , respectiv ely , and S and I are the index sets of sensitiv e nodes and insensitiv e nodes. The sensitive nodes are mostly responsible for the operation of the network in approximating the projection onto the eigenv ectors u i ’ s, and the insensitiv e nodes does not contribute much to the approximation. The asymmetric network leans the weight of sensitive nodes faster than insensitiv e nodes. Consider the following extreme case. The sensitivity variables are chosen to be s T 1 = [1 , , · · · , ] T , (20) where is close to 0. Then the operation of the network approximates s 1 w 2 1 f 0 (( w 1 1 ) T x ) ≈ r X i =1 u i u T i , (21) and the weight of the first node approximates the eigenv ector u 1 corresponding to the largest eigen value. After the con ver- gence, the sensitivity variables are changed to s T 1 = [1 , 1 , , · · · , ] T . (22) The operation of the network approximates s 2 w 2 2 f 0 (( w 1 2 ) T x ) ≈ r X i =2 u i u T i , (23) and the weight of the second node approximates the eigen vec- tor u 2 corresponding to the second lar gest eigen value. This process can continue to find the weights of the r nodes. When the sensitivity variables are chosen as (5). The cost function is steeper in directions of weights of nodes with smaller indices. The weights of the nodes with smaller indices can be expected to con verge faster than those with larger indices. Based on the above observation in the extreme case— where the node weights are conv erged indi vidually—we can assume that the features learned by the network are sorted in order of their importance: from the first hidden node to the last hidden node. 4 Deep networks with nonlinear activ ation functions trained by the backpropagation are not quite as straightforward to analyze as is the shallo w network analyzed in this section. There will be some dif ficulties associated with the nonlinearity of the activ ation functions, random initialization, and the herd effect of the backpropagation. Ne vertheless, the cost functions are minimized when the weight matrices are related to the least squares regression. For asymmetric deep networks, the cost functions are minimized when eigen vectors that correspond to larger eigen values are assigned as weight vectors of nodes with larger sensitivity parameters. I I I . P R U N I N G D E E P A S Y M M E T R I C N E T W O R K S F O R E FFI C I E N T D E S I G N A. Pruning Deep Asymmetric Networks Deep networks are typically computationally expensi ve and hav e high memory requirements. In many cases, the compli- cated models of deep networks must be compressed to be deployed on de vices with restricted computational capabili- ties. Previous studies show designing compact and efficient networks is possible by pruning unimportant nodes. Howe ver , determining which node is important from a trained network is not obvious, because the nodes in a network have a tendency to share workloads among themselves [15]. In the proposed asymmetric networks, nodes in a layer are sorted in order of their importance. Thus, given an asymmetric network with p hidden nodes, when asked to remove one hid- den node, we can kno w exactly which node to discard. The last hidden node, which corresponds to the least important feature, can be removed from the network with the least accuracy loss. Hence, a simple and effecti ve pruning strategy for designing efficient deep asymmetric network can be deriv ed. First, the accuracy of a trained asymmetric network is measured using a validation set. Then, the network is pruned by removing the nodes individually to ensure that the network accuracy does not fall belo w a certain lev el. The pruning process can starts from the last hidden layer and continues up to the first layer . The nodes in each layer are discarded one-by- one from last to first. The accuracy of the netw ork is measured after removing each node using the validating set. The pruning of a current layer stops just before the accuracy drops below a predefined threshold; then, the pruning continues with the previous layer , again discarding nodes from last to first. Our empirical data indicates that pruning works better when it begins with a layer that has the largest number of nodes and continues with layers with smaller and smaller number of nodes. Thus, we prepare a set of layer indices L sorted by the number of nodes, and prune a network follo wing the layer index in the set. The pseudocode of this pruning strategy is listed in Algorithm 1. Note that the algorithm does not require any measure, such as l 2 or l 1 , to ev aluate the importance of a node. The importance of nodes is already given by the node indices. The algorithm simply prune the node sequentially while the target accuracy is met. Once nonessential nodes are pruned by the Algorithm 1, the netw ork is retrained using the training set. Because all the important features are retained by the pruned network, the Algorithm 1 Pruning 1: Measure accuracy and set target . 2: for ζ = 1 to L − 1 do 3: l = L ( ζ ) 4: for i = n l to 1 do 5: Measure accuracy 6: if accuracy ≤ target then 7: break 8: else 9: Remov e node x l i from network. 10: end if 11: end for 12: end for retraining can compensate performance loss due to the pruned nodes. As a result, a network with the same performance but with far less nodes can be designed by the pruning and retraining procedure. B. Revie w of Pruning Methods A survey of efficient deep network design methods can be found in [3], [4]. In many pruning approaches, the importance of nodes in a trained netw ork are ev aluated with a certain measure, and the nodes sho wing smaller measures are remo ved from the network. In [16], [17], the sensitivity of a cost function to small changes in weights of a network is measured based on the Hessian of the cost function. The weights are sorted by sensiti vity; then, the nonessential small-sensiti vity weights are pruned from the network. The sensitivity to small changes in node outputs [18] and the sensitivity to the remo val of weights [19] have also been considered for pruning. A re gularization term that penalizes large weights can be added to a cost function during network training to fa vor sparse weights. After training, the weights are sorted by some measure, and small weights are remo ved from the trained network. The l 2 , l 1 , and l 0 norms, among other , ha ve been used as re gularization terms to cause weights to be sparse to enable the pruning of small weights from networks [5], [6], [20], [21], [22]. The weight decay term was used as a regularization factor to fa v or small weights in [23]. The energy term was used as a regularization term to penalize nodes with small outputs in [24]. After the nonessential nodes with small sensiti vity or small weights hav e been pruned, the networks are usually retrained to regain their performance. The pruning and retrain- ing procedures can be applied iterativ ely . The performance of pruned networks depends on how ef fecti vely the sensiti vity or the regularization identify the nonessential weights or nodes. Howe ver , because the nodes in deep asymmetric networks are already sorted in order of their importance, the nonessential nodes can be remo ved from the netw ork without requiring further inspection of their importance. In [25], sparsity patterns were introduced that reduced the computations of con volu- tional networks by zeroing out filter coefficients. In [26], the filter coefficients were quantized and compressed to reduce the memory requirements. 5 I V . E X P E R I M E N T S The proposed asymmetric network is analysed with an autoencoder using Gaussian, the MNIST dataset [8], and with a deep CNN using the CIF AR-10 dataset [9] in Section IV -A, IV -B and IV -C, respectiv ely . The performance of a pruned asymmetric network is compared to other pruning approaches with LeNet [27] using the MNIST dataset in Section IV -D. Asymmetric networks with weights transferred from trained networks are analyized with V GG [11] and ResNet [12] using the CK+ facial expression recognition dataset [13] in Section IV -E, and with a deep CNN using the NTU RGB+D action recognition dataset in Section IV -F [10]. The performance of pruned asymmetric networks, with the weight transfer , is compared to other pruning approaches with VGG and ResNet using the CIF AR-10 dataset in Section IV -G, and with ResNet using the ImageNet dataset [28] in Section IV -H. A. Simple Asymmetric Network with Gaussian Data In this section, a simple autoregression e xperiment is set up with a three dimensional data follo wing the Gaussian distribution. The input x = [ x 1 , x 2 , x 3 ] T follows the zero mean Gaussian distribution. The elements x 1 and x 2 are correlated with 0.9 correlation coef ficient. The element x 3 is independent. Standard deviations of the three elements are set to 1.0, 1.0, and 0.01. An asymmetric network with one hidden layer with four hidden nodes is prepared. The weights of the first and second layers are tied together . The activ ation function f 0 is set to a linear function. A symmetric network with the same architecture is also prepared. The networks are trained with 2048 data by solving (15) for autoregression. The Matlab optimization toolbox is used to find the solutions. The optimization function is initialized randomly . Fig. 2 shows the normalized weight vectors of the networks. For comparison, the eigen vectors of the cov ariance matrix Σ xx are also shown. Fig. 2(a) shows the case where the sensitivity variables are chosen to be highly heterogeneous with s T 1 = [1 , (1 / 2) 8 , (1 / 4) 8 , (1 / 8) 8 ] T . F or the asymmetric network, the weight vectors of the first and second nodes coincide with the eigen vectors corresponding to the largest and second largest eigen values. The weight vectors of the third and fourth nodes span the space orthogonal to the column space of the first two eigen vectors. The asymmetric network learns to represent the data using the two sensitiv e nodes. Among the two sensitive nodes, the first node is related to the more principal component. In comparison, the weight vectors of the symmetric network are not aligned to the eigen vectors. Fig. 2(b) sho ws the case where the sensiti vity variables are chosen to be moderately heterogeneous with s T 1 = [1 , (1 / 2) 6 , (1 / 4) 6 , (1 / 8) 6 ] T . In this case, the weight vectors of the first three nodes span the columns space of the first two eigen vectors. Nev ertheless, the weight vectors of the first and second nodes coincide with the eigen vectors corresponding to the largest and second largest eigen v alues. Because of the random initialization, the weight vectors vary ev ery time the solution is found. Ho wev er, the trend is consis- tent for the highly heterogeneous case, and mostly consistent for the moderately heterogeneous case. W e will discuss the (a) (b) Fig. 2. W eight vectors of hidden nodes for Gaussian dataset: (a) for highly heterogeneous sensitivity variables; (b) for moderately heterogeneous sensitivity v ariables. Left: eigenv ectors; center: weight vectors of symmetric network; and right weight vectors of asymmetric network. The 1st, 2nd, 3rd, and 4th nodes are labeled with red, green, blue, and magenta, respectively . Node Number S (a) Node Number S (b) Node Number S (c) Fig. 3. The sensiti vity parameter s i used for a set of node-wise v ariant ReLU activ ation functions. consistency in terms of repeatability and reproducability using a deep network with a real dataset in Section IV -B. B. Asymmetric Networks with MNIST Dataset The use of a set of node-wise variant activ ation functions in an asymmetric network is v alidated with a simple fully connected network with one hidden layer using the MNIST dataset [8]. A network with n hidden nodes is prepared in an auto-associativ e setting to reconstruct the input. The number of hidden node n is set to 256. A set of activ ation functions with the ReLU function as f 0 is used. The sensitivity parameters s i are set as sho wn in Fig. 3(b) (this parameter choice is discussed in Section IV -C). The network is implemented using the Keras Python deep learning library . A baseline symmetric network, with the same number of hidden nodes and the ReLU function as activ ation functions for all the hidden nodes, is prepared for comparison. Fig. 4 shows the features learned by the baseline and asymmetric networks. The two networks are initialized to the same weights and trained using the same training set. For the baseline symmetric network, features of all the nodes that appeared in the early iterations of the training becomes more clear as training progresses. In contrast, for the asymmetric network, features of the nodes with high indices that appeared at the early iterations looses their structures and becomes more high frequency noise-like. Features with clearer structures are concentrated to the nodes with lower indices. The weights of the networks are related to the eigenv ectors of the cov ariance matrix Σ xx of the training data. W e represent images in the training set as linear combinations of the 6 (a) (b) Fig. 4. Features learned by the networks with MNIST dataset, (a) baseline symmetric netw ork, and (b) asymmetric network. 0 50 100 150 200 250 Nodes 0 0.05 0.1 0.15 0.2 0.25 0.3 0.35 Weighting Factors (a) 0 50 100 150 200 250 Nodes 0 0.05 0.1 0.15 0.2 0.25 0.3 0.35 Weighting Factors (b) Fig. 5. Approximation of data using the features learned by the networks. The av erage weighting factors to represent data as linear combinations of features are sho wn. (a) baseline symmetric network, and (b) asymmetric network. weights. The weights of the second layer , w 2 i , are normalized to ˜ w 2 i such that k ˜ w 2 i k 2 = 1 . The weighting factors for the linear combination, z = [ z 1 , z 2 , · · · , z n ] T , to represent an image y is found by minimize z k y − ˜ w 2 1 , ˜ w 2 2 , · · · , ˜ w 2 n z k 2 + µ k z k 1 (24) The ` 1 norm on z is used as a re gularizer with a small value for the regularization parameter µ , so that the image is represented as a sparse linear combination of non-orthogonal weights ˜ w 2 i . Fig. 5 sho ws the weighting factor z for the symmetric and asymmetric networks. The av erage weighting factors to represents 30 images in the training set are shown. For the baseline network, images are represented using all the weights. The weighting factor z ha ve significant values for all the weights. The features the baseline network learned are all of the same importance. In contrast, for the asymmetric network, images are represented using only the weights with the small indices. The weighting factor z have significant values for the weights with small indices and ne gligible values for the weight with high indices. Some of the features learned by the asymmetric network are more important than the others in representing the images. The correlation between the av erage weight factor z and the node index is 0.8420 for the asymmetric network, which indicates the features are sorted in the order of decreasing importance. In contrast, the correlation for the baseline network is 0.2833. Fig. 6 shows the result of principal component analysis (PCA) on the images in the MNIST dataset, where the av erage mean square error (MSE) values between the inputs and 0 50 100 150 200 250 Nodes 0 0.01 0.02 0.03 0.04 0.05 0.06 0.07 MSE (a) 0 50 100 150 200 250 Nodes 0 0.01 0.02 0.03 0.04 0.05 0.06 0.07 MSE (b) Fig. 6. MSE of images reconstructed with the first p nodes with MNIST dataset, (a) baseline network, and (b) asymmetric network. Blue: with the first p nodes according to the node indices; Red: with p randomly selected nodes. T ABLE I R E PE AT A B I LI T Y A ND R E PR O DU C I B IL I T Y O F F EAT UR E S OR TI N G BY A S YM M E T RI C N ET W O RK . A V E RA G E P AI RW I S E M S E OF W E I GH T S . Repeatability Reproducibility layer Symmetric Asymmetric Symmetric Asymmetric 1 dense 0.0017 0.0001 1.698 0.0102 2 dense 0.0191 0.0040 0.115 0.0094 their reconstructions using the first p node are shown. F or the asymmetric netw ork, the a verage MSE drops by larger amounts when nodes with smaller indices are remo ved and does not impro ve much when adding nodes with larger indices. The average MSE of the images reconstructed by the first p nodes shows that the features of the asymmetric network are sorted in order of importance. In contrast, the features of the baseline networks are of equal importance. The removal of any node results in about the same drop in the av erage MSE. The feature sorting exhibited by asymmetric networks may be af fected by random initialization of weights during the training. T o check whether the feature-sorting is repeatable, we trained the asymmetric network five times using the same training set. T o check whether it is reproducible, we also trained the asymmetric network five times, but used a different training set each time. The average pairwise mean square error (MSE) of the weights in each layer was measured and the results are sho wn in T able I. The weights learned by the asymmetric network using the same or different training sets are close together, indicating that the feature-sorting property of asymmetric networks is both repeatable and reproducible. The av erage pairwise MSE values of the weights of the symmetric version of the network are listed for comparison. C. Deep Asymmetric Network with CIF AR-10 Dataset W e apply a set of node-wise variant activ ation functions to deep networks, whose performance is then analyized in object recognition using the CIF AR10 dataset [9]. The network for object recognition consists of four con volutional layers and two fully connected dense layers. All the layers utilize max pooling and acti vation functions. The con volution layers utilize 3 × 3 filters. There are 128, 128, 256, and 256 nodes in the con volutional layers and 512 and 10 in the fully connected dense layers. The final layer provides the classification. The activ ation functions in each layer consist of a set of parameter- ized ReLU functions. W e used the parameters shown by the s i 7 0 10 20 30 40 50 60 70 80 90 100 Epochs 0 0.2 0.4 0.6 0.8 1 1.2 1.4 1.6 1.8 2 Loss 0 10 20 30 40 50 60 70 80 90 100 Epochs 0.4 0.6 0.8 1 1.2 1.4 1.6 1.8 Val Loss (a) 0 10 20 30 40 50 60 70 80 90 100 Epochs 0 0.2 0.4 0.6 0.8 1 1.2 1.4 1.6 Loss 0 10 20 30 40 50 60 70 80 90 100 Epochs 0.5 0.6 0.7 0.8 0.9 1 1.1 1.2 1.3 Val Loss (b) Fig. 7. Training of symmetric networks and deep asymmetric network with variant activ ation functions on the CIF AR-10 dataset: (a) using the same learning rate and (b) using a higher learning rate to compensate for the a verage slopes of the activ ation functions. Left: training loss; Right: validation loss; Blue: asymmetric network; Red: symmetric network. values in Fig. 3 and applied the same learning rate that would be used for a symmetric network. Specifically , the learning rate was set to 1e-3 with a decay rate of 1e-6. Adam [29] is used as an optimizer . The network was trained using 50,000 images and 10,000 images were used for testing. Fig 7 illustrates the training process of deep networks with the CIF AR-10 dataset. The losses and validation accuracies shown are for the asymmetric network, which uses the set of node-wise variant acti v ation functions, and for a symmetric network that shares the same architecture but uses the same ReLU activ ation function for all nodes. W e trained both the asymmetric and the symmetric network. W ith the sensitivity parameters less than one, con vergence in some directions is intentionally delayed compared to con ver gence in other directions. The result is that the asymmetric netw ork con ver ges more slowly than the symmetric network as shown in Fig 7(a) and (b). The training delay can be compensated for by considering the average slopes of the activ ation functions. The av erage node slopes with the parameters set shown as in Fig. 3 (b) is approximately 1/3. Therefore, we set the learning rate of the asymmetric network to three times that of the symmetric network; then, the asymmetric network conv erged successfully in approximately the same number of iterations as the symmetric network as sho wn in (c) and (d). After training, the test accuracy was 0.8328 for the symmetric network and 0.8299 for the asymmetric network. Fig. 8 (f) shows how the performance of the asymmetric network deteriorates as nodes are removed from the network. The test accuracy is measured when a given percentage of nodes are removed from last to first in a layer while leaving the remaining layers intact. The test accuracy is av eraged ov er fi ve trainings of the network. It can be seen that the network performance gradually falls as the nodes in each layer are removed from last to first. The gradual decline of performance indicates that the nodes with larger indices are of lesser importance. For comparison, symmetric networks with the same layers and one acti v ation function assigned to all the nodes were trained with either the l 2 or l 1 norms of the weights as re gularization terms. W e e valuated the performance of the symmetric network while remo ving nodes randomly , based on sorting by the l 2 or l 1 norms of the weights [5], [6]. The results are reported in Fig. 8(a) to (c). A symmetric network with the weight correlation as a regularization term is also prepared, from which nodes are remov ed based on the correlation. The result is shown in Fig. 8(d). This network represents the approaches to make the weights of netw orks orthogonal or independent [7], [30], [31], [32]. Lastly , a symmetric network is prepared, from which nodes are remov ed based on the perturbation analysis [16]. The result is shown in Fig. 8(e). The asymmetric network retains its performance better than does the symmetric network when the same number of nodes are removed from each network. For example, when we removed 90% of the nodes in the first layer , the accuracy of the networks becomes 15.10%, 16.85%, 18.21%, 19.91%, 20.34%, and 53.25%, for the random, l 2 , l 1 , correlation, and perturbation analysis, and the proposed method, respectiv ely . This suggests that the asymmetric network learns the impor- tance of features better than is possible by e v aluating the weights in the symmetric network using various measures. The comparison to the symmetric network trained with the correlation regularization shows that importance of the nodes with orthogonal features still hav e to be determined. The com- parison to the perturbation analysis sho ws that the perturbation from the minima does not provide as accurate information on the importance of nodes. The performance improvement of the asymmetric network shows that the importance of nodes learned by the network can be used to determine which nodes to be kept or pruned. The trained asymmetric deep network is pruned by the proposed pruning algorithm. The target accurac y used in Algo- rithm 1 is set to 90% of the training accuracy of the unpruned network. The pruned asymmetric network is retrained using the training set. The ratio of the number of weights is ratio = # of weights after pruning # of weights before pruning (25) and the accurac y of the networks before pruning, after pruning, and after retraining are reported in T able II. W e were able to retrain the pruned asymmetric network without a loss of accu- racy . T able II also compares the accuracy when the sensitivity parameters s i of the acti vation functions are chosen differently from the ones shown in Fig. 3 (a), (b), and (c). The parameters in (a) set the node sensitivities to vary linearly . The parameters in (b) set the node sensitivities to vary close to linearly at smaller indices and limits node to small sensitivities at larger indices. The parameters in (c) set the node sensitivities to one and zero for the small and large indices, respectively , and to vary linearly in the middle. The parameters in (b) yielded the highest accuracy with the smallest number of weights. Thus, we used the parameters in (b) in the rest of our experiments. T able III shows the number of nodes in each layer of the asymmetric network before and after the pruning. Overall, 8 0 0.1 0.2 0.3 0.4 0.5 0.6 0.7 0.8 0.9 1 Pruning Ratio 0.1 0.2 0.3 0.4 0.5 0.6 0.7 0.8 0.9 Accuracy Conv1 Conv2 Conv3 Conv4 Dense (a) 0 0.1 0.2 0.3 0.4 0.5 0.6 0.7 0.8 0.9 1 Pruning Ratio 0.1 0.2 0.3 0.4 0.5 0.6 0.7 0.8 0.9 Accuracy Conv1 Conv2 Conv3 Conv4 Dense (b) 0 0.1 0.2 0.3 0.4 0.5 0.6 0.7 0.8 0.9 1 Pruning Ratio 0.1 0.2 0.3 0.4 0.5 0.6 0.7 0.8 0.9 Accuracy Conv1 Conv2 Conv3 Conv4 Dense (c) 0 0.1 0.2 0.3 0.4 0.5 0.6 0.7 0.8 0.9 1 Pruning Ratio 0.1 0.2 0.3 0.4 0.5 0.6 0.7 0.8 0.9 Accuracy Conv1 Conv2 Conv3 Conv4 Dense (d) 0 0.1 0.2 0.3 0.4 0.5 0.6 0.7 0.8 0.9 1 Pruning Ratio 0.1 0.2 0.3 0.4 0.5 0.6 0.7 0.8 0.9 Accuracy Conv1 Conv2 Conv3 Conv4 Dense (e) 0 0.1 0.2 0.3 0.4 0.5 0.6 0.7 0.8 0.9 1 Pruning Ratio 0.1 0.2 0.3 0.4 0.5 0.6 0.7 0.8 0.9 Accuracy Conv1 Conv2 Conv3 Conv4 Dense (f) Fig. 8. Network performance when nodes are independently pruned: test accuracy with 10,000 images from the CIF AR-10 dataset. Symmetric network with (a) random pruning; (b) l 2 pruning; (c) l 1 pruning; (d) correlation pruning; (e) perturbation analysis, and (f) asymmetric network pruned from last to first nodes. T ABLE II P E RF O R M AN C E S O F P RU N ED A S YM M E T RI C N ET W O R KS W I TH V A R I OU S C H OI C E S O F A C T I V A T I O N F U N C TI O N P A R A ME T E R S A S S HO W N I N F IG . 3 , C N N W I T H C I FAR - 1 0 DA TA S ET . Parameters (a) (b) (c) Ratio (# of weights) 26.48% 18.13% 18.38% Accuracy Before pruning 83.32% 83.34% 83.29% After pruning 75.00% 75.01% 74.97% After retraining 83.18% 83.59% 83.11% all but 18.13% of nodes can be removed from the network without losing accuracy . The ratio of nodes that can be remov ed from the layers is higher in the deeper layers. Because the computational complexity of the deeper layers is higher, pruning the deeper layers contributes more to ward reducing the overall computational complexity . D. LeNet with MNIST Dataset The node-wise v ariant acti vation functions are applied to LeNet [27] and trained using the MNIST dataset. In order to validate the features are sorted in the order of importance, we measure the v alidation loss while removing nodes in the trained netw ork one at a time. Fig. 9 shows the v alidation loss of the baseline symmetric and asymmetric LeNets when a node in a layer is remov ed. The a verage v alidation losses of ten trainings are sho wn. The increases of the loss when T ABLE III C O MP L E X IT Y O F P RU N E D A S Y M ME T R I C N E T WO R K : C N N W IT H C I F A R - 1 0 D A TA SE T # of weights Layer Before After Ratio 1 conv 3584 2165 60.16% 2 conv 147584 70788 47.96% 3 conv 295168 164501 55.73% 4 conv 590080 248248 42.07% 5 dense 3276800 296450 9.05% 6 dense 5120 770 15.04% overall 4318336 782913 18.13 % 2 4 6 8 10 12 14 16 0.5 1 1.5 2 (a) 5 10 15 20 25 30 0.1 0.2 0.3 0.4 0.5 0.6 (b) 20 40 60 80 100 120 0.05 0.1 0.15 0.2 0.25 (c) Fig. 9. V alidation loss when a node in a layer is removed from the network, LeNet with the MNIST dataset: (a) 1st con volutional layer; (b) 2nd con volutional layer; (f) 1st dense layer . Red: baseline symmetric network; Blue: asymmetric network. T ABLE IV C O RR E L A T I O N B E T WE E N T HE L O SS A N D T H E N OD E I ND I C E S : C N N W I T H C I F A R - 1 0 D A TA SE T layer symmetric asymmetric 1st con v . 0.7377 0.9947 2nd con v . 0.7721 0.9874 1st dense 0.7322 0.9920 nodes with smaller indices are removed from the network are larger for the asymmetric network. By contrast, about the same amount of increases occurred by removing of any nodes in the baseline network. The same trends are observed for all the con volutional and dense layers. The correlation between the loss and indices are given in T able IV. The loss occurred by removing a node from the asymmetric network and the node indices show high correlation, which indicates nodes in the deep asymmetric network is sorted in the order of importance. W e compared the complexity and performance of pruned asymmetric networks to the pruning results reported in [5], [22], [33], [25], [34]. An asymmetric network with the same architecture as LeNet-5 [27] was prepared, and the weights are initialized randomly . The network was trained with MNIST dataset, pruned, and then retrained. The ratios of the weights after pruning and the classification errors are reported in T able 9 T ABLE V C O MPA R IS O N TO P RU N IN G M E TH O D S R E P O RTE D W IT H M N IS T D A TAS E T Method Network cf Ratio Error [5] LeNet-5 0.80% 8.24% 0.77% [22] LeNet-5 0.73% (modified) 10.25% 0.76% [33] LeNet-5 0.87% 9.01% 0.71% [25] LeNet-5 N/A con v layers only 8.33% 1.70% [34] LeNet-5 0.94% dense layer only 16.00% 1.65% dense layer only 12.00% 2.01% Proposed LeNet-5 0.81% 6.73% 0.71% V. Our pruning algorithm works with all the layers in LeNet- 5 while achie ving comparable accuracy and yielding smaller networks. E. T ransferr ed VGG and ResNet with CK+ Dataset A network can share its architecture with that of a famous network previously proven to be e xcellent for some other purpose. The network can be initialized using the weights transferred from the famous network and then fine-tuned with a training set prepared for a given application. Famous networks are usually trained for tasks that are more compli- cated than the complexity of a specific task. Hence, although weight transfer is a well-established way to achieve good network performance, the end result can be an e xcessively large and heavy network architecture that is computationally too e xpensive for a giv en task. In this section, we transfer famous networks to asymmetric networks and then prune the asymmetric network to design efficient and compact networks. Since weights of f amous networks are already trained for good performance, we trained the asymmetric network without the correlation regularization. W e transferred VGG [11] and ResNet [12] to asymmetric networks for the purpose of facial expression recognition. The asymmetric networks consist of the same layers as VGG-16 or ResNet-50 followed by an output layer that classifies input facial images into sev en emotions: { anger , contempt, disgust, fear , surprise, happiness, sadness } . The network is trained using the CK+ dataset [13]. W e selected 325 sequences of 118 subjects that are classified as displaying one of the seven emotions. The so-called “apex frames” that occur at the peak of the expression were collected as labeled facial images. The network was trained using ten-fold cross validation. The labeled images are divided into ten folds, nine of which were used for training, and the remaining fold was used for ev aluation. T o transfer weights from a symmetric network to an asym- metric network, node sorting may be required to determine which nodes in the symmetric network should be assigned with smaller indices in the asymmetric network. Ho wev er, node pre-sorting complicates the performance analysis because any performance v ariations may be due to either the pre-sorting or T ABLE VI P E RF O R M AN C E OF P RU N E D A S Y MM E T R IC N E TW O R K T R A N SF E R RE D F RO M VG G - 16 A N D R E S N ET - 50 O N CK + D AT A S E T Parameters V GG-16 ResNet-50 Ratio 24.48% 16.82% Accuracy Before pruning 96.30% 96.61% After pruning 86.70% 86.95% After retraining 97.51% 97.23% T ABLE VII C O MP L E X IT Y O F P RU N E D A S Y M ME T R I C N E T WO R K T R A N SF E R R ED F RO M V GG - 1 6 W I T H C K + D A TAS E T . # of weights Layer Before After Ratio 1 con v 1792 1436 81.16% 2 con v 36928 24614 66.65% 3 con v 73856 48952 66.28 % 4 con v 147584 98241 33.17% 5 con v 295168 201990 68.43% 6 con v 590080 395990 67.11% 7 con v 590080 335860 56.92% 8 con v 1180160 564910 47.87% 9 con v 2359808 845684 35.84% 10 conv 2359808 532610 22.57% 11 conv 2359808 498460 21.12% 12 conv 2359808 351360 14.89% 13 conv 2359808 189430 8.03% 14 dense 2097152 27152 1.29% 15 dense 7168 392 5.48% overall 16819008 4117082 24.48% to the feature sorting of the asymmetric network. Hence, we transferred the weights without any pre-sorting of the node indices. After the weight transfer , the asymmetric network is trained with a training set. Then, the trained asymmetric network is pruned using Algorithm 1. After the pruning, we retrain the pruned networks with the training set. T able VI sho ws the pruning results of the asymmetric network transferred from VGG-16 and ResNet-50. The target accuracy was set to 90% of the training accuracy before pruning. W e were able to prune the VGG and ResNet trans- ferred asymmetric networks do wn to 24.48% and 16.82%, respectiv ely , without loss of accuracy . The layer-wise pruning ratios are reported in T able VII and VIII for the VGG-16 and ResNet-50 transferred asymmetric netw orks, respecti vely . It is interesting to note that all the nodes in the 44, 45, 48, and 49th layers of ResNet-50 were remov ed during pruning. ResNet has bypass paths that enables the network to learn the error instead of the input itself. The remov al of all the nodes in these con volutional layers changes the residual block operations to simple bypasses. Hence, our pruning procedure changes the network architecture from residual blocks to con volutional layers with 1 × 1 filters. F . T ransferr ed CNN with NTU RGB+D Action Recognition Dataset W e apply the asymmetric network to action recognition using the NTU RGB+D action recognition dataset [10]. The NTU RGB+D action recognition dataset consists of 56,880 video sequences of 60 types of actions of 40 people captured from three camera views. The performance of the netw ork 10 T ABLE VIII C O MP L E X IT Y O F P RU N E D A S Y M ME T R I C N E T WO R K T R A N SF E R R ED F RO M R E S N E T - 5 0 W I T H C K + D A TAS E T . # of weights Layer Before After Ratio 1 con v 9472 7948 83.91% 2 con v 4160 2481 59.63% 3 con v 36928 2052 5.56% 4 con v 16640 12979 78.00% 5 con v 16640 16640 100.00% 6 con v 16448 12876 78.28% 7 con v 36928 19783 53.57% 8 con v 16640 11443 68.77% 9 con v 16448 9535 57.97% 10 conv 36928 11985 32.46% 11 conv 16640 8346 50.15% 12 conv 32896 24004 72.97% 13 conv 147584 66100 44.79% 14 conv 66048 38502 58.29% 15 conv 131584 131584 100.00% 16 conv 65664 40784 62.11% 17 conv 147584 57492 38.96% 18 conv 66048 40550 61.39% 19 conv 65664 33807 51.48% 20 conv 147584 37026 25.09% 21 conv 66048 24422 36.98% 22 conv 65664 25291 38.52% 23 conv 147584 26843 18.19% 24 conv 66048 21862 33.10% 25 conv 131328 59098 45.00% 26 conv 590080 95373 16.16% 27 conv 263168 67994 25.84% 28 conv 525312 525312 100.00% 29 conv 262400 13120 5.00% 30 conv 590080 25135 4.26% 31 conv 263168 23347 8.87% 32 conv 262400 7893 3.01% 33 conv 590080 4442 0.75% 34 conv 263168 7578 2.88% 35 conv 262400 6560 2.50% 36 conv 590080 8136 1.38% 37 conv 263168 15462 5.88% 38 conv 262400 19680 7.50% 39 conv 590080 26627 4.51% 40 conv 263168 16794 6.38% 41 conv 262400 9225 3.52% 42 conv 590080 2109 0.36% 43 conv 263168 3686 1.40% 44 conv 524800 0 0.00% 45 conv 2359808 0 0.00% 46 conv 1050624 2048 0.19% 47 conv 2099200 2099200 100.00% 48 conv 1049088 0 0.00% 49 conv 2359808 0 0.00% 50 conv 1050624 1050624 100.00% 51 conv 1049088 31555 3.01% 52 conv 2359808 3606 0.15% 53 conv 1050624 7373 0.70% 54 dense 8388608 543950 6.48% 55 dense 7168 465 6.48% overall 31877248 5360724 16.82% is ev aluated using the cross-subject protocol. The video se- quences of 20 people are used for the training and those of the other 20 people are used for the test. The network for action recognition is from [10]. The net- work uses two stream CNN, with three con volutional layers in each stream, follo wed by four dense layers. W e initialized the asymmetric network with the same weights provided with the code. The activ ation functions in each layer are assigned with a set of parameterized ReLU functions. T o assign the T ABLE IX C O MP L E X IT Y O F P RU N E D A S Y M ME T R I C N E T WO R K : D E E P N E T WO R K I N [ 1 0] W I T H N T U R G B + D A CT I O N R E C O GN I T I ON D AT A S E T . # of weights Layer Before After Ratio transform 750 750 100.00% 1 con v 1728 1728 100.00% 3 con v 73728 70272 95.31% 5 con v 294912 126270 42.82% 2 conv 1728 1728 100.00 % 4 conv 73728 47808 64.84% 6 conv 294912 57519 19.50% 7 dense 524544 157645 30.05% 8 dense 32896 26368 80.16% 9 dense 12384 12384 100.00% 10 dense 5820 5820 100.00% overall 1317880 509042 38.63 % T ABLE X P E RF O R M AN C E S O F P RU N ED A S YM M E T RI C N ET W O R K , D E EP N E T WO R K I N [ 1 0 ] W I T H NT U R G B+ D A C T IO N R E CO G N I TI O N D A TA S ET . Ratio (# of weights) 38.63% Accuracy Before pruning 80.66% After pruning 66.75% After retraining 80.24% parameter s i to a node, node sorting may be required to determine which nodes in the symmetric network should be assigned with smaller indices in the asymmetric network. W e can sort the nodes of a symmetric network using various measure, for example, by the l 2 norm of the weights, and then assign the node indices based on the sorted results. Howe ver , such node pre-sorting complicates the performance analysis because any performance variations may be due to either the pre-sorting or to the feature sorting of the asymmetric netw ork. Hence, we assign the parameters without any pre-sorting of the node indices. After the parameter assignment, the asymmetric network is trained with NTU RGB+D action recognition dataset. Since the initial weights are already trained for good performance, we trained the asymmetric network without the correlation regularization. The trained asymmetric deep network is pruned by the proposed pruning algorithm. The target accurac y used in Algo- rithm 1 is set to 90% of the training accuracy of the unpruned network. The pruned asymmetric network is retrained using the training set. T able IX shows the number of nodes in each layer of the asymmetric network before and after the pruning. Overall, all b ut 38.63% of nodes can be removed from the network without losing accuracy . Accuracy of the network at each step of pruning is giv en in T able X. G. T ransferr ed VGG and ResNet with CIF AR-10 Dataset W e compared the complexity and performance of the pruned asymmetric networks with the pruning results reported in [21]. VGG-16 and ResNet-56 are transferred to asymmetric net- works, trained on the CIF AR-10 dataset, pruned, and retrained. The weight ratios after pruning and the classification errors are reported in T able XI. Our pruning algorithm works with all the layers in ResNet. The proposed method reports comparable accuracy and yields smaller networks. 11 T ABLE XI C O MPA R IS O N TO P RU N IN G M E TH O D S R E P O RTE D W IT H C I F A R - 1 0 D AT A S E T Method Network cf Ratio Error [21] VGG-16 6.75% 36.0% 6.60% Proposed VGG-16 6.67% 29.6% 6.17% [21] ResNet-56 6.96% 1st layer of residual blocks 86.3% 6.94% Proposed ResNet-56 6.82% 26.2% 6.75% T ABLE XII C O MPA R IS O N TO P RU N IN G M E TH O D S R E P O RTE D W IT H I M AG E N E T D AT A S E T Method Network cf Ratio Accuracy [35] ResNet-50 72.88% 66.3% 72.04% 48.4% 71.01% 33.9% 68.42% [36] ResNet-50 72.88% 93.5% 73.56% 84.9% 72.89% 68.0% 70.84% [37] ResNet-50 76.01% WM 48.5% 73.20% WM+ 48.5% 72.89% DCP 48.5% 70.84% [38] ResNet-50 76.01% 67.3% 74.87% [39] ResNet-50 75.30% 64.0% 72.30% Proposed ResNet-50 75.06% 47.0% 74.97% 39.3% 74.56% H. T ransferr ed ResNet with ImageNet W e also compared the complexity and performance of the pruned asymmetric networks with the pruning results reported in [35], [36], [37], [38], [39]. ResNet-50 is transferred to asym- metric networks, trained on the ImageNet dataset, pruned, and retrained. The weight ratios after pruning and the classification errors are reported in T able XII. Our pruning algorithm reports comparable accuracy and yields smaller networks. V . C O N C L U S I O N By assigning nodes unequal sensiti vities through a set of node-wise variant activ ation functions, the resulting asymmet- ric networks not only learn the features of inputs b ut also the importance of those features. W e v alidated the feature- sorting property of asymmetric networks through experiments using shallow , deep, and transferred asymmetric networks. Asymmetric netw orks can be used to learn and represent inputs accurately and efficiently with a small number of features. R E F E R E N C E S [1] D. E. Rumelhart, G. E. Hinton, and R. J. W illiams, “Learning represen- tations by back-propagating errors, ” nature , vol. 323, no. 6088, p. 533, 1986. [2] S. Haykin, “Neural netw orks, a comprehensiv e foundation, ” Macmilan, T ech. Rep., 1994. [3] Y . Cheng, D. W ang, P . Zhou, and T . Zhang, “ A survey of model compression and acceleration for deep neural networks, ” arXiv pr eprint arXiv:1710.09282 , 2017. [4] R. Reed, “Pruning algorithms-a survey , ” IEEE transactions on Neural Networks , v ol. 4, no. 5, pp. 740–747, 1993. [5] S. Han, J. Pool, J. T ran, and W . Dally , “Learning both weights and con- nections for efficient neural network, ” in Advances in neur al information pr ocessing systems , 2015, pp. 1135–1143. [6] M. Ishikawa, “Structural learning with forgetting, ” Neural networks , vol. 9, no. 3, pp. 509–521, 1996. [7] P . Rodr ´ ıguez, J. Gonz ` alez, G. Cucurull, J. M. Gonfaus, and X. Roca, “Regularizing cnns with locally constrained decorrelations. arxiv preprint, ” arXiv preprint , 2016. [8] Y . LeCun, L. Bottou, Y . Bengio, and P . Haf fner, “Gradient-based learning applied to document recognition, ” Proceedings of the IEEE , vol. 86, no. 11, pp. 2278–2324, 1998. [9] A. Krizhevsk y and G. Hinton, “Learning multiple layers of features from tiny images, ” 2009. [10] Y . Du, Y . Fu, and L. W ang, “Skeleton based action recognition with con volutional neural network, ” in P attern Recognition (ACPR), 2015 3r d IAPR Asian Confer ence on . IEEE, 2015, pp. 579–583. [11] K. Simonyan and A. Zisserman, “V ery deep con volutional networks for large-scale image recognition, ” arXiv preprint , 2014. [12] K. He, X. Zhang, S. Ren, and J. Sun, “Deep residual learning for image recognition, ” in Proceedings of the IEEE conference on computer vision and pattern reco gnition , 2016, pp. 770–778. [13] P . Lucey , J. F . Cohn, T . Kanade, J. Saragih, Z. Ambadar , and I. Matthe ws, “The extended cohn-kanade dataset (ck+): A complete dataset for action unit and emotion-specified e xpression, ” in Computer V ision and P attern Recognition W orkshops (CVPRW), 2010 IEEE Computer Society Confer ence on . IEEE, 2010, pp. 94–101. [14] D. P . Bertsekas, Nonlinear progr amming . Athena scientific Belmont, 1999. [15] P . Baldi and K. Hornik, “Neural networks and principal component anal- ysis: Learning from examples without local minima, ” Neural networks , vol. 2, no. 1, pp. 53–58, 1989. [16] Y . LeCun, J. S. Denker , and S. A. Solla, “Optimal brain damage, ” in Advances in neur al information pr ocessing systems , 1990, pp. 598–605. [17] B. Hassibi and D. G. Stork, “Second order deri vati ves for network pruning: Optimal brain surgeon, ” in Advances in neural information pr ocessing systems , 1993, pp. 164–171. [18] M. C. Mozer and P . Smolensky , “Skeletonization: A technique for trimming the fat from a netw ork via relev ance assessment, ” in Advances in neur al information pr ocessing systems , 1989, pp. 107–115. [19] E. Karmin, “ A simple procedure for pruning back-propagation trained networks, ” IEEE T ransactions on Neural Networks , v ol. 1, pp. 239–242, 1990. [20] M. D. Collins and P . Kohli, “Memory bounded deep conv olutional networks, ” arXiv pr eprint arXiv:1412.1442 , 2014. [21] H. Li, A. Kadav , I. Durdanovic, H. Samet, and H. P . Graf, “Pruning filters for efficient convnets, ” arXiv pr eprint arXiv:1608.08710 , 2016. [22] H. Zhou, J. M. Alv arez, and F . Porikli, “Less is more: T o wards compact cnns, ” in Eur opean Conference on Computer V ision . Springer , 2016, pp. 662–677. [23] S. J. Hanson and L. Y . Pratt, “Comparing biases for minimal network construction with back-propagation, ” in Advances in neural information pr ocessing systems , 1989, pp. 177–185. [24] Y . Chauvin, “ A back-propagation algorithm with optimal use of hidden units, ” in Advances in neural information pr ocessing systems , 1989, pp. 519–526. [25] V . Lebedev and V . Lempitsky , “Fast con vnets using group-wise brain damage, ” in Computer V ision and P attern Recognition (CVPR), 2016 IEEE Confer ence on . IEEE, 2016, pp. 2554–2564. [26] S. Han, H. Mao, and W . J. Dally , “Deep compression: Compressing deep neural networks with pruning, trained quantization and huffman coding, ” arXiv preprint , 2015. [27] A. Krizhe vsky , I. Sutskev er , and G. E. Hinton, “Imagenet classification with deep con volutional neural networks, ” in Advances in neural infor- mation pr ocessing systems , 2012, pp. 1097–1105. [28] J. Deng, W . Dong, R. Socher, L.-J. Li, K. Li, and L. Fei-Fei, “Imagenet: A lar ge-scale hierarchical image database, ” in 2009 IEEE conference on computer vision and pattern recognition . Ieee, 2009, pp. 248–255. [29] D. P . Kingma and J. Ba, “ Adam: A method for stochastic optimization. arxiv . org, ” 2014. [30] L. Huang, X. Liu, B. Lang, A. W . Y u, Y . W ang, and B. Li, “Orthogonal weight normalization: Solution to optimization over multiple dependent stiefel manifolds in deep neural networks, ” in Thirty-Second AAAI Confer ence on Artificial Intelligence , 2018. 12 [31] N. Bansal, X. Chen, and Z. W ang, “Can we gain more from or- thogonality regularizations in training deep cnns?” arXiv preprint arXiv:1810.09102 , 2018. [32] X. Zhu, W . Zhou, and H. Li, “Improving deep neural network sparsity through decorrelation regularization. ” in IJCAI , 2018, pp. 3264–3270. [33] Z. Y ang, M. Moczulski, M. Denil, N. de Freitas, A. Smola, L. Song, and Z. W ang, “Deep fried convnets, ” in Proceedings of the IEEE International Confer ence on Computer V ision , 2015, pp. 1476–1483. [34] S. Sriniv as and R. V . Babu, “Data-free parameter pruning for deep neural networks, ” arXiv pr eprint arXiv:1507.06149 , 2015. [35] J.-H. Luo, J. Wu, and W . Lin, “Thinet: A filter level pruning method for deep neural network compression, ” in Pr oceedings of the IEEE international confer ence on computer vision , 2017, pp. 5058–5066. [36] J.-H. Luo and J. Wu, “ An entropy-based pruning method for cnn compression, ” arXiv preprint , 2017. [37] Z. Zhuang, M. T an, B. Zhuang, J. Liu, Y . Guo, Q. Wu, J. Huang, and J. Zhu, “Discrimination-aware channel pruning for deep neural networks, ” in Advances in Neural Information Pr ocessing Systems , 2018, pp. 875–886. [38] X. Xu, M. S. Park, and C. Brick, “Hybrid pruning: Thinner sparse networks for fast inference on edge de vices, ” arXiv pr eprint arXiv:1811.00482 , 2018. [39] Y . He, X. Zhang, and J. Sun, “Channel pruning for accelerating very deep neural networks, ” in Pr oceedings of the IEEE International Confer ence on Computer V ision , 2017, pp. 1389–1397. Jinhyeok Jang received a B.S. degree in 2014 and an M.S. degree in 2016 from the School of Electrical and Computer Engineering of the Ulsan National Institute of Science and T echnology , Ulsan, South Korea. He currently works at the Electronics and T elecommunications Research Institute (ETRI), Daejeon, South K orea. His research interests include image processing, blur estimation, human facial recognition, and human action recognition. Hyunjoong Cho received a B. S. degree in 2015 and an M.S. degree in 2017 from the Ulsan National Institute of Science and T echnology , Ulsan, South K orea, where he is currently pursuing a doctors degree in electrical and computer engineering. His research interests include image processing, human perception, and human recognition. Jaehong Kim receiv ed his Ph.D. degree in computer engineering from Kyungpook National Univ ersity , Daegu, Rep. of Korea, in 1996. He has worked as a researcher at ETRI since 2001. His research interests include eldercare robotics and social HRI framew orks. Jaeyeon Lee recei ved his Ph.D. degree from T okai Univ ersity , Japan, in 1996. Since 1986, he has worked as a research scientist at the Electronics and T elecommunications Research Institute, Daejeon, Rep. of K orea. His research interests include robotics, pattern recognition, computer vision, and biometric security Seungjoon Y ang (S’99-M’00) received a B.S. degree from Seoul National Univ ersity , Seoul, K orea in 1990 and M.S. and Ph.D. degrees from the Univ ersity of W isconsin-Madison in 1993 and 2000, respectiv ely , all in electrical engineering. He worked at the Digital Media R&D Center at Samsung Electronics Co., Ltd. from September 2000 to August 2008 and is currently with the School of Electrical and Computer Engineering at the Ulsan National Institute of Science and T echnology in Ulsan, Korea. His research interests include image processing, estimation theory , and multi-rate systems. Professor Y ang recei ved the Samsung A ward for the Best T echnology Achiev ement of the Y ear in 2008 for his work on the premium digital television platform project.
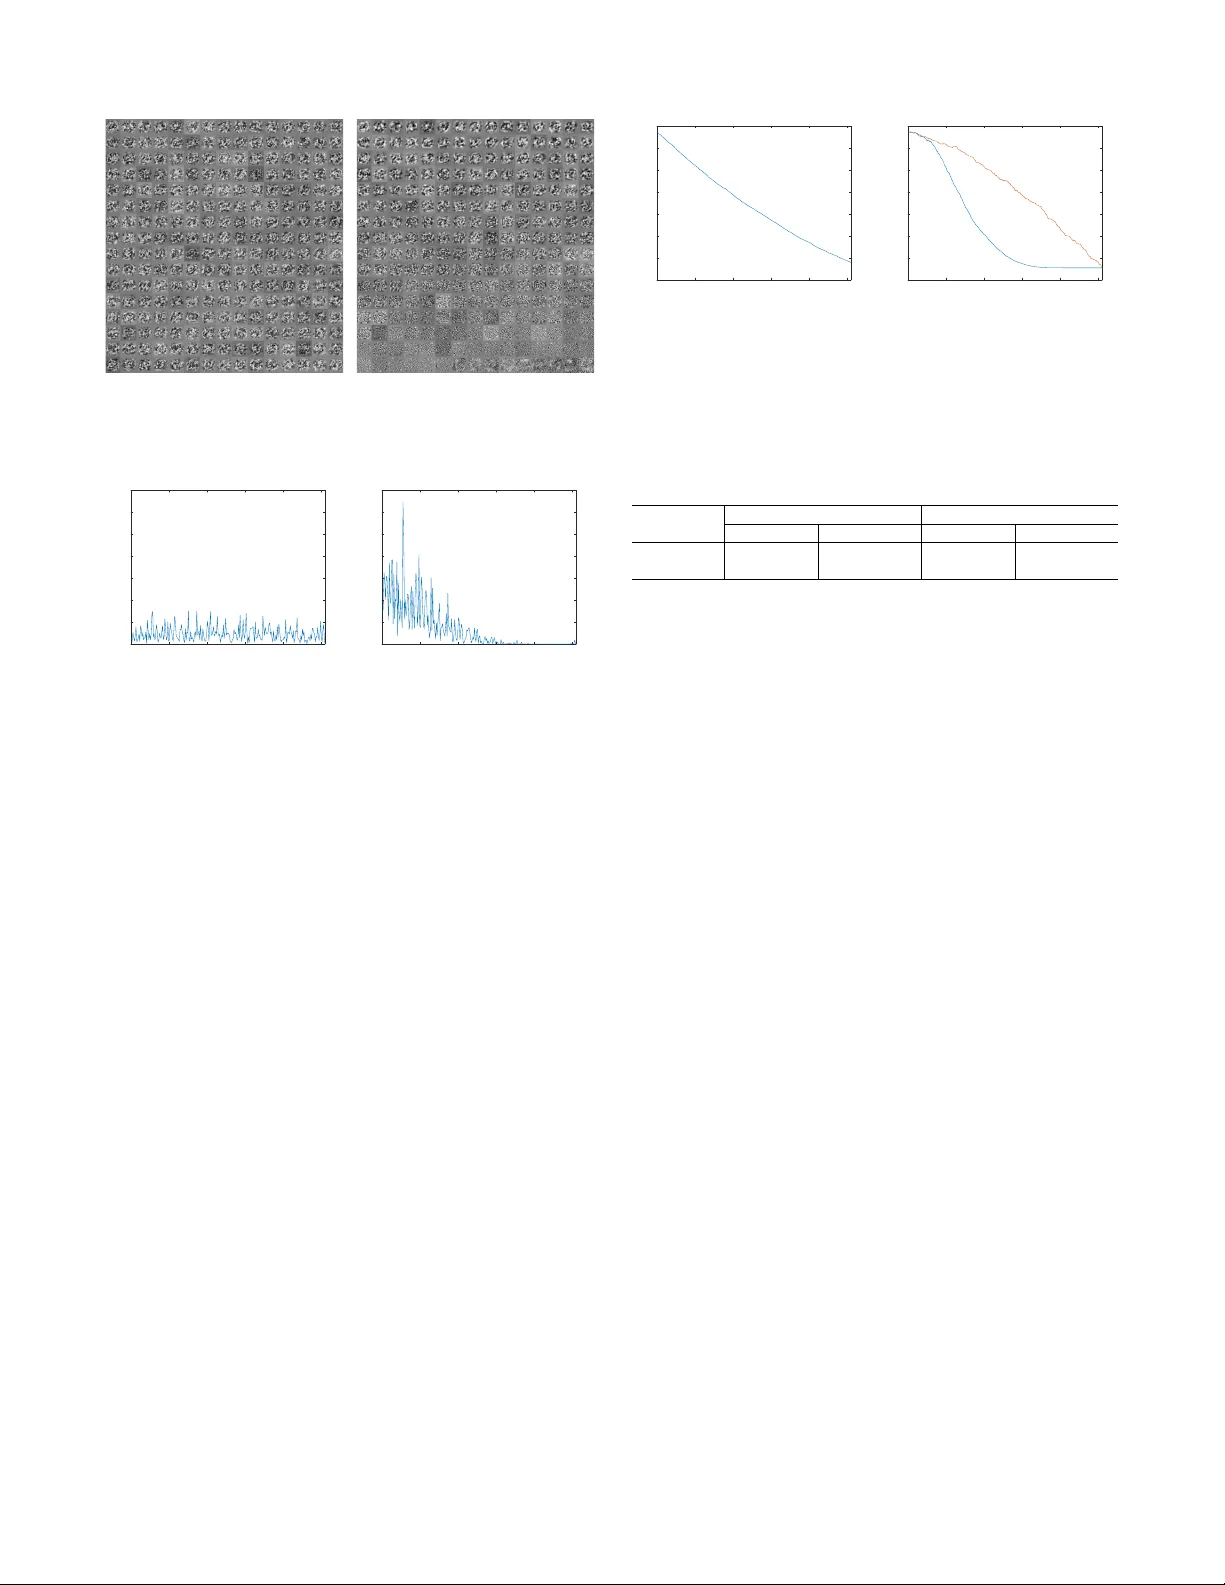
Original Paper
Loading high-quality paper...
Comments & Academic Discussion
Loading comments...
Leave a Comment